

Evidence of Insulin-Sensitizing and Mimetic Activity of the Sesquiterpene Quinone Avarone, a Protein Tyrosine Phosphatase 1B and Aldose Reductase Dual Targeting Agent from the Marine Sponge Dysidea avara

 , , , ,
 ,
,  ,
,  and
and 
Abstract
1. Introduction
2. Materials and Methods
2.1. Materials
2.2. Isolation of Sesquiterpenes 1–4 from the Sponge D. avara
2.3. Enzymes Expression and Purification
2.4. Determination of Enzymatic Activity
2.5. Determination of IC50 Values
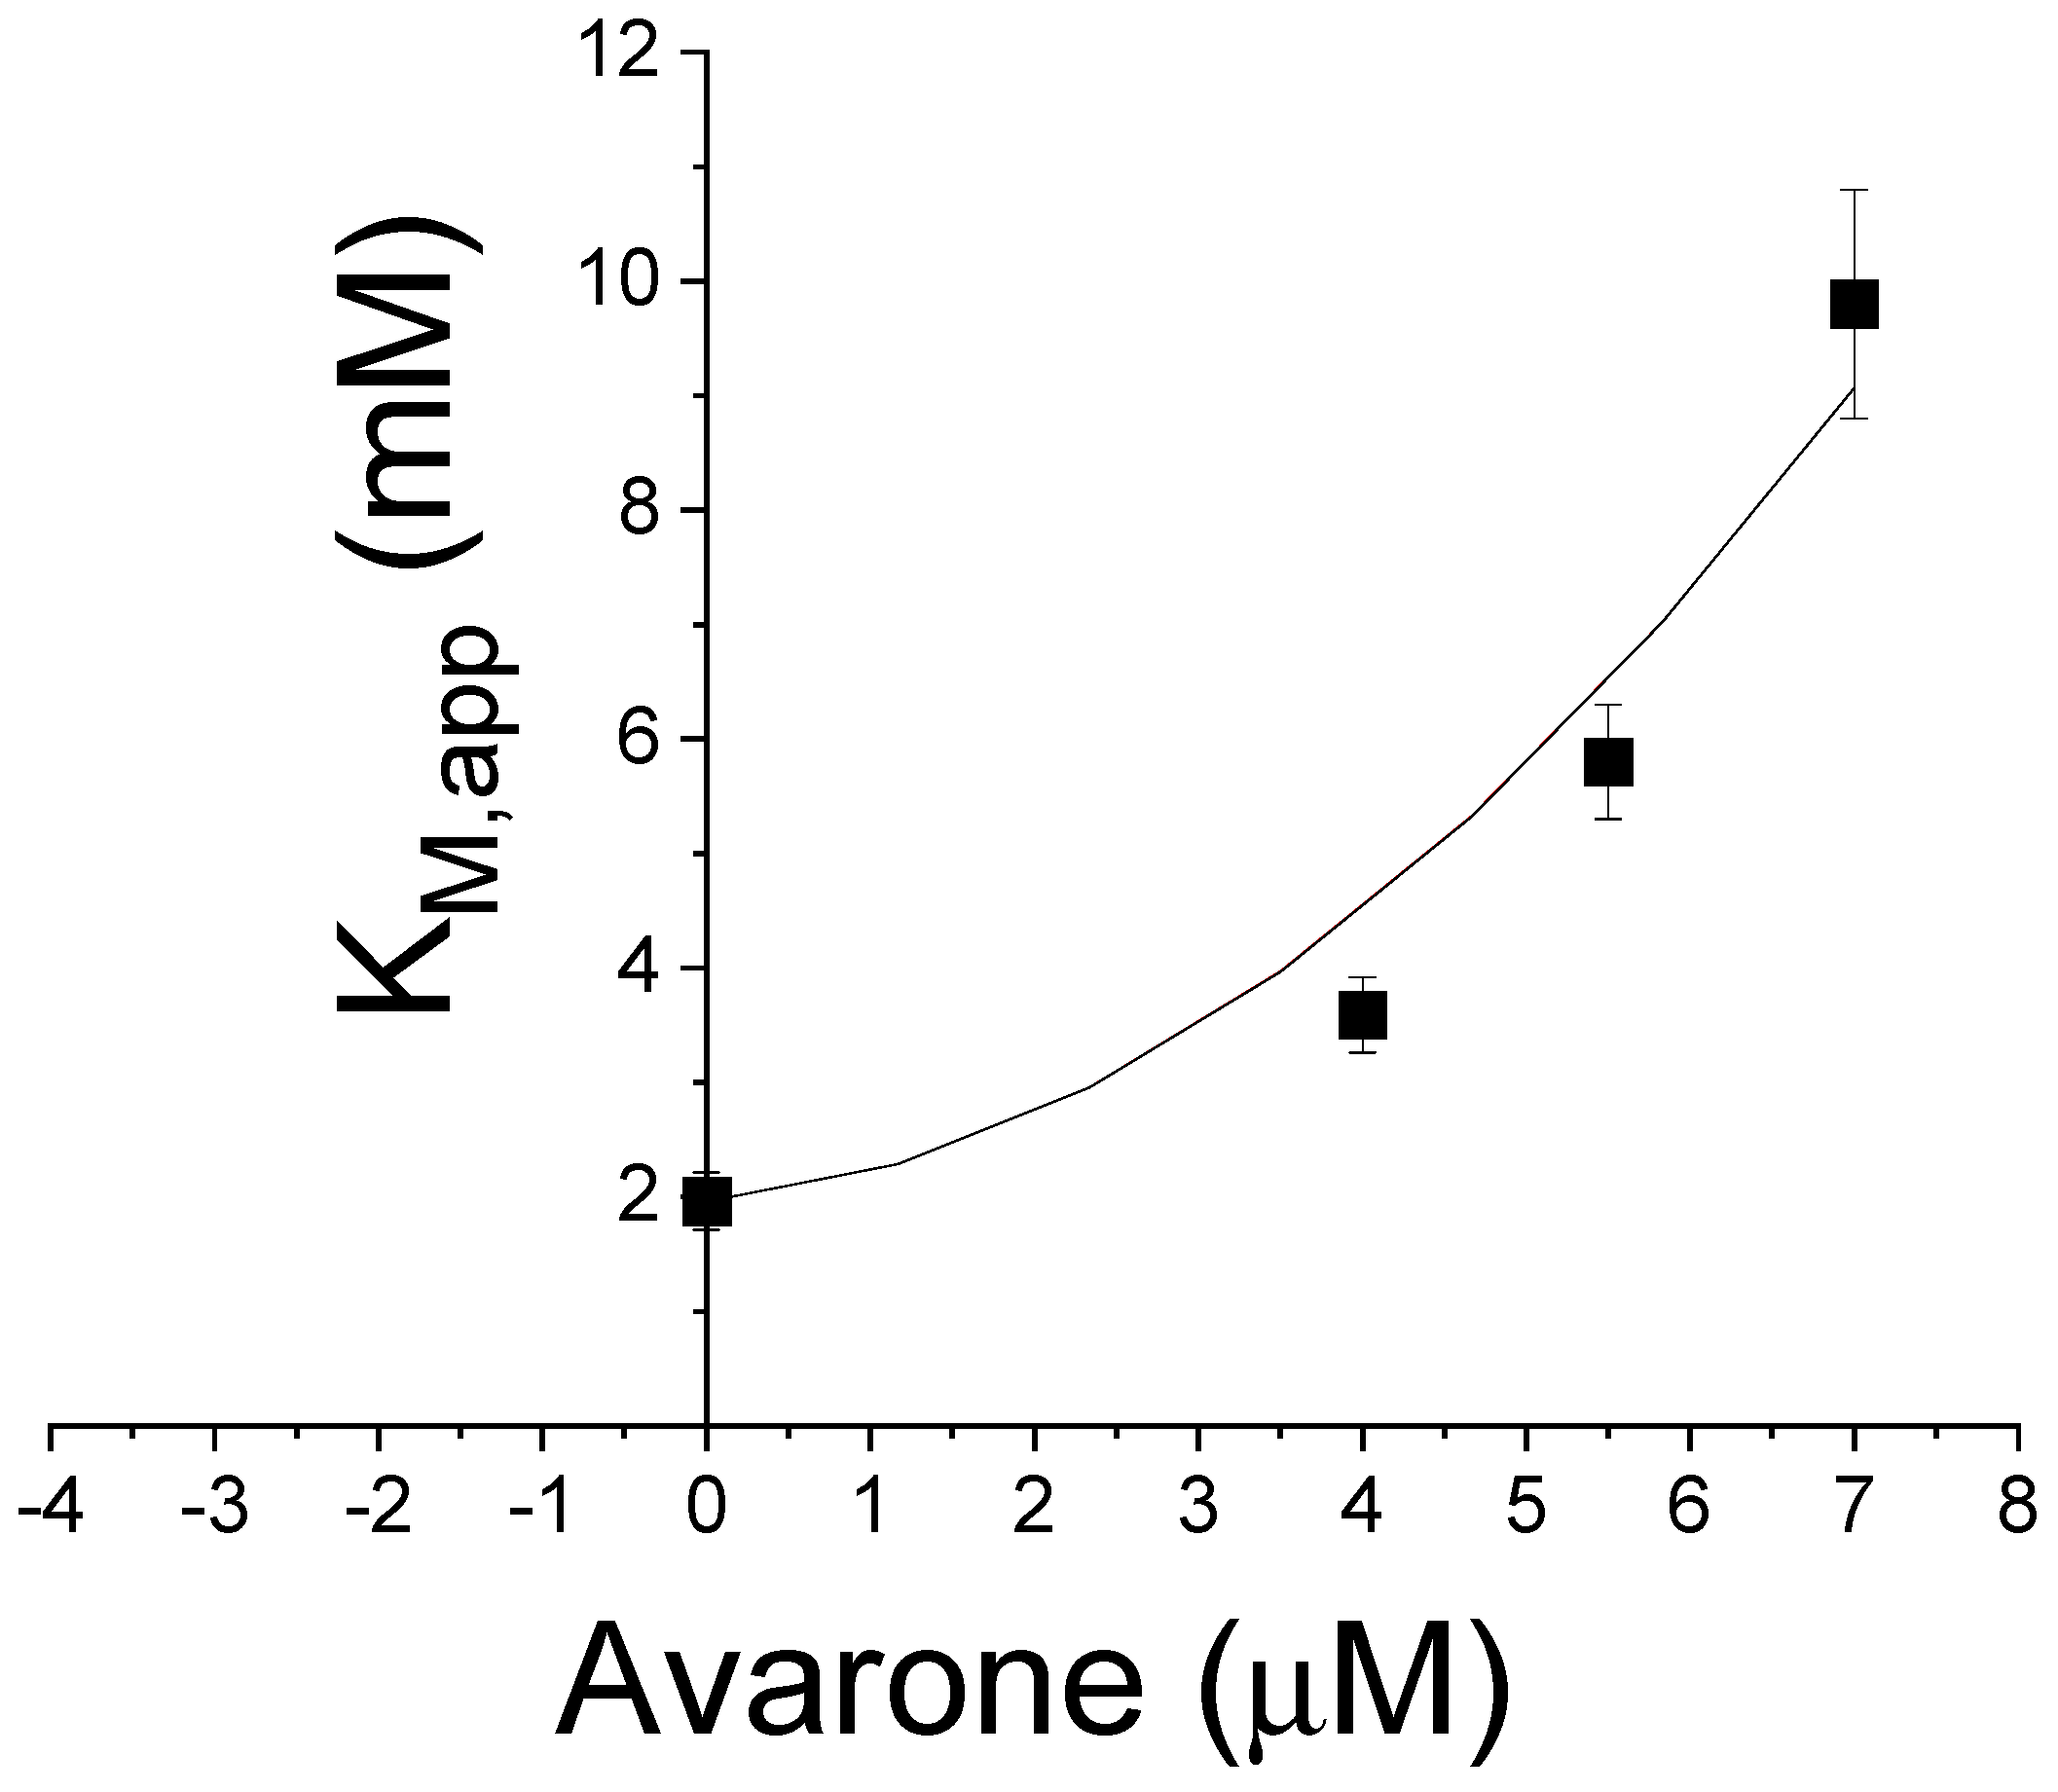
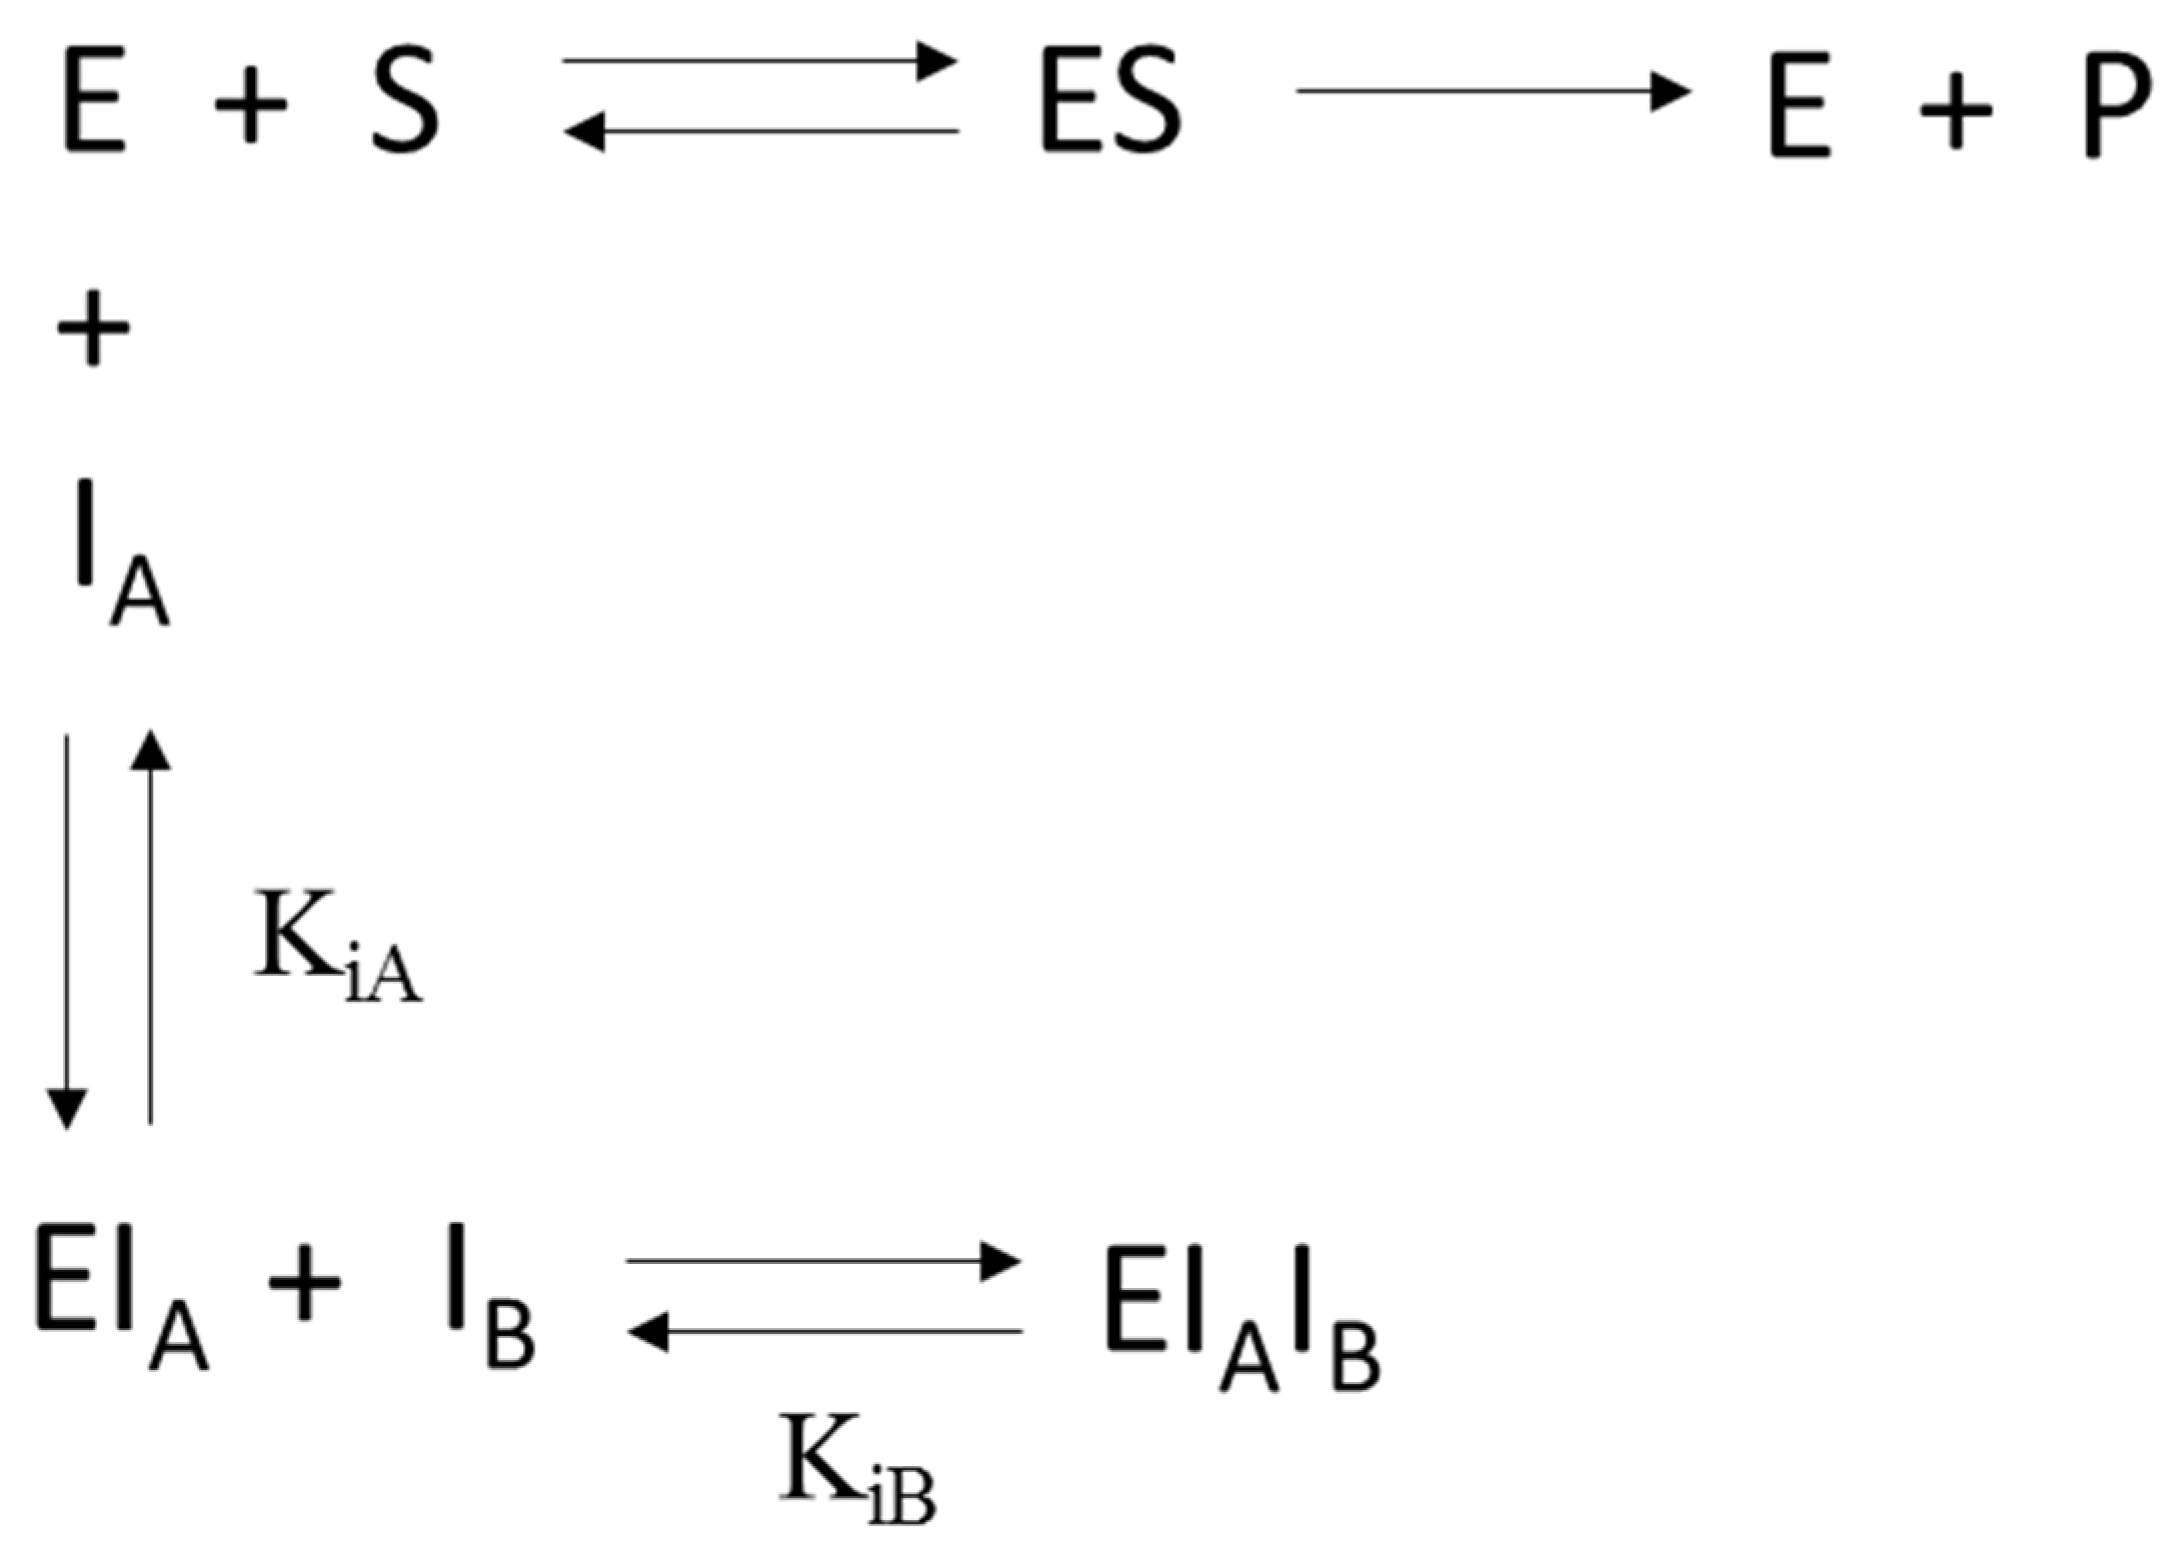
2.6. Kinetic Analyses
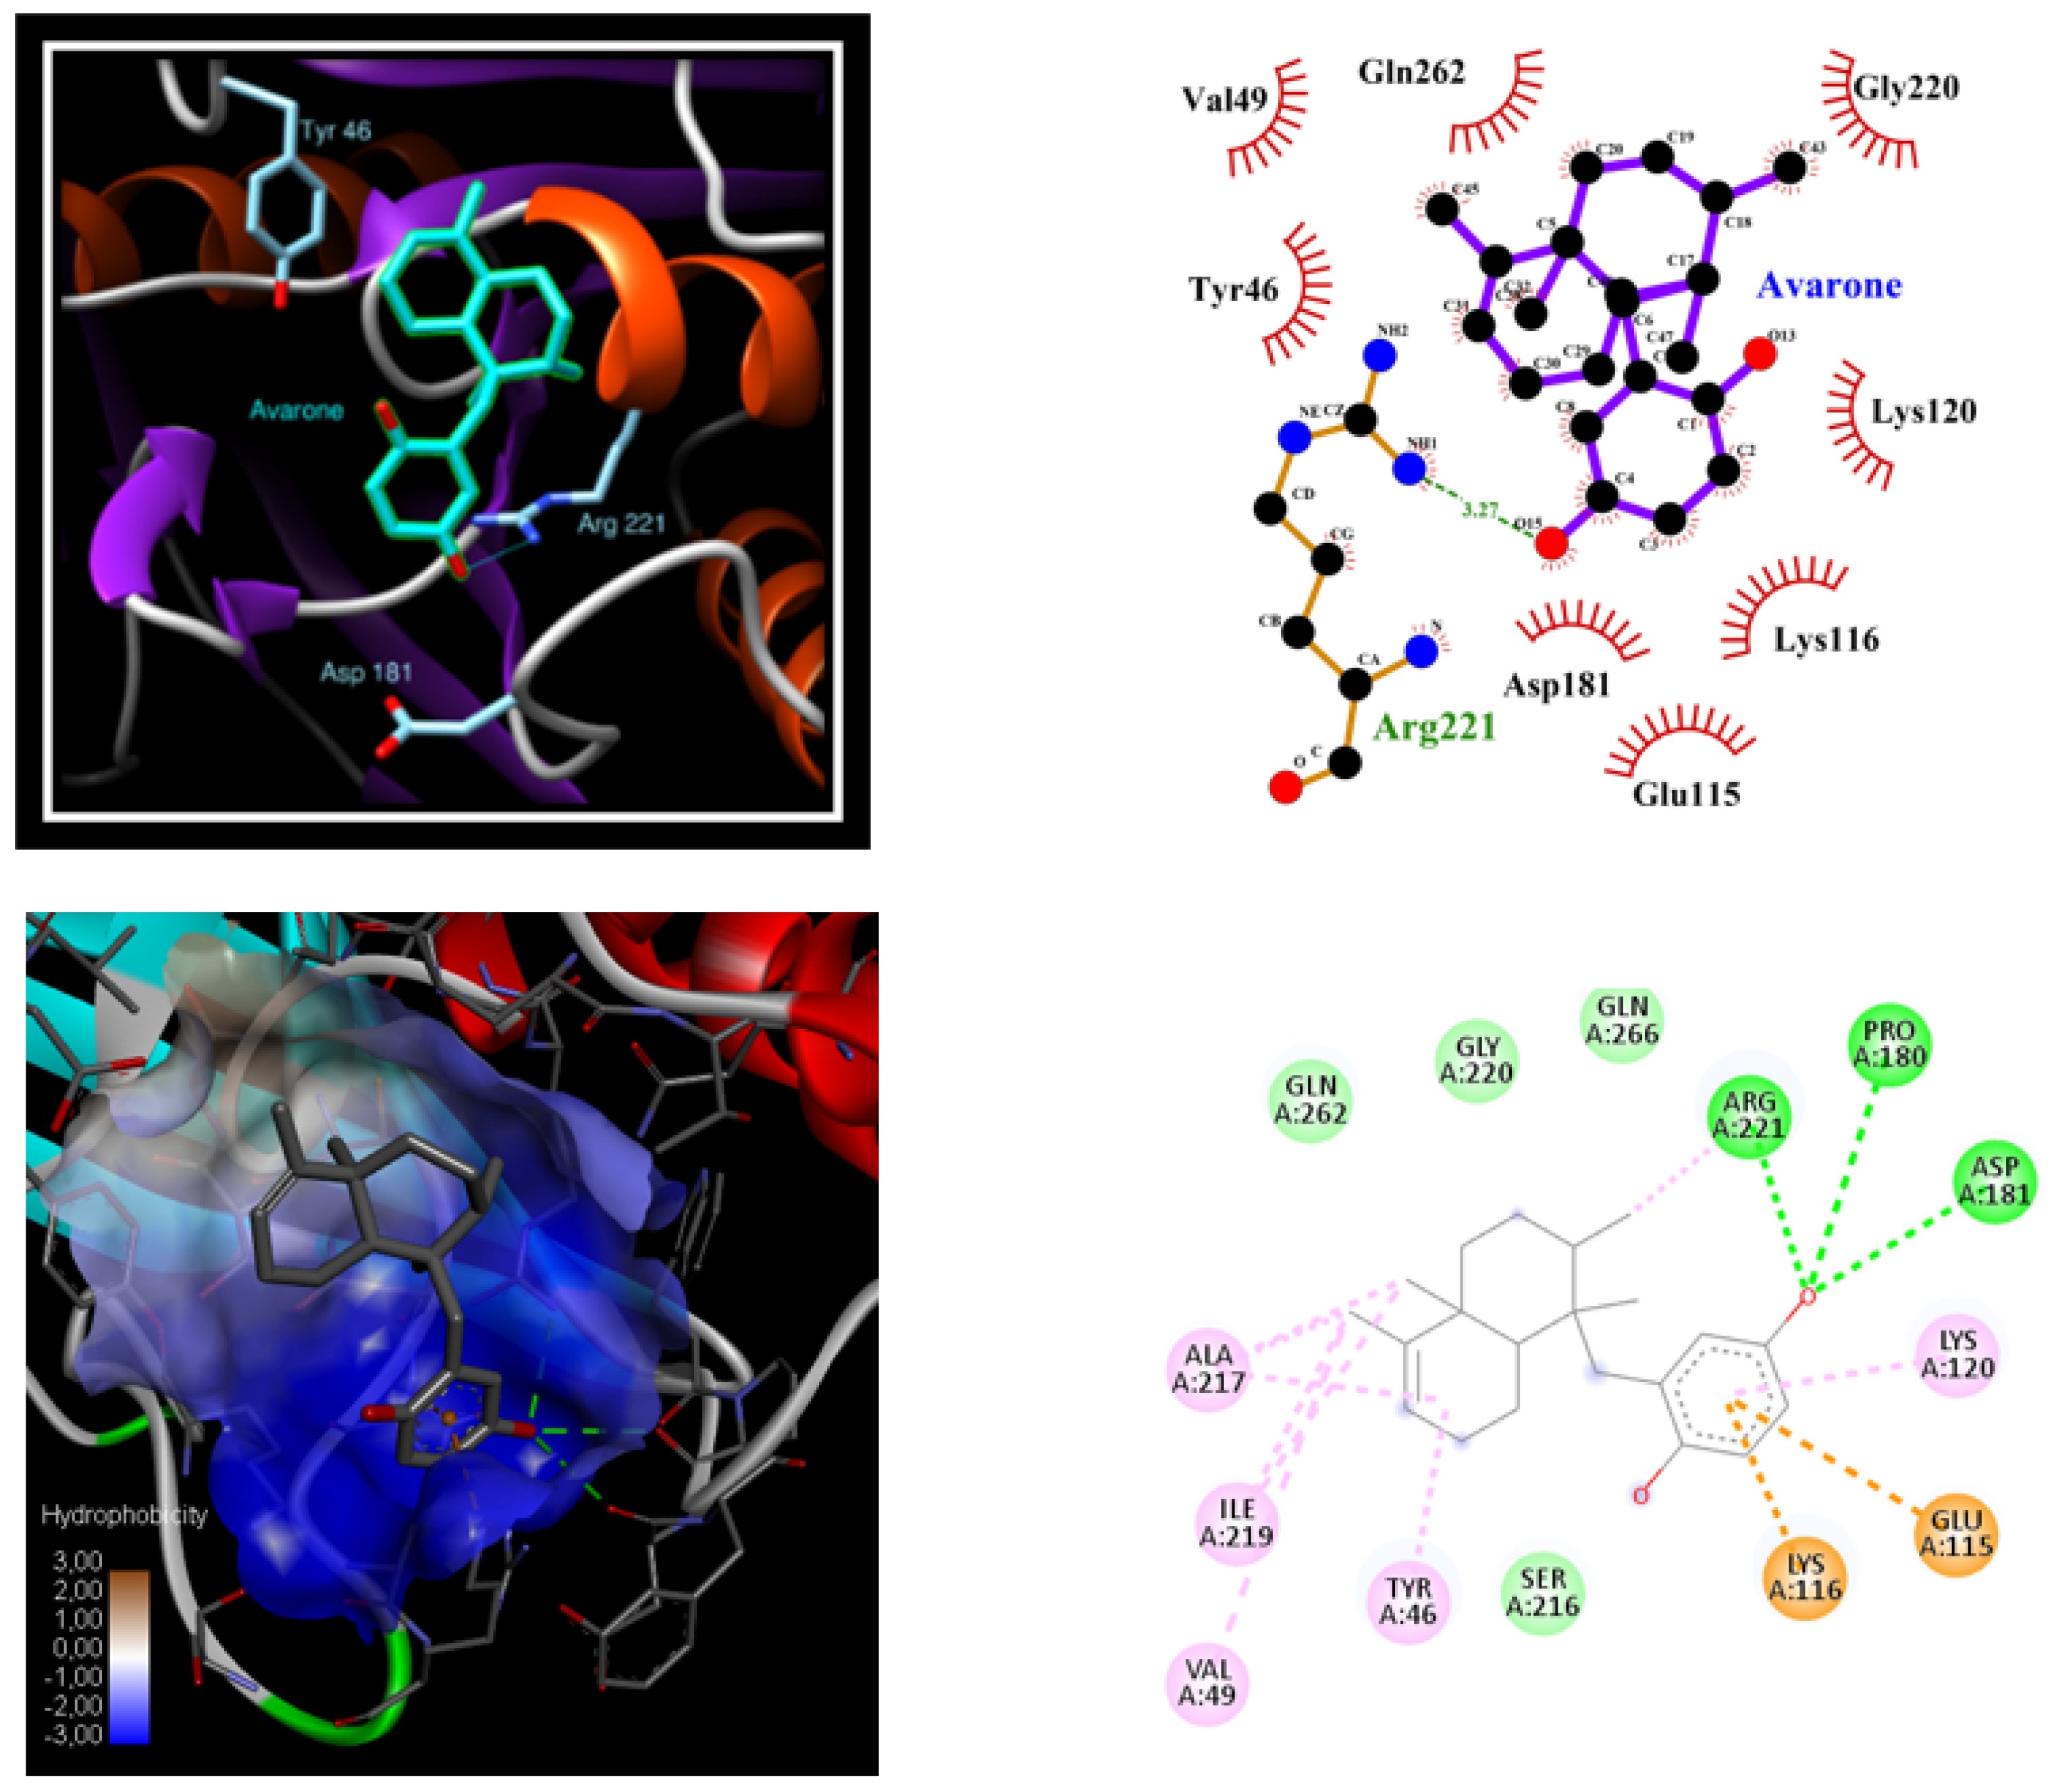
2.7. Molecular Docking
2.8. Cell Cultures
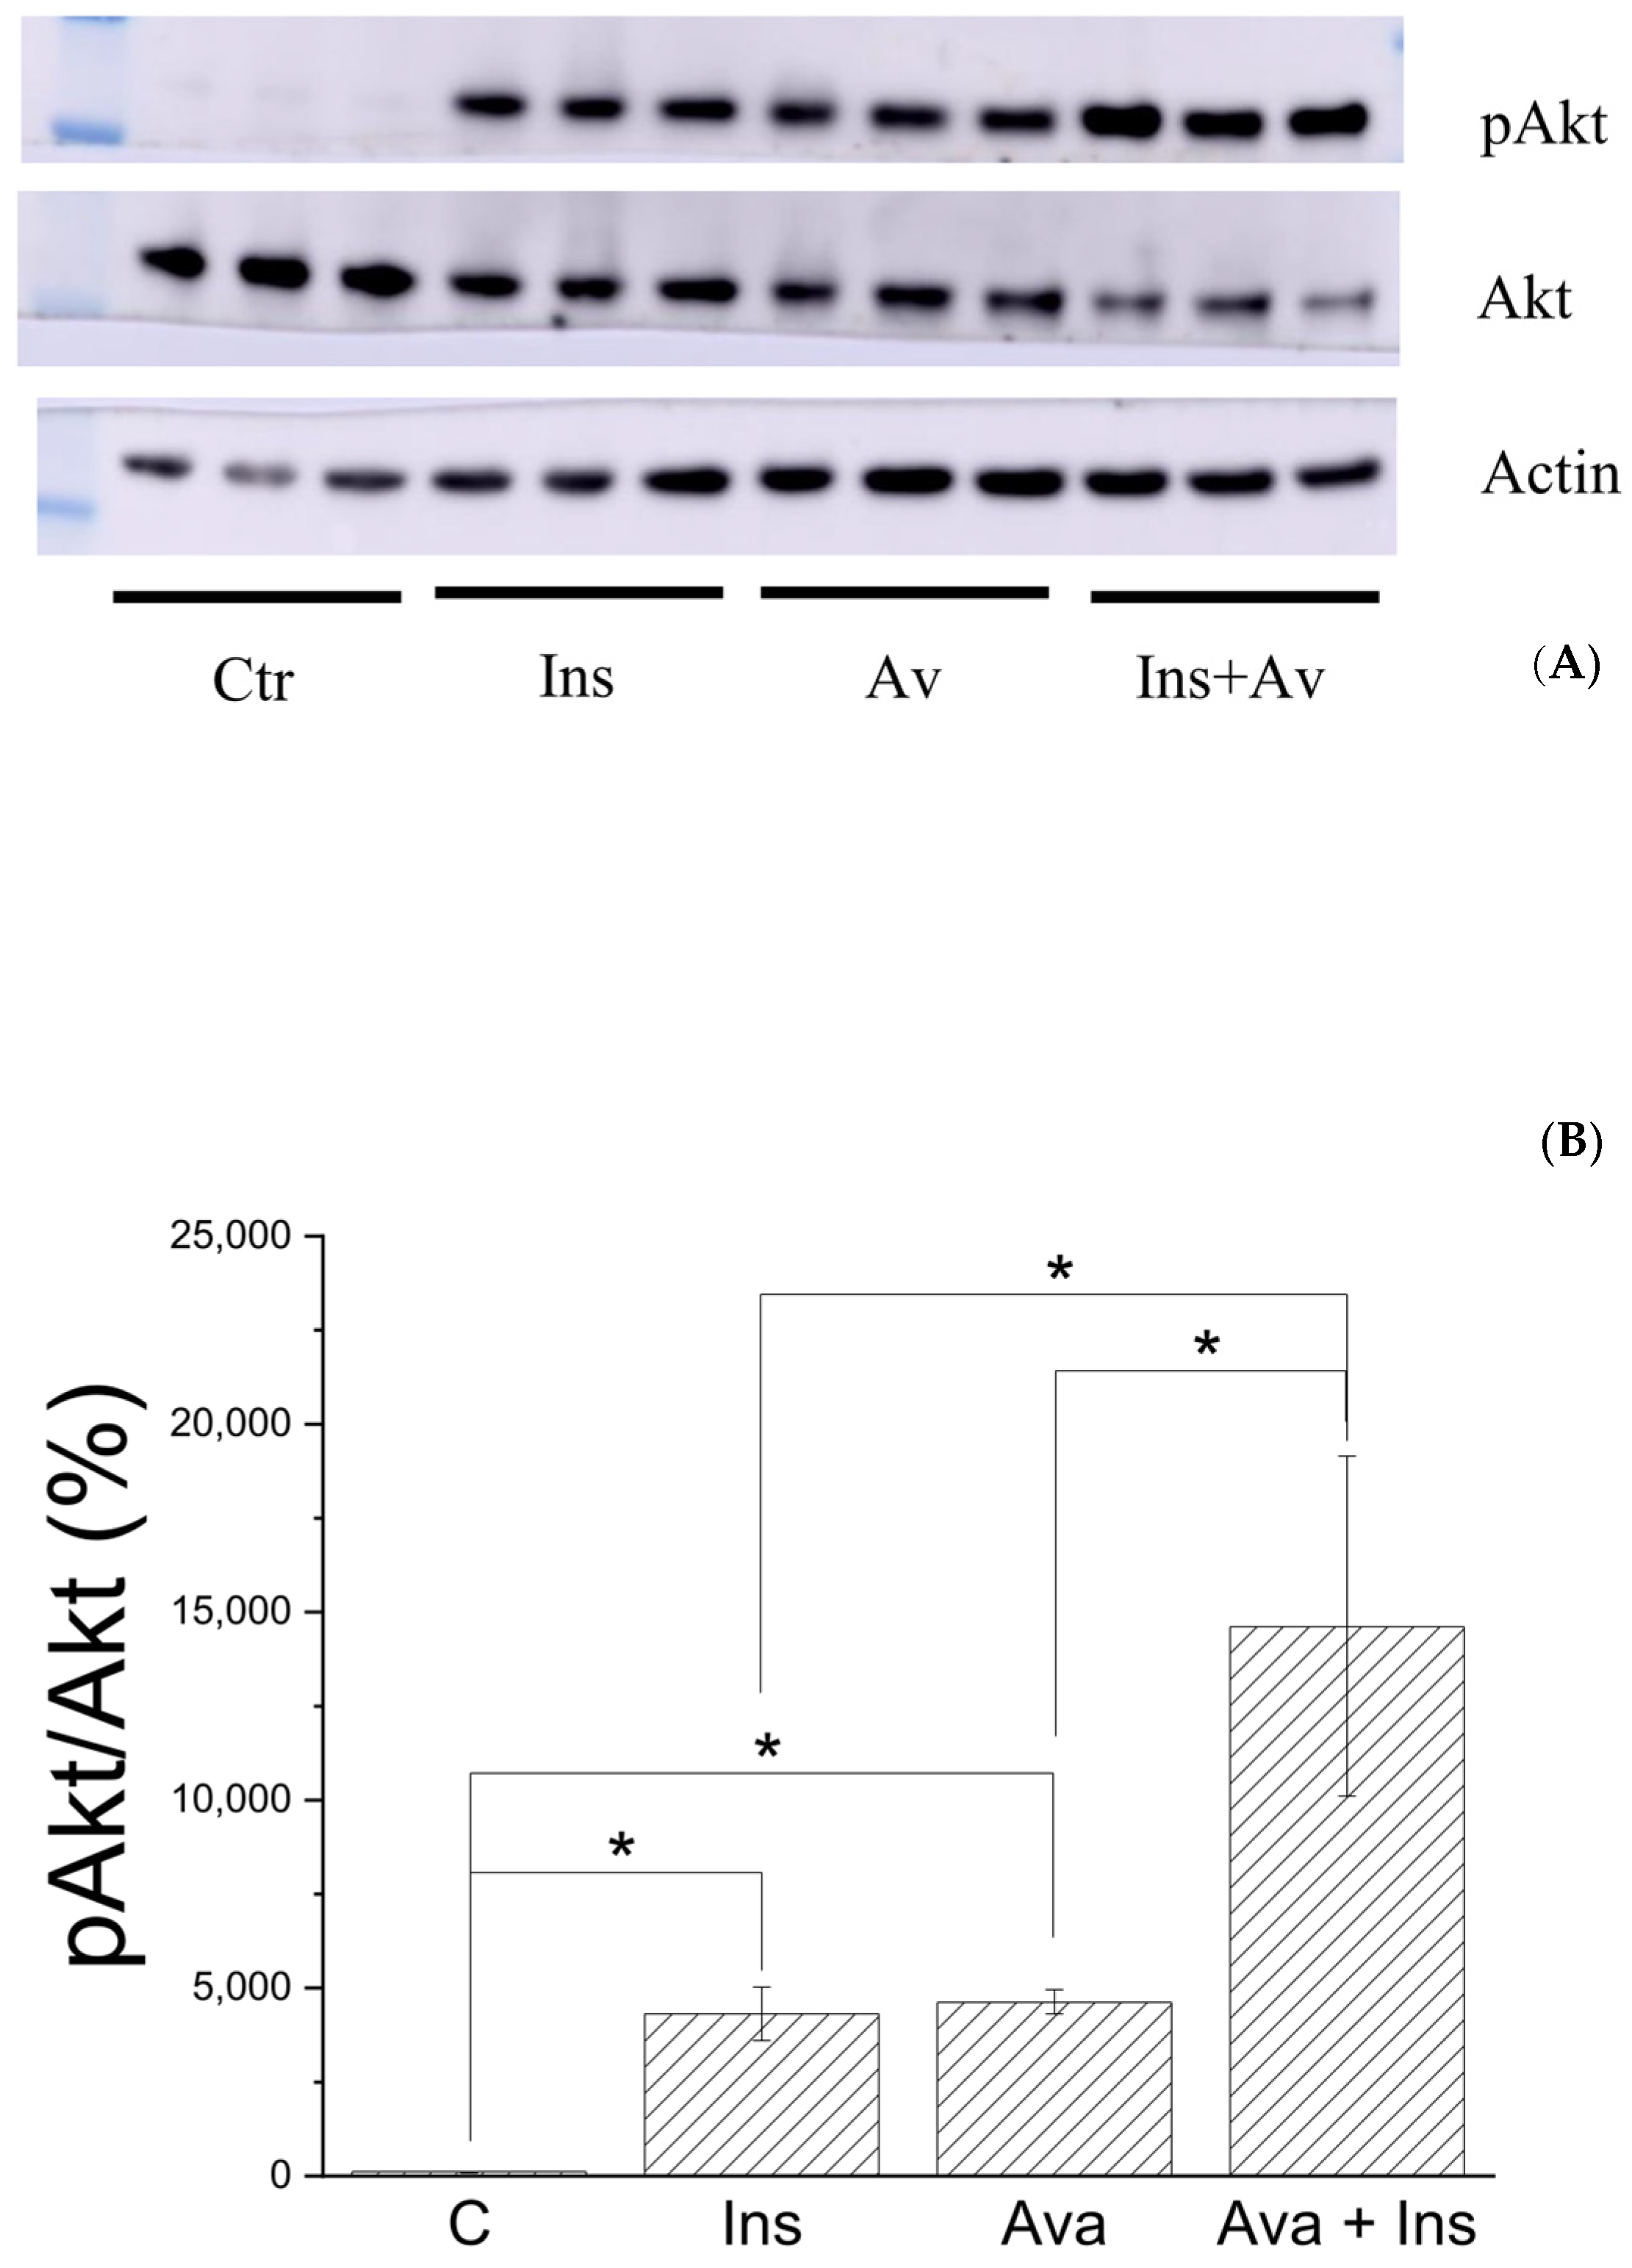
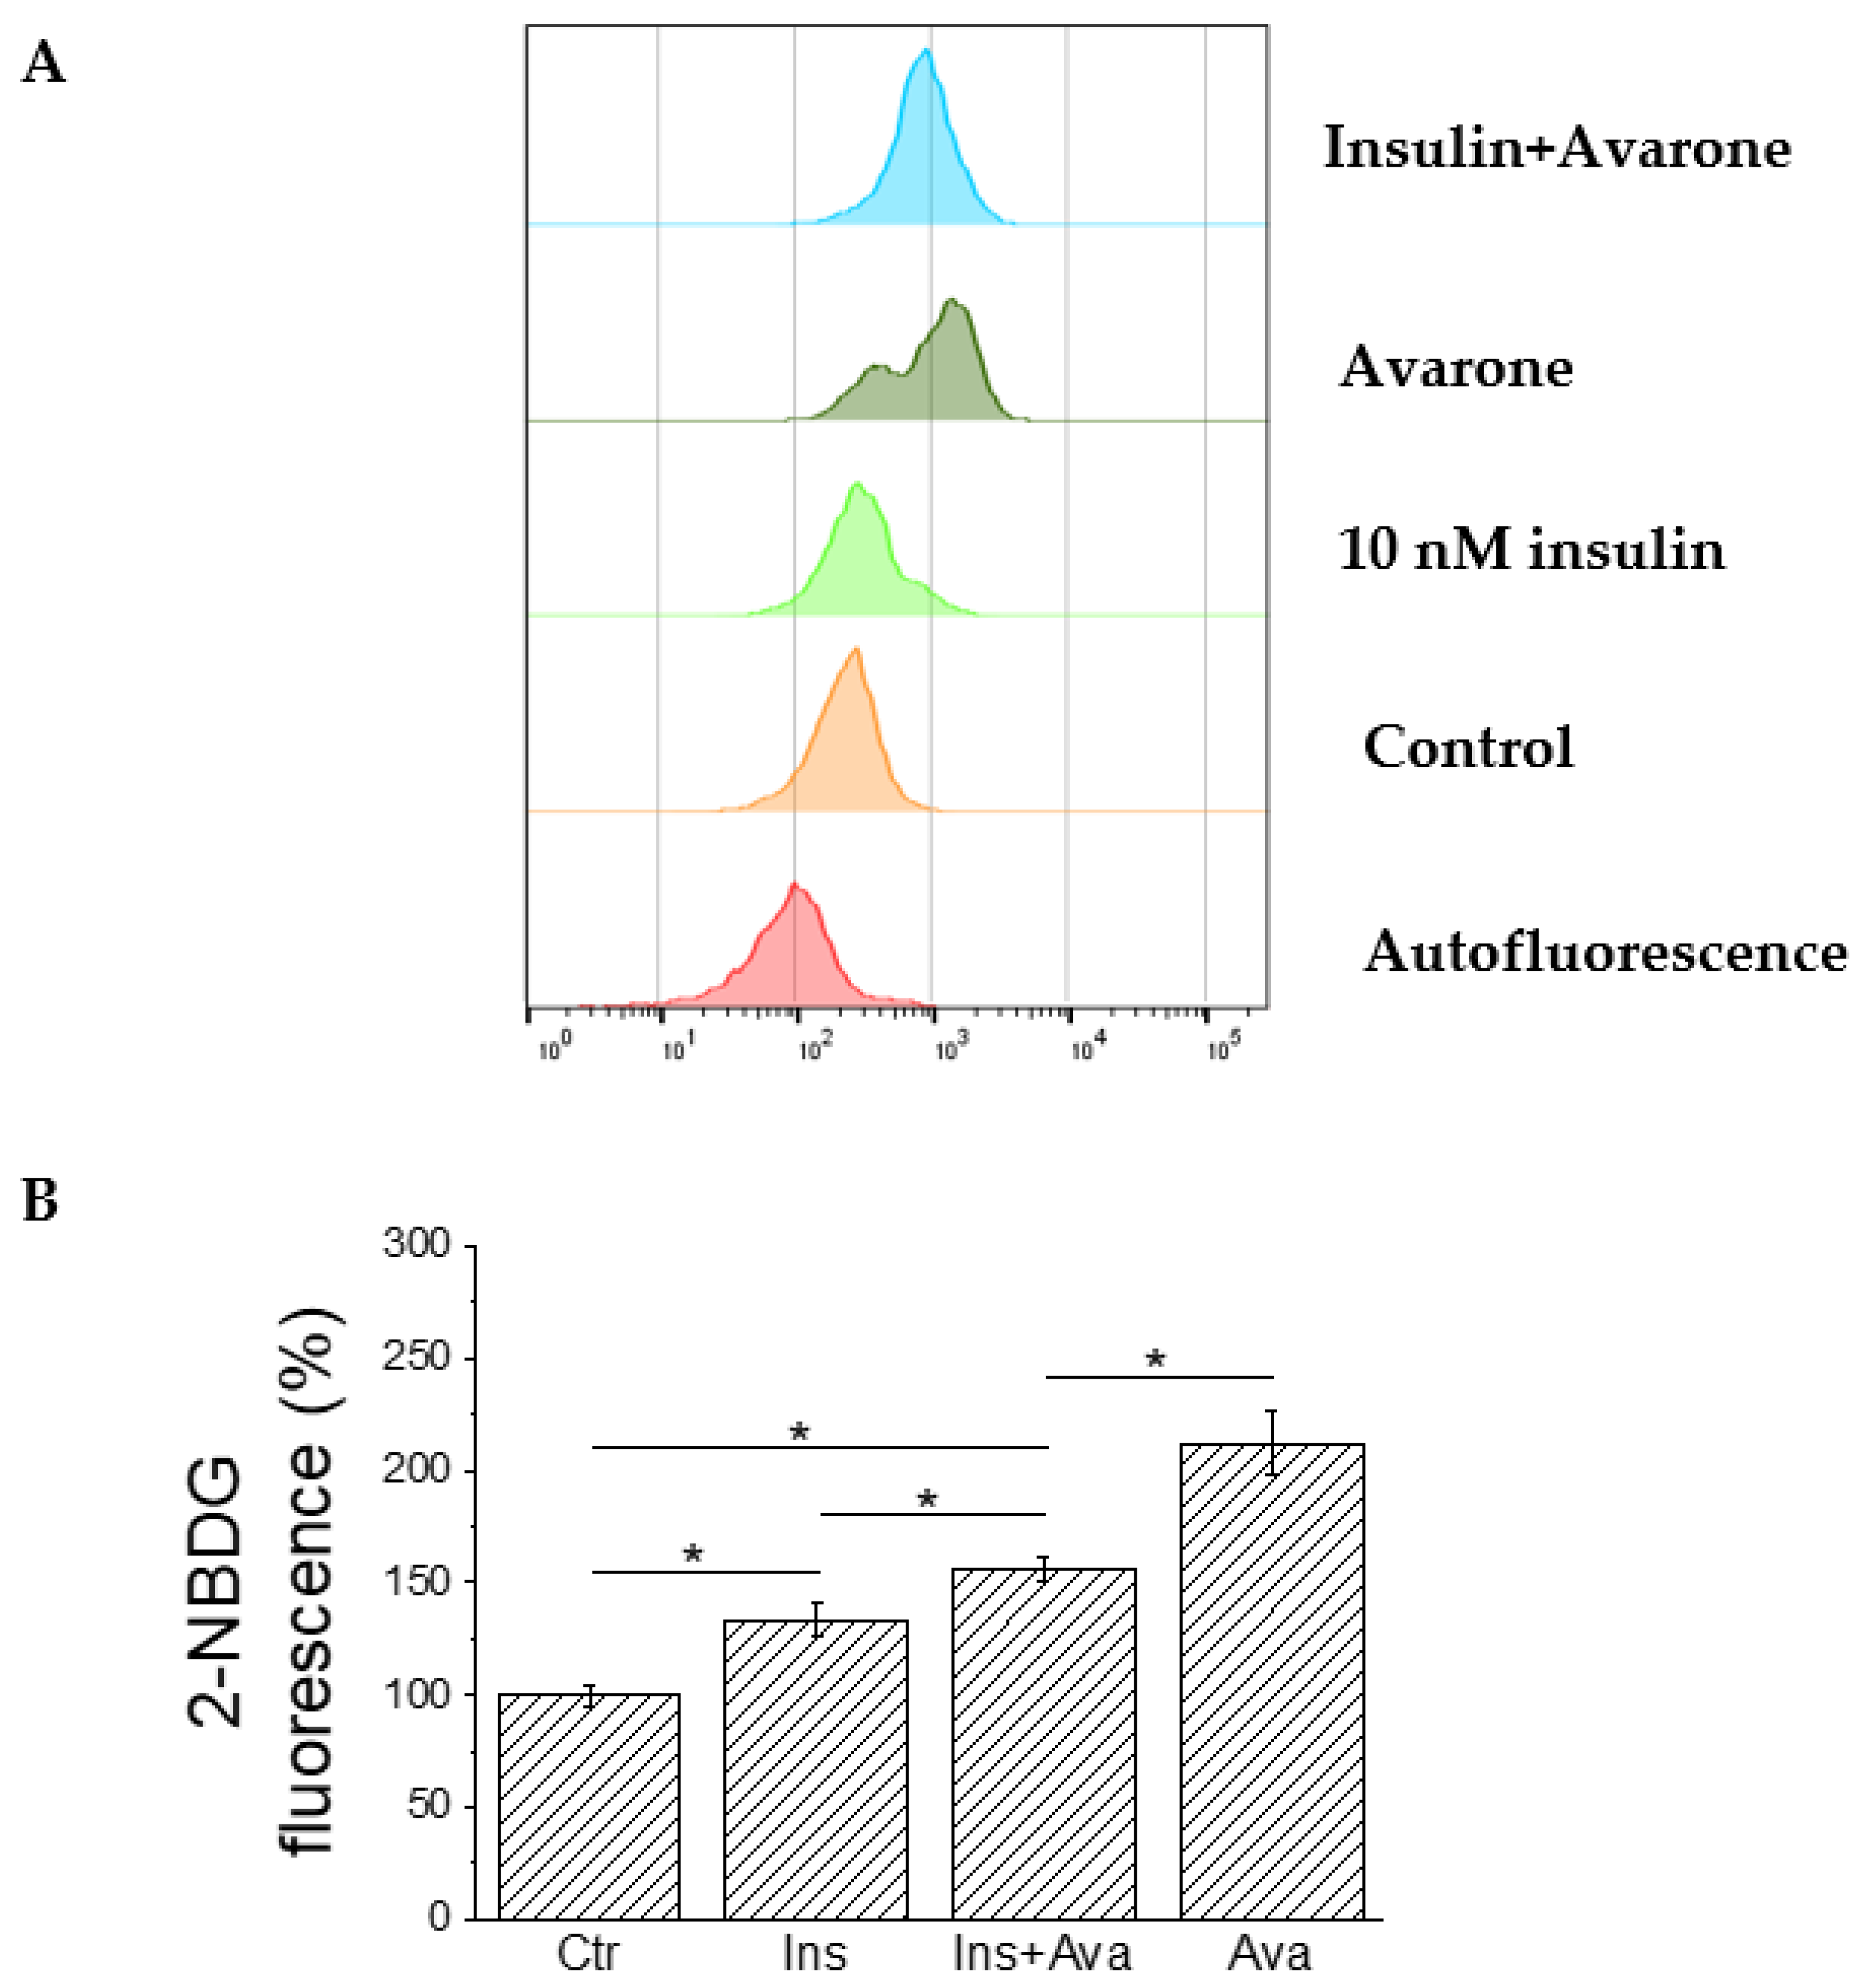
2.9. Ex Vivo Assays
2.10. Seahorse XFe96 Metabolic Assays
3. Results
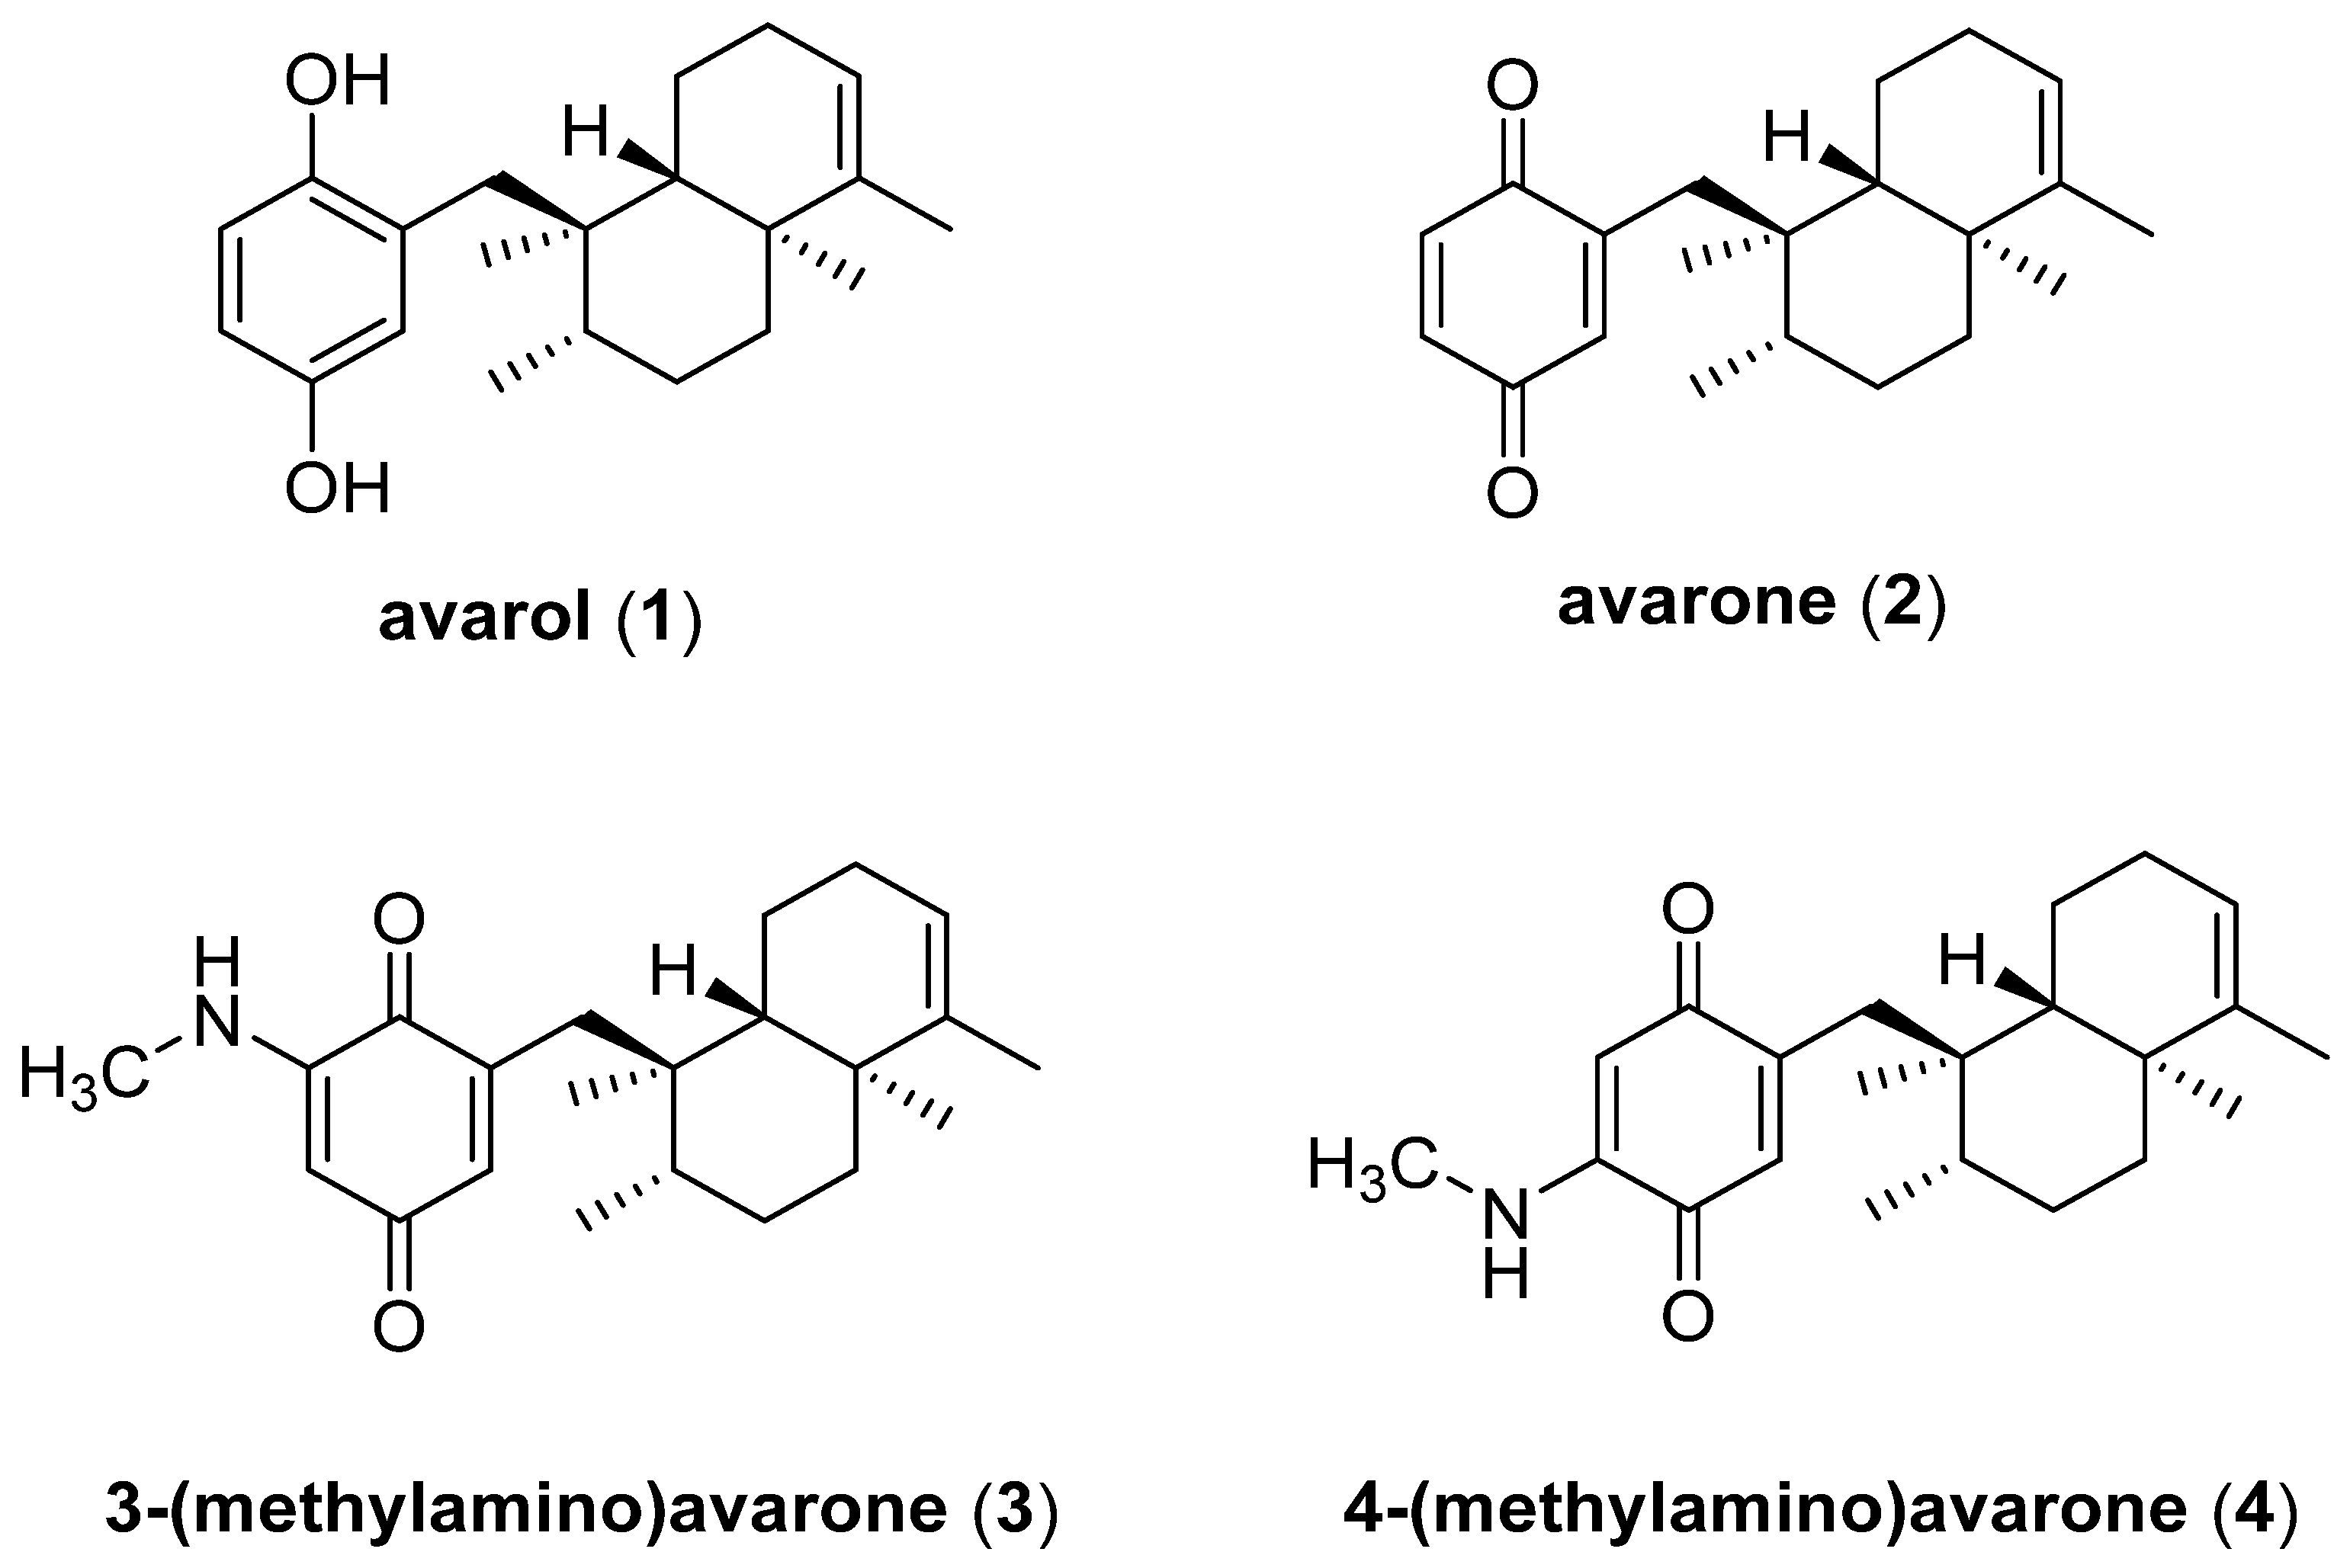
3.1. Bioprospecting of the Sponge D. avara for the Isolation of Compounds 1–4
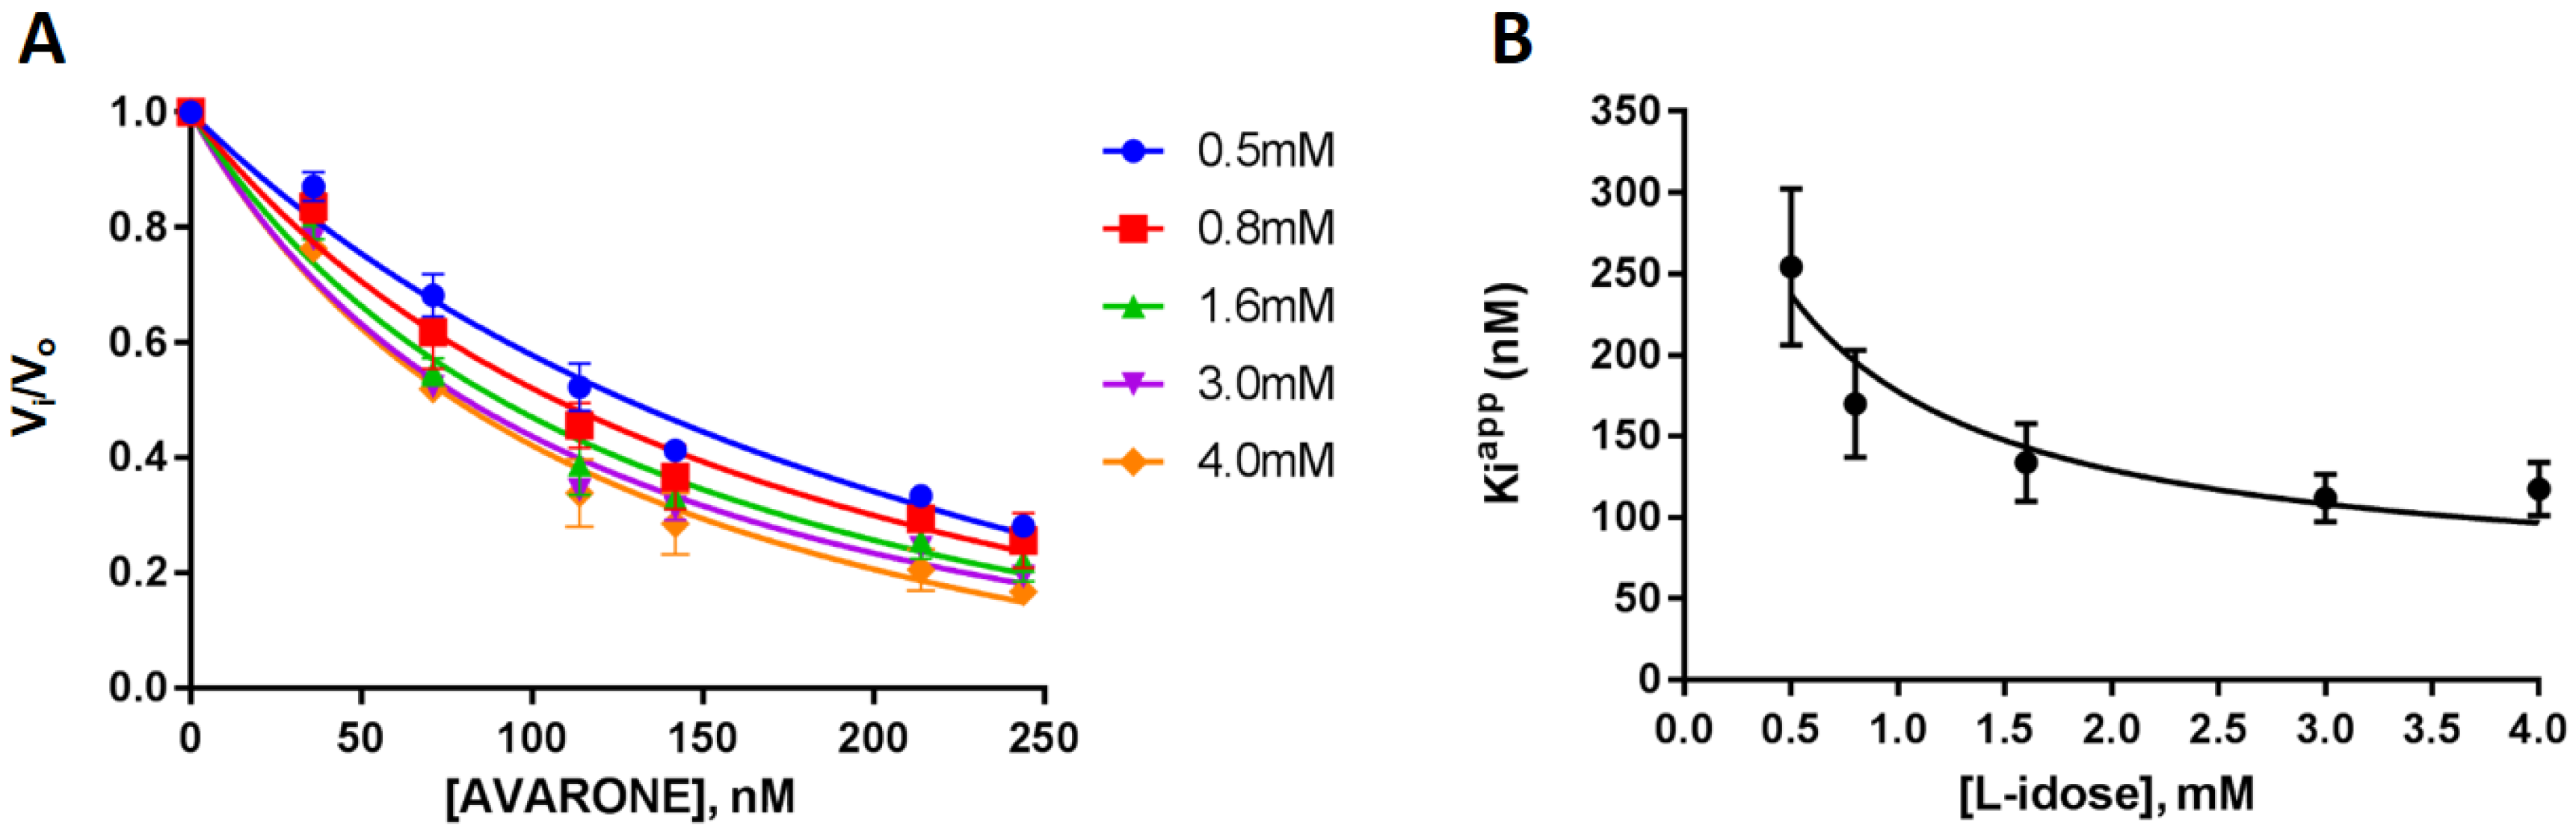
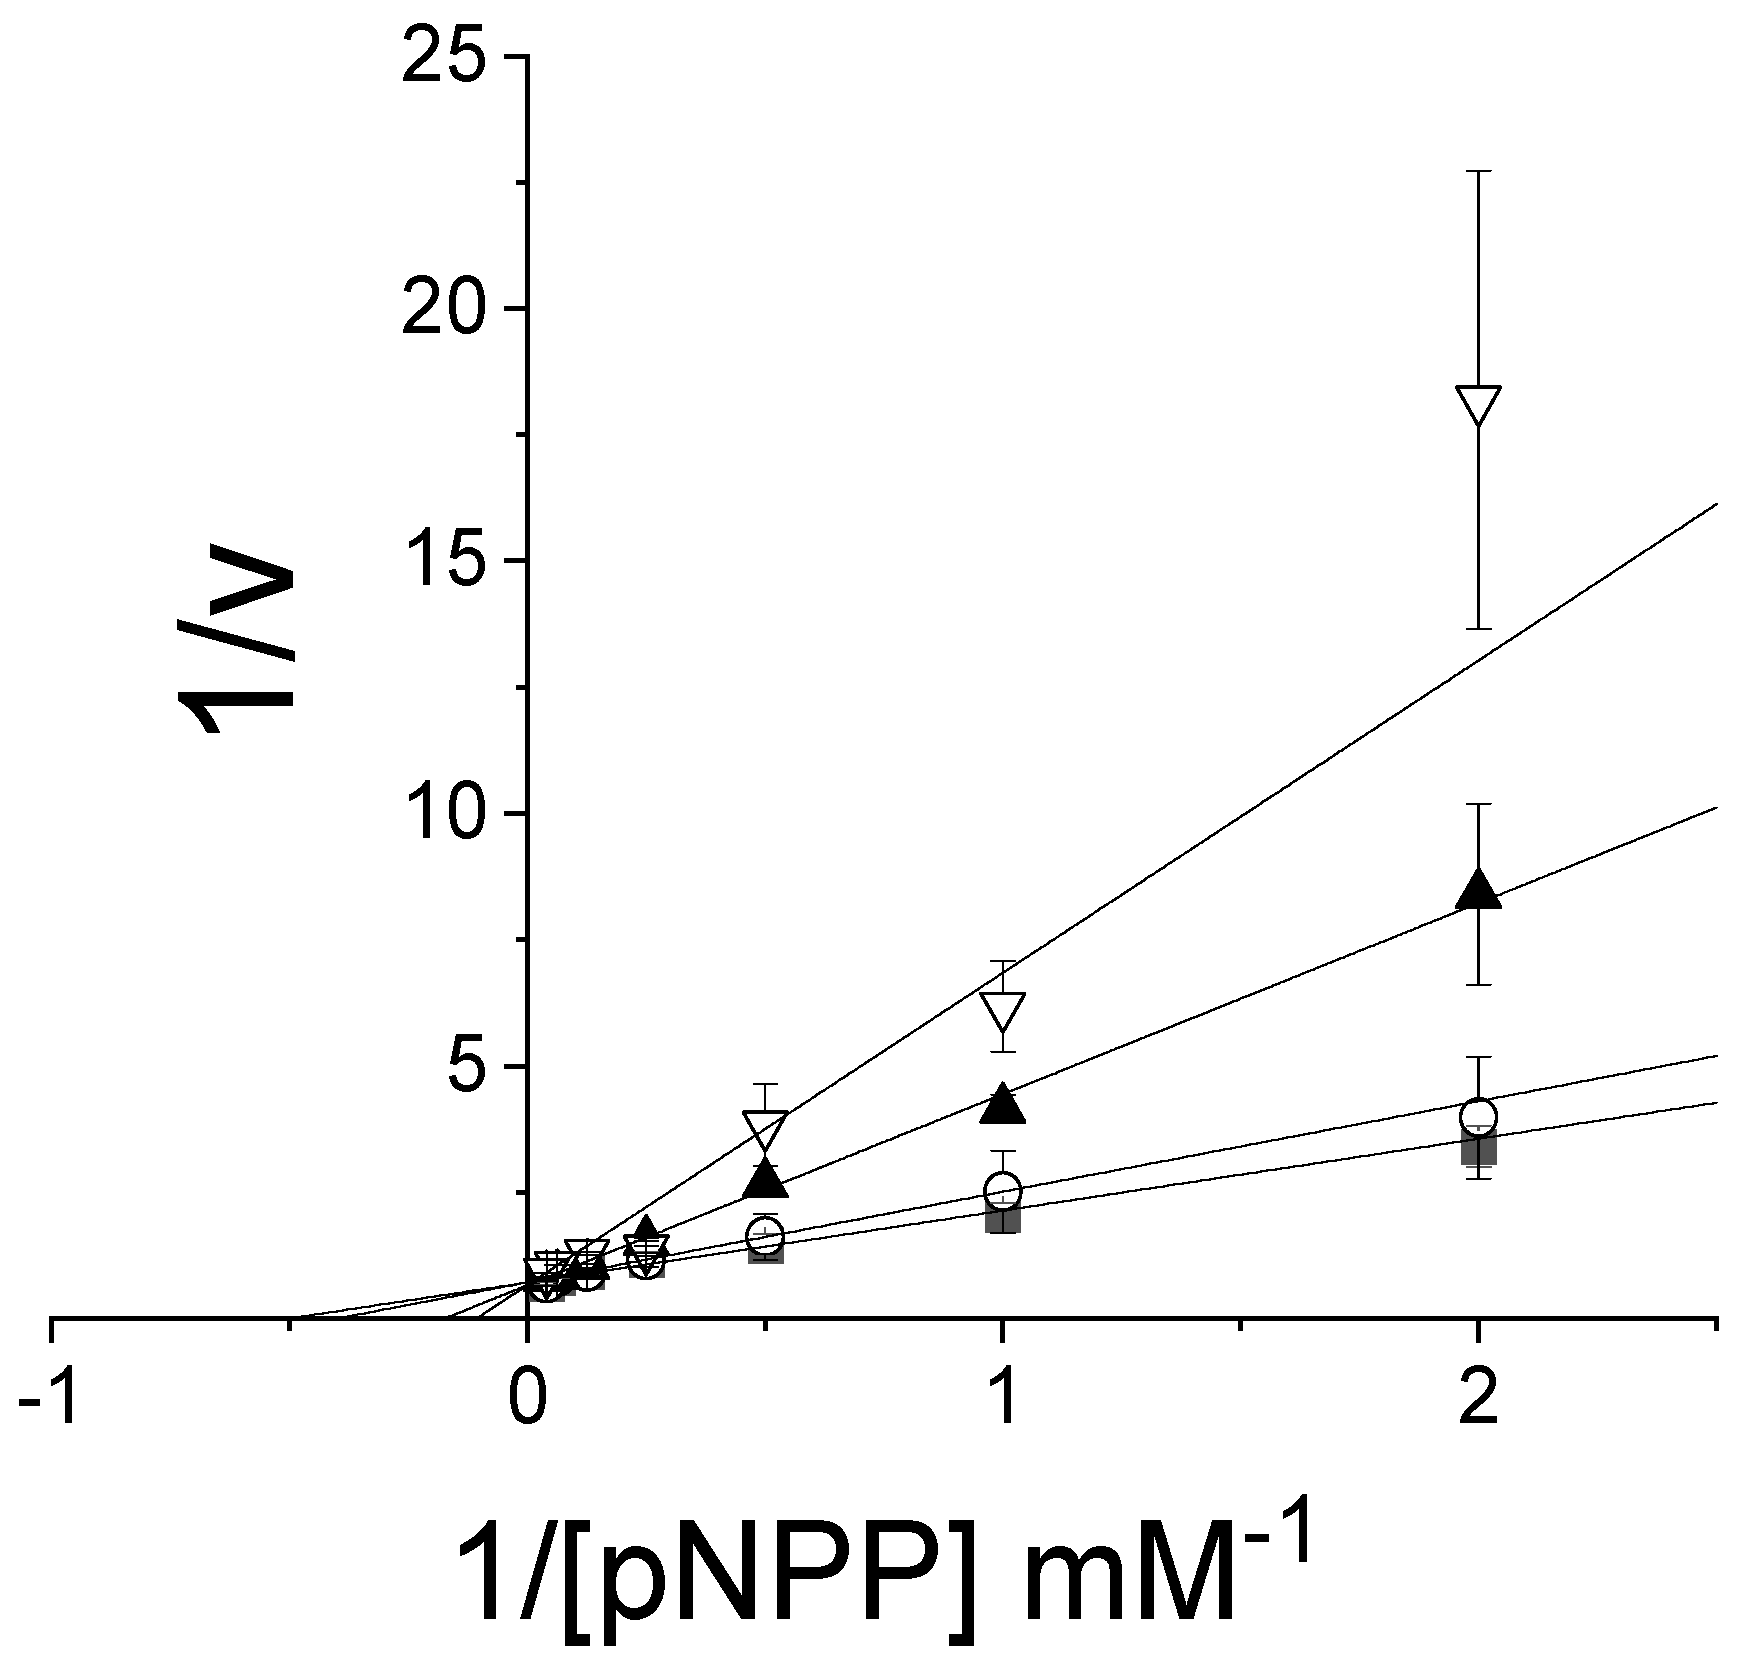
3.2. Evaluation of Inhibitory Effects against PTP1B and AKR1B1 of Compounds 1–4, and Kinetic Analyses of Avarone (2)
3.3. PTP1B Docking Experiments
3.4. Specificity of PTP1B Inhibitory Activity of Avarone
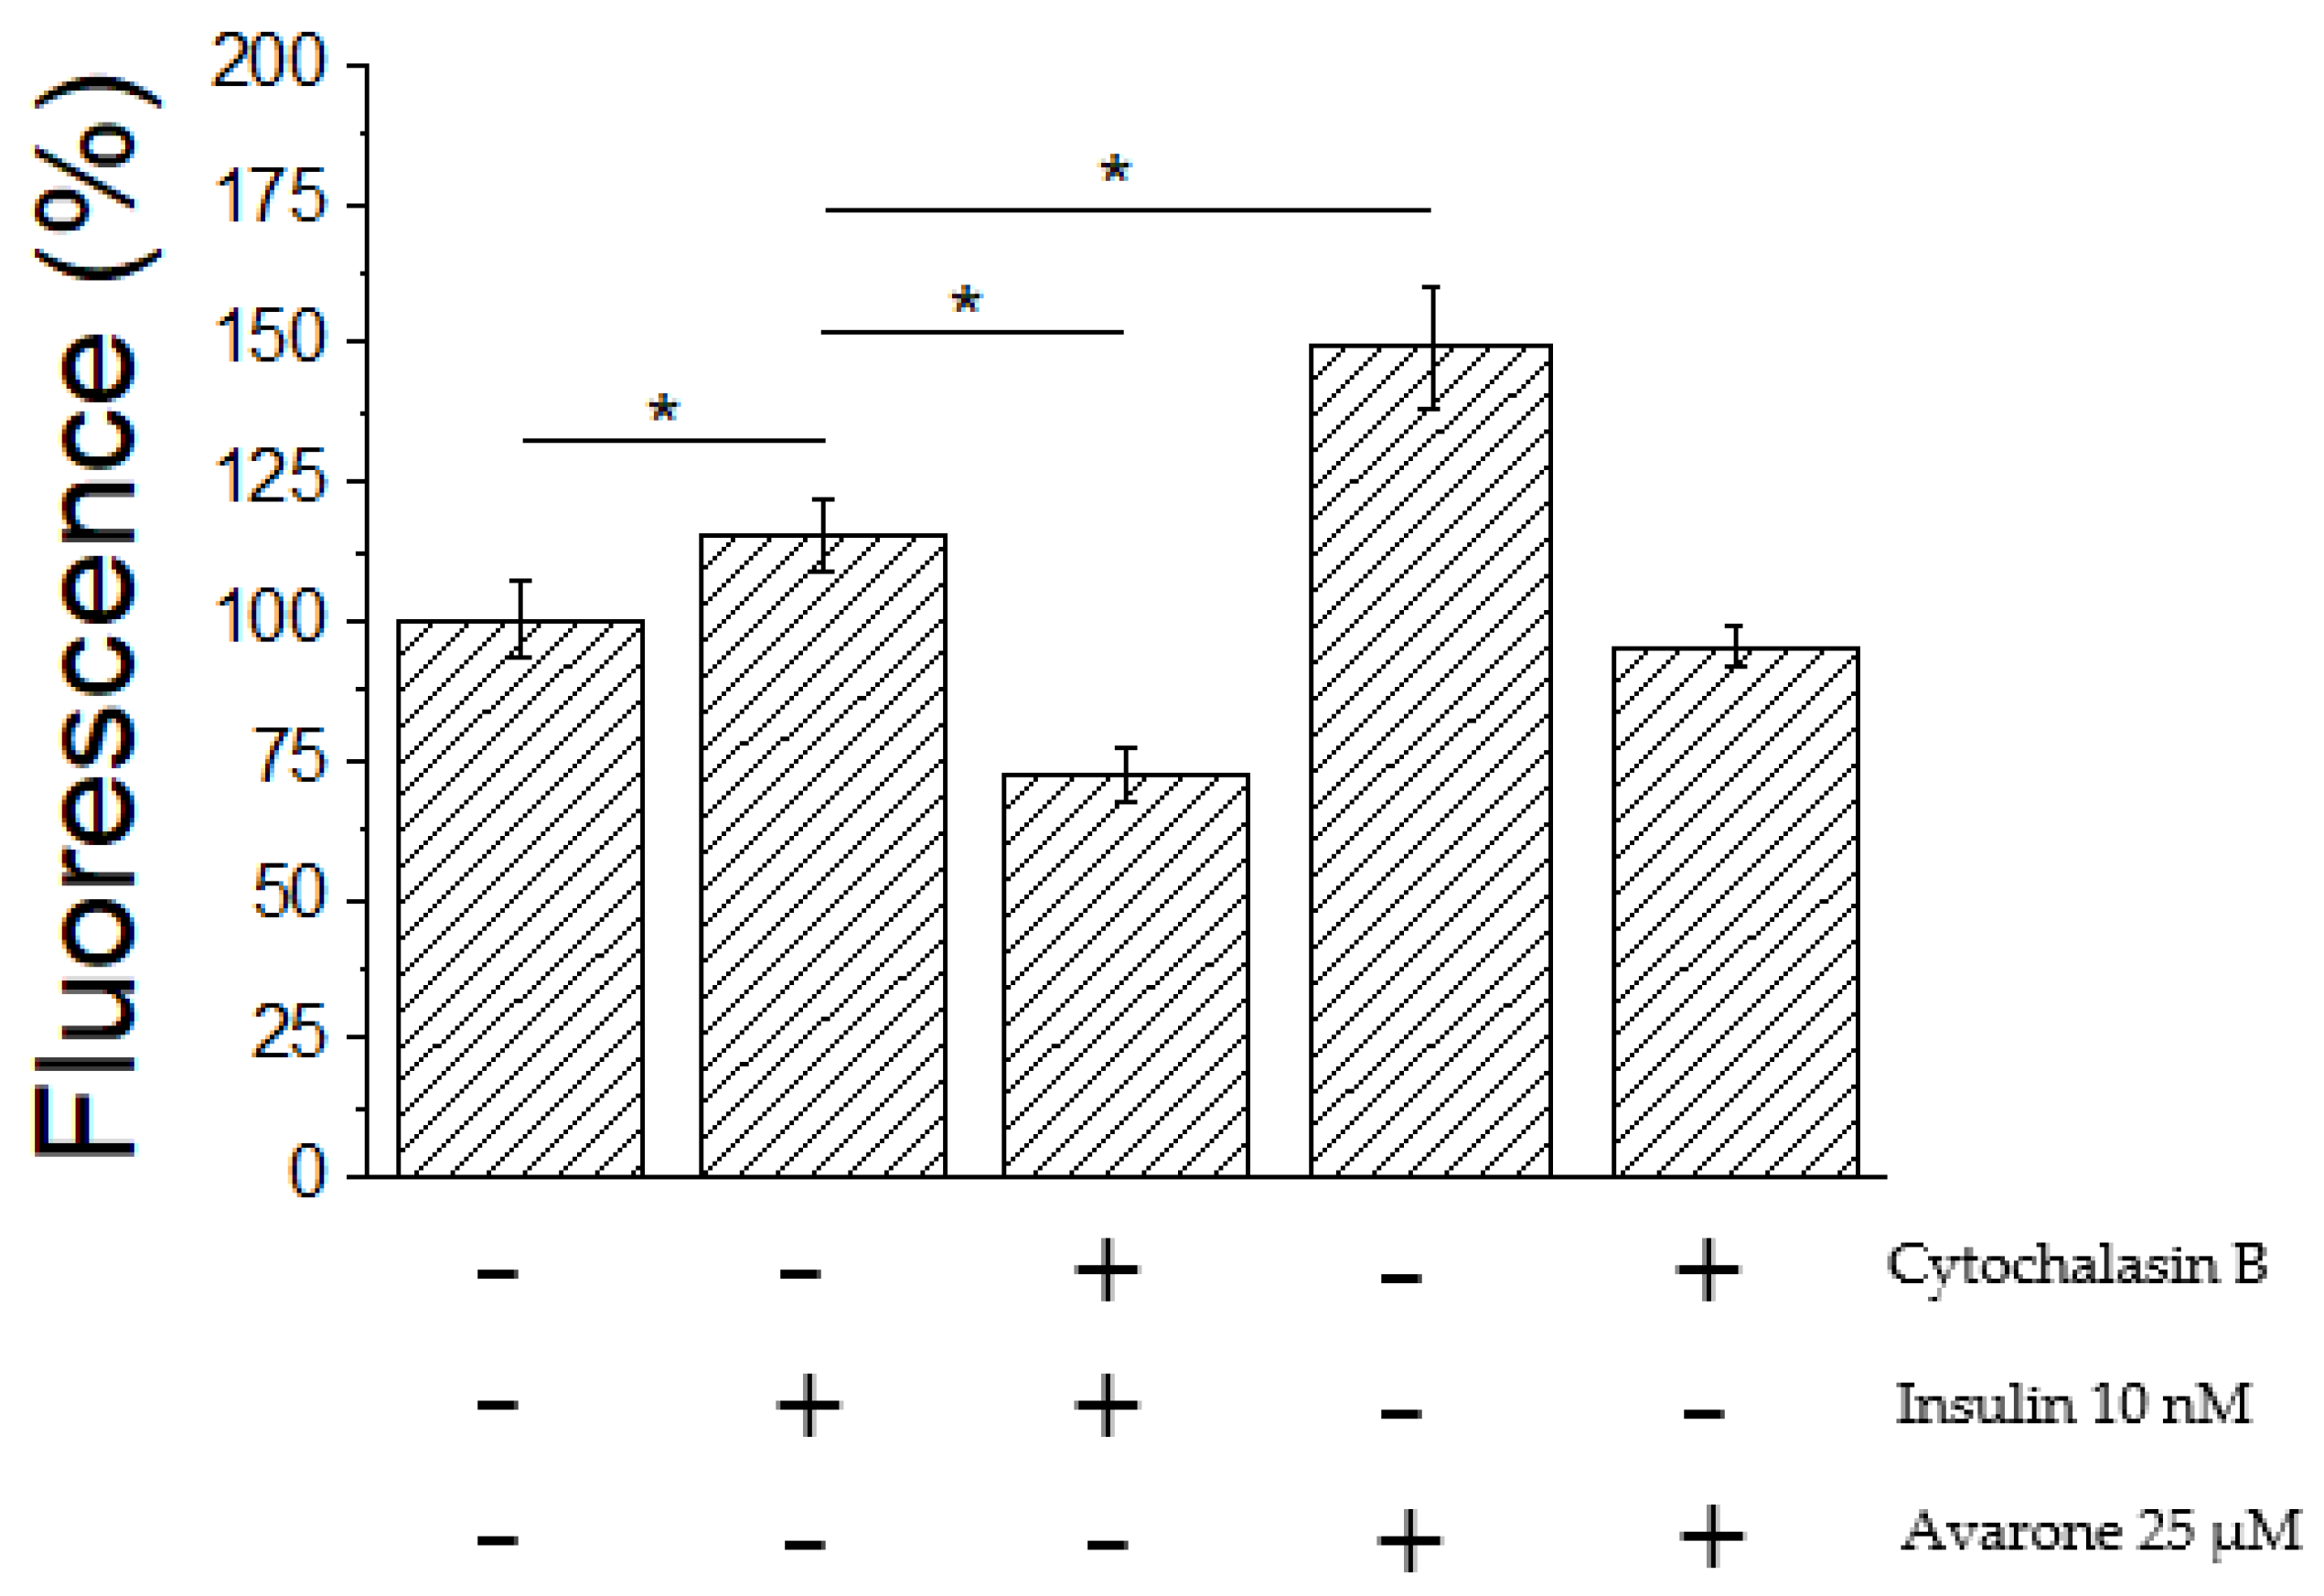
3.5. Ex Vivo Assay
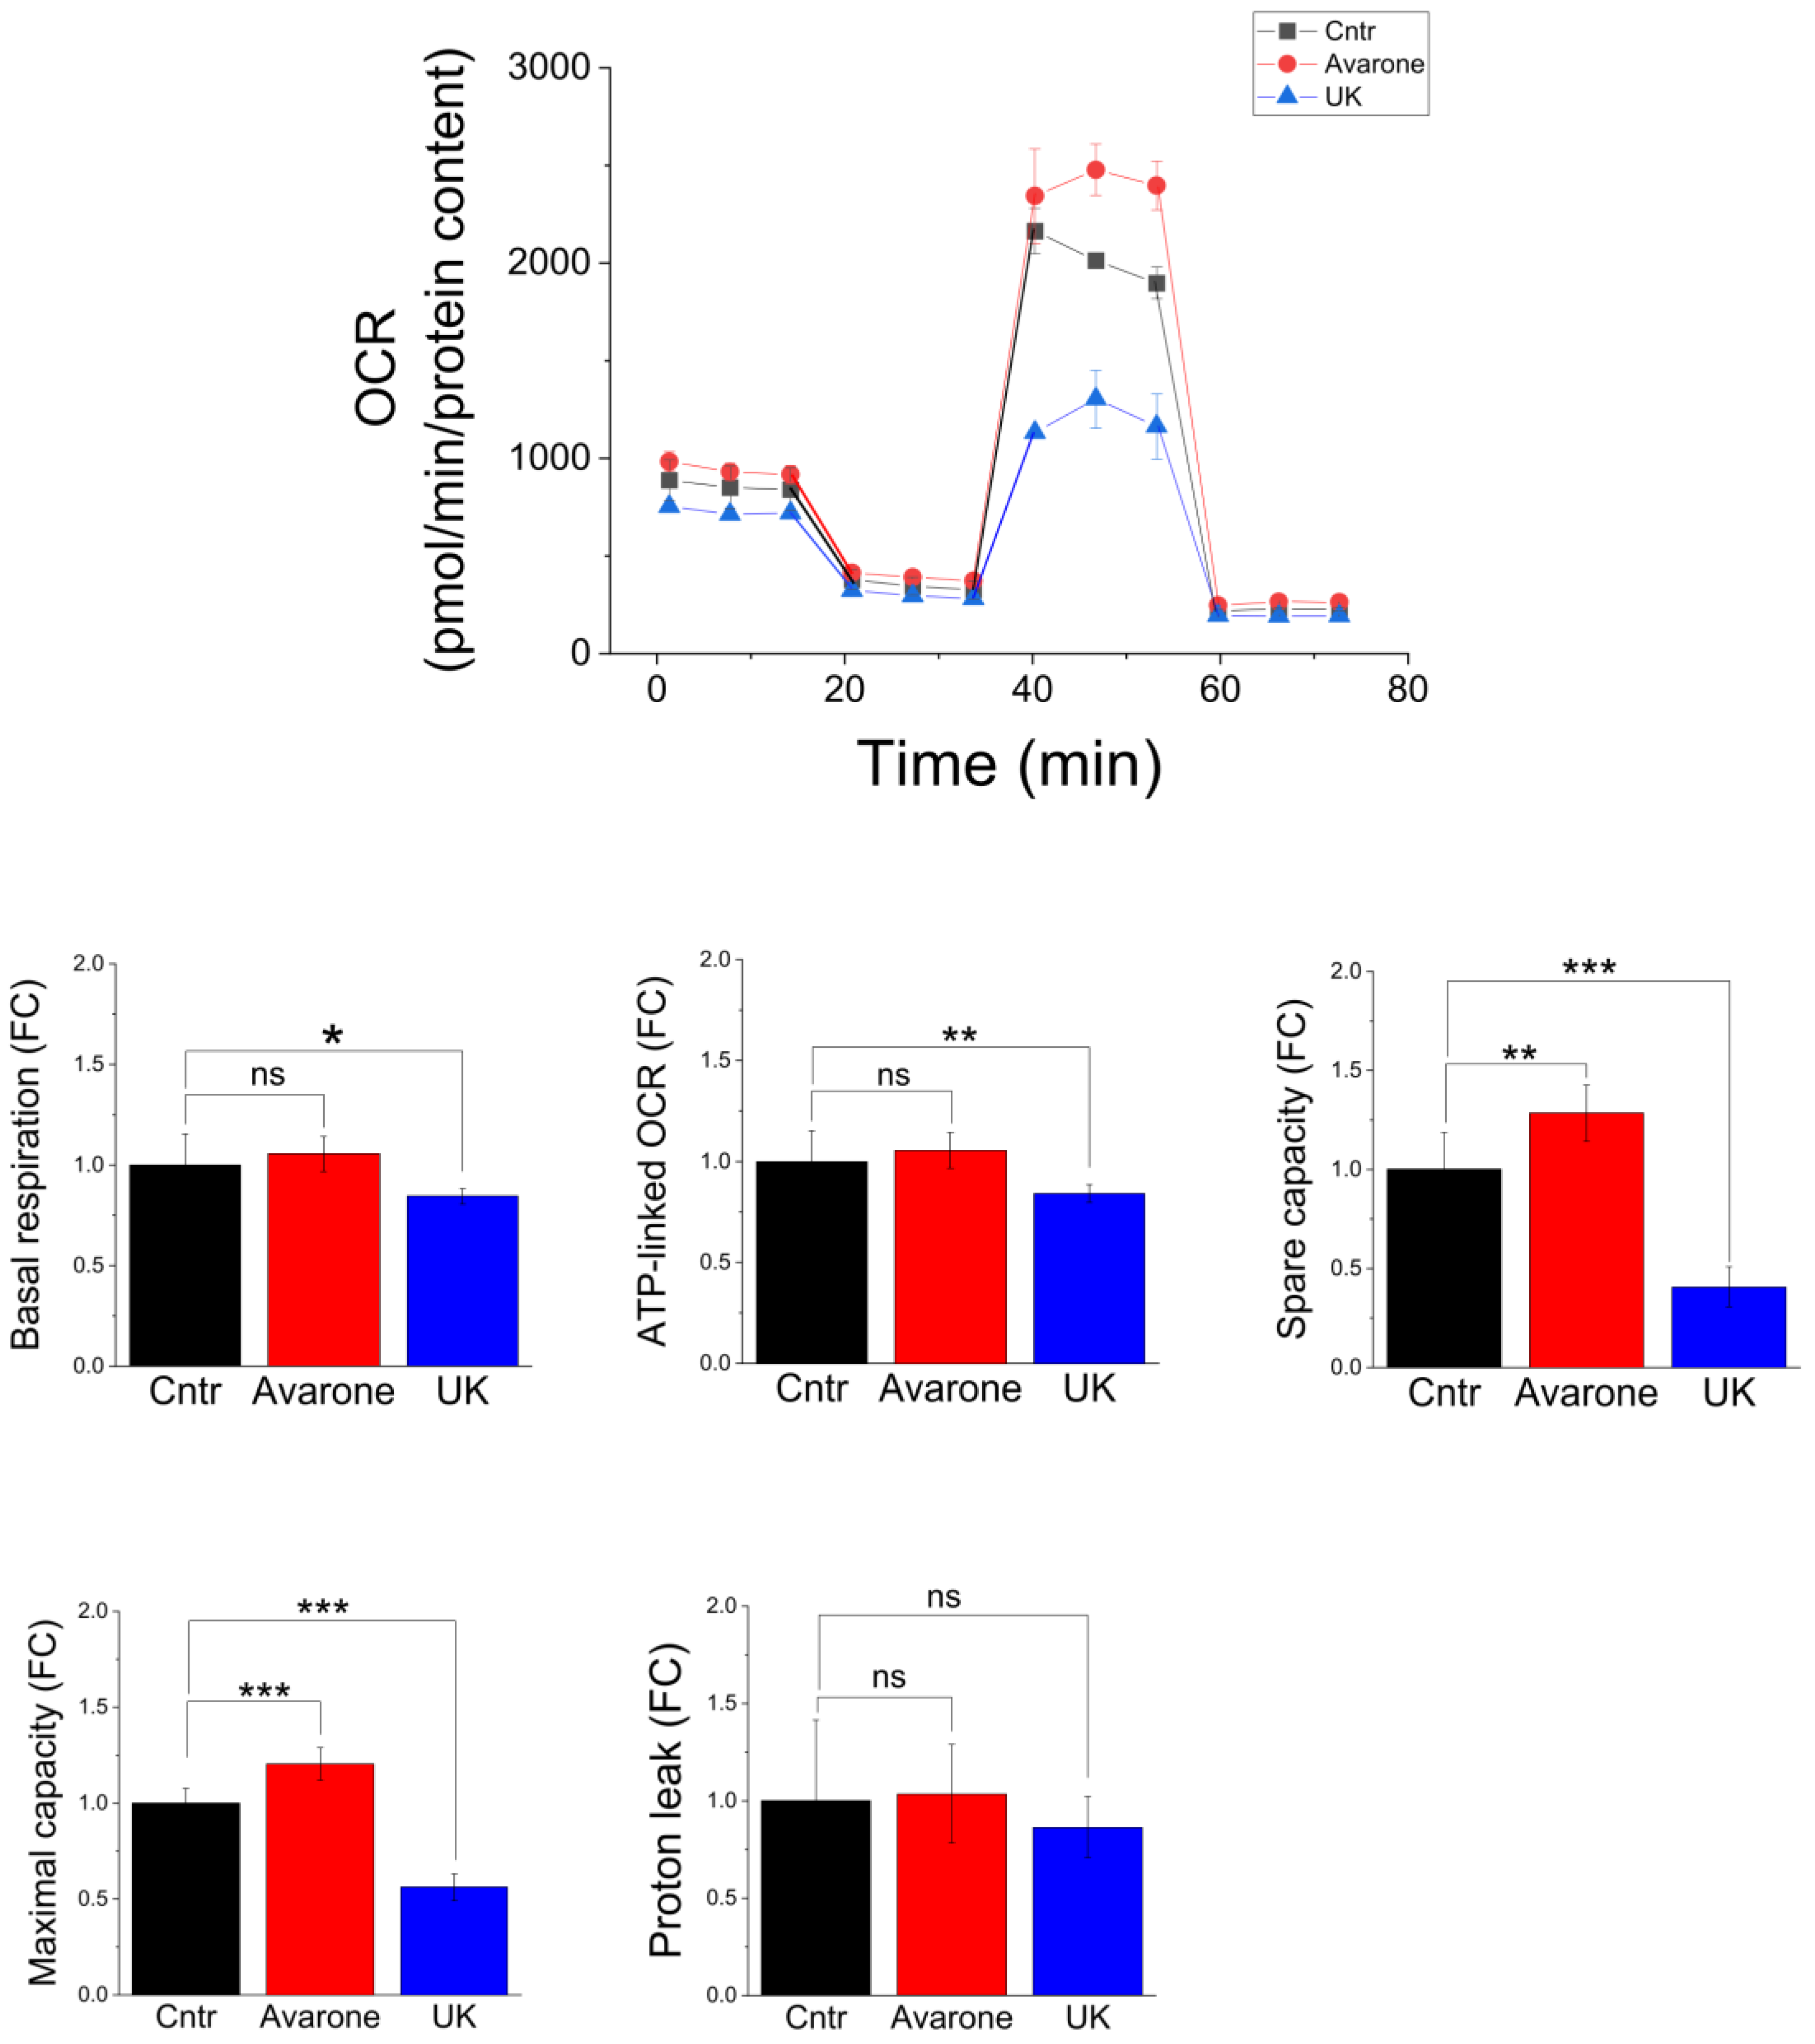
3.6. Bioenergetics Analyses of C2C12 Cells Treated with Avarone
4. Discussion
5. Conclusions
Supplementary Materials
Author Contributions
Funding
Institutional Review Board Statement
Informed Consent Statement
Data Availability Statement
Acknowledgments
Conflicts of Interest
Appendix A
 where E•pNPP is the Michaelis-Menten complex, and E-P is the covalent phosphoenzyme intermediate. By applying the steady state assumption to [E-P], we can assume:
References
- Alim, Z.; Kilinc, N.; Sengul, B.; Beydemir, S. Mechanism of Capsaicin Inhibition of Aldose Reductase Activity. J. Biochem. Mol. Toxicol. 2017, 31, e21898. [Google Scholar] [CrossRef]
- Saeedi, P.; Petersohn, I.; Salpea, P.; Malanda, B.; Karuranga, S.; Unwin, N.; Colagiuri, S.; Guariguata, L.; Motala, A.A.; Ogurtsova, K.; et al. Global and Regional Diabetes Prevalence Estimates for 2019 and Projections for 2030 and 2045: Results from the International Diabetes Federation Diabetes Atlas, 9th Edition. Diabetes Res. Clin. Pract. 2019, 157, 107843. [Google Scholar] [CrossRef]
- World Health Statistics 2020: Monitoring Health for the SDGs, Sustainable Development Goals; World Health Or-Ganization: Geneva, Switzerland, 2020.
- Hasanzad, M.; Larijani, B.; Aghaei Meybodi, H.R. Diabetes and COVID-19: A Bitter Nightmare. J. Diabetes Metab. Disord. 2022, 21, 1191–1193. [Google Scholar] [CrossRef] [PubMed]
- Vázquez-Vela, M.E.F.; Torres, N.; Tovar, A.R. White Adipose Tissue as Endocrine Organ and Its Role in Obesity. Arch. Med. Res. 2008, 39, 715–728. [Google Scholar] [CrossRef] [PubMed]
- Thakur, S.; Gupta, S.K.; Ali, V.; Singh, P.; Verma, M. Aldose Reductase: A Cause and a Potential Target for the Treatment of Diabetic Complications. Arch. Pharm. Res. 2021, 44, 655–667. [Google Scholar] [CrossRef] [PubMed]
- Balestri, F.; Barracco, V.; Renzone, G.; Tuccinardi, T.; Pomelli, C.S.; Cappiello, M.; Lessi, M.; Rotondo, R.; Bellina, F.; Scaloni, A.; et al. Stereoselectivity of Aldose Reductase in the Reduction of Glutathionyl-Hydroxynonanal Adduct. Antioxidants 2019, 8, 502. [Google Scholar] [CrossRef]
- del Corso, A.; Cappiello, M.; Mura, U. From a Dull Enzyme to Something Else: Facts and Perspectives Regarding Aldose Reductase. Curr. Med. Chem. 2008, 15, 1452–1461. [Google Scholar] [CrossRef]
- Maccari, R.; Ottanà, R. Targeting Aldose Reductase for the Treatment of Diabetes Complications and Inflammatory Diseases: New Insights and Future Directions. J. Med. Chem. 2015, 58, 2047–2067. [Google Scholar] [CrossRef]
- Goldstein, B.J. Protein-Tyrosine Phosphatases: Emerging Targets for Therapeutic Intervention in Type 2 Diabetes and Related States of Insulin Resistance. J. Clin. Endocrinol. Metab. 2002, 87, 2474–2480. [Google Scholar] [CrossRef]
- Elchebly, M.; Payette, P.; Michaliszyn, E.; Cromlish, W.; Collins, S.; Loy, A.L.; Normandin, D.; Cheng, A.; Himms-Hagen, J.; Chan, C.-C.; et al. Increased Insulin Sensitivity and Obesity Resistance in Mice Lacking the Protein Tyrosine Phosphatase-1B Gene. Science 1999, 283, 1544–1548. [Google Scholar] [CrossRef]
- Pardella, E.; Pranzini, E.; Leo, A.; Taddei, M.L.; Paoli, P.; Raugei, G. Oncogenic Tyrosine Phosphatases: Novel Therapeutic Targets for Melanoma Treatment. Cancers 2020, 12, 2799. [Google Scholar] [CrossRef]
- Lori, G.; Paoli, P.; Femia, A.P.; Pranzini, E.; Caselli, A.; Tortora, K.; Romagnoli, A.; Raugei, G.; Caderni, G. Morin-dependent Inhibition of Low Molecular Weight Protein Tyrosine Phosphatase (LMW-PTP) Restores Sensitivity to Apoptosis during Colon Carcinogenesis: Studies in Vitro and in Vivo, in an Apc -driven Model of Colon Cancer. Mol. Carcinog. 2019, 58, 686–698. [Google Scholar] [CrossRef] [PubMed]
- Artasensi, A.; Pedretti, A.; Vistoli, G.; Fumagalli, L. Type 2 Diabetes Mellitus: A Review of Multi-Target Drugs. Molecules 2020, 25, 1987. [Google Scholar] [CrossRef] [PubMed]
- Saldívar-González, F.I.; Aldas-Bulos, V.D.; Medina-Franco, J.L.; Plisson, F. Natural Product Drug Discovery in the Artificial Intelligence Era. Chem. Sci. 2022, 13, 1526–1546. [Google Scholar] [CrossRef]
- Atanasov, A.G.; Zotchev, S.B.; Dirsch, V.M.; Supuran, C.T. Natural Products in Drug Discovery: Advances and Opportunities. Nat. Rev. Drug Discov. 2021, 20, 200–216. [Google Scholar] [CrossRef]
- Demir, Y.; Özaslan, M.S.; Duran, H.E.; Küfrevioğlu, Ö.İ.; Beydemir, Ş. Inhibition Effects of Quinones on Aldose Reductase: Antidiabetic Properties. Environ. Toxicol. Pharmacol. 2019, 70, 103195. [Google Scholar] [CrossRef] [PubMed]
- Menna, M.; Imperatore, C.; D’Aniello, F.; Aiello, A. Meroterpenes from Marine Invertebrates: Structures, Occurrence, and Ecological Implications. Mar. Drugs 2013, 11, 1602–1643. [Google Scholar] [CrossRef] [PubMed]
- Imperatore, C.; Gimmelli, R.; Persico, M.; Casertano, M.; Guidi, A.; Saccoccia, F.; Ruberti, G.; Luciano, P.; Aiello, A.; Parapini, S.; et al. Investigating the Antiparasitic Potential of the Marine Sesquiterpene Avarone, Its Reduced Form Avarol, and the Novel Semisynthetic Thiazinoquinone Analogue Thiazoavarone. Mar. Drugs 2020, 18, 112. [Google Scholar] [CrossRef]
- Natural Products in the New Millennium: Prospects and Industrial Application; Rauter, A.P., Palma, F.B., Justino, J., Araújo, M.E., dos Santos, S.P., Eds.; Springer Netherlands: Dordrecht, The Netherlands, 2002; ISBN 978-90-481-6186-7. [Google Scholar]
- Shen, Y.-C.; Lu, C.-H.; Chakraborty, R.; Kuo, Y.-H. Isolation of Sesquiterpenoids from Sponge Dysidea Avara and Chemical Modification of Avarol as Potential Antitumor Agents. Nat. Prod. Res. 2003, 17, 83–89. [Google Scholar] [CrossRef]
- Sarin, P.S.; Sun, D.; Thornton, A.; Muller, W.E. Inhibition of Replication of the Etiologic Agent of Acquired Immune Deficiency Syndrome (Human T-Lymphotropic Retrovirus/Lymphadenopathy-Associated Virus) by Avarol and Avarone. J. Natl. Cancer Inst. 1987, 78, 663–666. [Google Scholar]
- Gimmelli, R.; Persico, M.; Imperatore, C.; Saccoccia, F.; Guidi, A.; Casertano, M.; Luciano, P.; Pietrantoni, A.; Bertuccini, L.; Paladino, A.; et al. Thiazinoquinones as New Promising Multistage Schistosomicidal Compounds Impacting Schistosoma Mansoni and Egg Viability. ACS Infect. Dis. 2020, 6, 124–137. [Google Scholar] [CrossRef]
- Zhang, Y.; Li, Y.; Guo, Y.-W.; Jiang, H.-L.; Shen, X. A Sesquiterpene Quinone, Dysidine, from the Sponge Dysidea Villosa, Activates the Insulin Pathway through Inhibition of PTPases. Acta Pharmacol. Sin. 2009, 30, 333–345. [Google Scholar] [CrossRef] [PubMed]
- Genovese, M.; Imperatore, C.; Casertano, M.; Aiello, A.; Balestri, F.; Piazza, L.; Menna, M.; del Corso, A.; Paoli, P. Dual Targeting of PTP1B and Aldose Reductase with Marine Drug Phosphoeleganin: A Promising Strategy for Treatment of Type 2 Diabetes. Mar. Drugs 2021, 19, 535. [Google Scholar] [CrossRef] [PubMed]
- Casertano, M.; Genovese, M.; Piazza, L.; Balestri, F.; del Corso, A.; Vito, A.; Paoli, P.; Santi, A.; Imperatore, C.; Menna, M. Identifying Human PTP1B Enzyme Inhibitors from Marine Natural Products: Perspectives for Developing of Novel Insulin-Mimetic Drugs. Pharmaceuticals 2022, 15, 325. [Google Scholar] [CrossRef] [PubMed]
- Li, Y.; Zhang, Y.; Shen, X.; Guo, Y.-W. A Novel Sesquiterpene Quinone from Hainan Sponge Dysidea Villosa. Bioorganic Med. Chem. Lett. 2009, 19, 390–392. [Google Scholar] [CrossRef]
- Surti, M.; Patel, M.; Adnan, M.; Moin, A.; Ashraf, S.A.; Siddiqui, A.J.; Snoussi, M.; Deshpande, S.; Reddy, M.N. Ilimaquinone (Marine Sponge Metabolite) as a Novel Inhibitor of SARS-CoV-2 Key Target Proteins in Comparison with Suggested COVID-19 Drugs: Designing, Docking and Molecular Dynamics Simulation Study. RSC Adv. 2020, 10, 37707–37720. [Google Scholar] [CrossRef]
- Casaubon, R.L.; Snapper, M.L. S -Adenosylmethionine Reverses Ilimaquinone’s Vesiculation of the Golgi Apparatus. Bioorganic Med. Chem. Lett. 2001, 11, 133–136. [Google Scholar] [CrossRef] [PubMed]
- Kurelec, B.; Zhan, R.K.; Gasić, M.J.; Britvić, S.; Lucić, D.; Müller, W.E.G. Antimutagenic Activity of the Novel Antileukemic Agents, Avarone and Avarol. Mutat. Res. Lett. 1985, 144, 63–66. [Google Scholar] [CrossRef]
- Loya, S.; Hizi, A. The Inhibition of Human Immunodeficiency Virus Type 1 Reverse Transcriptase by Avarol and Avarone Derivatives. FEBS Lett. 1990, 269, 131–134. [Google Scholar] [CrossRef]
- Amigó, M.; Payá, M.; Braza-Boïls, A.; de Rosa, S.; Terencio, M.C. Avarol Inhibits TNF-α Generation and NF-ΚB Activation in Human Cells and in Animal Models. Life Sci. 2008, 82, 256–264. [Google Scholar] [CrossRef]
- Tsoukatou, M.; Maréchal, J.; Hellio, C.; Novaković, I.; Tufegdzic, S.; Sladić, D.; Gašić, M.; Clare, A.; Vagias, C.; Roussis, V. Evaluation of the Activity of the Sponge Metabolites Avarol and Avarone and Their Synthetic Derivatives Against Fouling Micro- and Macroorganisms. Molecules 2007, 12, 1022–1034. [Google Scholar] [CrossRef]
- Vilipić, J.; Novaković, I.; Stanojković, T.; Matić, I.; Šegan, D.; Kljajić, Z.; Sladić, D. Synthesis and Biological Activity of Amino Acid Derivatives of Avarone and Its Model Compound. Bioorganic Med. Chem. 2015, 23, 6930–6942. [Google Scholar] [CrossRef]
- Belisario, M.A.; Maturo, M.; Avagnale, G.; de Rosa, S.; Scopacasa, F.; Caterina, M. de In Vitro Effect of Avarone and Avarol, a Quinone/Hydroquinone Couple of Marine Origin, on Platelet Aggregation. Pharmacol. Toxicol. 1996, 79, 300–304. [Google Scholar] [CrossRef] [PubMed]
- Minale, L.; Riccio, R.; Sodano, G. Avarol a Novel Sesquiterpenoid Hydroquinone with a Rearranged Drimane Skeleton from the Sponge. Tetrahedron Lett. 1974, 15, 3401–3404. [Google Scholar] [CrossRef]
- Cozzolino, R.; de Giulio, A.; de Rosa, S.; Strazzullo, G.; Gašič, M.J.; Sladić, D.; Zlatović, M. Biological Activities of Avarol Derivatives, 1. Amino Derivatives. J. Nat. Prod. 1990, 53, 699–702. [Google Scholar] [CrossRef]
- Imperatore, C.; Valadan, M.; Tartaglione, L.; Persico, M.; Ramunno, A.; Menna, M.; Casertano, M.; Dell’Aversano, C.; Singh, M.; d’Aulisio Garigliota, M.L.; et al. Exploring the Photodynamic Properties of Two Antiproliferative Benzodiazopyrrole Derivatives. Int. J. Mol. Sci. 2020, 21, 1246. [Google Scholar] [CrossRef] [PubMed]
- Imperatore, C.; Varriale, A.; Rivieccio, E.; Pennacchio, A.; Staiano, M.; D’Auria, S.; Casertano, M.; Altucci, C.; Valadan, M.; Singh, M.; et al. Spectroscopic Properties of Two 5′-(4-Dimethylamino)Azobenzene Conjugated G-Quadruplex Forming Oligonucleotides. Int. J. Mol. Sci. 2020, 21, 7103. [Google Scholar] [CrossRef]
- Casertano, M.; Genovese, M.; Paoli, P.; Santi, A.; Aiello, A.; Menna, M.; Imperatore, C. Insights into Cytotoxic Behavior of Lepadins and Structure Elucidation of the New Alkaloid Lepadin L from the Mediterranean Ascidian Clavelina Lepadiformis. Mar. Drugs 2022, 20, 65. [Google Scholar] [CrossRef]
- Aiello, A.; Fattorusso, E.; Imperatore, C.; Luciano, P.; Menna, M.; Vitalone, R. Aplisulfamines, New Sulfoxide-Containing Metabolites from an Aplidium Tunicate: Absolute Stereochemistry at Chiral Sulfur and Carbon Atoms Assigned Through an Original Combination of Spectroscopic and Computational Methods. Mar. Drugs 2012, 10, 51–63. [Google Scholar] [CrossRef]
- Hamed, A.N.E.-S.; Wätjen, W.; Schmitz, R.; Chovolou, Y.; Edrada-Ebel, R.; Youssef, D.T.A.; Kamel, M.S.; Proksch, P. A New Bioactive Sesquiterpenoid Quinone from the Mediterranean Sea Marine Sponge Dysidea Avara. Nat. Prod. Commun. 2013, 8, 289–292. [Google Scholar]
- Balestri, F.; Cappiello, M.; Moschini, R.; Rotondo, R.; Buggiani, I.; Pelosi, P.; Mura, U.; Del-Corso, A. L-Idose: An Attractive Substrate Alternative to d-Glucose for Measuring Aldose Reductase Activity. Biochem. Biophys. Res. Commun. 2015, 456, 891–895. [Google Scholar] [CrossRef]
- Balestri, F.; Poli, G.; Pineschi, C.; Moschini, R.; Cappiello, M.; Mura, U.; Tuccinardi, T.; del Corso, A. Aldose Reductase Differential Inhibitors in Green Tea. Biomolecules 2020, 10, 1003. [Google Scholar] [CrossRef] [PubMed]
- Misuri, L.; Cappiello, M.; Balestri, F.; Moschini, R.; Barracco, V.; Mura, U.; Del-Corso, A. The Use of Dimethylsulfoxide as a Solvent in Enzyme Inhibition Studies: The Case of Aldose Reductase. J. Enzym. Inhib. Med. Chem. 2017, 32, 1152–1158. [Google Scholar] [CrossRef] [PubMed]
- Morrison, J.F. Kinetics of the Reversible Inhibition of Enzyme-Catalysed Reactions by Tight-Binding Inhibitors. Biochim. Biophys. Acta BBA—Enzymol. 1969, 185, 269–286. [Google Scholar] [CrossRef] [PubMed]
- Ottanà, R.; Paoli, P.; Cappiello, M.; Nguyen, T.N.; Adornato, I.; del Corso, A.; Genovese, M.; Nesi, I.; Moschini, R.; Naß, A.; et al. In Search for Multi-Target Ligands as Potential Agents for Diabetes Mellitus and Its Complications—A Structure-Activity Relationship Study on Inhibitors of Aldose Reductase and Protein Tyrosine Phosphatase 1B. Molecules 2021, 26, 330. [Google Scholar] [CrossRef]
- Trott, O.; Olson, A.J. AutoDock Vina: Improving the Speed and Accuracy of Docking with a New Scoring Function, Efficient Optimization, and Multithreading. J. Comput. Chem. 2009, 31, 455–461. [Google Scholar] [CrossRef]
- Šali, A.; Blundell, T.L. Comparative Protein Modelling by Satisfaction of Spatial Restraints. J. Mol. Biol. 1993, 234, 779–815. [Google Scholar] [CrossRef]
- Pettersen, E.F.; Goddard, T.D.; Huang, C.C.; Couch, G.S.; Greenblatt, D.M.; Meng, E.C.; Ferrin, T.E. UCSF Chimera? A Visualization System for Exploratory Research and Analysis. J. Comput. Chem. 2004, 25, 1605–1612. [Google Scholar] [CrossRef]
- Laskowski, R.A.; Swindells, M.B. LigPlot+: Multiple Ligand–Protein Interaction Diagrams for Drug Discovery. J. Chem. Inf. Model. 2011, 51, 2778–2786. [Google Scholar] [CrossRef]
- Dassault Systèmes; BIOVIA, Discovery Studio: Vélizy-Villacoublay, France, 2021.
- Pranzini, E.; Pardella, E.; Muccillo, L.; Leo, A.; Nesi, I.; Santi, A.; Parri, M.; Zhang, T.; Uribe, A.H.; Lottini, T.; et al. SHMT2-Mediated Mitochondrial Serine Metabolism Drives 5-FU Resistance by Fueling Nucleotide Biosynthesis. Cell Rep. 2022, 40, 111233. [Google Scholar] [CrossRef]
- Maccari, R.; del Corso, A.; Paoli, P.; Adornato, I.; Lori, G.; Balestri, F.; Cappiello, M.; Naß, A.; Wolber, G.; Ottanà, R. An Investigation on 4-Thiazolidinone Derivatives as Dual Inhibitors of Aldose Reductase and Protein Tyrosine Phosphatase 1B, in the Search for Potential Agents for the Treatment of Type 2 Diabetes Mellitus and Its Complications. Bioorganic Med. Chem. Lett. 2018, 28, 3712–3720. [Google Scholar] [CrossRef]
- Nandi, S.; Saxena, M. Potential Inhibitors of Protein Tyrosine Phosphatase (PTP1B) Enzyme: Promising Target for Type-II Diabetes Mellitus. Curr. Top. Med. Chem. 2020, 20, 2692–2707. [Google Scholar] [CrossRef] [PubMed]
- Singh, J.P.; Lin, M.-J.; Hsu, S.-F.; Peti, W.; Lee, C.-C.; Meng, T.-C. Crystal Structure of TCPTP Unravels an Allosteric Regulatory Role of Helix A7 in Phosphatase Activity. Biochemistry 2021, 60, 3856–3867. [Google Scholar] [CrossRef] [PubMed]
- Brewer, P.D.; Habtemichael, E.N.; Romenskaia, I.; Mastick, C.C.; Coster, A.C.F. Insulin-Regulated Glut4 Translocation. J. Biol. Chem. 2014, 289, 17280–17298. [Google Scholar] [CrossRef]
- Ryder, J.W.; Kawano, Y.; Chibalin, A.V.; Rincón, J.; Tsao, T.S.; Stenbit, A.E.; Combatsiaris, T.; Yang, J.; Holman, G.D.; Charron, M.J.; et al. In Vitro Analysis of the Glu-Cose-Transport System in GLUT4-Null Skeletal Muscle. Biochem. J. 1999, 342, 321–328. [Google Scholar] [CrossRef]
- Divakaruni, A.S.; Wiley, S.E.; Rogers, G.W.; Andreyev, A.Y.; Petrosyan, S.; Loviscach, M.; Wall, E.A.; Yadava, N.; Heuck, A.P.; Ferrick, D.A.; et al. Thiazolidinediones Are Acute, Specific Inhibitors of the Mitochondrial Pyruvate Carrier. Proc. Natl. Acad. Sci. USA 2013, 110, 5422–5427. [Google Scholar] [CrossRef] [PubMed]
- Huneif, M.A.; Alshehri, D.B.; Alshaibari, K.S.; Dammaj, M.Z.; Mahnashi, M.H.; Majid, S.U.; Javed, M.A.; Ahmad, S.; Rashid, U.; Sadiq, A. Design, Synthesis and Bioevaluation of New Vanillin Hybrid as Multitarget Inhibitor of α-Glucosidase, α-Amylase, PTP-1B and DPP4 for the Treatment of Type-II Diabetes. Biomed. Pharmacother. 2022, 150, 113038. [Google Scholar] [CrossRef]
- Zhang, Z.-Y. Drugging the Undruggable: Therapeutic Potential of Targeting Protein Tyrosine Phosphatases. Acc. Chem. Res. 2017, 50, 122–129. [Google Scholar] [CrossRef]
- Posner, B.I. Insulin Signalling: The Inside Story. Can. J. Diabetes 2017, 41, 108–113. [Google Scholar] [CrossRef]
- Teimouri, M.; Hosseini, H.; ArabSadeghabadi, Z.; Babaei-Khorzoughi, R.; Gorgani-Firuzjaee, S.; Meshkani, R. The Role of Protein Tyrosine Phosphatase 1B (PTP1B) in the Pathogenesis of Type 2 Diabetes Mellitus and Its Complications. J. Physiol. Biochem. 2022, 78, 307–322. [Google Scholar] [CrossRef]
- Koren, S.; Fantus, I.G. Inhibition of the Protein Tyrosine Phosphatase PTP1B: Potential Therapy for Obesity, Insulin Resistance and Type-2 Diabetes Mellitus. Best Pract. Res. Clin. Endocrinol. Metab. 2007, 21, 621–640. [Google Scholar] [CrossRef] [PubMed]
- SOMWAR, R.; KIM, D.Y.; SWEENEY, G.; HUANG, C.; NIU, W.; LADOR, C.; RAMLAL, T.; KLIP, A. GLUT4 Translocation Precedes the Stimulation of Glucose Uptake by Insulin in Muscle Cells: Potential Activation of GLUT4 via P38 Mitogen-Activated Protein Kinase. Biochem. J. 2001, 359, 639. [Google Scholar] [CrossRef]
- Nicholls, D.G. Spare Respiratory Capacity, Oxidative Stress and Excitotoxicity. Biochem. Soc. Trans. 2009, 37, 1385–1388. [Google Scholar] [CrossRef] [PubMed]
- Marchetti, P.; Fovez, Q.; Germain, N.; Khamari, R.; Kluza, J. Mitochondrial Spare Respiratory Capacity: Mechanisms, Regulation, and Significance in Non-transformed and Cancer Cells. FASEB J. 2020, 34, 13106–13124. [Google Scholar] [CrossRef] [PubMed]
- Kelley, D.E.; He, J.; Menshikova, E.V.; Ritov, V.B. Dysfunction of Mitochondria in Human Skeletal Muscle in Type 2 Diabetes. Diabetes 2002, 51, 2944–2950. [Google Scholar] [CrossRef]
- Lee, A.Y.; Chung, S.K.; Chung, S.S. Demonstration That Polyol Accumulation Is Responsible for Diabetic Cataract by the Use of Transgenic Mice Expressing the Aldose Reductase Gene in the Lens. Proc. Natl. Acad. Sci. USA 1995, 92, 2780–2784. [Google Scholar] [CrossRef]
- Hwang, Y.C.; Kaneko, M.; Bakr, S.; Liao, H.; Lu, Y.; Lewis, E.R.; Yan, S.; Ii, S.; Itakura, M.; Rui, L.; et al. Central Role for Aldose Reductase Pathway in Myocardial Ischemic Injury. FASEB J. 2004, 18, 1192–1199. [Google Scholar] [CrossRef]
- Kador, P.F.; Wyman, M.; Oates, P.J. Aldose Reductase, Ocular Diabetic Complications and the Development of Topical Kinostat®. Prog. Retin. Eye Res. 2016, 54, 1–29. [Google Scholar] [CrossRef]


| Compound | IC50 (µM) a | |
|---|---|---|
| PTP1B | AKR1B1 | |
| avarol (1) | 42.2 ± 18 | 0.52 ± 0.19 |
| avarone (2) | 6.7 ± 0.6 | 0.078 ± 0.017 |
| 3-methylaminoavarone (3) | 15.2 ± 2.1 | 73 ± 15 |
| 4-methylaminoavarone (4) | 21.6 ± 1.0 | 62 ± 8 |
| p-benzoquinone | 38.9 ± 5.2 ¥ | 1.93 ‡ |
| dysidine (5) | 6.7 ± 0.1 § | ------- |
| vanadate | 0.4 ± 0.01 # | ------- |
| epalrestat | ------- | 0.13 ± 0.03 |
Disclaimer/Publisher’s Note: The statements, opinions and data contained in all publications are solely those of the individual author(s) and contributor(s) and not of MDPI and/or the editor(s). MDPI and/or the editor(s) disclaim responsibility for any injury to people or property resulting from any ideas, methods, instructions or products referred to in the content. |
© 2023 by the authors. Licensee MDPI, Basel, Switzerland. This article is an open access article distributed under the terms and conditions of the Creative Commons Attribution (CC BY) license (https://creativecommons.org/licenses/by/4.0/).
Share and Cite
Casertano, M.; Genovese, M.; Santi, A.; Pranzini, E.; Balestri, F.; Piazza, L.; Del Corso, A.; Avunduk, S.; Imperatore, C.; Menna, M.; et al. Evidence of Insulin-Sensitizing and Mimetic Activity of the Sesquiterpene Quinone Avarone, a Protein Tyrosine Phosphatase 1B and Aldose Reductase Dual Targeting Agent from the Marine Sponge Dysidea avara. Pharmaceutics 2023, 15, 528. https://doi.org/10.3390/pharmaceutics15020528
Casertano M, Genovese M, Santi A, Pranzini E, Balestri F, Piazza L, Del Corso A, Avunduk S, Imperatore C, Menna M, et al. Evidence of Insulin-Sensitizing and Mimetic Activity of the Sesquiterpene Quinone Avarone, a Protein Tyrosine Phosphatase 1B and Aldose Reductase Dual Targeting Agent from the Marine Sponge Dysidea avara. Pharmaceutics. 2023; 15(2):528. https://doi.org/10.3390/pharmaceutics15020528
Chicago/Turabian StyleCasertano, Marcello, Massimo Genovese, Alice Santi, Erica Pranzini, Francesco Balestri, Lucia Piazza, Antonella Del Corso, Sibel Avunduk, Concetta Imperatore, Marialuisa Menna, and et al. 2023. "Evidence of Insulin-Sensitizing and Mimetic Activity of the Sesquiterpene Quinone Avarone, a Protein Tyrosine Phosphatase 1B and Aldose Reductase Dual Targeting Agent from the Marine Sponge Dysidea avara" Pharmaceutics 15, no. 2: 528. https://doi.org/10.3390/pharmaceutics15020528
APA StyleCasertano, M., Genovese, M., Santi, A., Pranzini, E., Balestri, F., Piazza, L., Del Corso, A., Avunduk, S., Imperatore, C., Menna, M., & Paoli, P. (2023). Evidence of Insulin-Sensitizing and Mimetic Activity of the Sesquiterpene Quinone Avarone, a Protein Tyrosine Phosphatase 1B and Aldose Reductase Dual Targeting Agent from the Marine Sponge Dysidea avara. Pharmaceutics, 15(2), 528. https://doi.org/10.3390/pharmaceutics15020528