3.1.1. Delimitation of Pseudoternary Phase Diagram for Each Surfactant
The results obtained from
Figures S4–S7 indicate that the mixtures of various surfactants, at appropriate proportions to achieve a required HLB of 6.4, failed to generate spontaneously forming microemulsion systems. It is plausible that the application of external energies such as elevated temperatures or shear forces might promote the formation of microemulsions in some of the compositions. Nonetheless, to ensure greater system stability and reduced the complexity of the production process, it is preferable that microemulsions form spontaneously. Thus, it can be concluded that the HLB value of 6.4 and/or the surfactants used to achieve this condition are unsuitable for D-limonene.
Subsequently, it was observed that only a formulation (
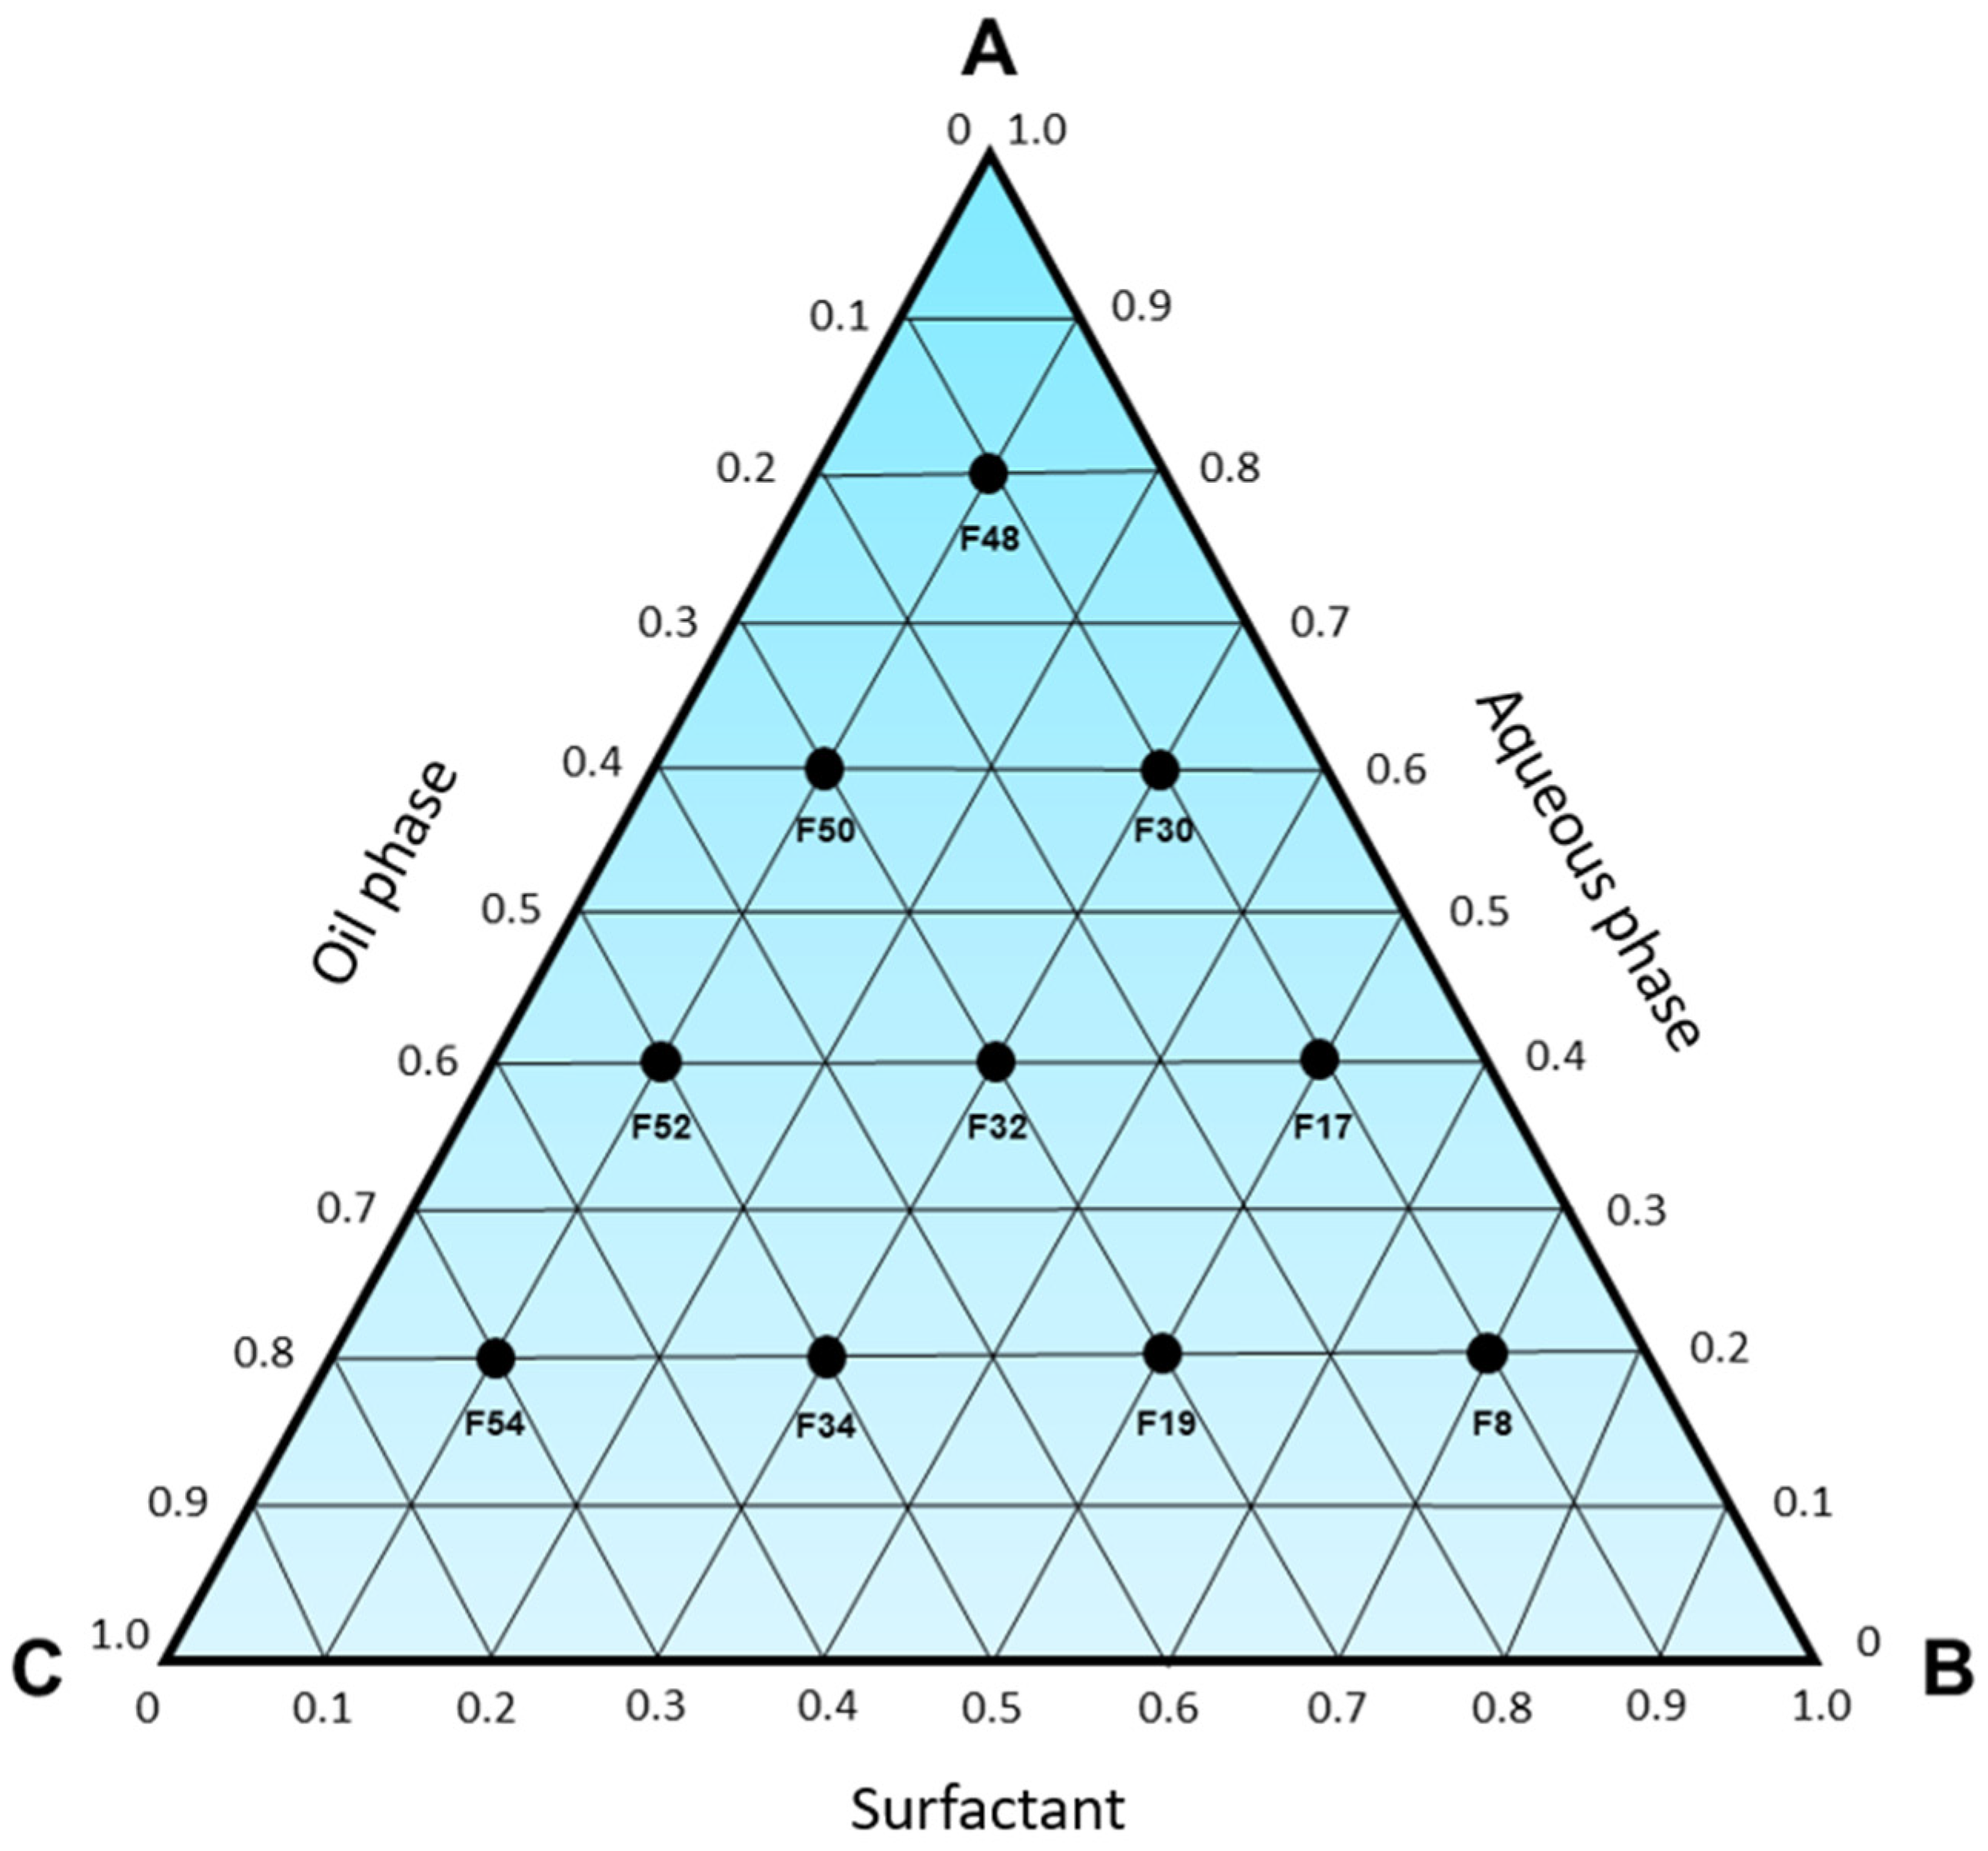
Figure 2) composed of 20% aqueous phase, 10% D-limonene, and 70% surfactant (67.65% Labrasol
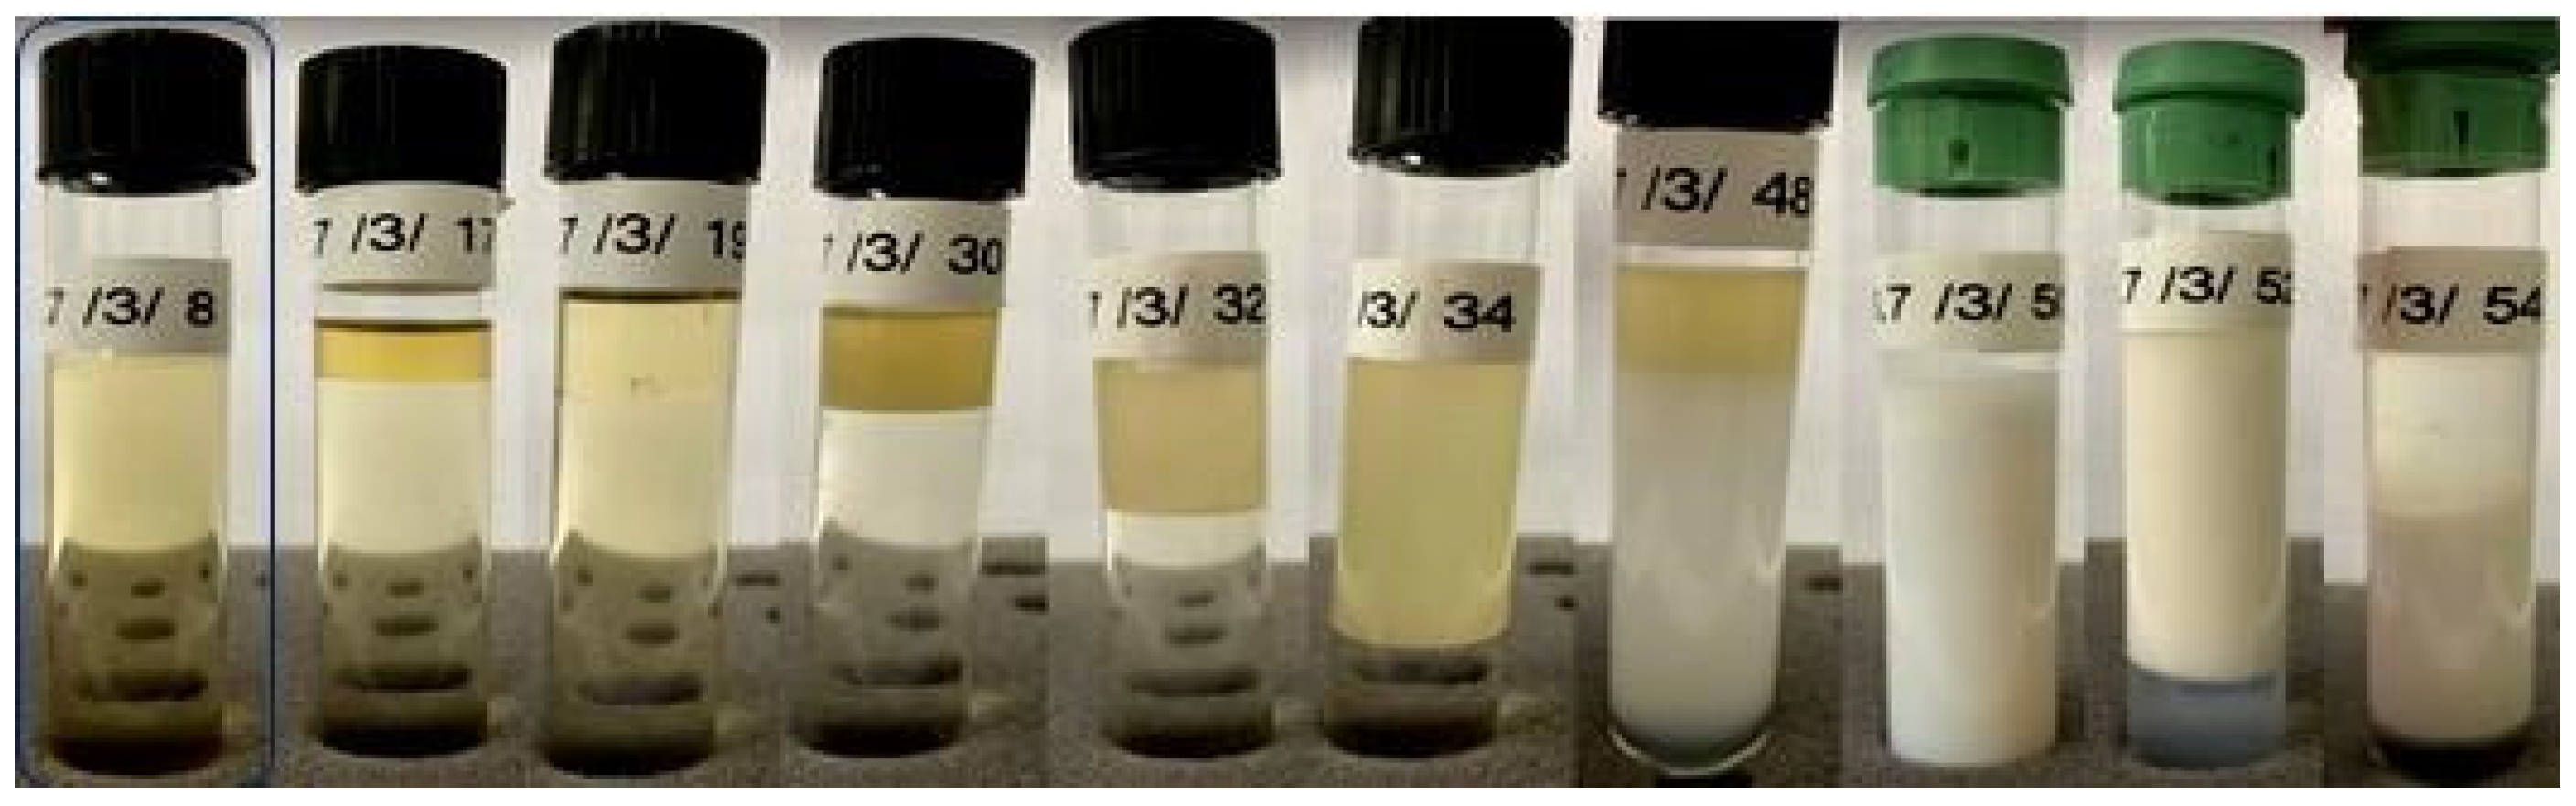
® with 32.35% Span 85) was capable of spontaneously forming a microemulsion considering an HLB requirement of 8.7, while the other compositions exhibited turbidity, phase separation, or resulted in emulsions and lotions (
Figures S8–S12). Moreover, it was also evident that after 24 h of preparation, formulation 8 remained stable, while formulations 17, 19, 30, 32, and 34 exhibited phase separation, with at least one of them being transparent, homogeneous, and low viscosity, which are well-established characteristics of microemulsions.
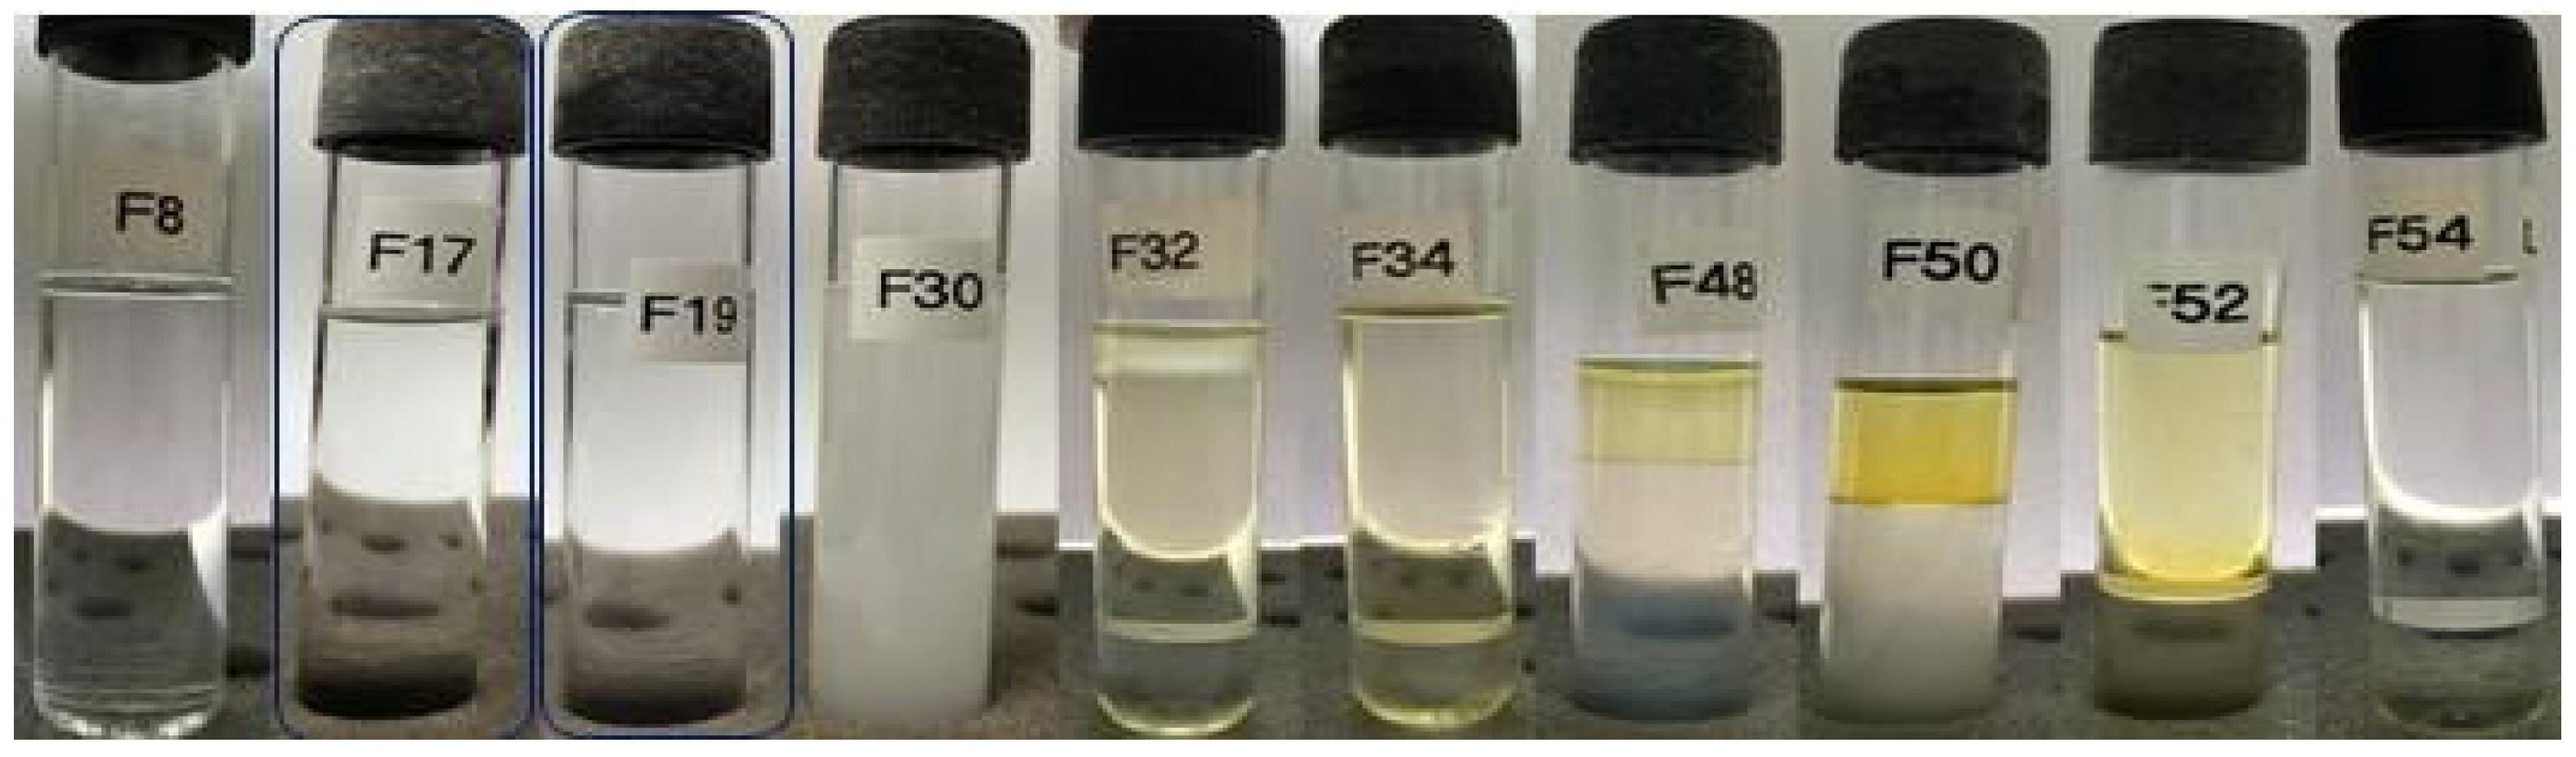
Afterward, the formulations obtained using a surfactant mixture to attain an HLB requirement of 12 (
Figures S13 and S14) were evaluated. It was observed that Labrasol
® as the sole surfactant (
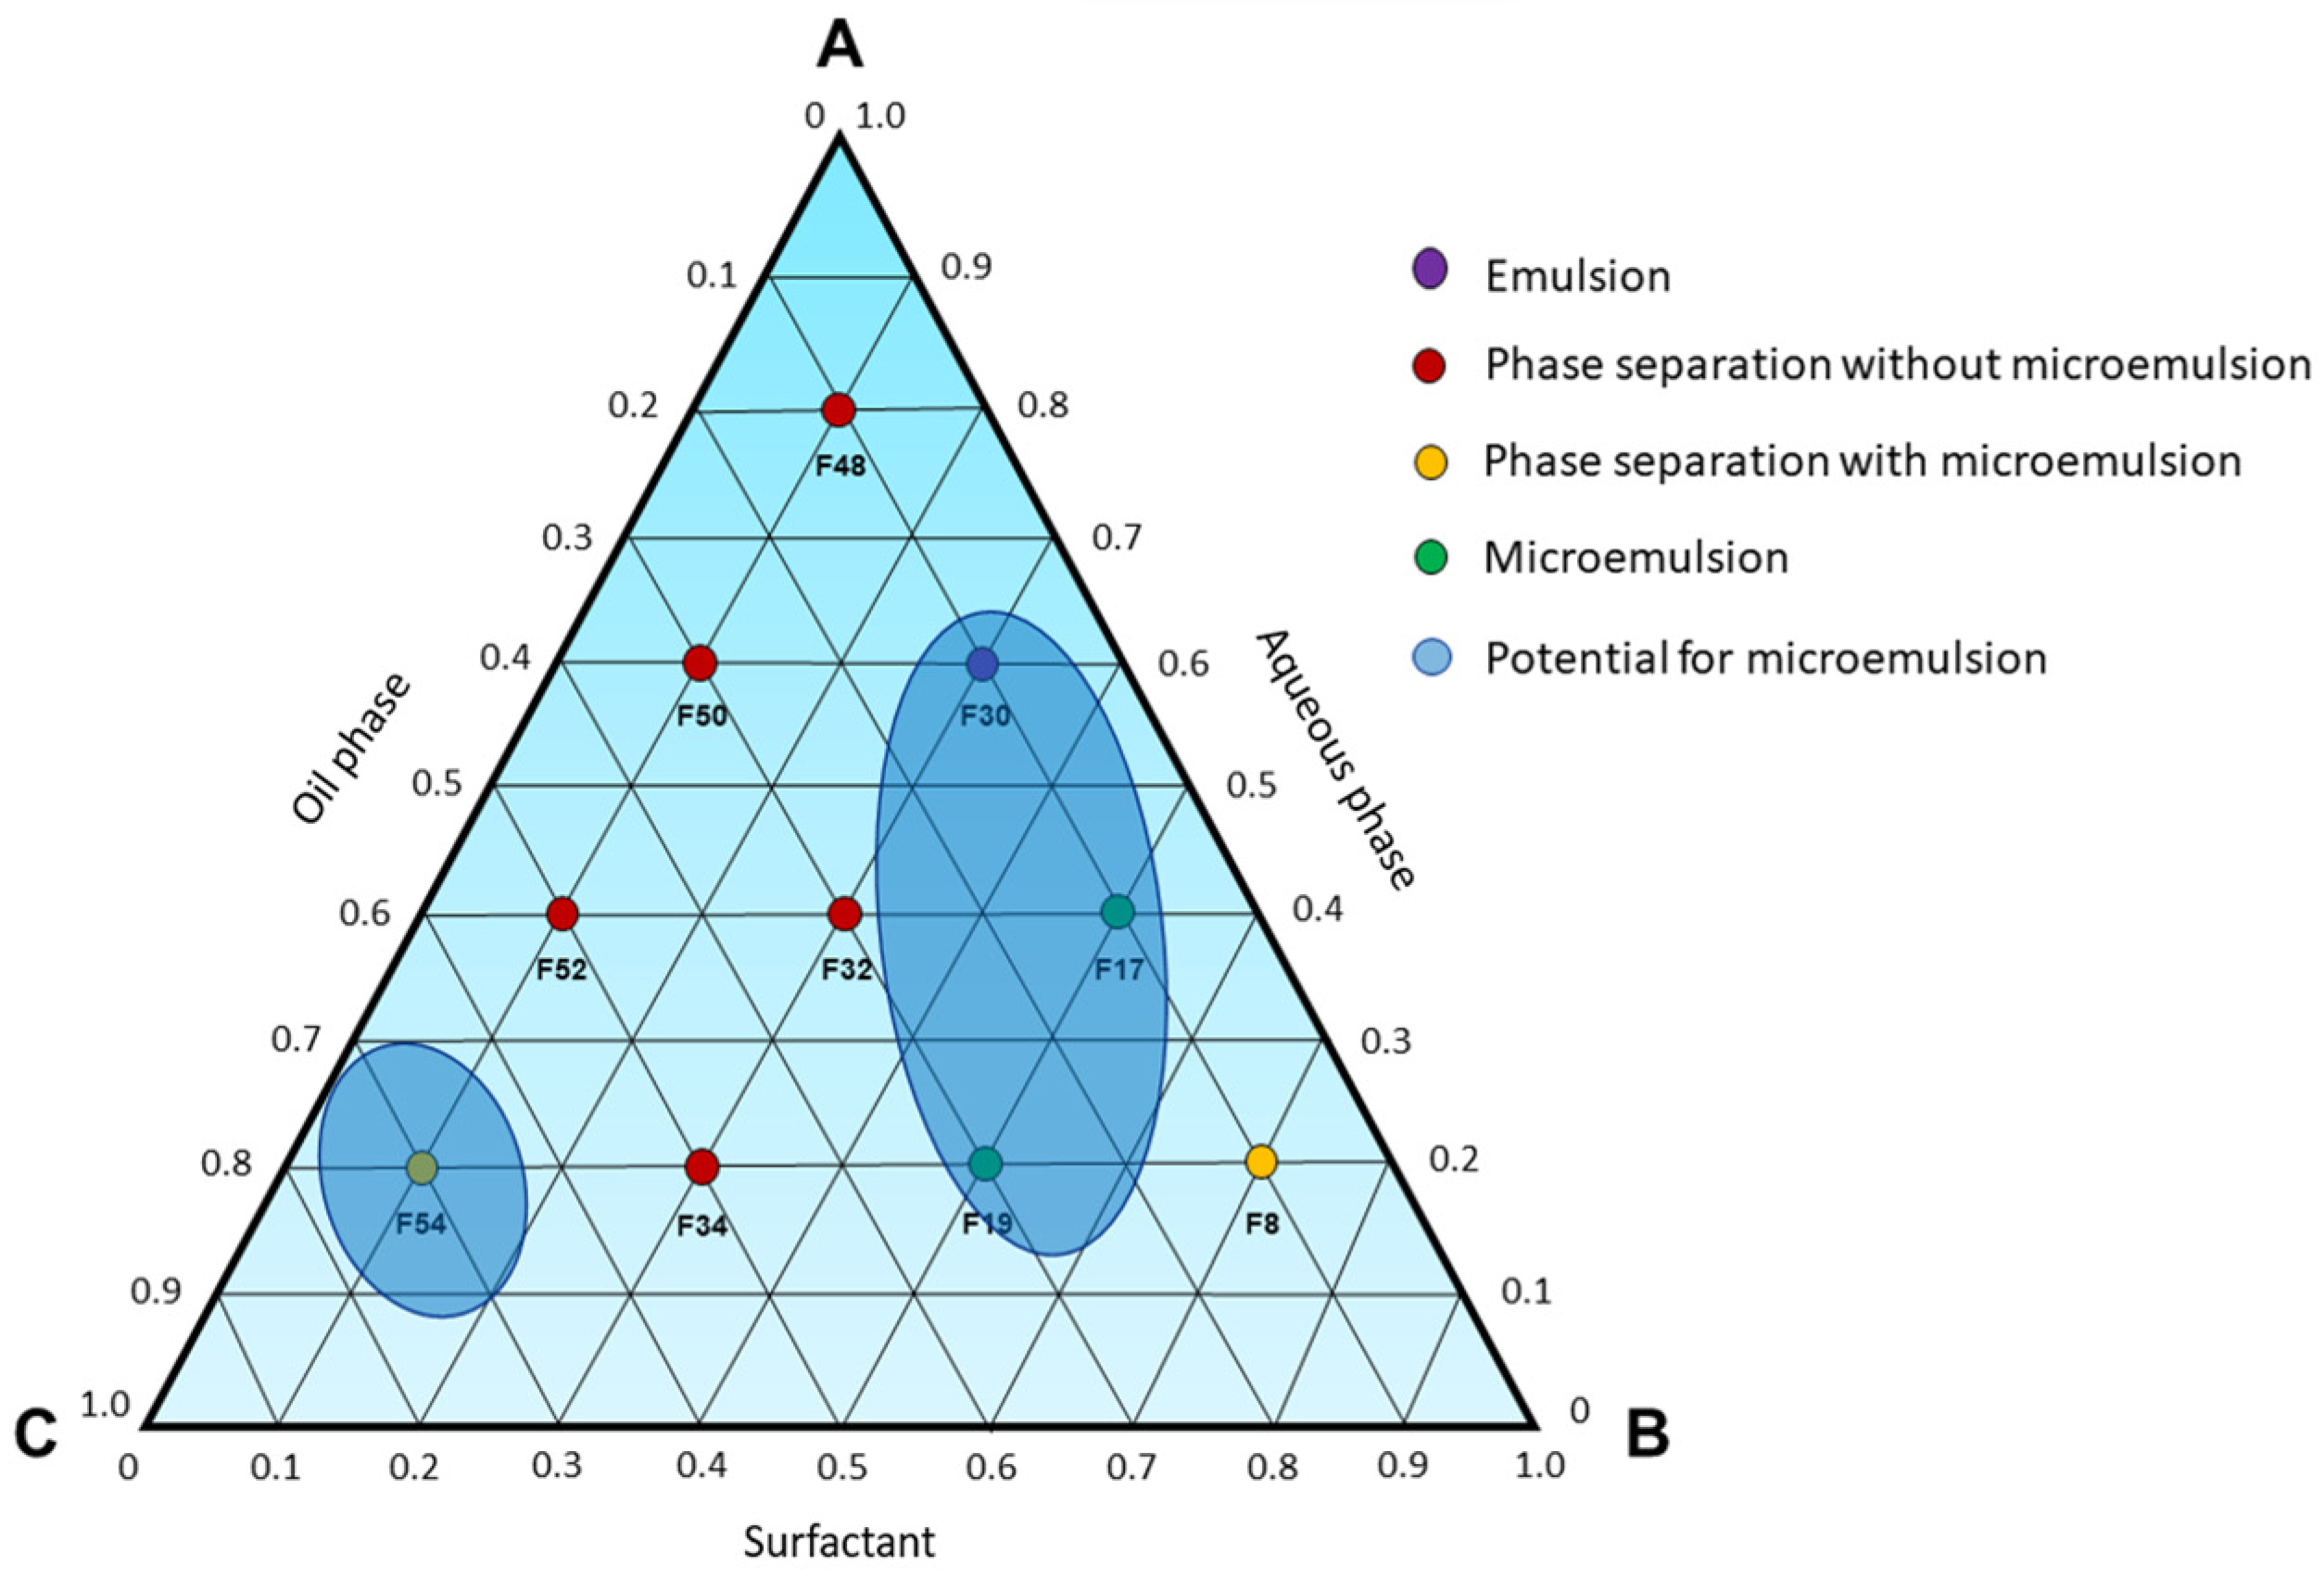
Figure 3) was able to generate microemulsion systems, as demonstrated by formulations 17 (40% aqueous phase, 10% D-limonene, and 50% surfactant) and 19 (20% aqueous phase, 30% D-limonene, and 50% surfactant). Therefore, it is reasonable to conclude that the use of Labrasol
® is likely associated with the formation of microemulsions since, among all the evaluated combinations, three microemulsions were achieved using this surfactant, which was rationally chosen based on the definition of an HLB requirement.
Labrasol
®, categorized as caprylocaproyl polyoxylglycerides, represents a non-ionic surfactant with primary utility as a solubilizing agent, a surfactant for microemulsions, and a lightweight foam generator when used in conjunction with pump devices, obviating the necessity for propellants. Its molecular composition encompasses a minor proportion of mono-, di-, and triglycerides, with a predominant presence of PEG-8 (MW 400), along with mono- and diesters derived from caprylic (C8) and capric (C10) acids [
14,
21]. The distinctive structural configuration of Labrasol
®, divergent from the other evaluated surfactants, is presumably instrumental in the achievement of microemulsions. This is substantiated by the inability of Span 85-NV-LQ, Span 80 Pharma-LQ, Span 40 MBAL-PW, and Tween 60 NF MBAL-LQ to facilitate microemulsion formation, even at elevated concentrations.
Furthermore, formulation F8 (
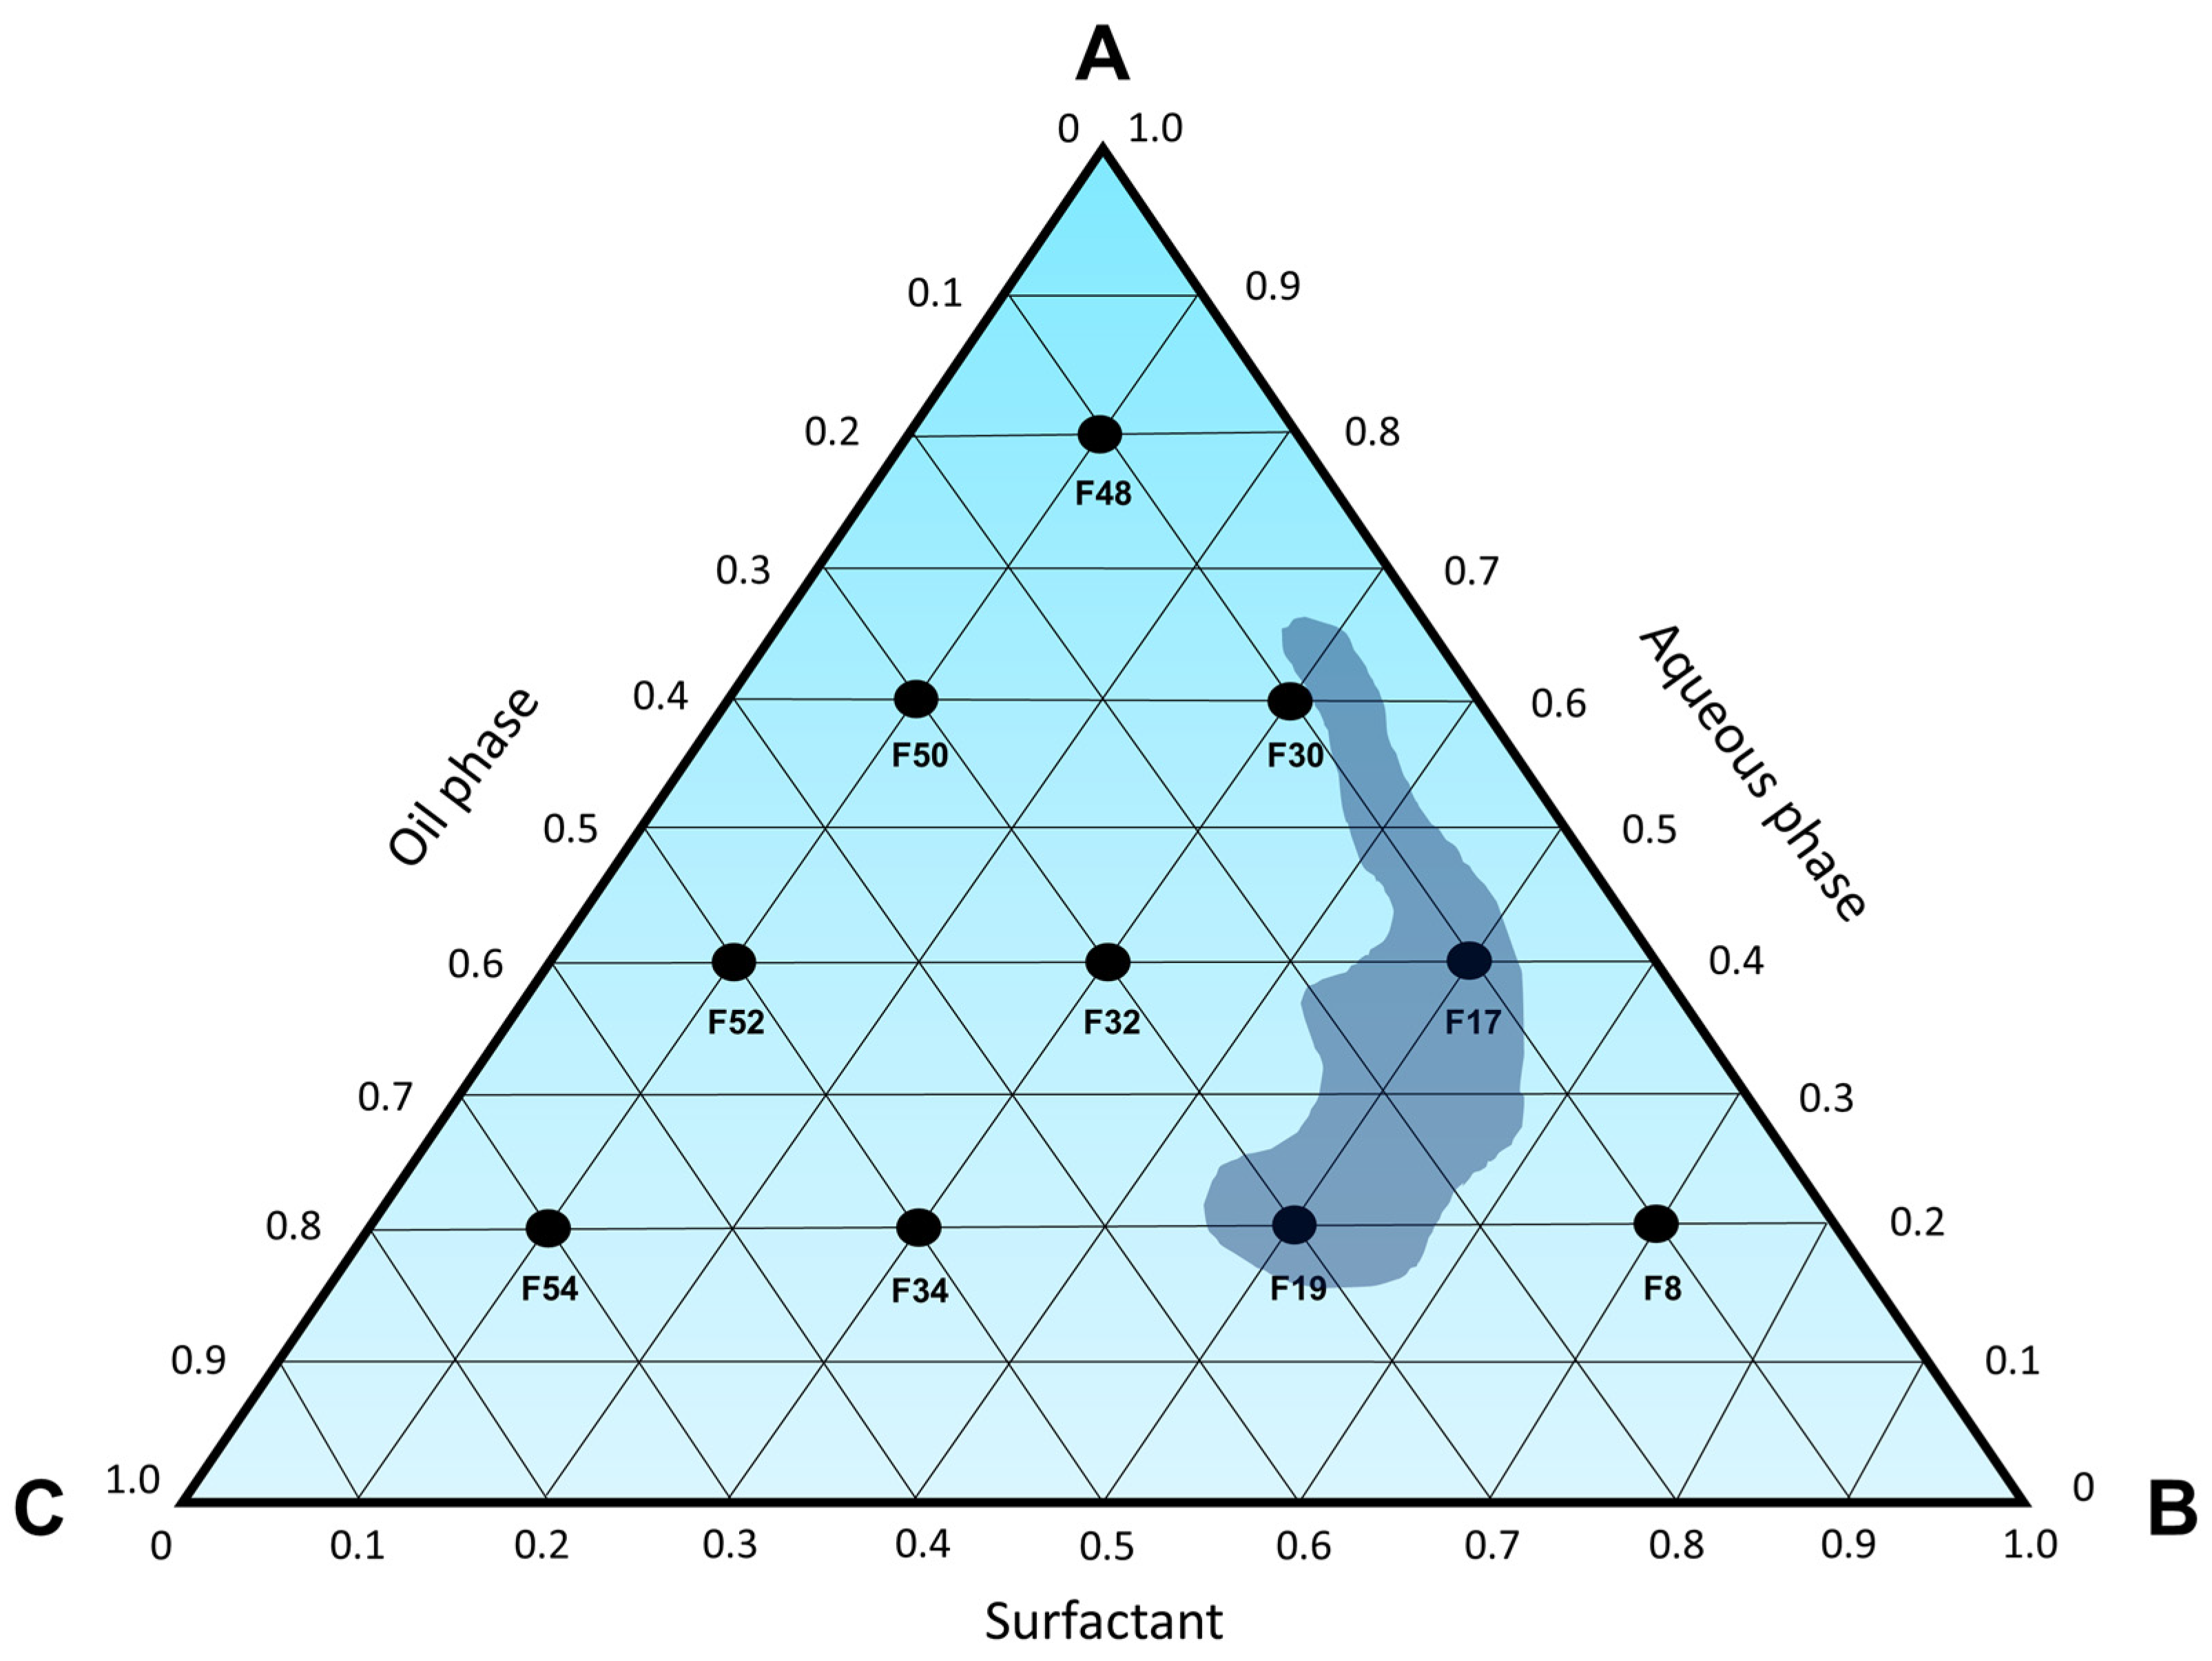
Figure 3) exhibited a slight phase separation, with one of the phases showing characteristics resembling those of a spontaneously formed microemulsion. Similarly, formulation F54 also presents a phase that appears transparent, free of visible particles and low viscosity, indicating that neighboring formulations in the pseudoternary phase diagram could potentially yield spontaneously formed microemulsions. Based on the findings in
Figure 3, a ternary phase diagram (
Figure 4) was constructed to identify microemulsion regions, as well as regions that will be investigated by the titration method.
Despite the fact that formulations with over 50% surfactant can lead to micellar systems, it is well-established that microemulsions typically form spontaneously with high concentrations of surfactants, sometimes necessitating the inclusion of a co-surfactant [
3,
4]. Moreover, it is widely recognized that the curvature, and consequently, the sizes of micelles formed in a micellar system differ from those in microemulsions. Micelles in microemulsions are typically smaller, resulting in a heightened solubilizing capacity for the system [
22].
This holds particular significance for D-limonene formulations, as it is advantageous for the formulation to possess the capability to incorporate the highest possible concentration of the essential oil, especially considering its commonly elevated therapeutic dosages (25 to 300 mg/kg of body weight) [
1,
23,
24,
25]. Consequently, the approach to developing microemulsions is more compelling because it theoretically allows for a higher concentration of D-limonene. This, in turn, facilitates the administration of a smaller final product volume, presenting an intriguing strategy for this component.
Therefore, based on the findings so far, it can be inferred that Labrasol® plays a crucial role in achieving microemulsions, as it was responsible for the formation of a microemulsion when used in its entirety or in combination with Span 85. Given the greater ease of the process and formulation, Labrasol® was chosen as the sole surfactant for the formulations.
3.1.2. Titration Method
At the end of each addition of water in the titration method, the formation or absence of microemulsions was observed. All the microemulsions obtained are depicted in
Figure 5.
Figure S15 depicts the characteristics of the formulations obtained after the addition of 10 mL of water, followed by homogenization, in the first titration process. Image A1 represents a mixture of 55.0% D-limonene with 45.0% Labrasol
®, and despite being a transparent, homogeneous, and low viscosity solution, it cannot be considered a microemulsion since it lacks an aqueous phase in its composition. Similarly, the other formulations (A2–A20) did not yield spontaneously formed microemulsions, as they all exhibit a milky appearance. Consequently, none of these compositions were considered for the continuation of this study.
Figure S16 presents the characteristics of the formulations obtained after the addition of 10 mL of water in the second titration, followed by homogenization. Image B1 represents a mixture of 40.0% D-limonene with 60.0% Labrasol
®, which does not meet the criteria for a microemulsion. Notably, formulation B4 (30.8% D-limonene, 46.2% Labrasol
®, and 23.1% water) resulted in a spontaneously formed microemulsion, as the simple mixing of the three components provided a homogeneous, transparent, and low viscosity solution, as illustrated in
Figure 5. The remaining compositions (B2, B3, B5–B20) were not considered for further study due to their milky appearance.
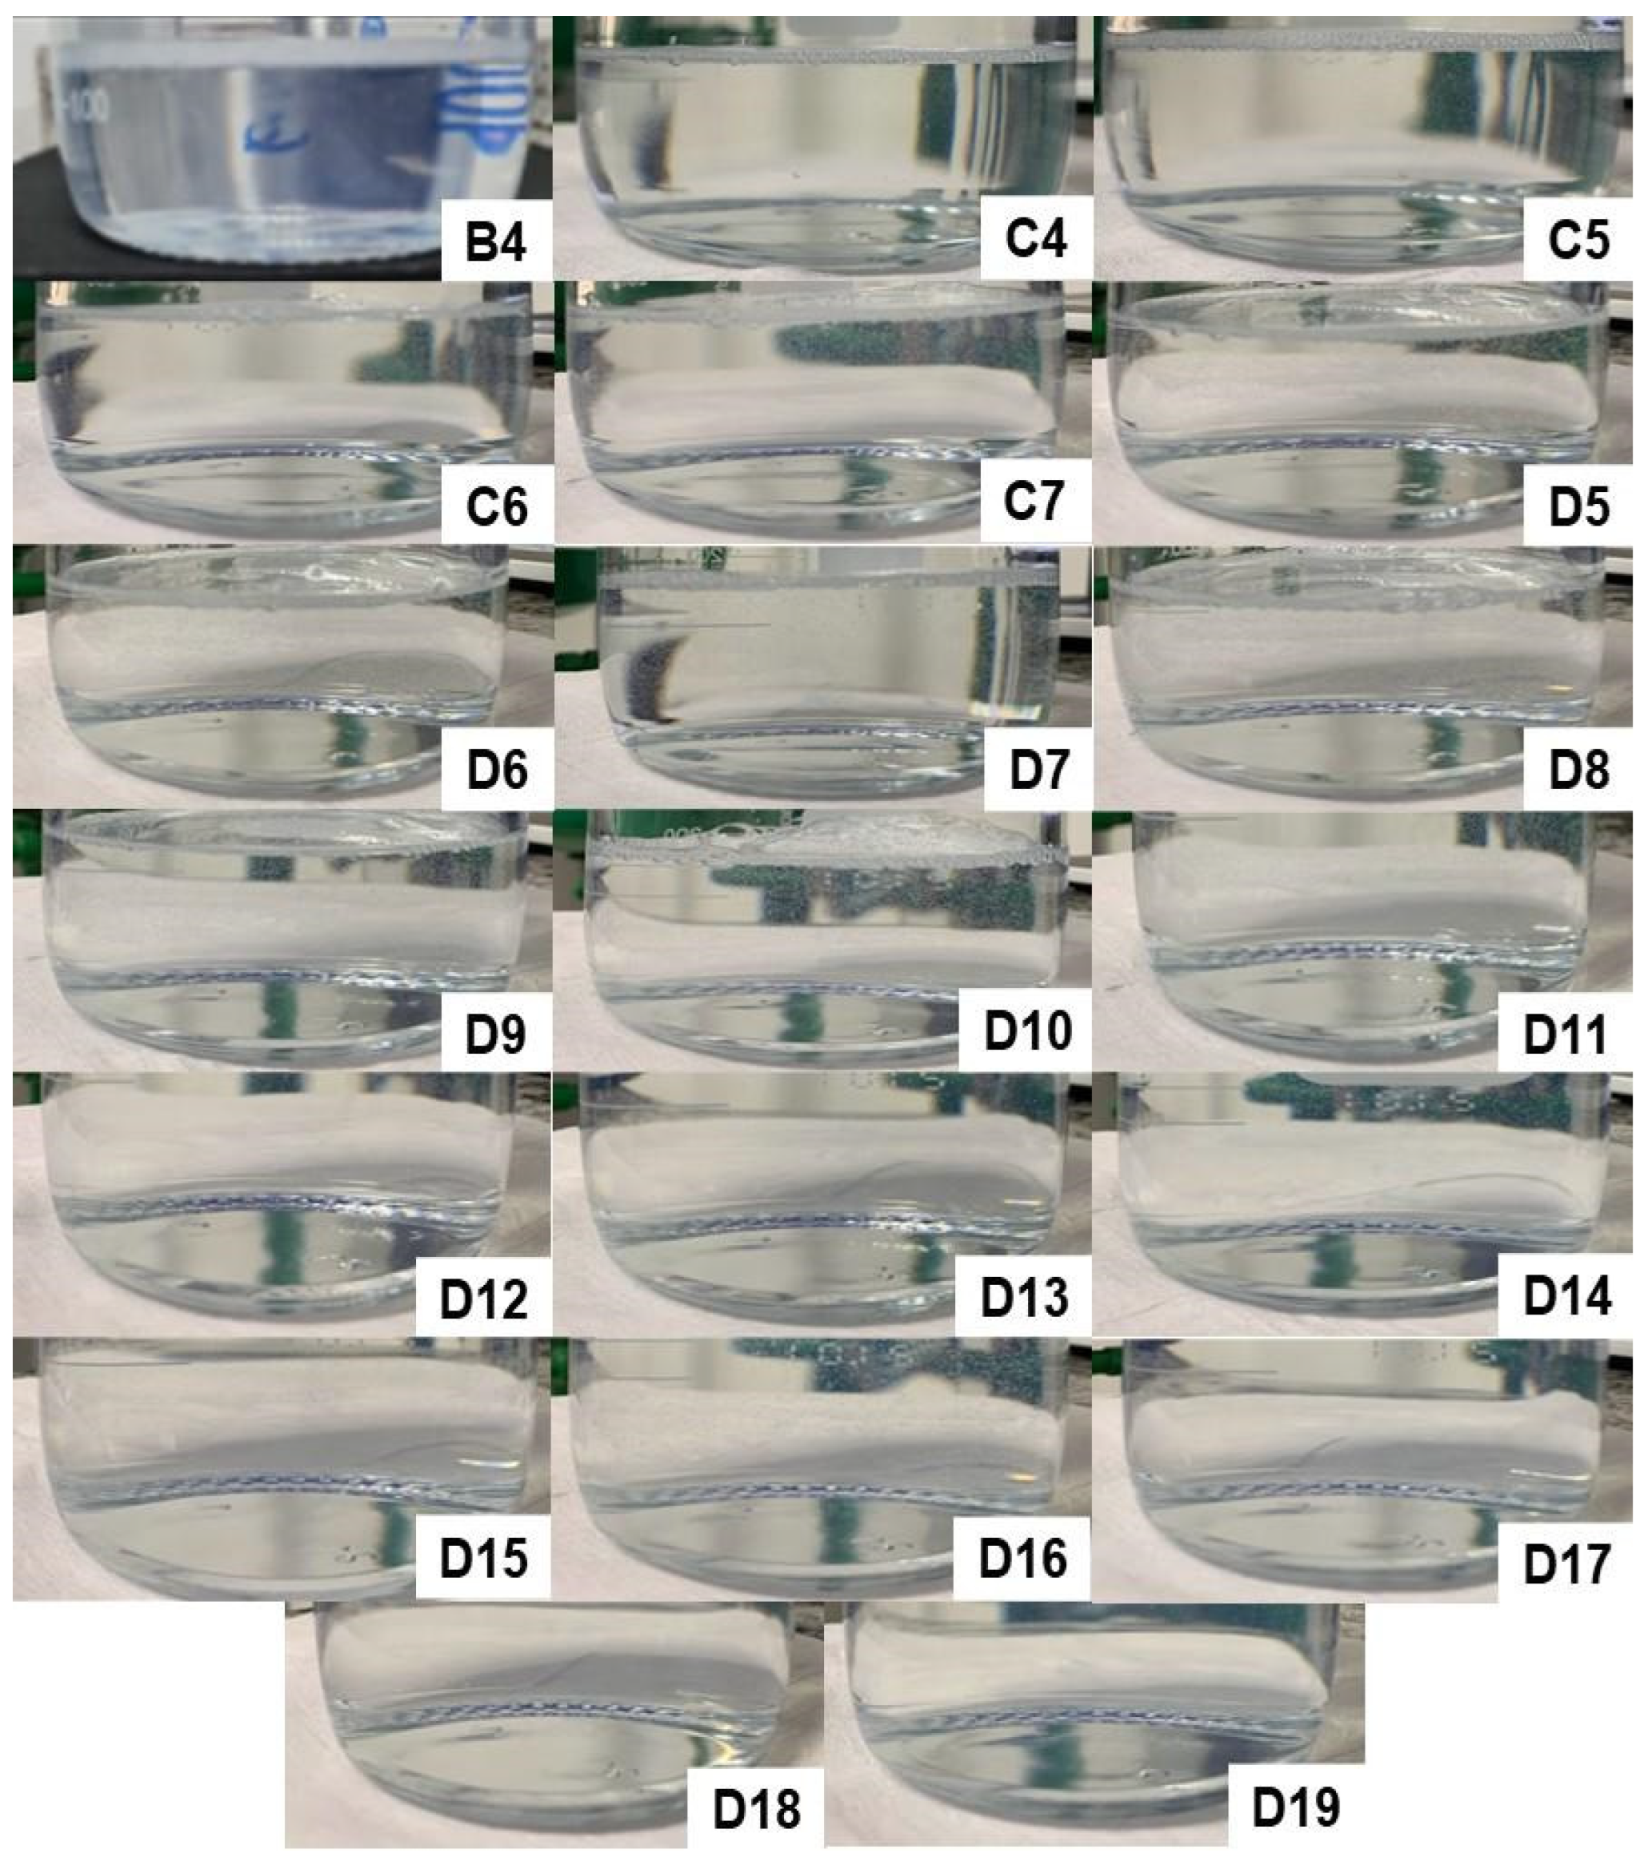
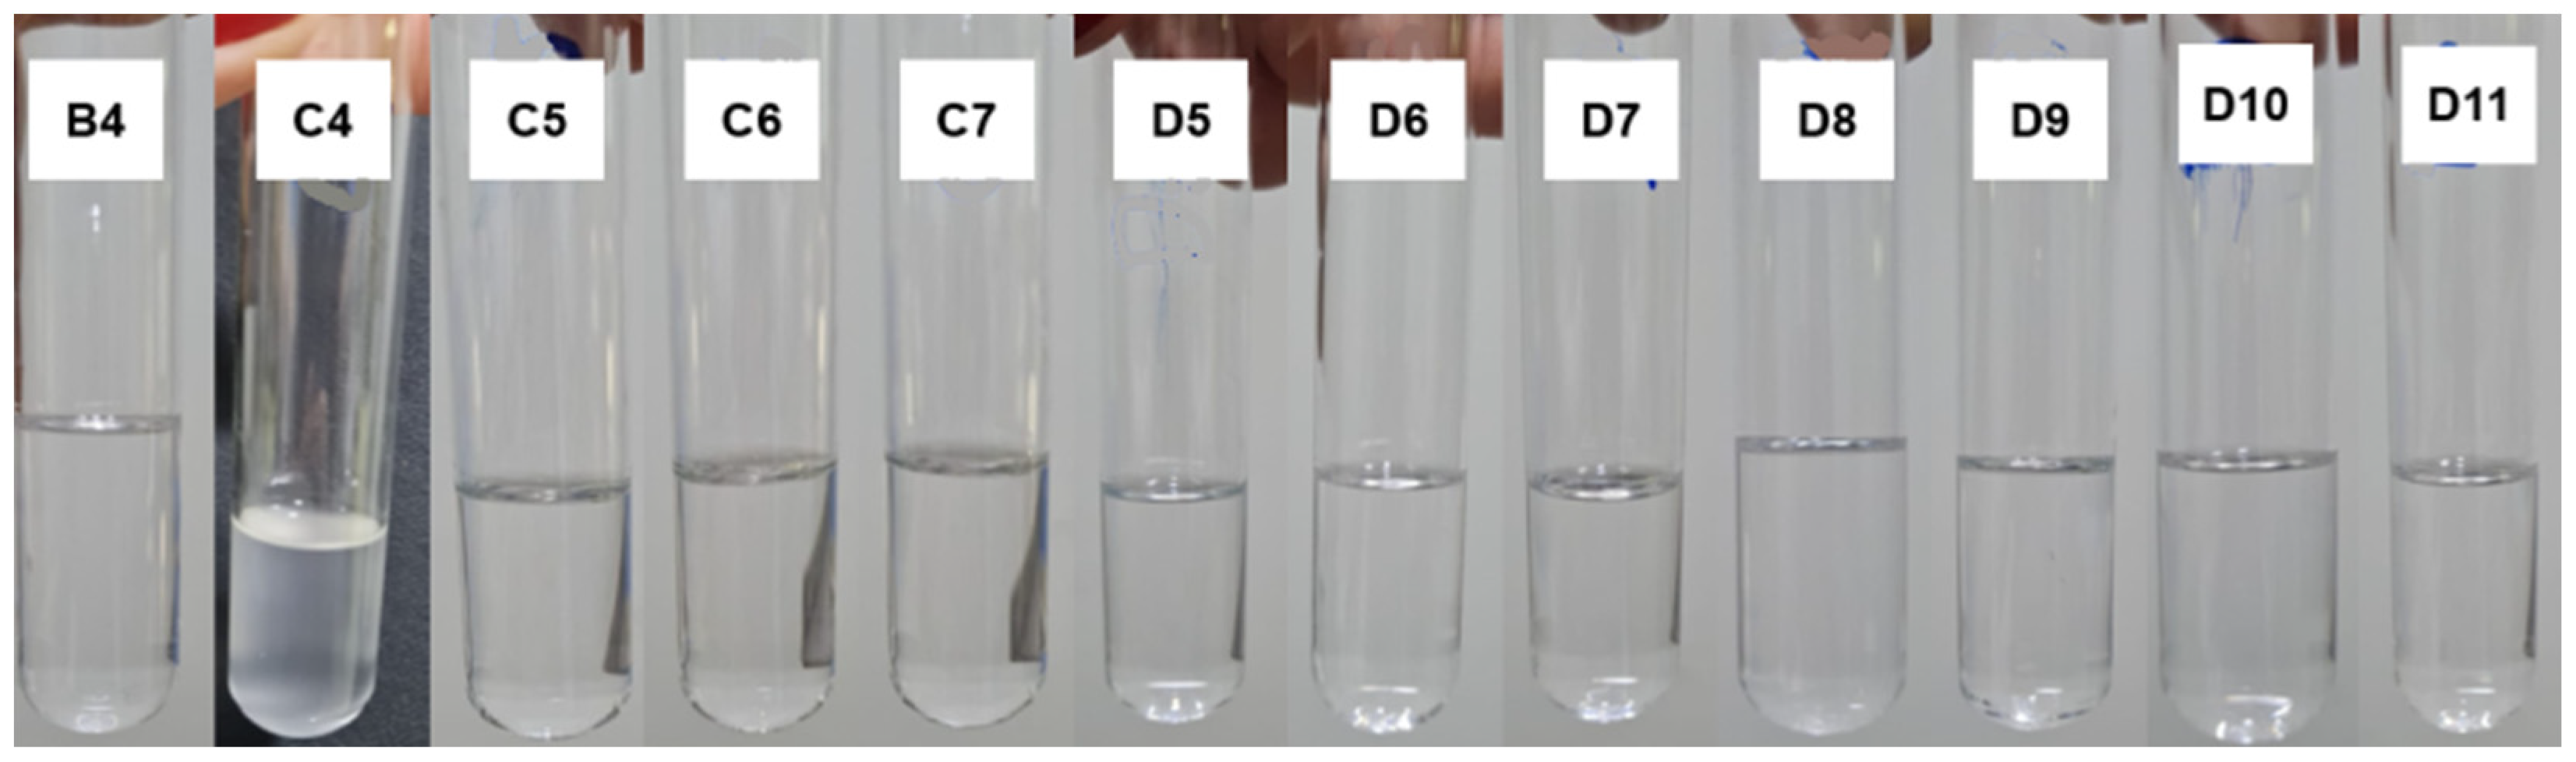
Figure S17 illustrates the characteristics of the formulations obtained after adding 10 mL of water in the third titration process, followed by homogenization. Image C1 represents a mixture of 30.0% D-limonene with 70.0% Labrasol
®, which also cannot be considered a microemulsion. It was observed that formulations C4 (23.1% D-limonene, 53.8% Labrasol
®, and 23.1% water), C5 (21.4% D-limonene, 50.0% Labrasol
®, and 28.6% water), C6 (20.0% D-limonene, 46.7% Labrasol
®, and 33.3% water), and C7 (18.8% D-limonene, 43.8% Labrasol
®, and 37.5% water) resulted in spontaneously formed microemulsions, as the simple mixing of the three components was able to provide a homogeneous, transparent, and low viscosity solution. The remaining compositions were not considered for the continuation of this study.
Figure S18 depicts the characteristics of the formulations obtained after the addition of 10 mL of water in the fourth titration, followed by homogenization. Image D1 represents a mixture of 20.0% D-limonene with 80.0% Labrasol
®, which also cannot be considered a microemulsion. It can be observed that formulations D5, D6, D7, D8, D9, D10, D11, D12, D13, D14, D15, D16, D17, D18, and D19, whose concentrations are described in
Table 7, resulted in spontaneously formed microemulsions, as the simple mixing of the three components was able to provide a homogeneous, transparent, and low viscosity solution.
During the production process, it was also observed that formulations D5-D15 resulted in a microemulsion in less than 10 s of agitation, while compositions D16-D19 required 60 to 90 s of agitation. Therefore, it can be inferred that these latter compositions required greater mechanical energy for the formation of a microemulsified system and, therefore, are at the limit of the thermodynamic equilibrium condition within the ternary phase diagram. This is also confirmed by the fact that composition D20 was not able to spontaneously form a microemulsion, allowing us to conclude that the entire microemulsion region of the diagram has been explored.
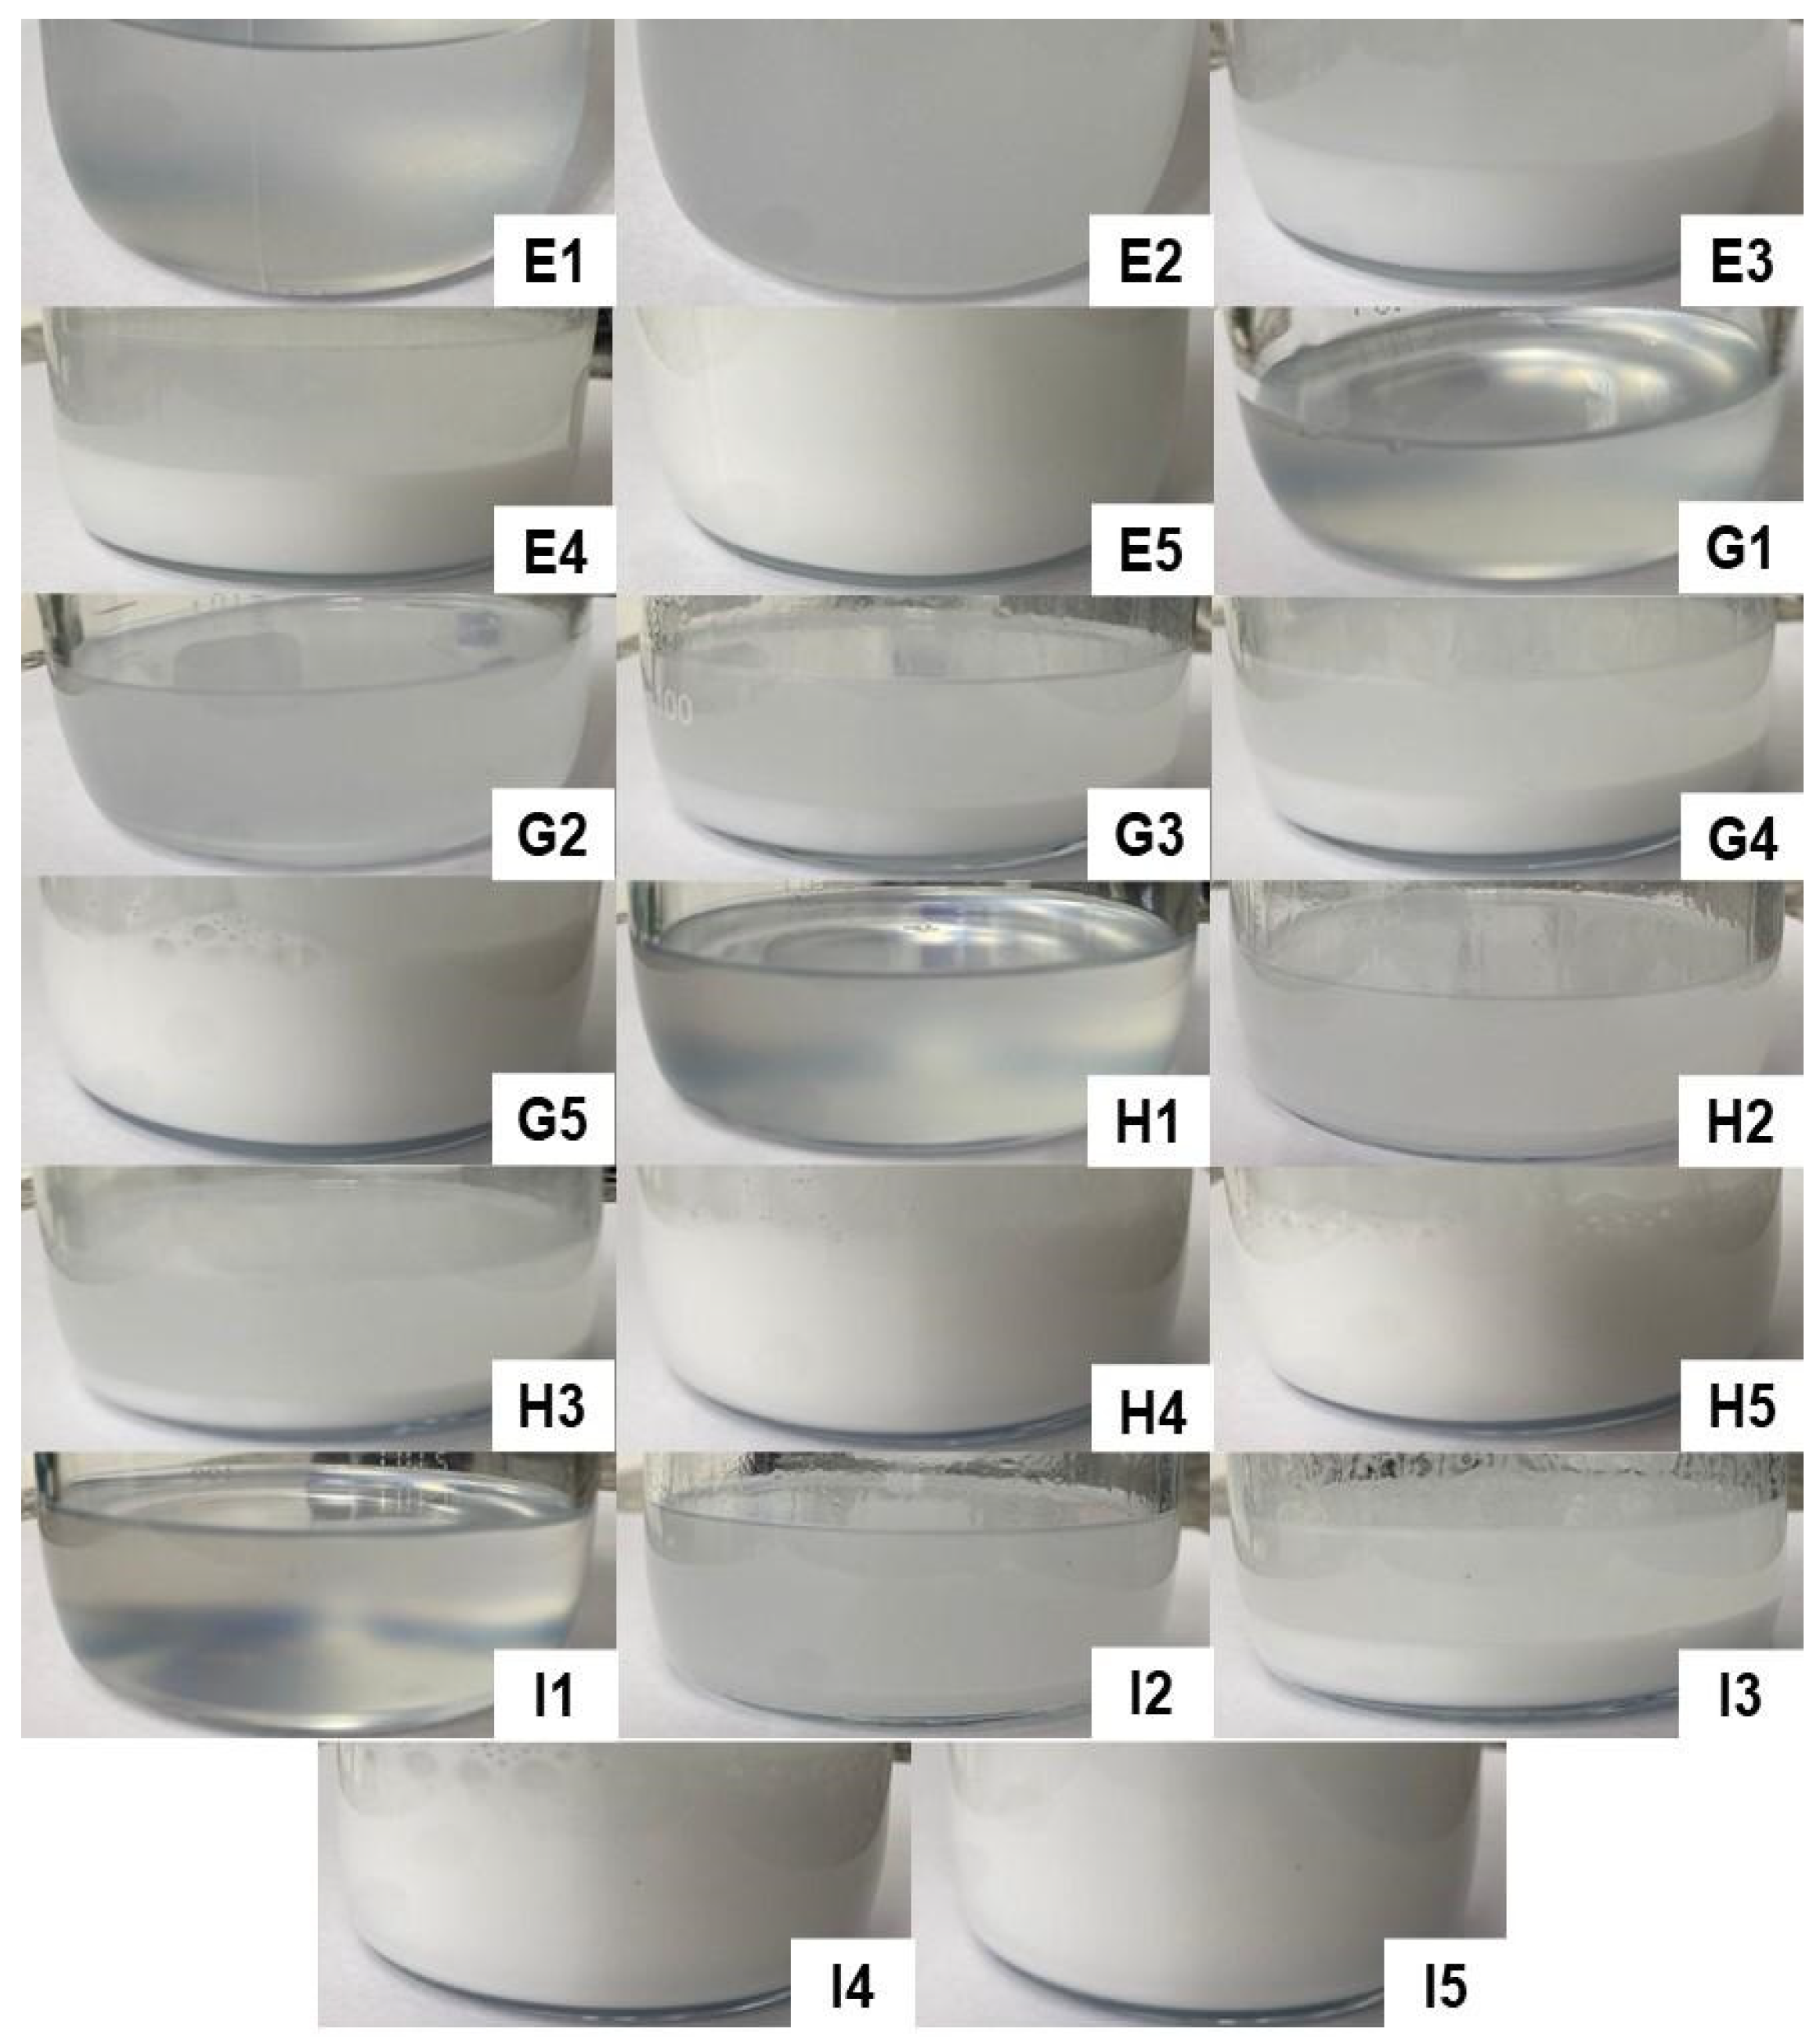
Figure 6 illustrates the formulations obtained in titrations E, G, H, and I, respectively, providing a detailed view of the F54 region. This region was considered interesting since it contained formulations with higher concentrations of D-limonene. However, as can be seen in the images below, none of the compositions resulted in spontaneously formed microemulsions, so some formulations appeared cloudy and/or milky, while others showed phase separation. Therefore, none of the formulations resulting from titrations E, G, H, and I were considered for further study.
Based on what has been presented so far, it is possible to conclude that the microemulsion region of the ternary phase diagram is contained within the concentrations of 7.1 to 30.8% of D-limonene (oil phase), 28.6 to 57.1% of Labrasol
® (surfactant), and 20.0 to 64.3% of water, as represented in
Figure 7 and
Table 7.
It is worth highlighting, as demonstrated in
Table 7, that while microemulsions commonly self-assemble and frequently require high concentrations of surfactants and co-surfactants to significantly reduce the interfacial tension between the oil and aqueous phases [
3,
4], it was possible to formulate a product with desirable properties using only approximately 30% of a single surfactant. In this particular scenario, the bending elastic energy, typically of secondary importance in relation to surface energy, gains greater relevance within microemulsion systems due to their remarkably low interfacial tension [
26].
This is because the bending elastic energy is directly related to the shape of the formed micelle, with the droplet shape being the most common [
26]. Given that these are oil-in-water compositions, it is understood that the D-limonene droplets are surrounded by a surfactant layer and dispersed in water within the obtained microemulsions. The surfactant layer, in turn, has a maximum limit of expansion. When this limit is reached, it leads to separation into various phase types, such as excess oil or water and presence of emulsions, among others. This phenomenon was likely observed during titration D, at the point where the D20 formulation was unable to reach thermodynamic equilibrium.
As the next step, a physicochemical characterization was conducted on select formulations obtained through titration, with the D-limonene content in each composition serving as the criterion for selection. In this context, formulations D12, D13, D14, D15, D16, D17, D18, and D19 were not characterized.
3.1.3. Microemulsions Characterization
D-limonene Content, pH, and Density Characterization
The content of D-limonene was calculated using the linear equation (y = 0.0832x + 0.0062) (
Figure S3) obtained by the authors of this study, and the results are shown in
Table 8.
In order to obtain additional comparative parameters of similarity between the formulations, the microemulsions were also characterized in terms of pH and density. The pH values obtained for each of the microemulsions, in triplicate, are also presented in
Table 8. It can be observed that all formulations have an acidic character, consistent with the nature of D-limonene, originating from citrus fruits.
Regarding the density values, it is observed that the lowest obtained value was equal to 0.9844 g/cm
3, while the highest was 1.0199 g/cm
3. In general, it can be stated that the obtained microemulsions are highly similar to each other in terms of density, as the deviation between them is approximately 0.01 (
Table 8).
Macroscopic Analysis
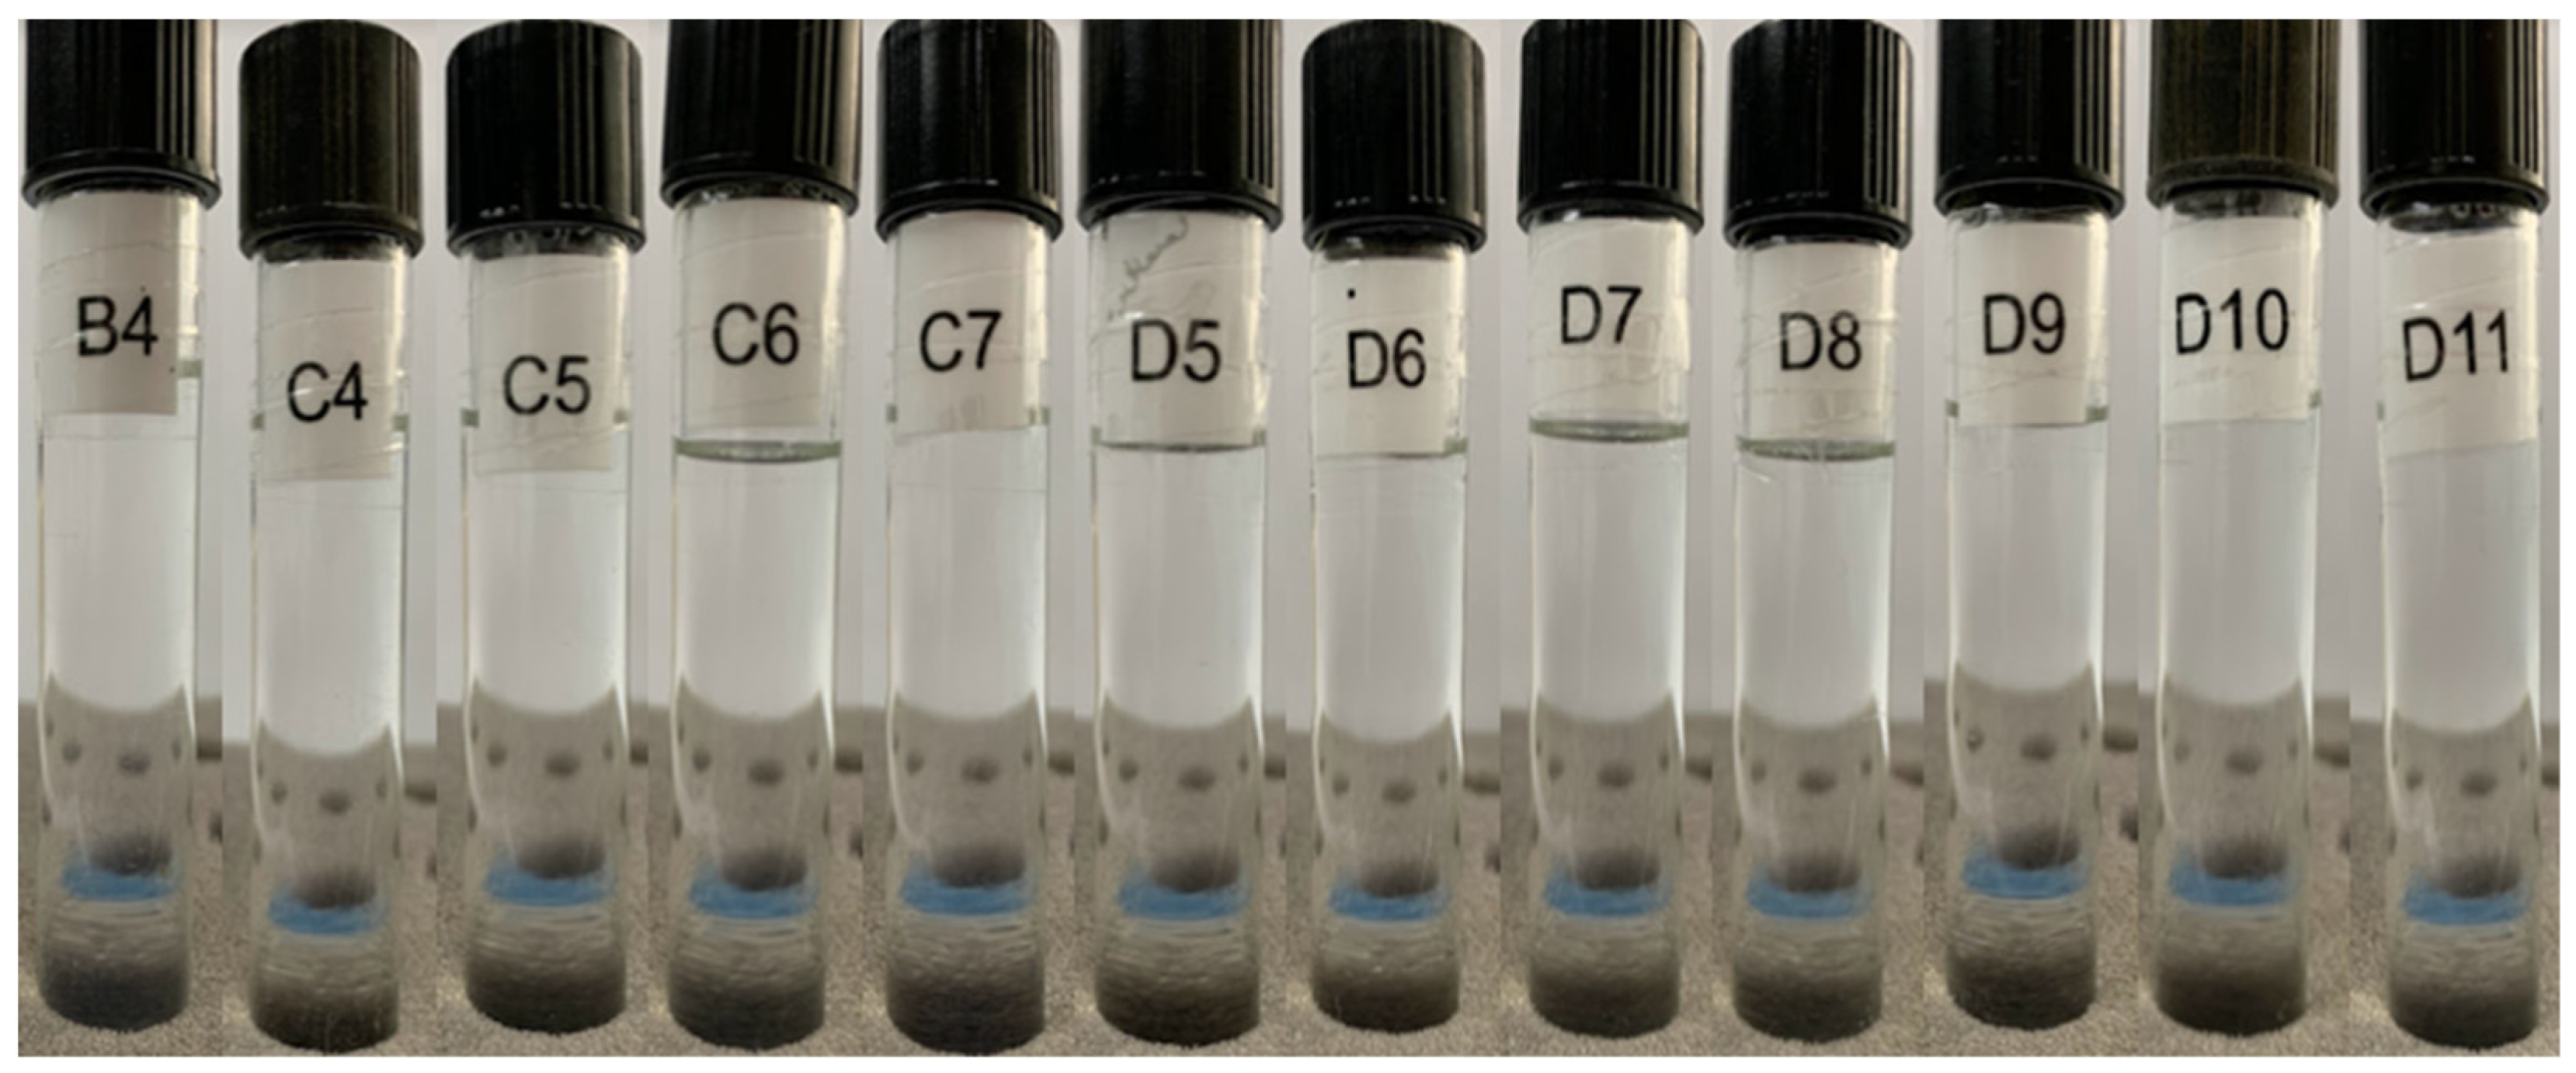
As shown in
Figure 8, all the formulations obtained are homogeneous, transparent, low viscosity, and without visible particles, consistent with the physical characteristics of a microemulsion. In addition, after 24 h of preparation, the thermodynamic equilibrium between the components of each formulation was not disturbed, indicating high physical stability for these compositions.
Centrifugation
The test aims to evaluate the physical stability of the microemulsions obtained under mechanical stress. After 60 min of testing, only formulation C4 showed a slight turbidity, as can be seen in
Figure 9. This may indicate that the composition of 23.1% D-limonene, 53.8% Labrasol
®, and 23.1% water is at the limit of its thermodynamic equilibrium, such that external disturbances can result in the rupture of the microemulsified system. However, after 5 min at rest, C4 returned to its transparent, homogeneous, and low viscosity state. Moreover, all other formulations remained stable throughout the assay, without apparent phase separation or turbidity.
Based on these findings, it is possible to infer that the microemulsions exhibit good mechanical stability, such that the applied stressful conditions of agitation and vibrations were unable to disrupt the system. Even the formulation C4 that showed higher sensitivity to agitation returned to thermodynamic equilibrium a few minutes after the cessation of agitation. Therefore, it is highly likely that these products are capable of withstanding normal conditions of transportation and handling, for example.
Oxidative Stability
The oxidative stability is evaluated by RapidOxy 100 through the maintenance of a constant temperature, while pressure variations during the assay are measured, resulting in the so-called induction period. The induction period is understood as the time elapsed between the beginning of the heating procedure until the moment when the formation of oxidation products increases rapidly, indicated by the pressure drop established in the assay termination criterion [
10].
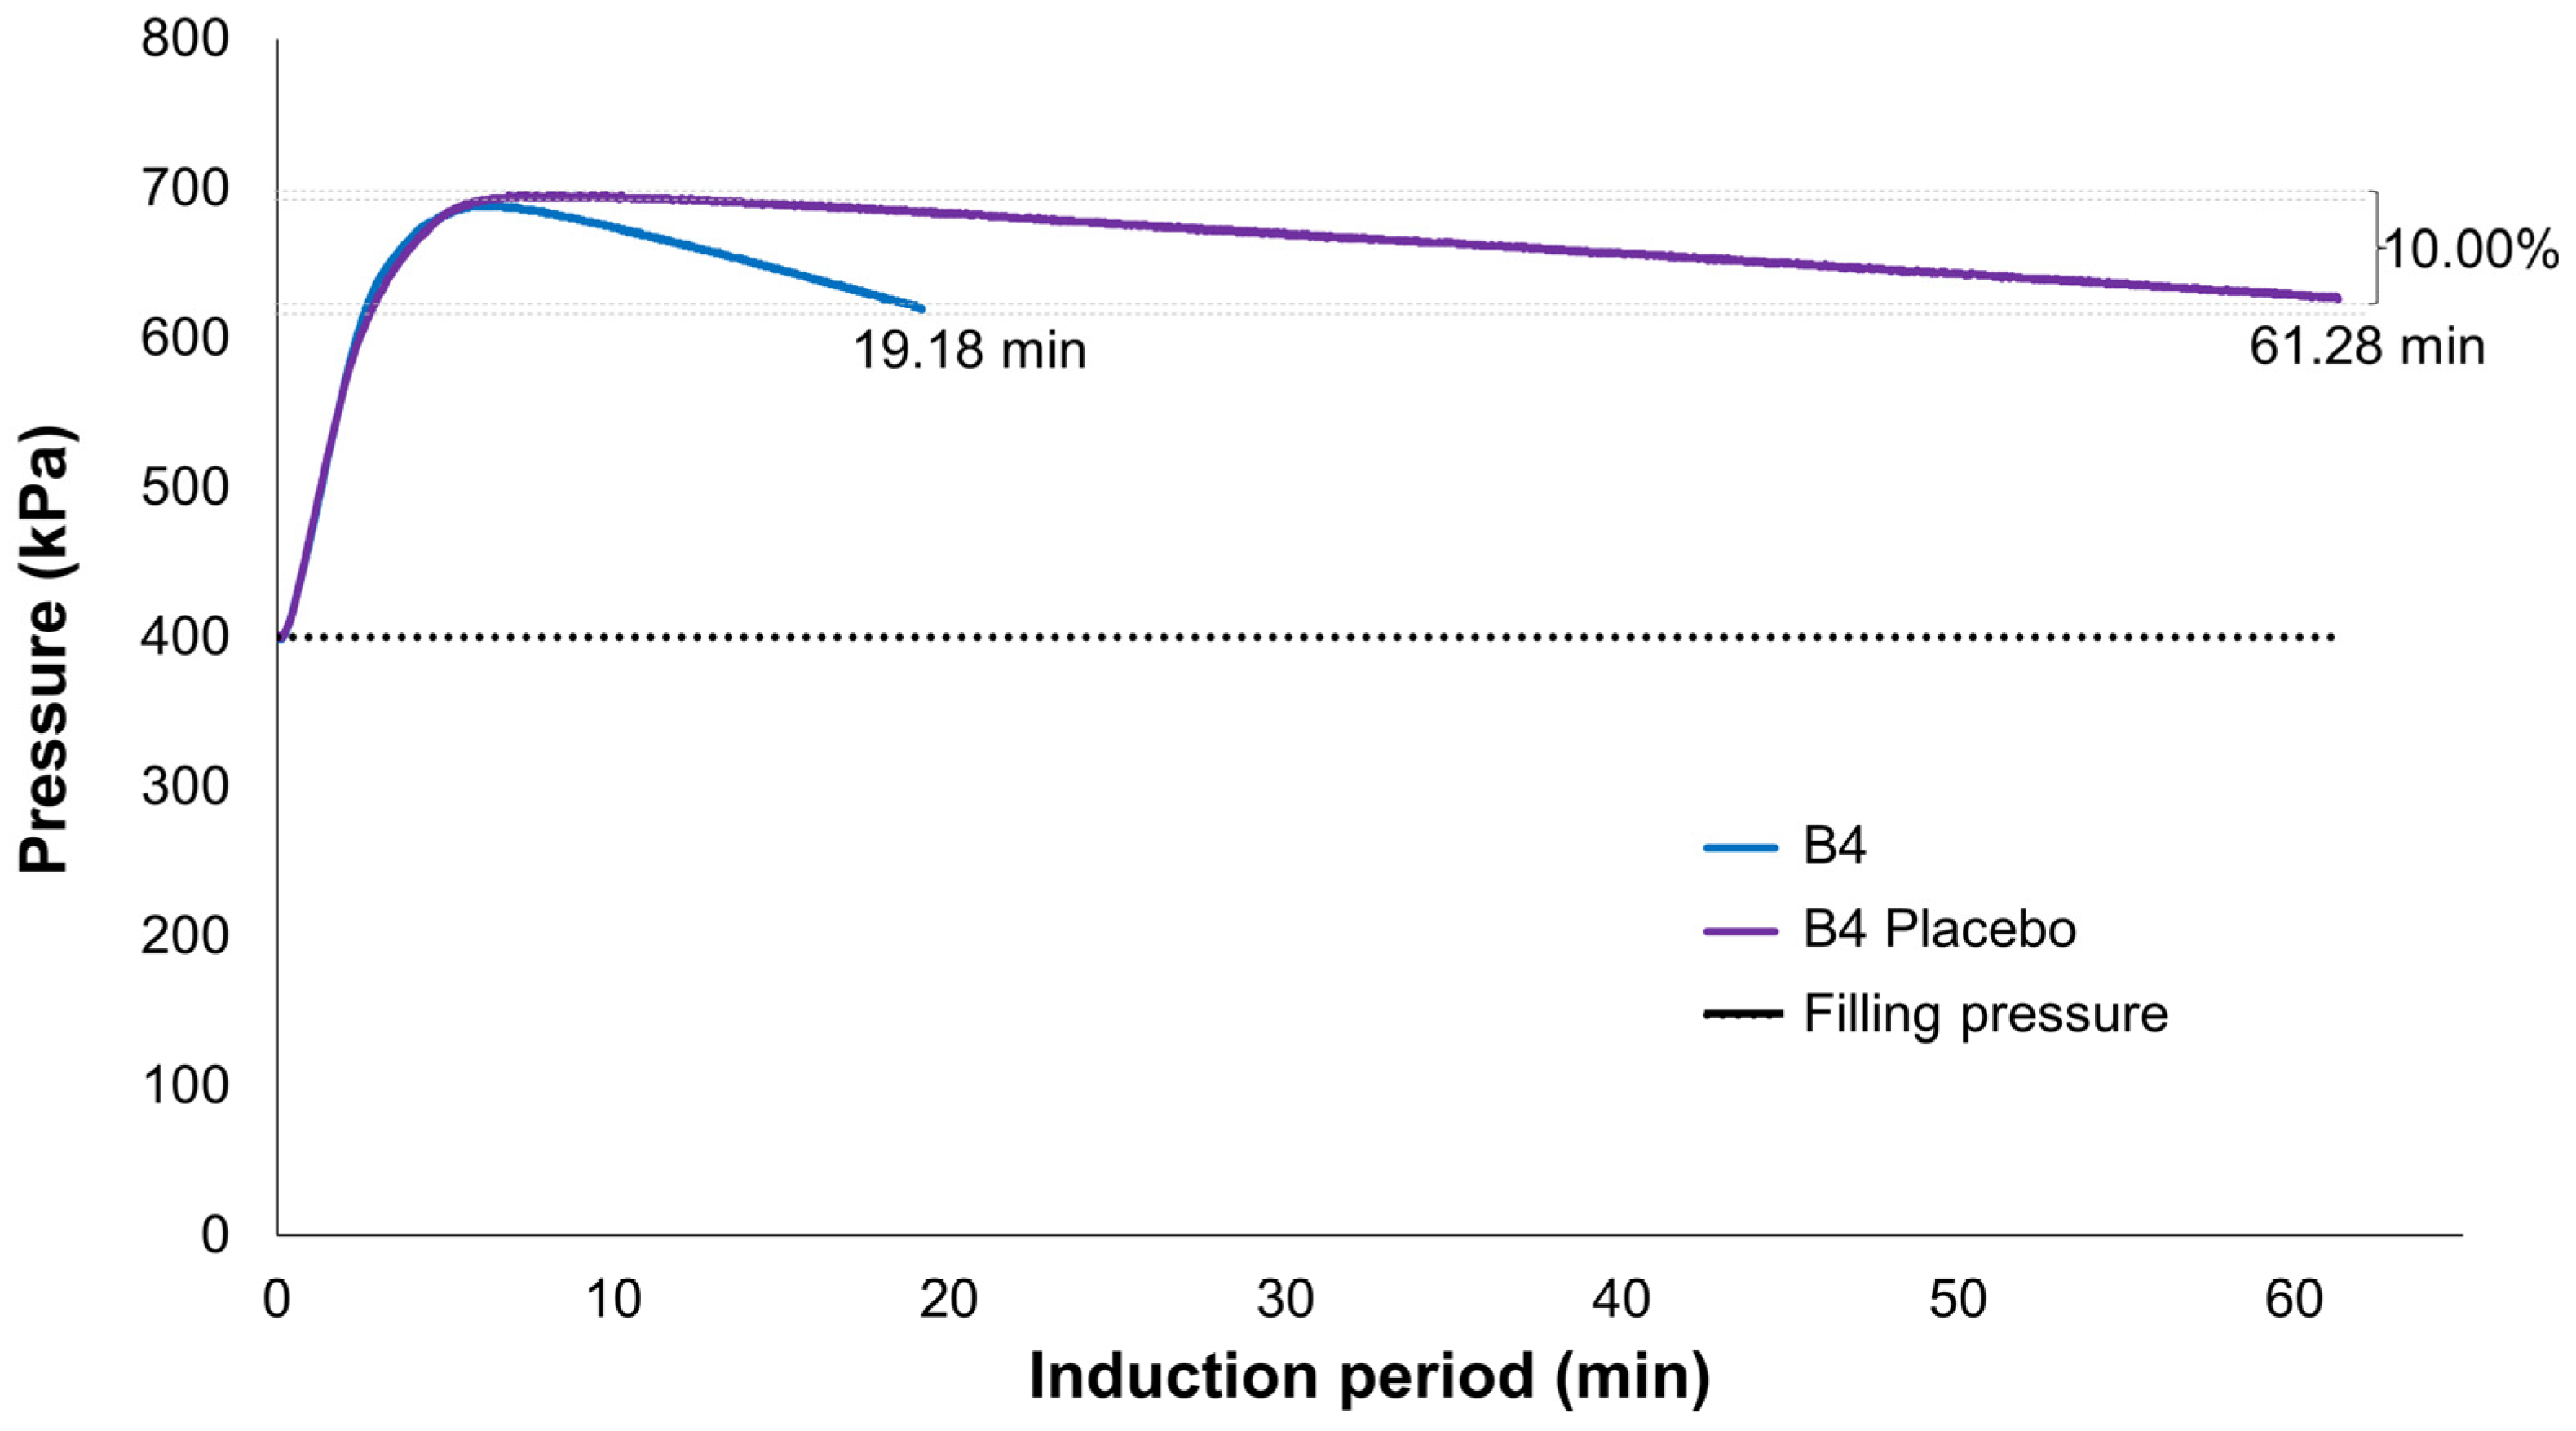
Thus, the longer the sample’s induction period, the more stable it is. In this context, it is possible to indirectly evaluate the microemulsion’s ability to protect the essential oil against volatilization by comparing the induction period of pure D-limonene, placebo formulation, and microemulsion containing D-limonene. The oxygen consumption was calculated by the equipment itself based on the difference between the maximum pressure reached during the assay and the pressure obtained at the end of the experiment.
It is observed that the maximum pressure obtained for each of the samples is higher than the programmed filling pressure (400 kPa). This is due to what is established by the Clapeyron equation (P × V = n × R × T), in which the pressure generated by the gas (P) multiplied by the volume occupied by it (V) is directly proportional to the number of moles (n) multiplied by the general gas constant (R) and the temperature to which the gas is subjected (T) [
27].
In this context, it is understood that the increase in the assay temperature (20 °C to 120 °C) is responsible for causing the increase in pressure from 400 kPa to 513.5 kPa (
Table S2), as in the case of pure D-limonene. After the pressure and temperature stabilization, the sample starts consuming oxygen and, consequently, oxidation, resulting in the observed pressure drop.
The results obtained are expressed in
Table 9 and show that all proposed microemulsions have been able to increase D-limonene stability. It is noted that this component in its pure form had an induction period of 4.88 min for 10.0% of oxygen consumption, while when incorporated into microemulsions, the period increased from 20 to 40 min for the same 10.0% consumption. Furthermore, it is observed that all placebo formulations presented an induction period superior to that of the proper formulation.
Figure 10 provides an example of the observed difference between the formulation and its corresponding placebo, indicating that Labrasol
® oxidation in water starts only after the oxygen consumption of the microemulsion is completed. Thus, it is understood that oxidation observed in microemulsions is mostly, if not exclusively, due to D-limonene. Although it may not be possible to identify D-limonene byproducts such as limonene oxide, carvone, and perillyl alcohol through this technique [
28], it can serve as an alternative and indirect means to assess both the oxidation and volatilization of D-limonene in the absence of more robust techniques like GC-MS.
According to the oxidative results, it is also observed that formulations with a lower D-limonene content (D5 to D11) showed higher oxidative stability, considering that the lower concentration of the volatile oil makes it less available for oxidation reaction. However, even formulations with higher D-limonene content have been effective in protecting it within the microemulsion.
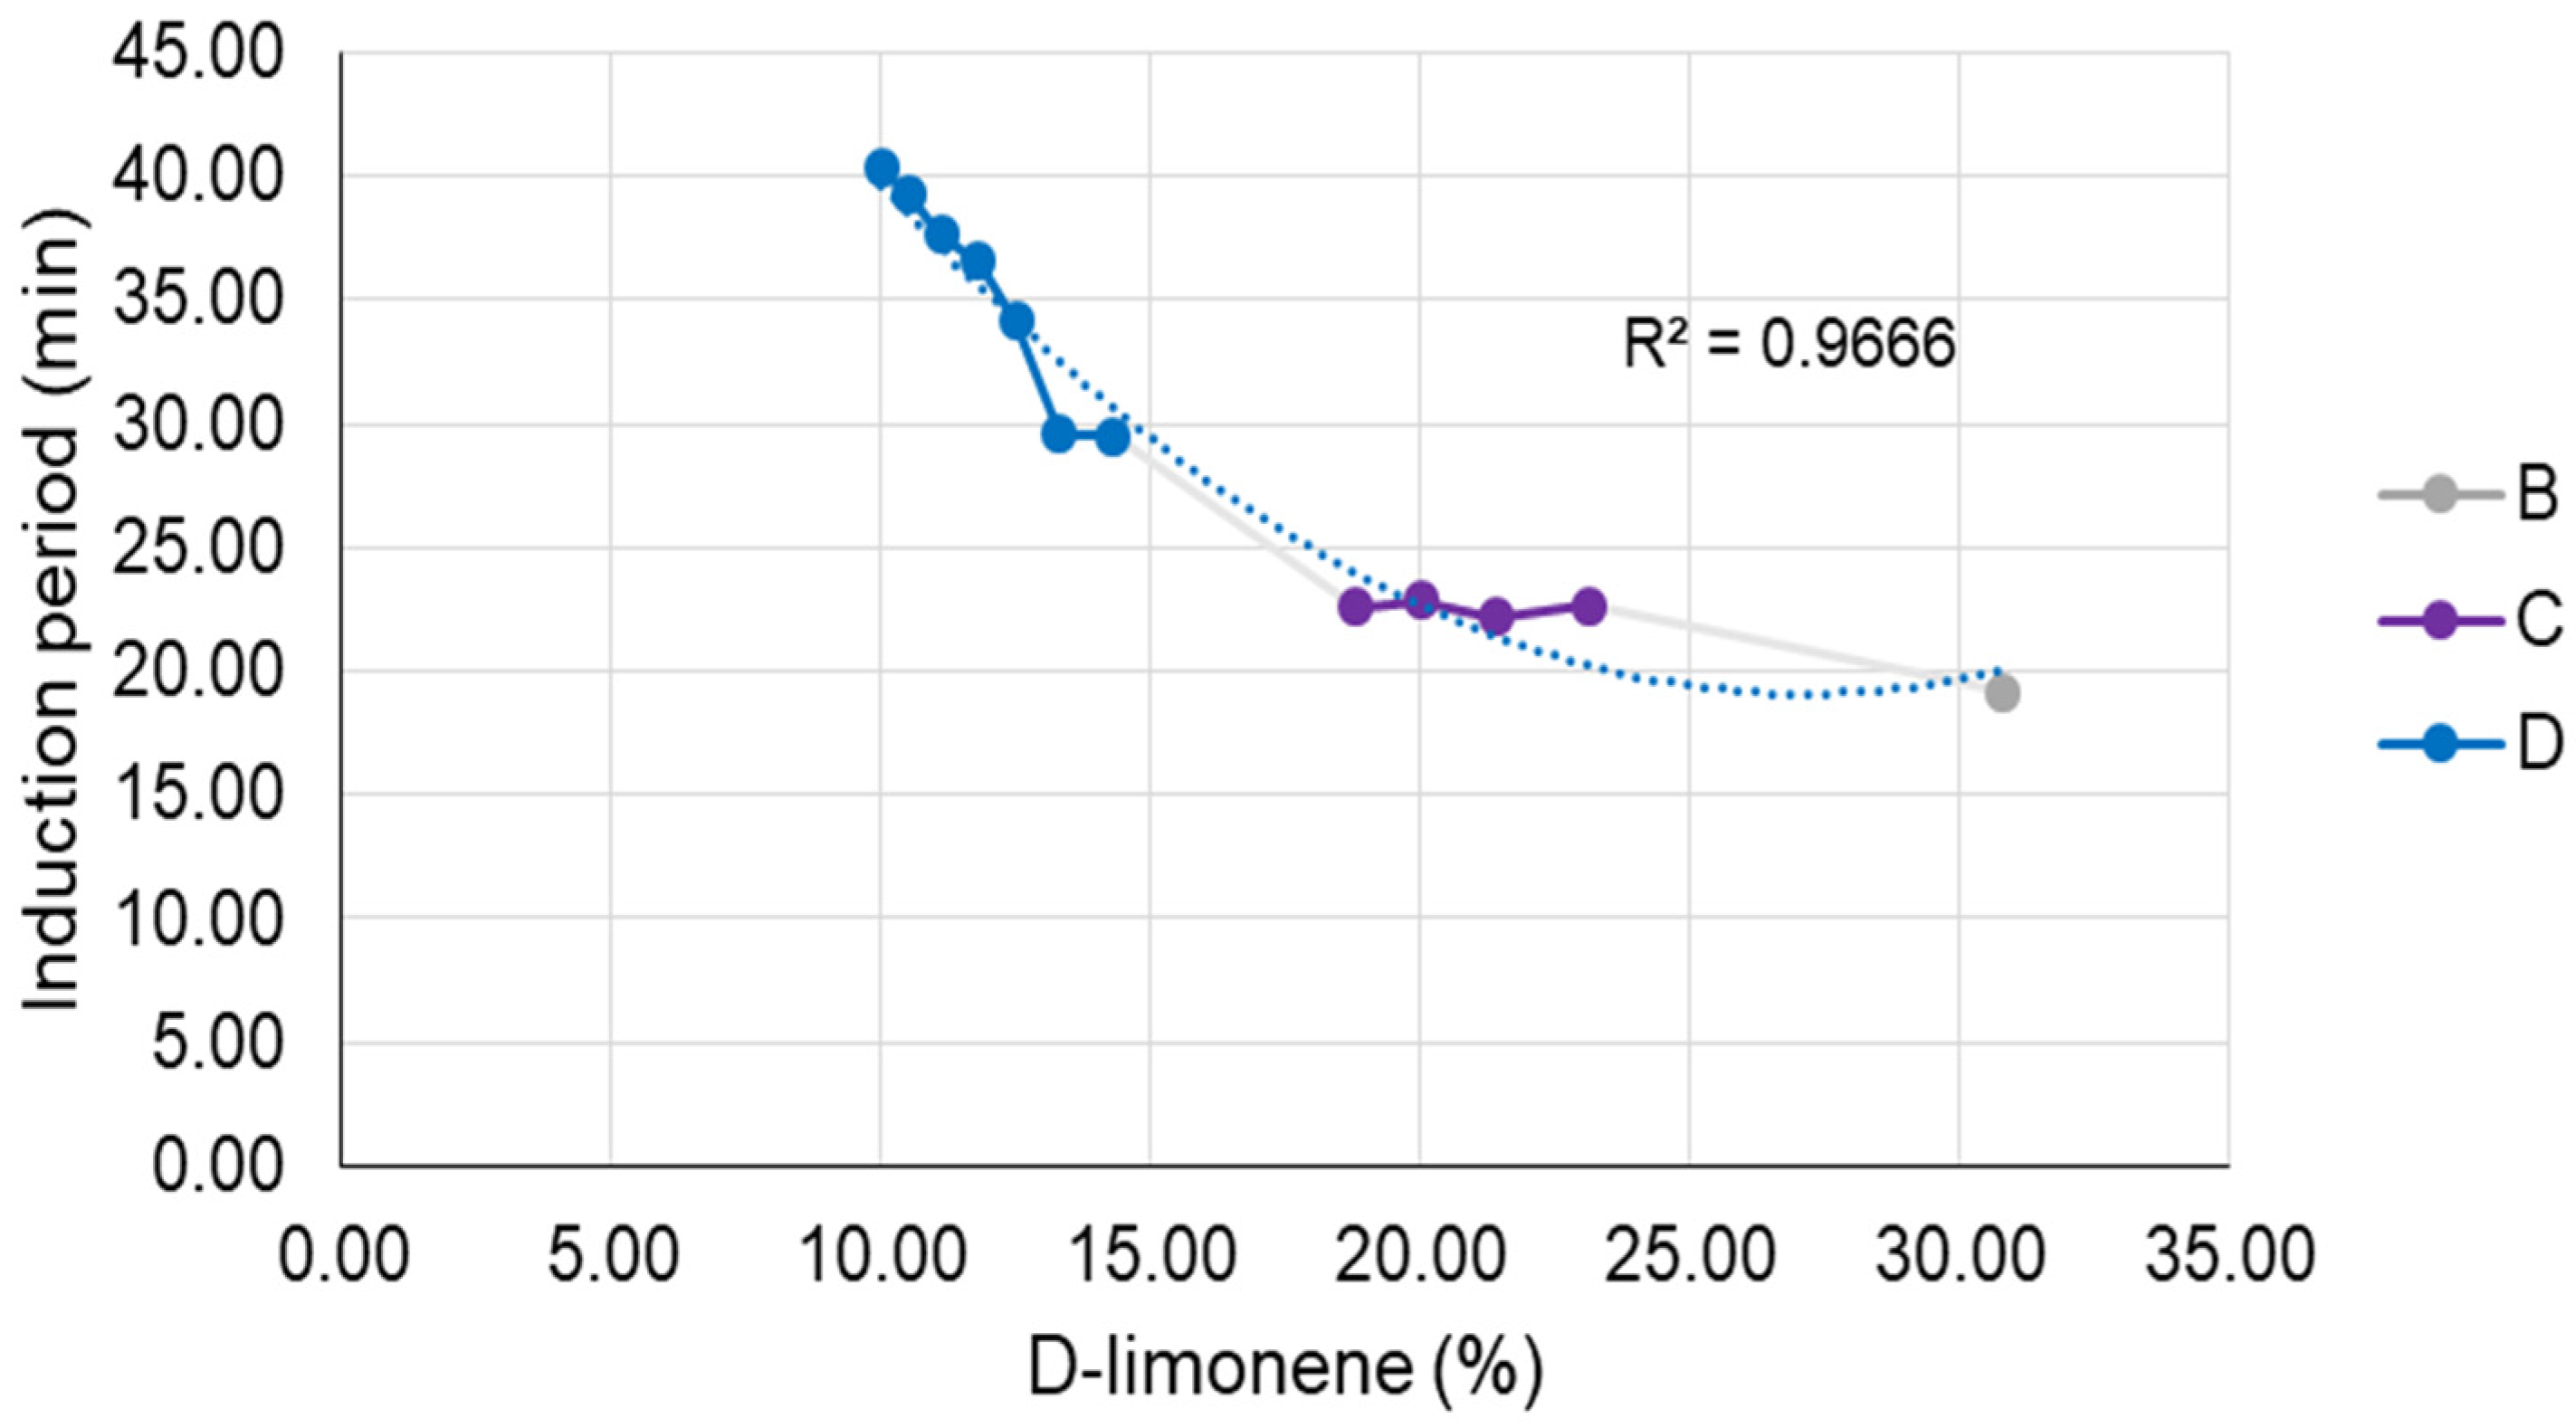
As illustrated in
Figure 11, it is discernible that the microemulsion regions (B, C, and D) exhibit disparities primarily regarding the D-limonene content within the composition of each formulation, whereas formulation D demonstrates the lowest concentrations of this volatile component. It is worth mentioning that the most fitted model for those results was a quadratic function (R² = 0.9666). Therefore, it is notable that the influence of D-limonene content on the induction period is more pronounced at lower concentrations (titration B) compared to higher concentrations (titrations C and D). This implies that by reducing the D-limonene content by 50% in the formulation, there is an approximate 1.5-fold increase in the induction period. It is also interesting to note, as indicated by the results presented in
Table 8, that the longest induction periods were achieved for the lowest concentration of D-limonene. This leads us to infer that its quantity within the composition is directly correlated with the microemulsion’s protective efficacy.
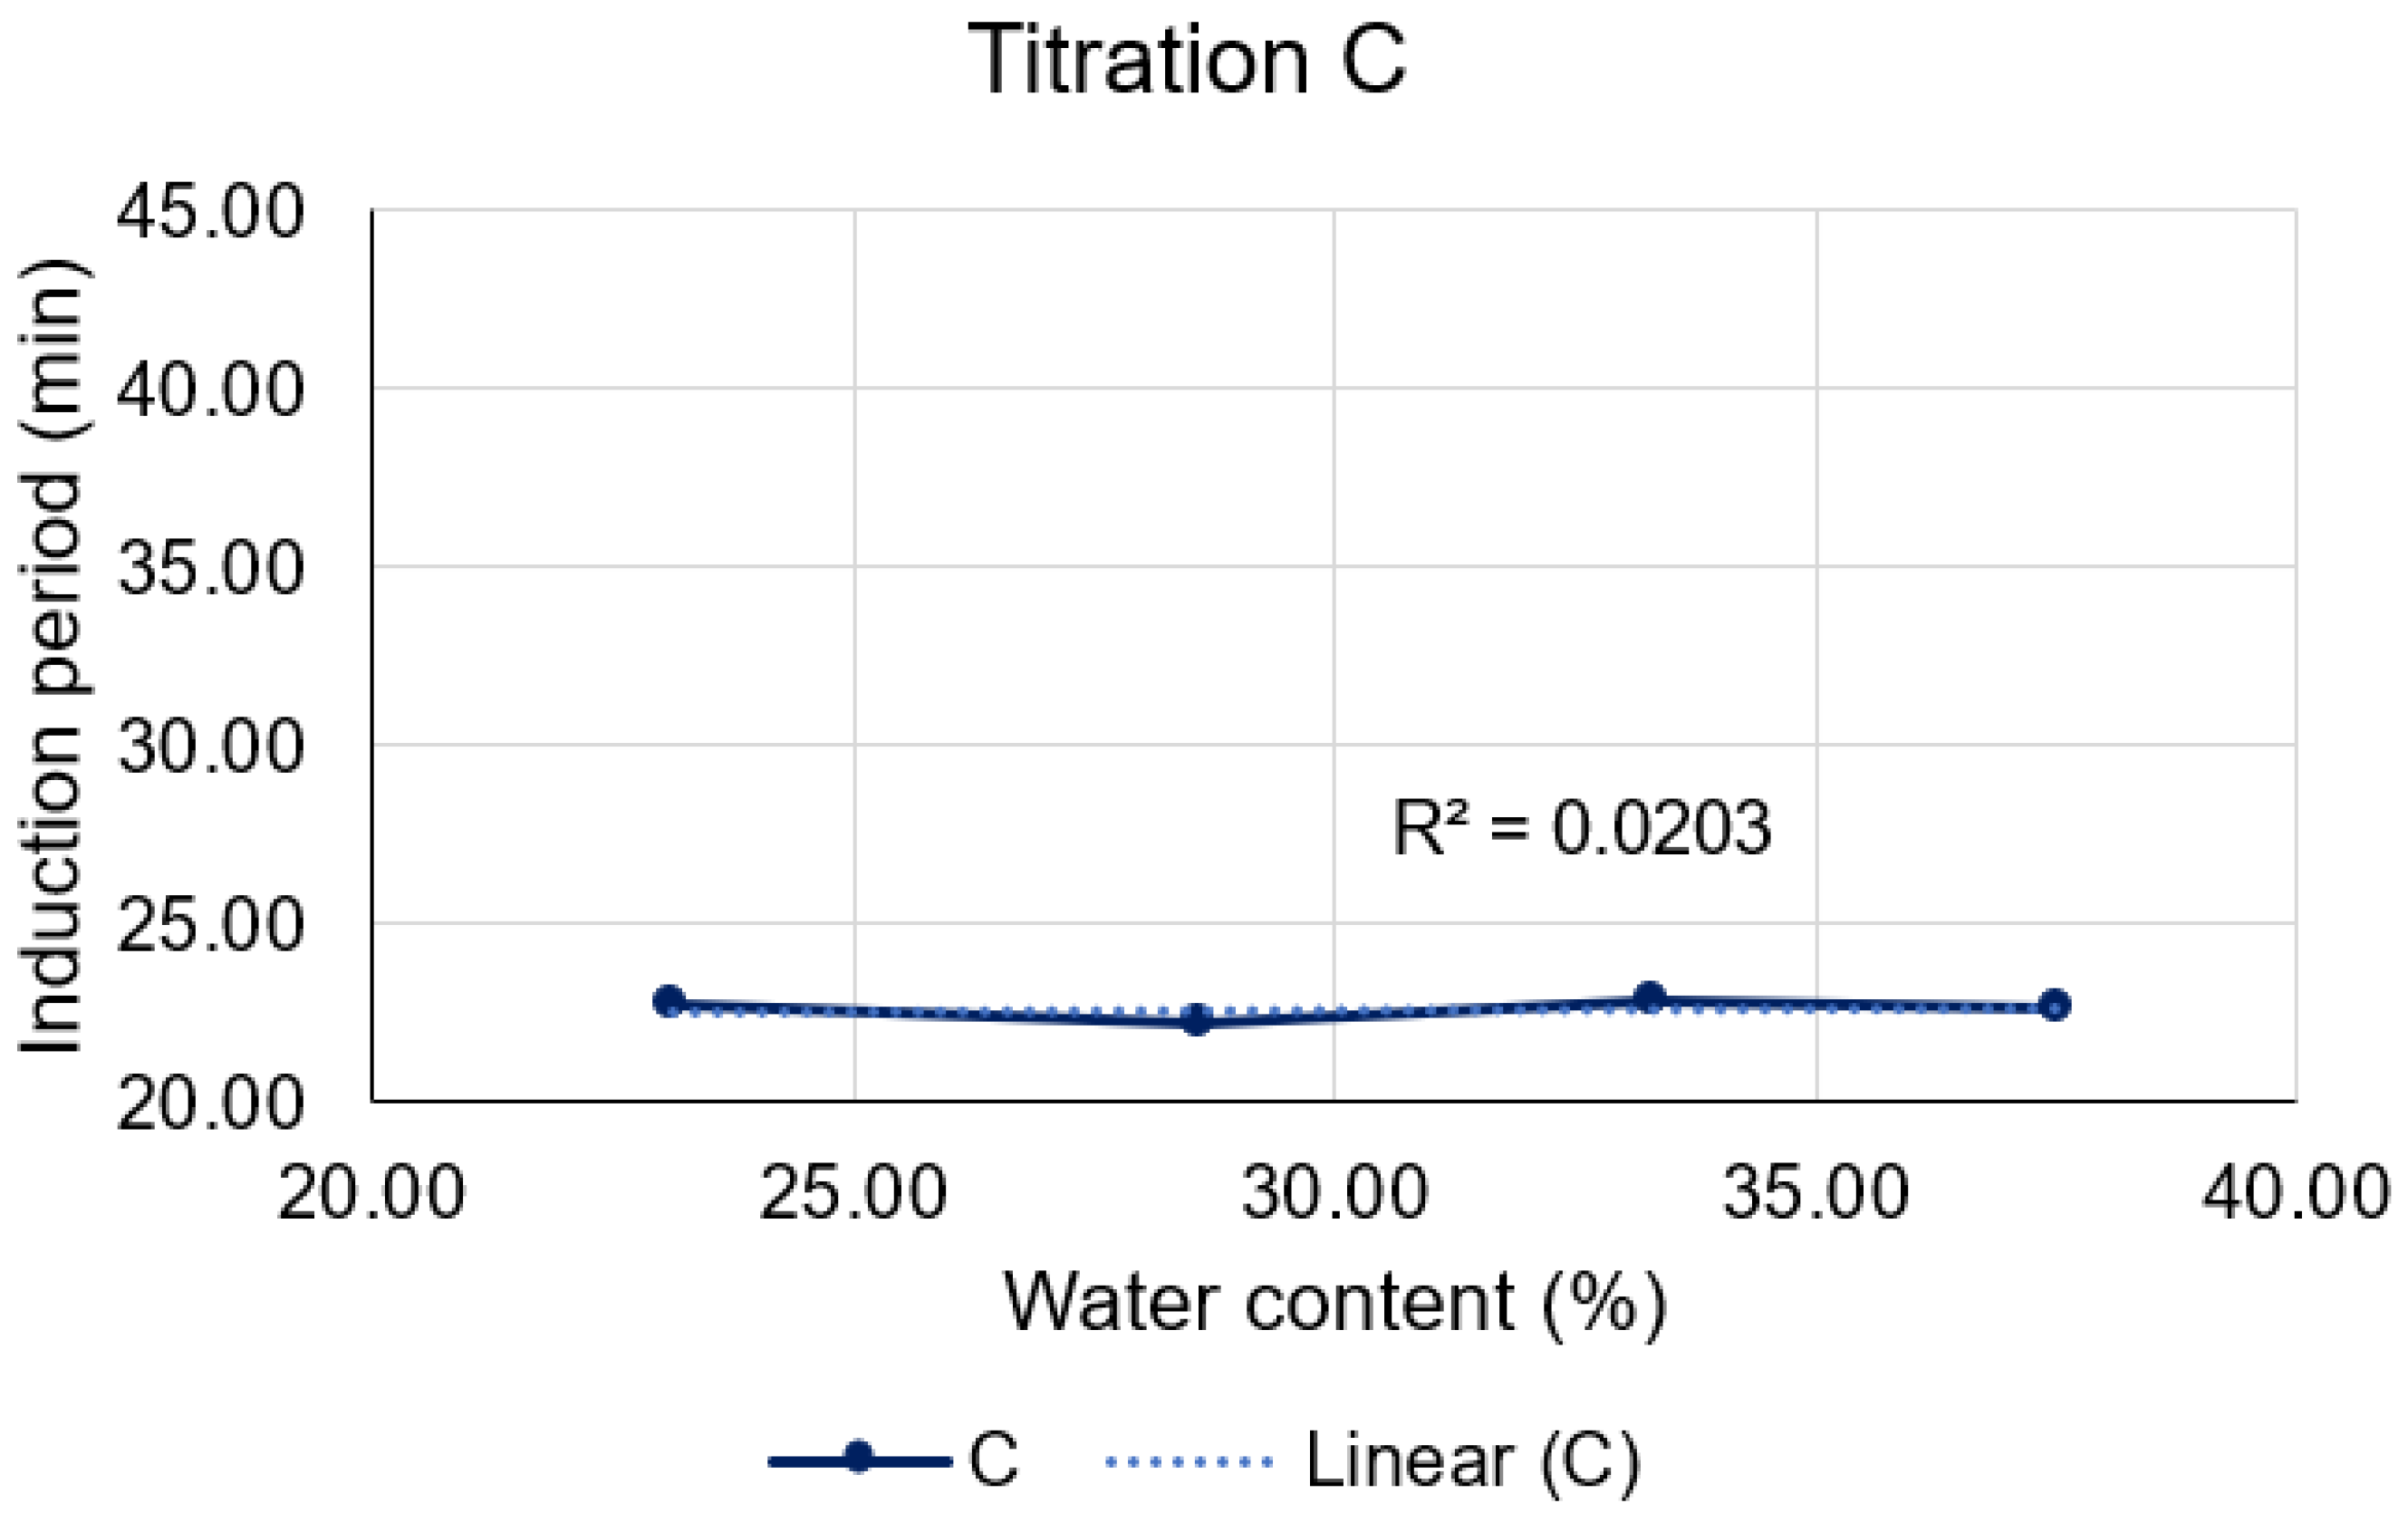
Upon closer examination of Titration C (
Figure 12), it is discernible that neither the quantity of D-limonene nor that of water could disturb the thermodynamic equilibrium of the microemulsions. This is evidenced by the closely similar induction periods obtained for each, yielding approximately 22 min for the consumption of 10% of oxygen by D-limonene in the C formulations.
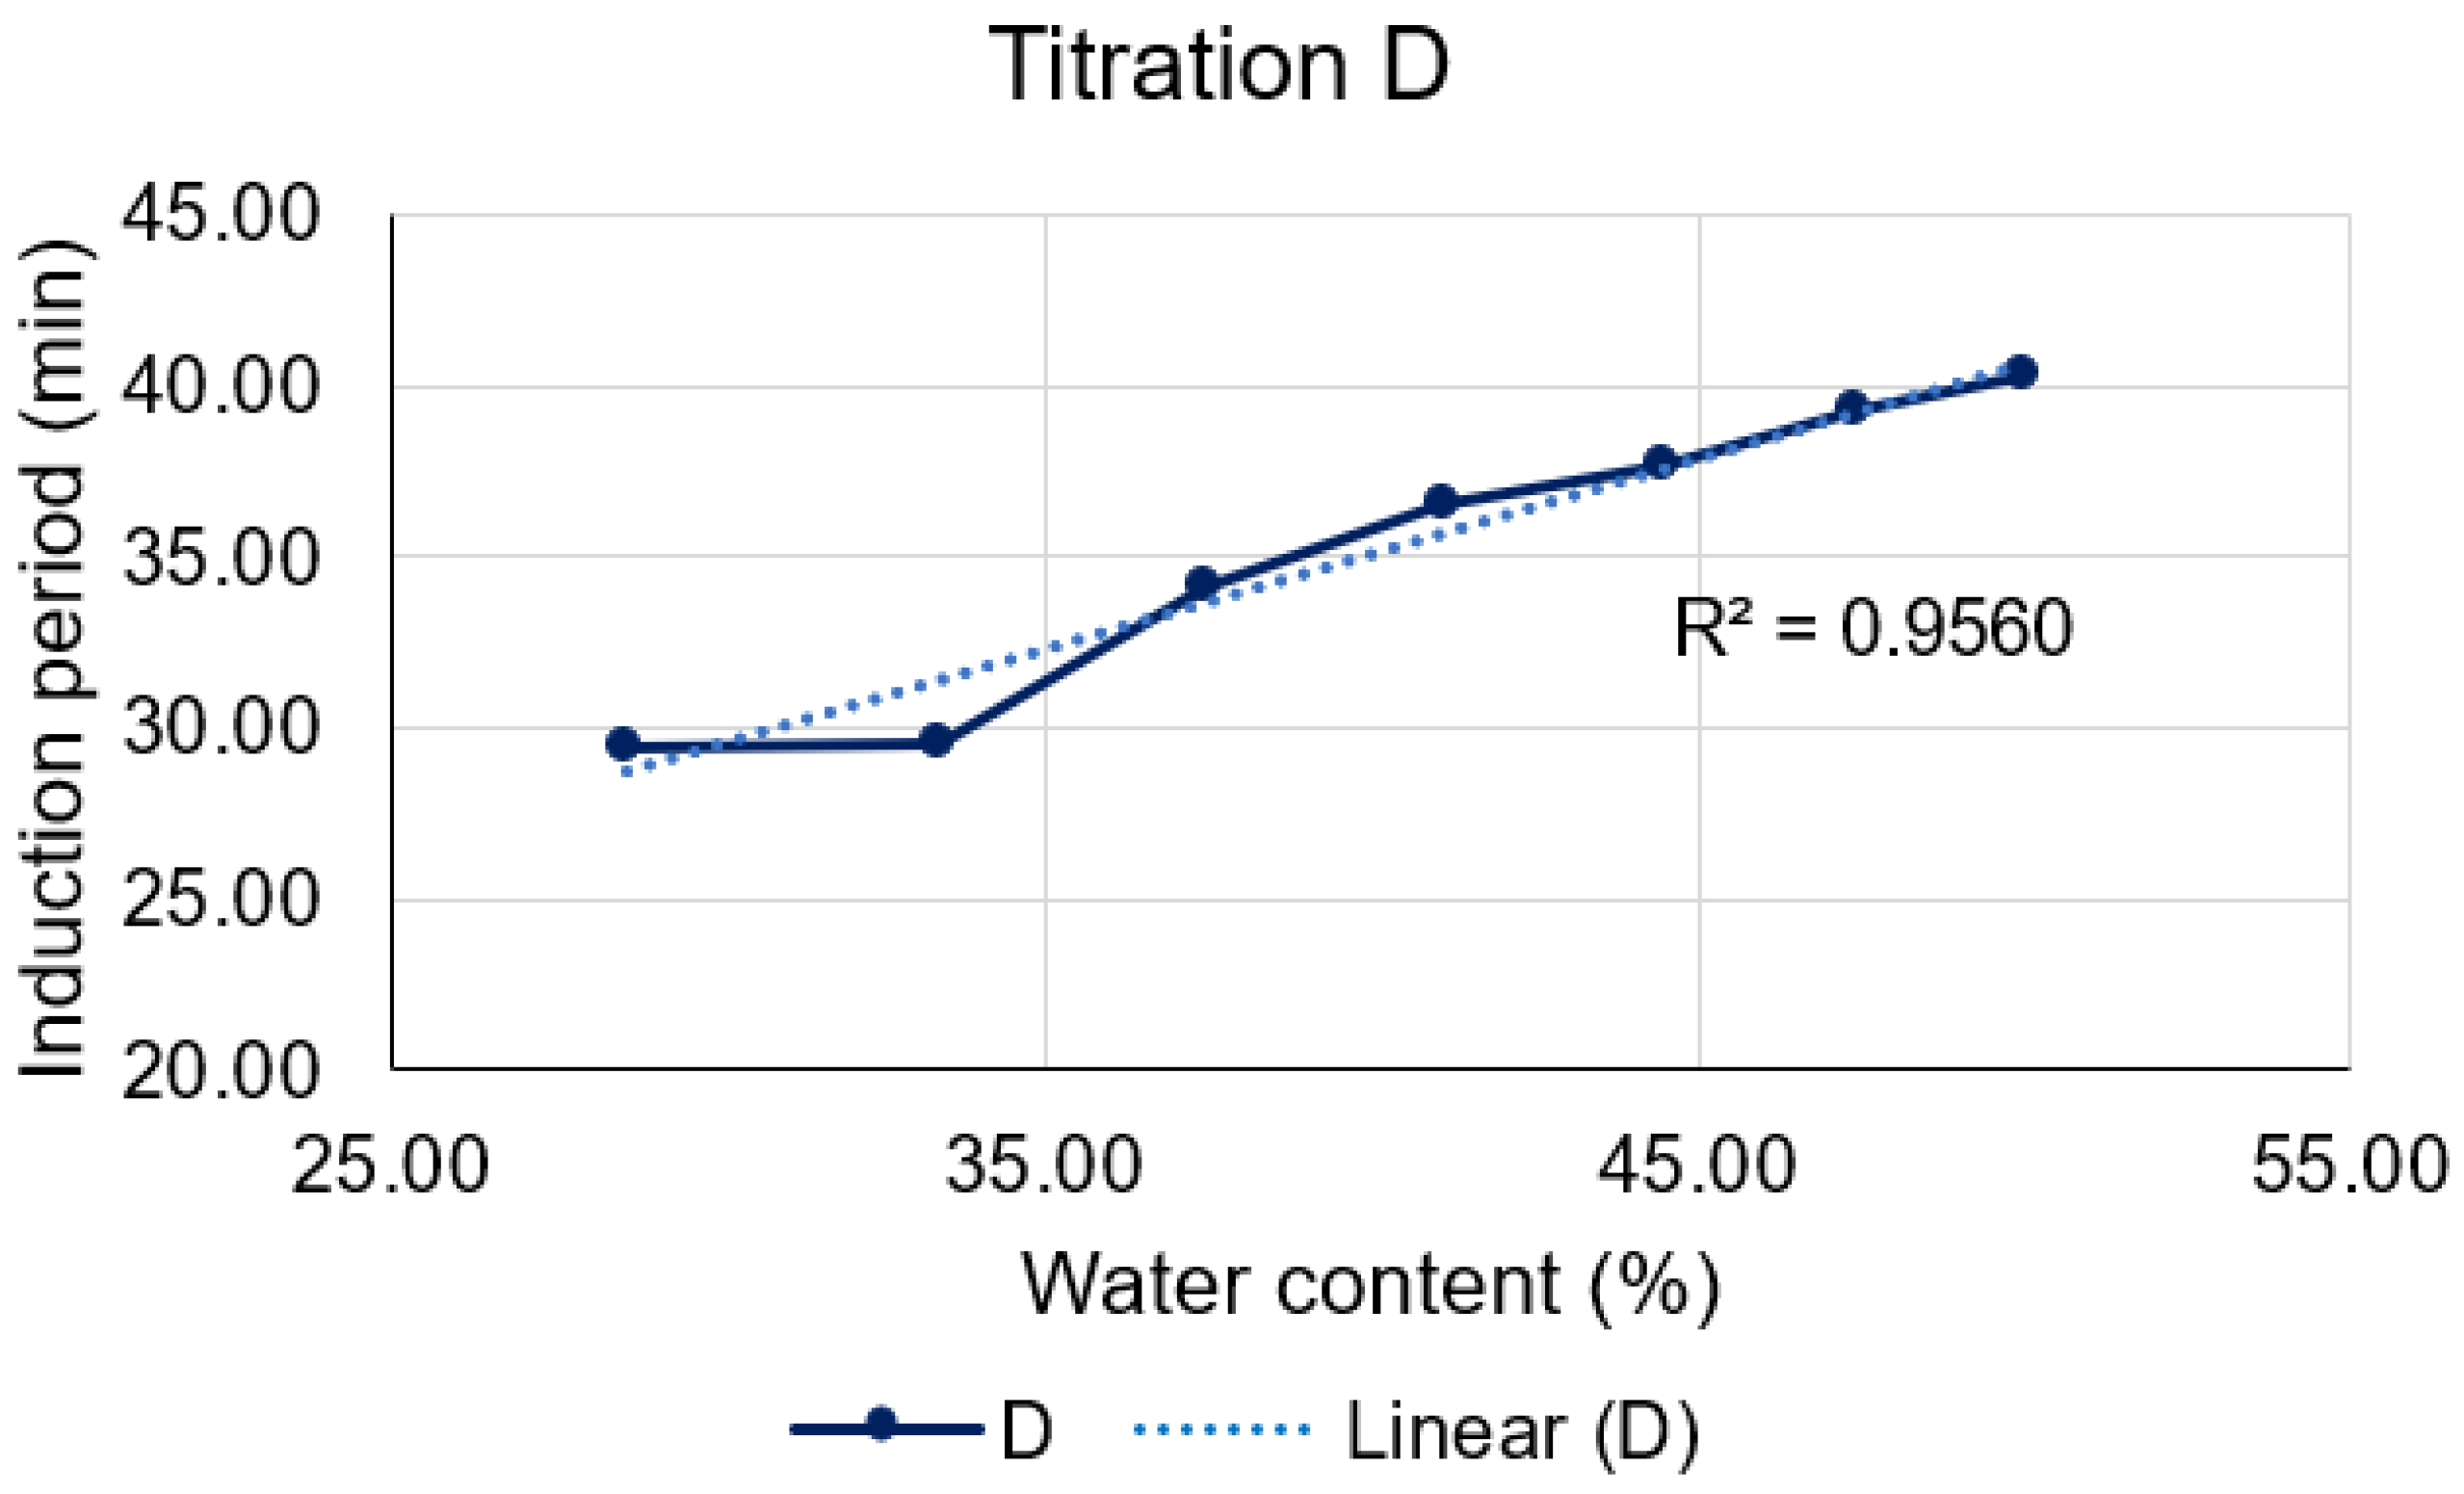
Titration D (
Figure 13), on the other hand, unveils a robust linear correlation between the induction period and the amount of water present in each formulation (R² = 0.9560). It is notable that higher concentrations led to extended induction periods and consequently, enhanced stability of the formulations. This fact may be attributed to an event evidenced by Dongqi et al. (2022) [
29], who observed an increase in micelle formation on microemulsion systems as the water/oil (W/O) ratio increased. Therefore, this phenomenon occurring during titration D may promote D-limonene protection.
When evaluating the composition of microemulsions, it becomes evident that the concentration of Labrasol in these formulations varies very little and does not exert a significant influence on the induction period, unlike the quantities of D-limonene and water. This phenomenon may be attributed to the application of a temperature of 120 °C during the assay. As demonstrated further in the thermal stress study, phase inversion of the microemulsion occurs from 45 °C onwards, potentially leading to the destabilization of formed micelles. In other words, the elevation of temperature within the assay chamber results in a higher solubility of Labrasol in the oil phase compared to the aqueous phase [
30]. Within this context, a higher concentration of D-limonene in the formulation leads to a heightened susceptibility to micelle destabilization with temperature escalation, making D-limonene more accessible to oxidation, and consequently, reducing the induction period.
Furthermore, it is noteworthy to observe that the RapidOxy 100 equipment provided information about the microemulsions stability, as well their ability to protect D-limonene against volatilization, within a few hours of assay, in stark contrast to conventional studies that would require months for completion. Hence, it can be deduced that the assessment of oxidative stability emerges as an outstanding option for the characterization of microemulsions.
Although the initial investment in this methodology may exceed that of conventional stability chambers, it is essential to recognize that with the conventional technique, there is a monthly requirement for sample monitoring to draw conclusions regarding the product’s stability. This entails a larger sample quantity for analysis, as well as the availability of robust equipment (such as GC-MS) on a monthly basis to evaluate the oxidation trend of the product. In contrast, the oxidative stability technique employed allows for reliable results with a mere 5 g of sample, obtained in a matter of minutes. Considering these factors, it is conceivable that, in the end, the overall costs may align. Nevertheless, the cost-effectiveness of the oxidative stability approach is notably higher due to its efficiency and reduced resource demands.
Thermal Stress
The physical stability of D-limonene microemulsions were macroscopically evaluated after each heating cycle. It was observed that at 30 °C, all formulations remained stable without any alteration in their physical characteristics. However, formulation C4 began to show turbidity at 35 °C but returned to a normal state when removed from heating. At 40 °C, the C4 formulation became turbid again and showed slight phase separation, indicating that the system was disassembling. However, it became transparent and homogeneous when removed from heating. Formulation D5 also showed turbidity at this temperature.
In the next cycle, at 45 °C, formulations B4, C4, C5, and D5 became turbid. It should be noted that formulations B4, C4, and C5 have the highest concentrations of D-limonene in their composition (30.8%, 23.1%, and 21.4%, respectively), which may indicate that a higher content of this component is directly related to the lower physical stability of the formulation. This is because D-limonene is extremely volatile and, in higher concentrations, becomes more available for evaporation. Therefore, considering that microemulsion is a thermodynamically stable system resulting from the correct proportions of each component, the evaporation of D-limonene leads to an imbalance in the system, resulting in the rupture of microemulsion, which can be observed by turbidity and/or phase separation.
On the other hand, in addition to the volatilization of D-limonene, it is conceivable that the application of heat to the system might have induced a phase inversion phenomenon, which can be observed through the appearance of turbidity and/or phase separation in the emulsions due to alterations in surfactant affinities. For example, non-ionic surfactants such as Labrasol
® become more lipophilic under heating, in accordance with the observed outcomes for all formulations [
31].
In addition, formulation D5 is the one with the highest concentration of Labrasol
® in its composition, so this component may be related to the turbidity observed at 45 °C, since storage recommendations for this surfactant include minimizing and controlling the degree of exposure to heat, light, and relative humidity [
14,
21].
From 50 °C, all formulations showed some level of turbidity, which remained until the temperature of 65 °C. At 70 °C, all formulations appeared to exhibit a phase transition followed by a possible separation of phases. However, after the decrease in temperature, all returned to the initial state of transparency and homogeneity, indicating that there was not actually a phase separation (irreversible), but the phenomenon of sedimentation (reversible) [
32]. Thus, it can be concluded that from 50 °C, none of the formulations showed physical stability, which is probably related to the evaporation of D-limonene and/or phase inversion. However, under normal storage conditions (25 °C), it is expected that the formulations will remain stable, as they did not exhibit any actual instability at elevated temperatures.
In order to assess in greater detail the microemulsion’s ability to protect D-limonene against volatilization, analyses of oxidative stability (induction period), pH, and density were conducted following heating cycles, the results of which are described in
Table 10.
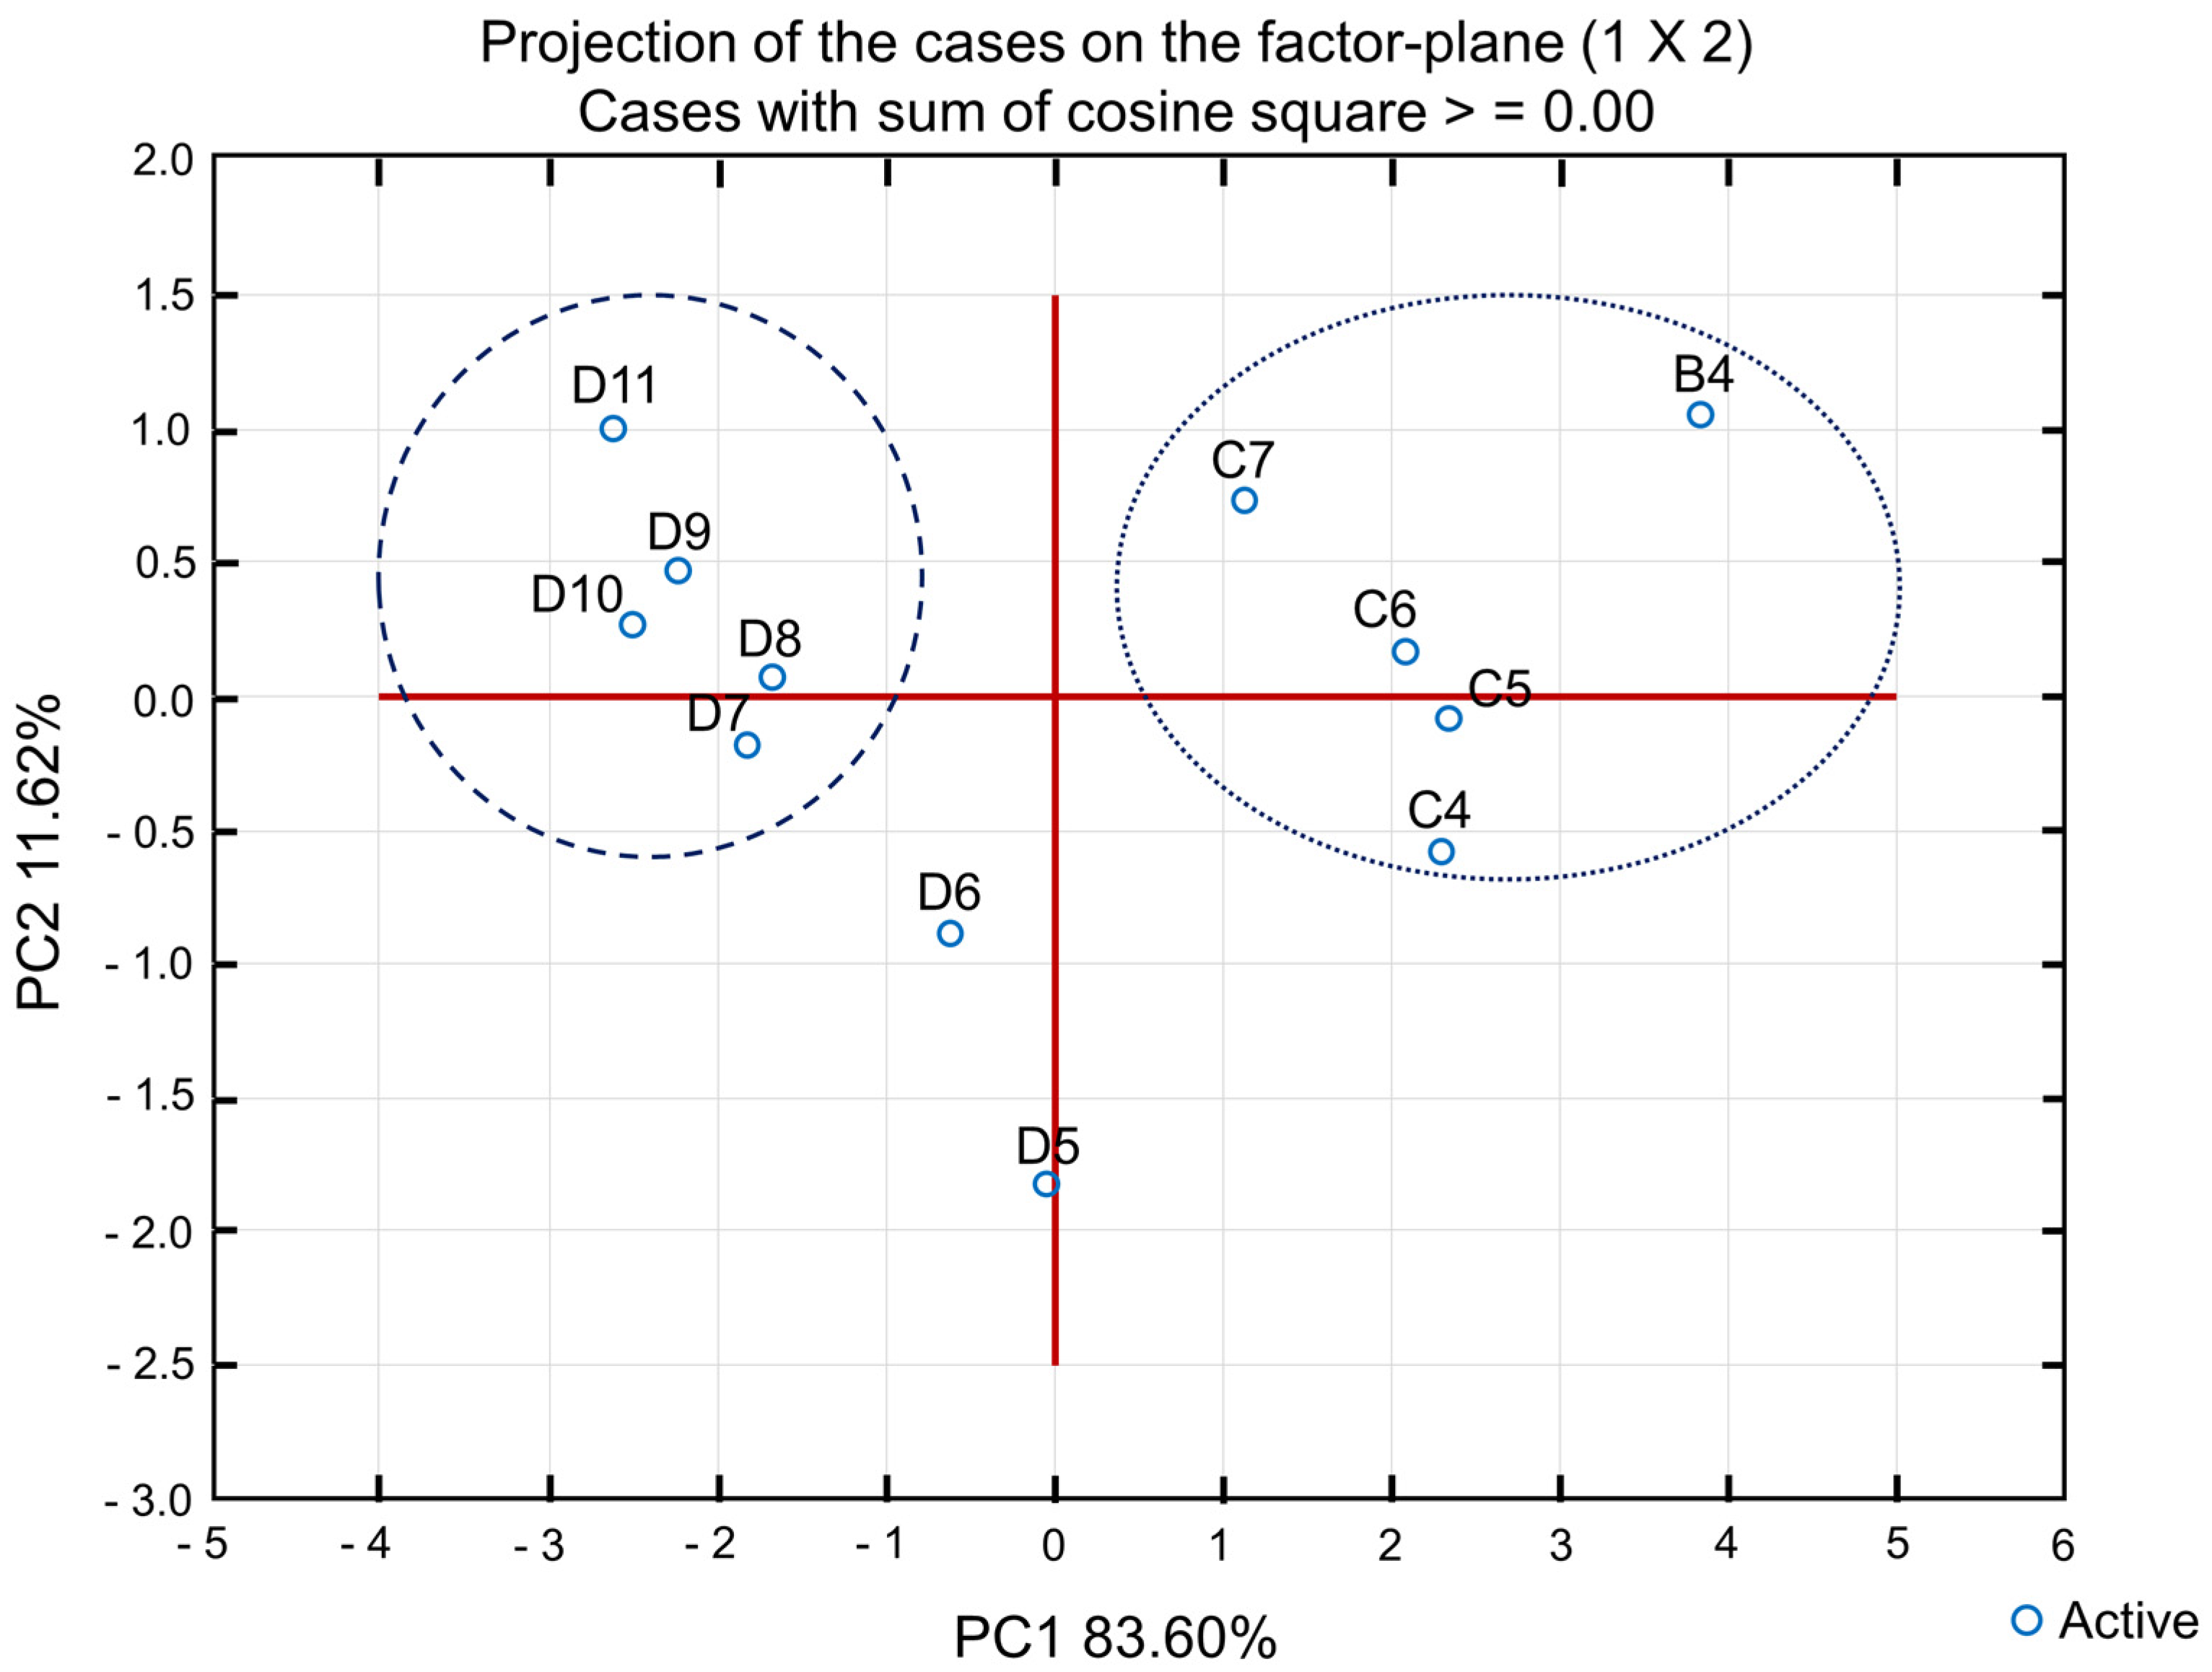
According to the bidimensional plot (
Figure 14), it is possible to visualize the separation of the samples into two principal groups, the first in the left side encompassing microemulsions D7 to D11 and a second on the right, with the formulations B4 and C4 to C7. The sum of both factors (PC1 and PC2) results in 96.22%, as an indication of the retention of a great part of the original variable information.
It is possible to observe that, in general, the induction period variation was more relevant than the other parameters, revealing that all formulations decreased after the thermal stress test. This is because part of the D-limonene probably oxidized or underwent some other type of reaction during the heating cycles, making the microemulsion less stable. However, it is noted that formulations with lower oil content remained more stable, with less pronounced differences in the induction period before and after thermal stress.
Therefore, it can be concluded that, despite the extreme conditions of agitation and heating to which they were exposed, the microemulsions proved to be suitable encapsulation techniques for the protection of D-limonene, increasing its resistance to higher temperatures.


 ,
, 


