
Polyaphron Formulations Stabilised with Different Water-Soluble Polymers for Ocular Drug Delivery


Abstract
:1. Introduction
2. Materials and Methods
2.1. Materials
2.2. The Preparation of the Polyaphrons
2.3. The Physicochemical Characterisation
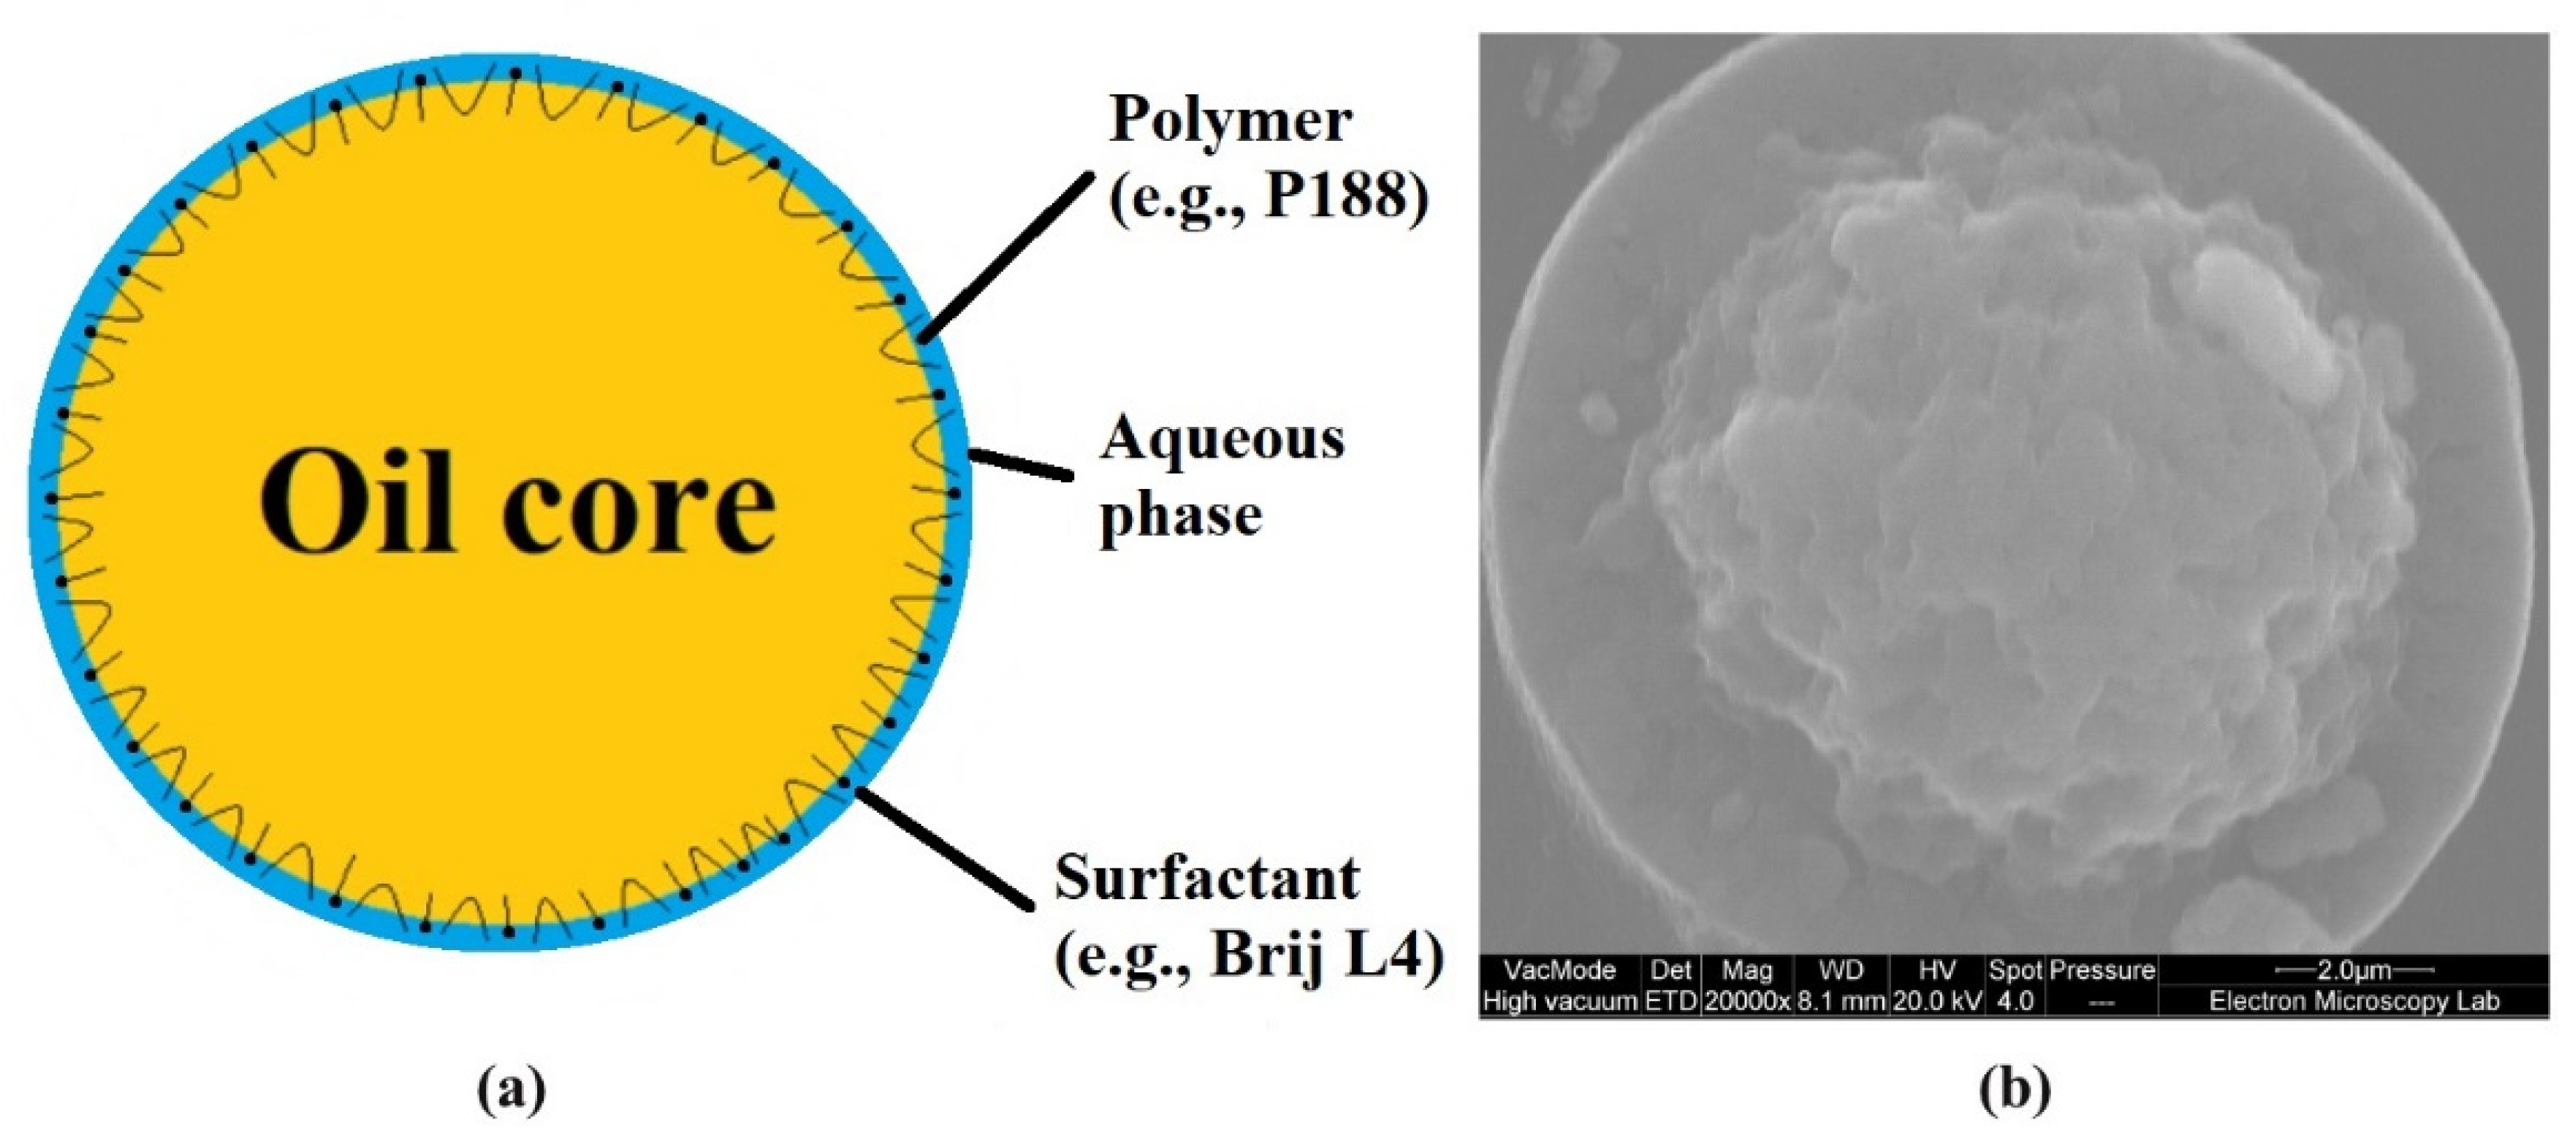
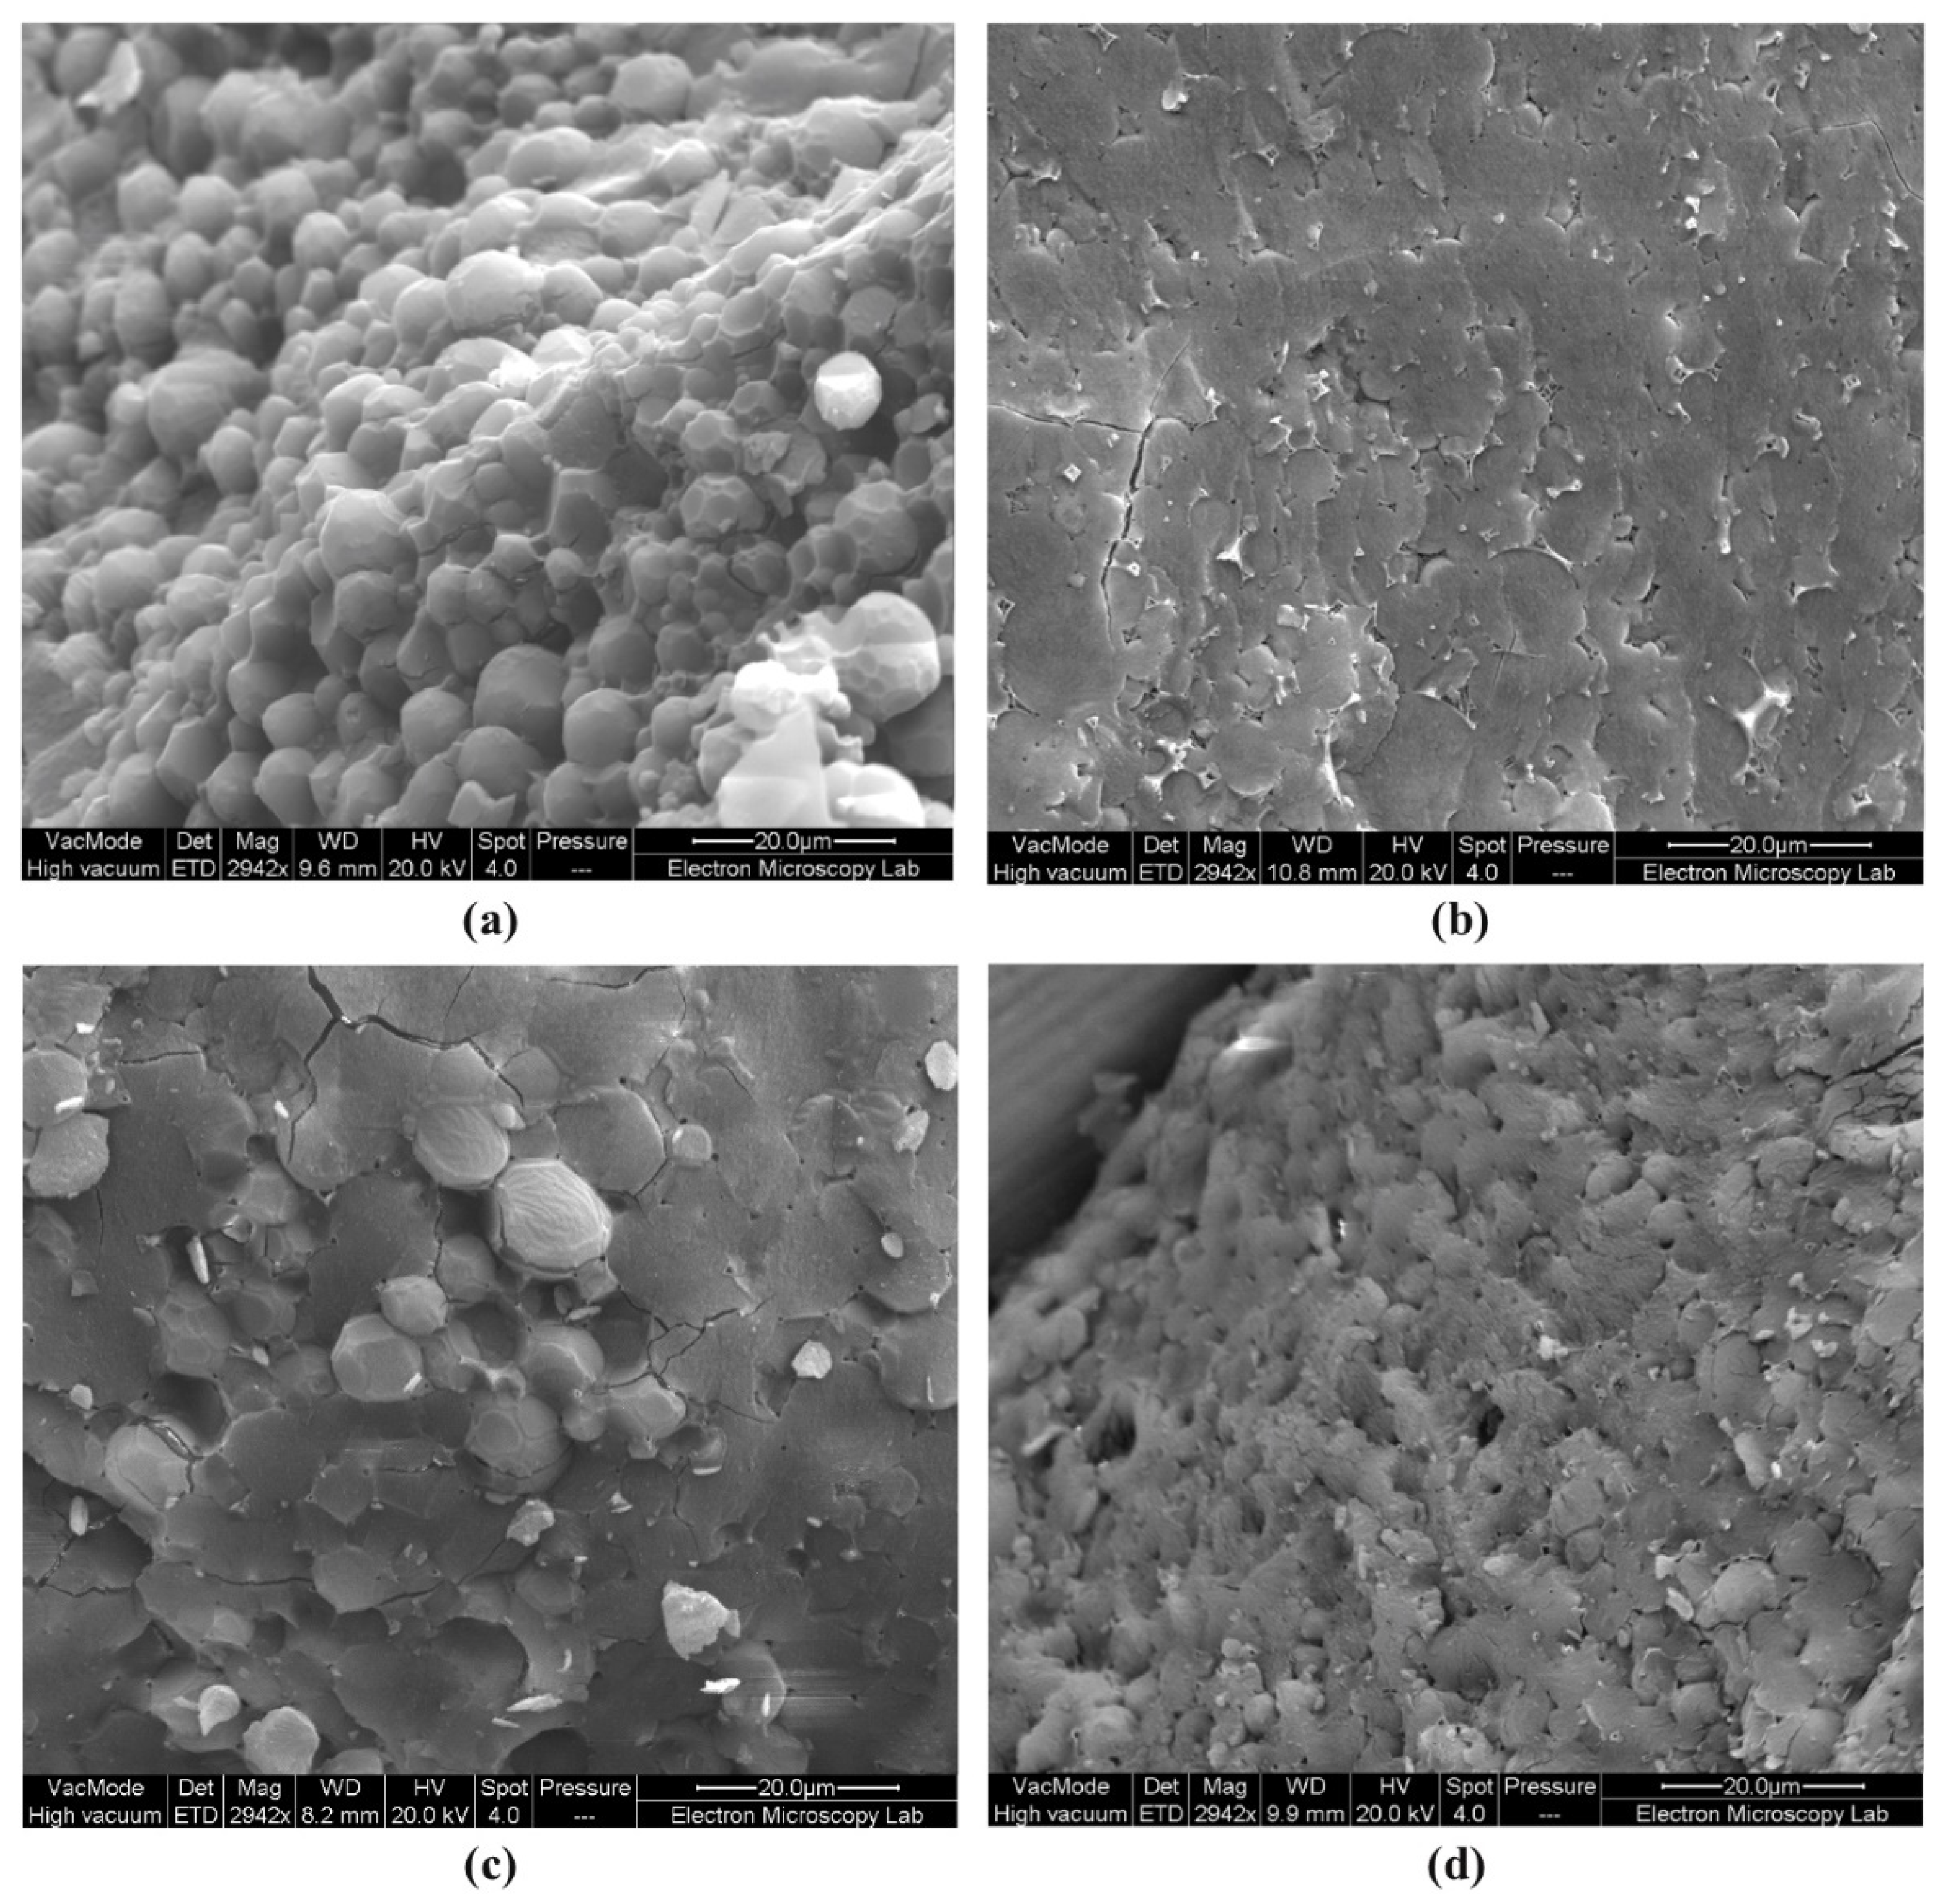
2.3.1. Cryo-SEM
2.3.2. The pH
2.3.3. The Zeta Potential and Size Measurements
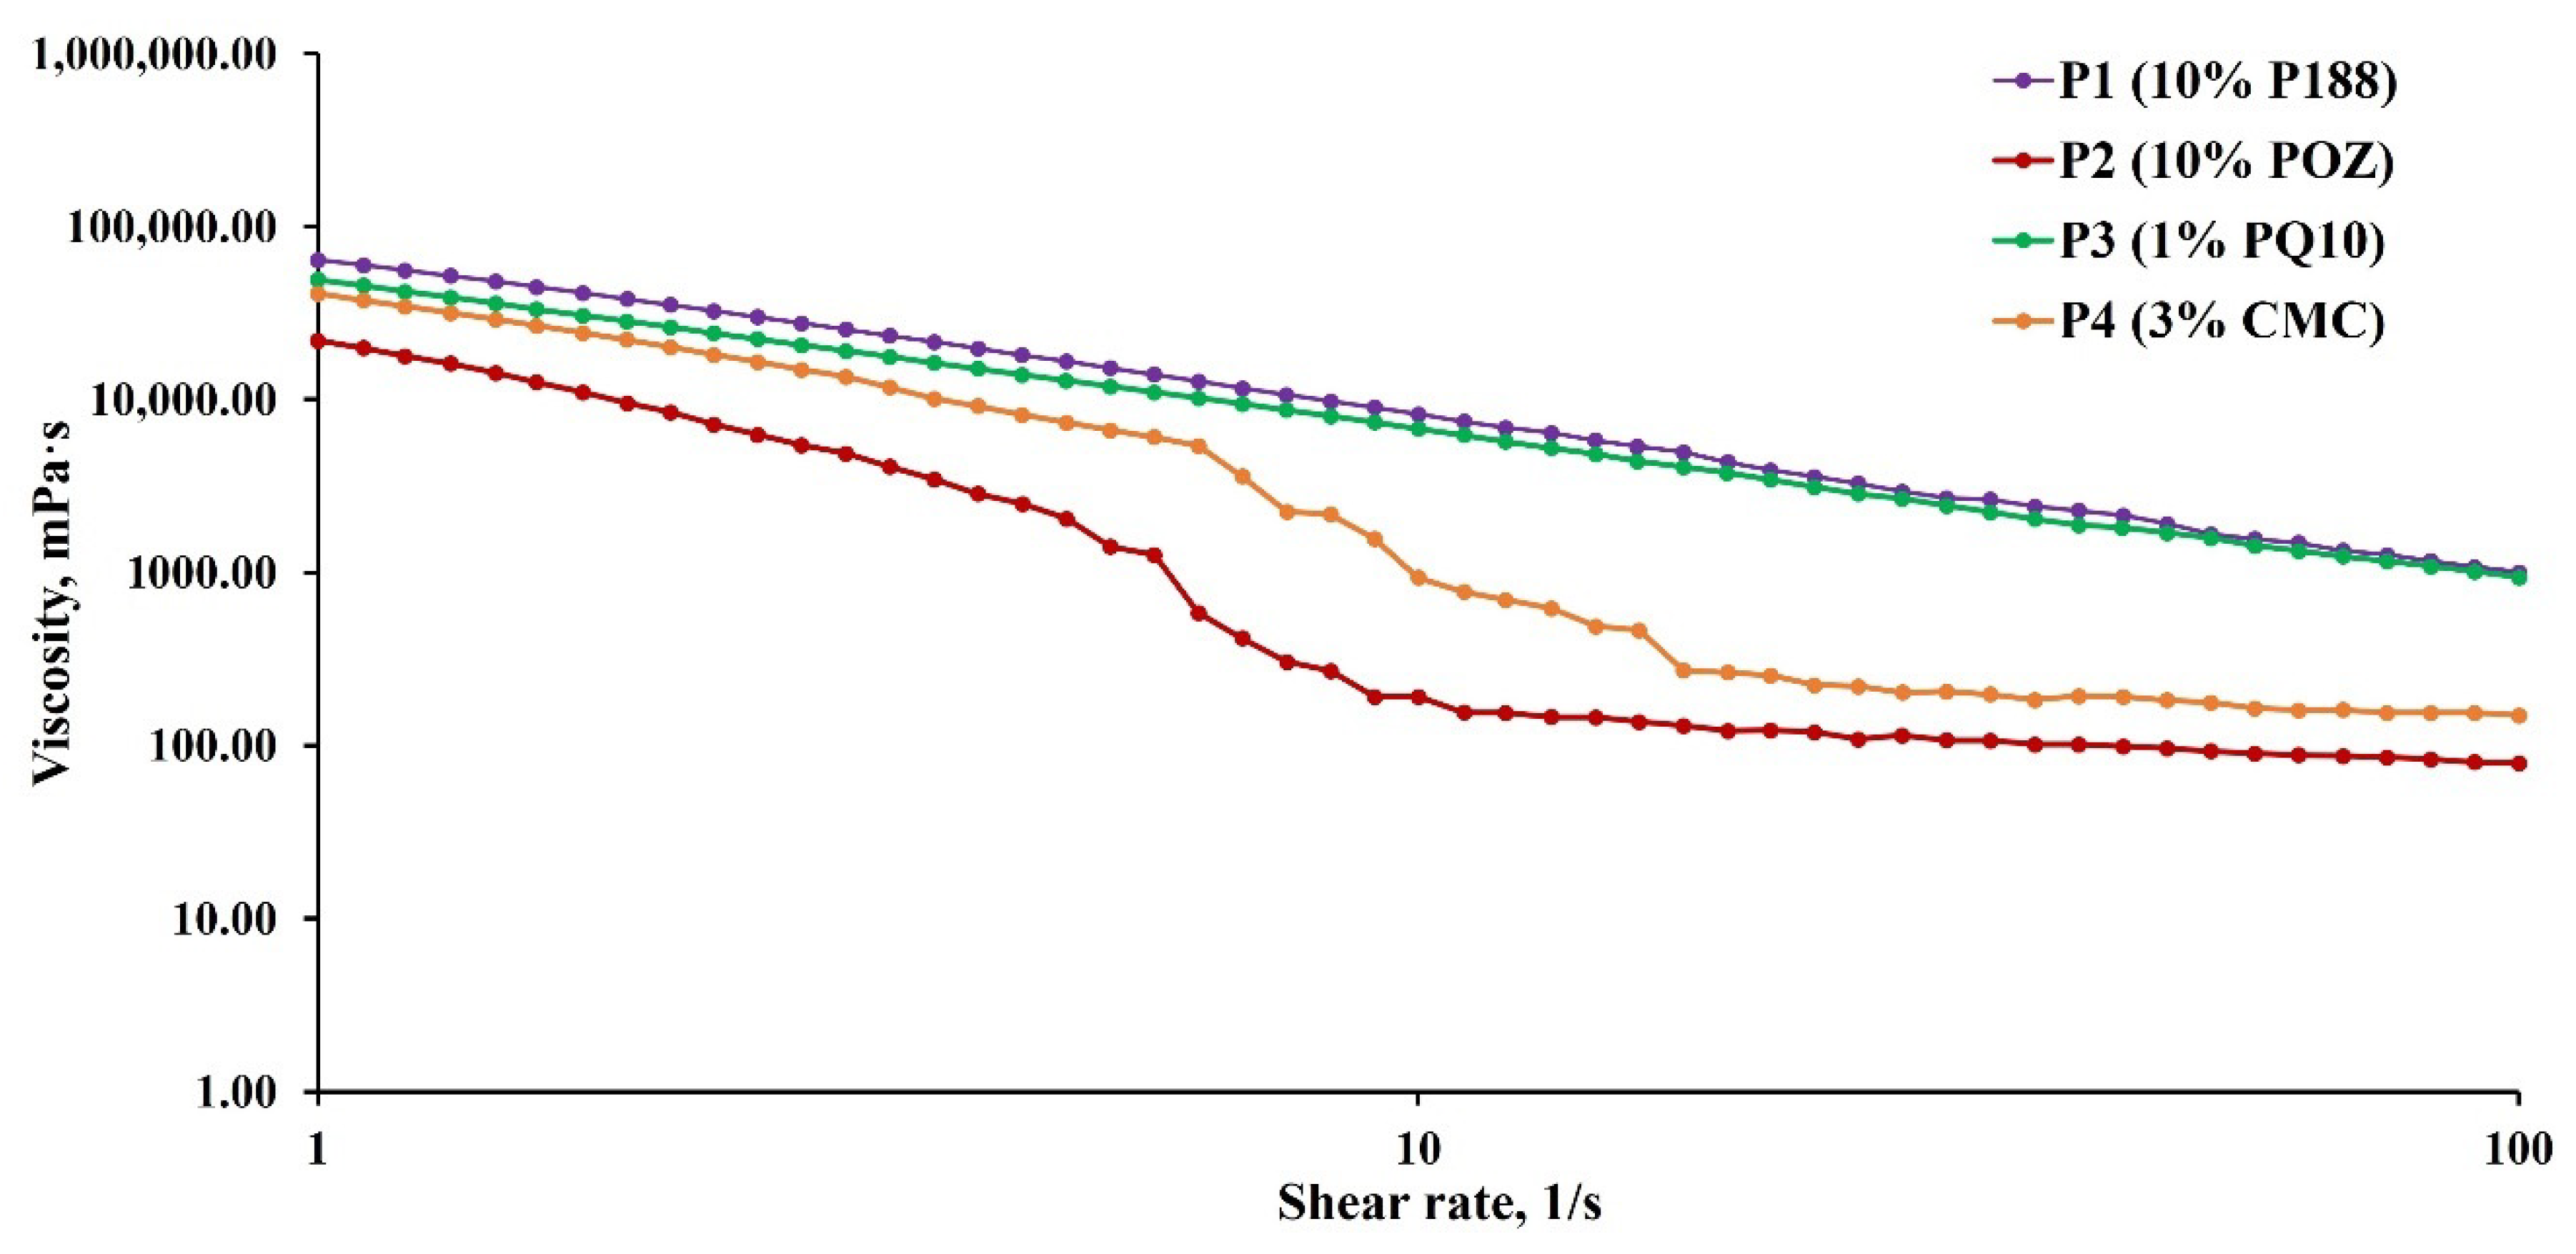
2.3.4. Rheology
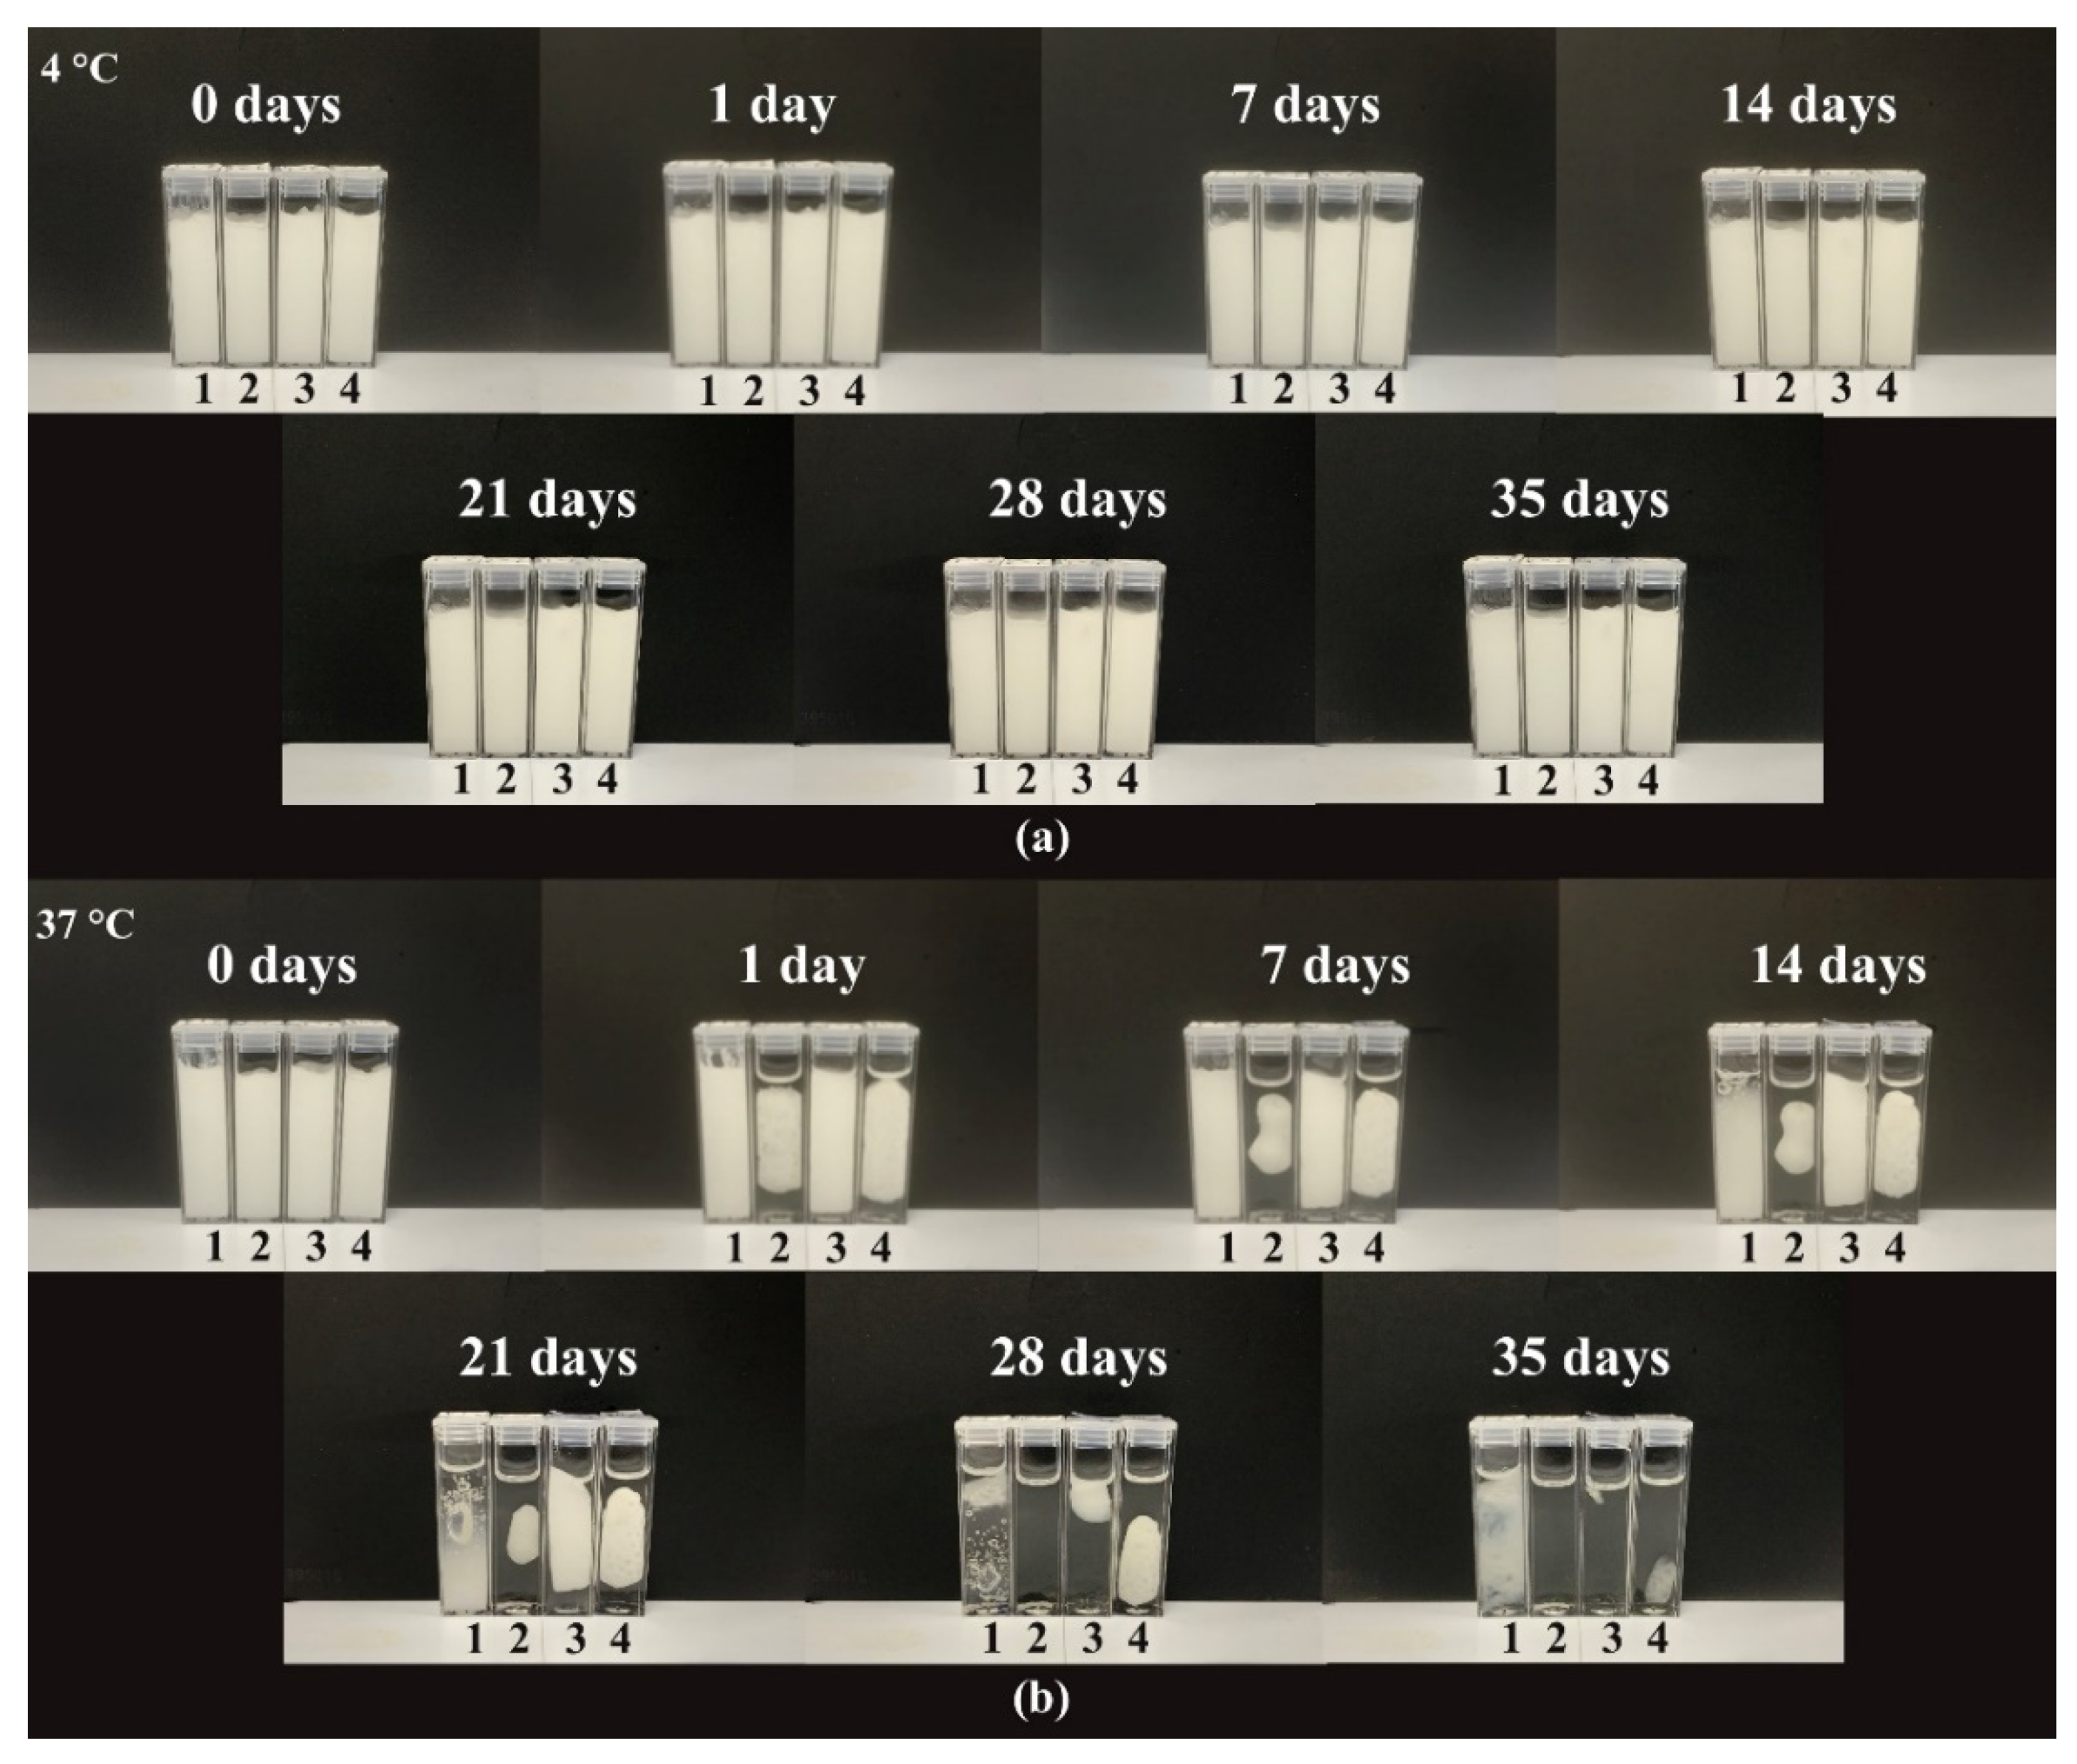
2.3.5. Stability
2.4. The In Vitro Retention Test of the Polyaphrons on a Bovine Cornea
2.4.1. The Preparation of the Simulated Tear Fluid (STF)
2.4.2. The Mucoadhesion Test
2.5. Toxicity Assessment
2.5.1. Slug Mucosal Irritation Test (SMIT)
2.5.2. Bovine Corneal Opacity and Permeability (BCOP) Test
2.6. The Statistical Analysis
3. Results and Discussion
3.1. The Physicochemical Characterisation
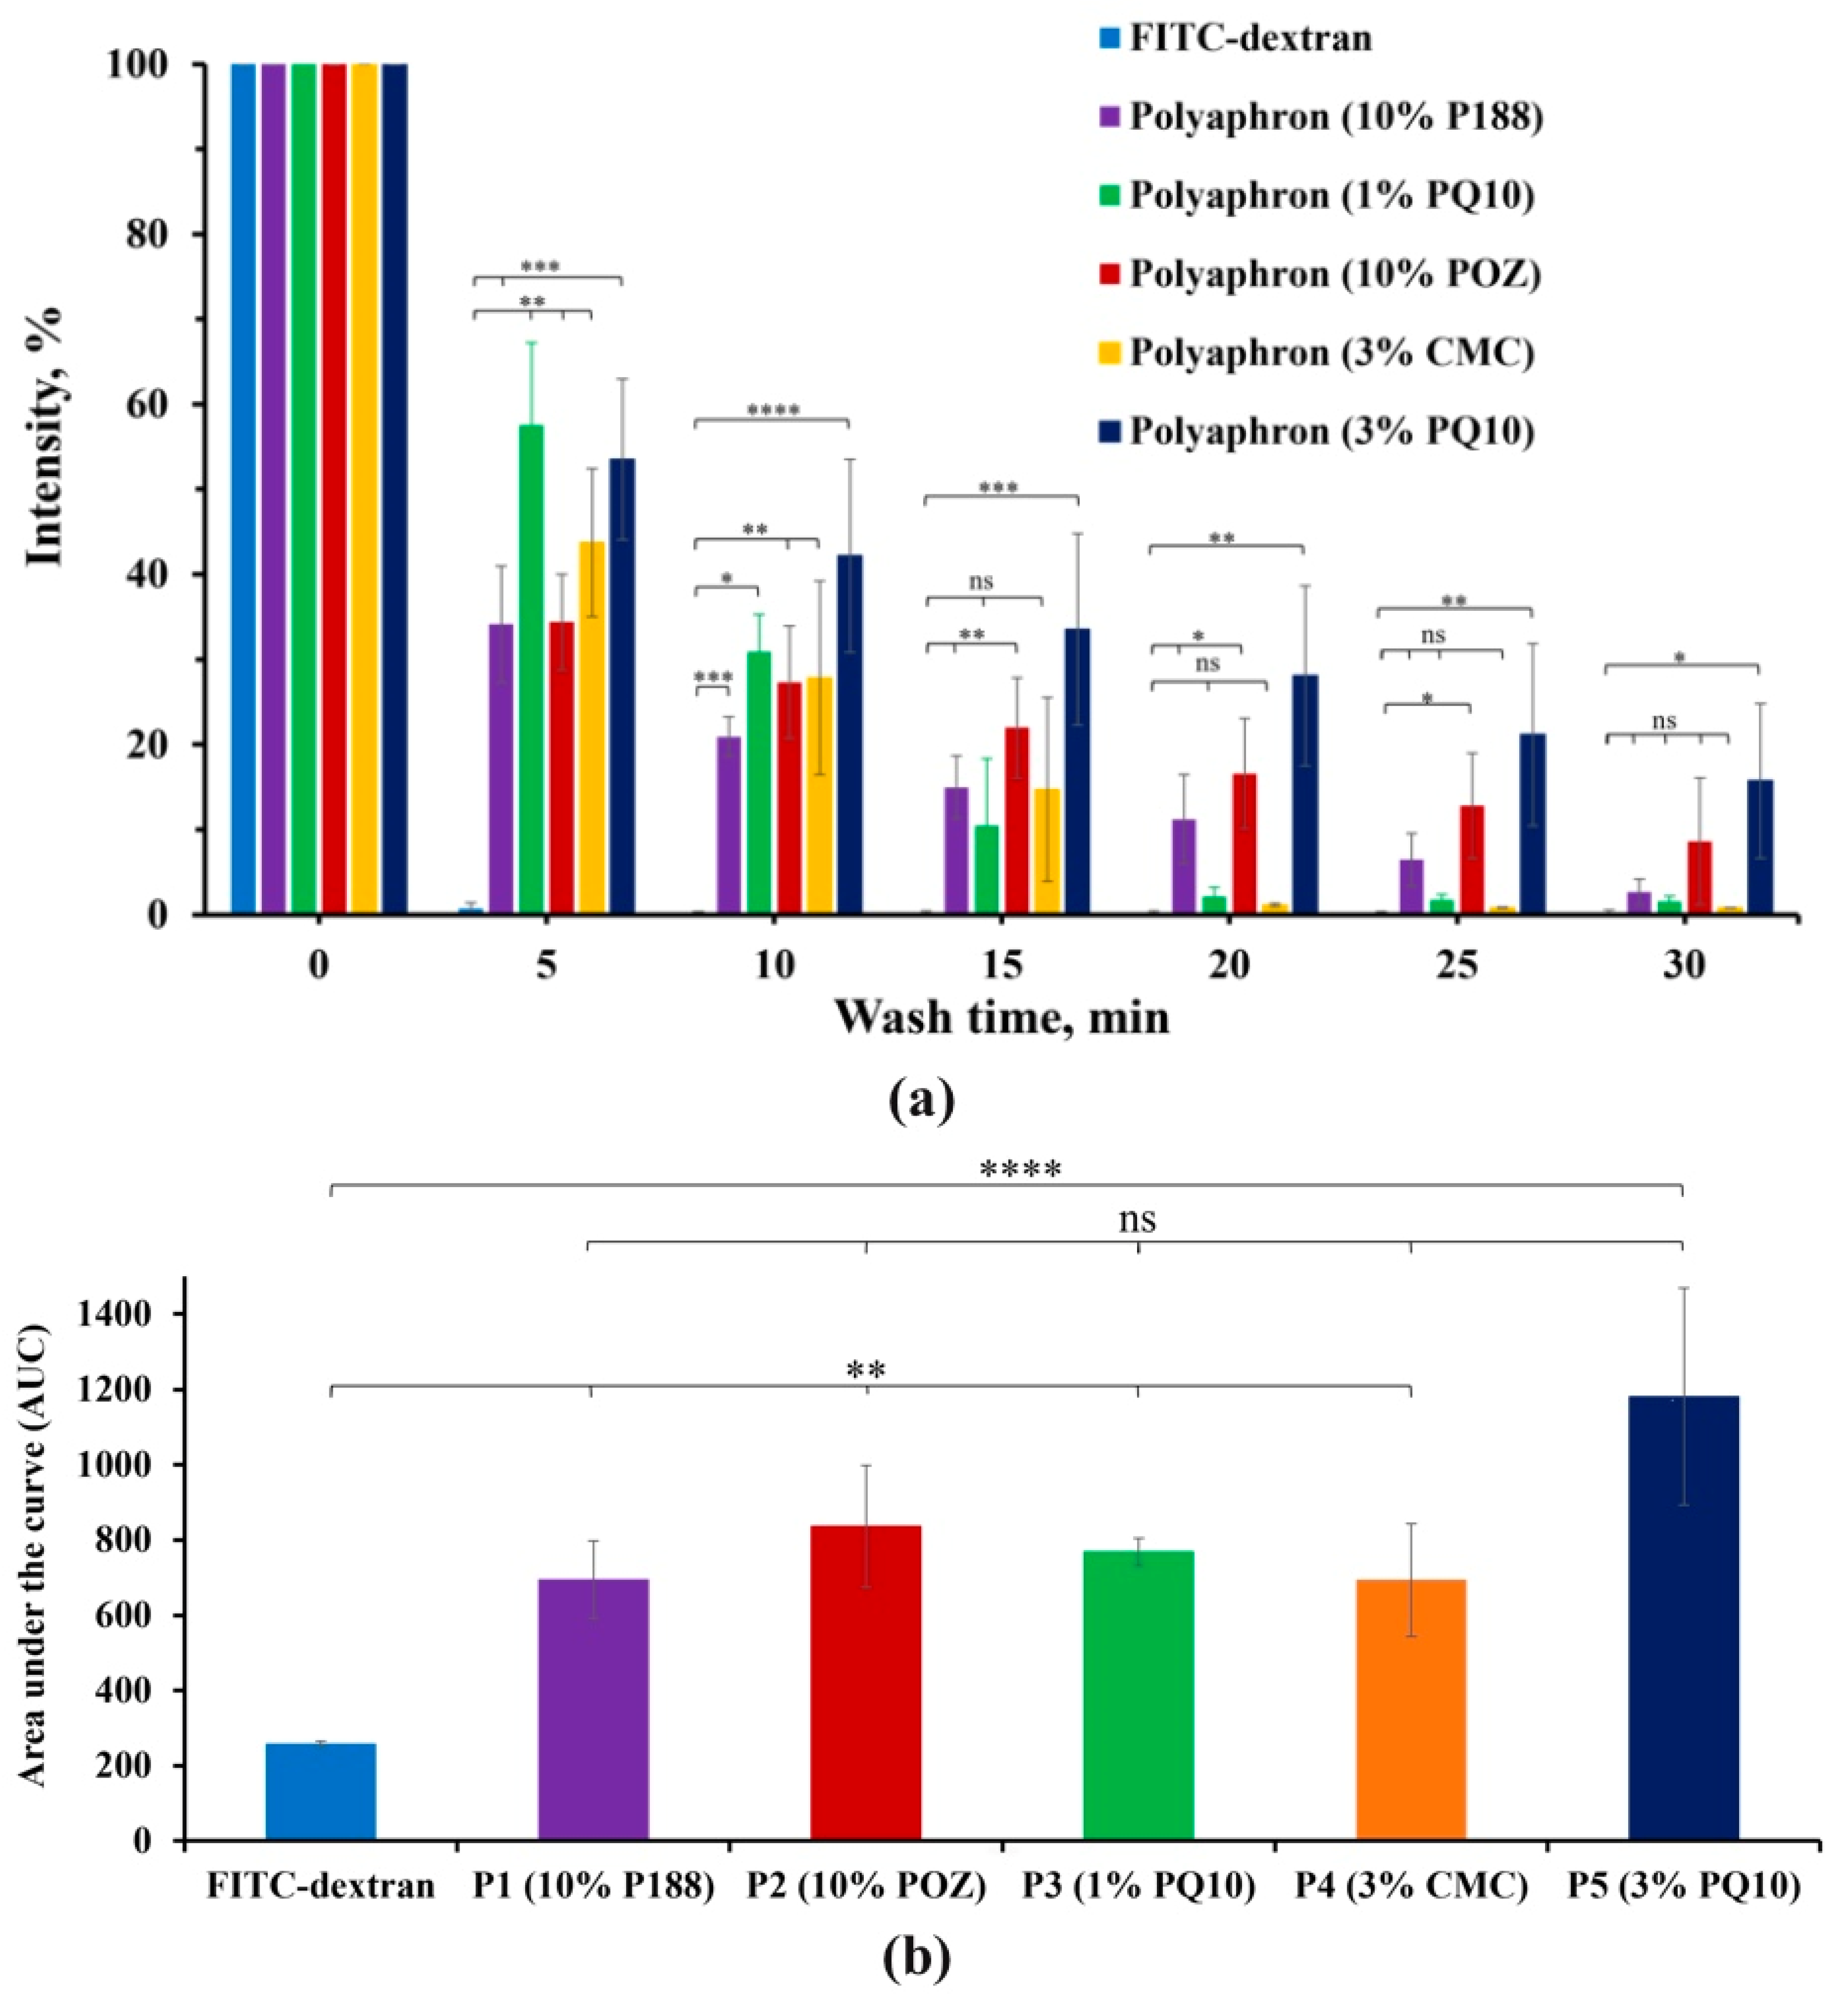
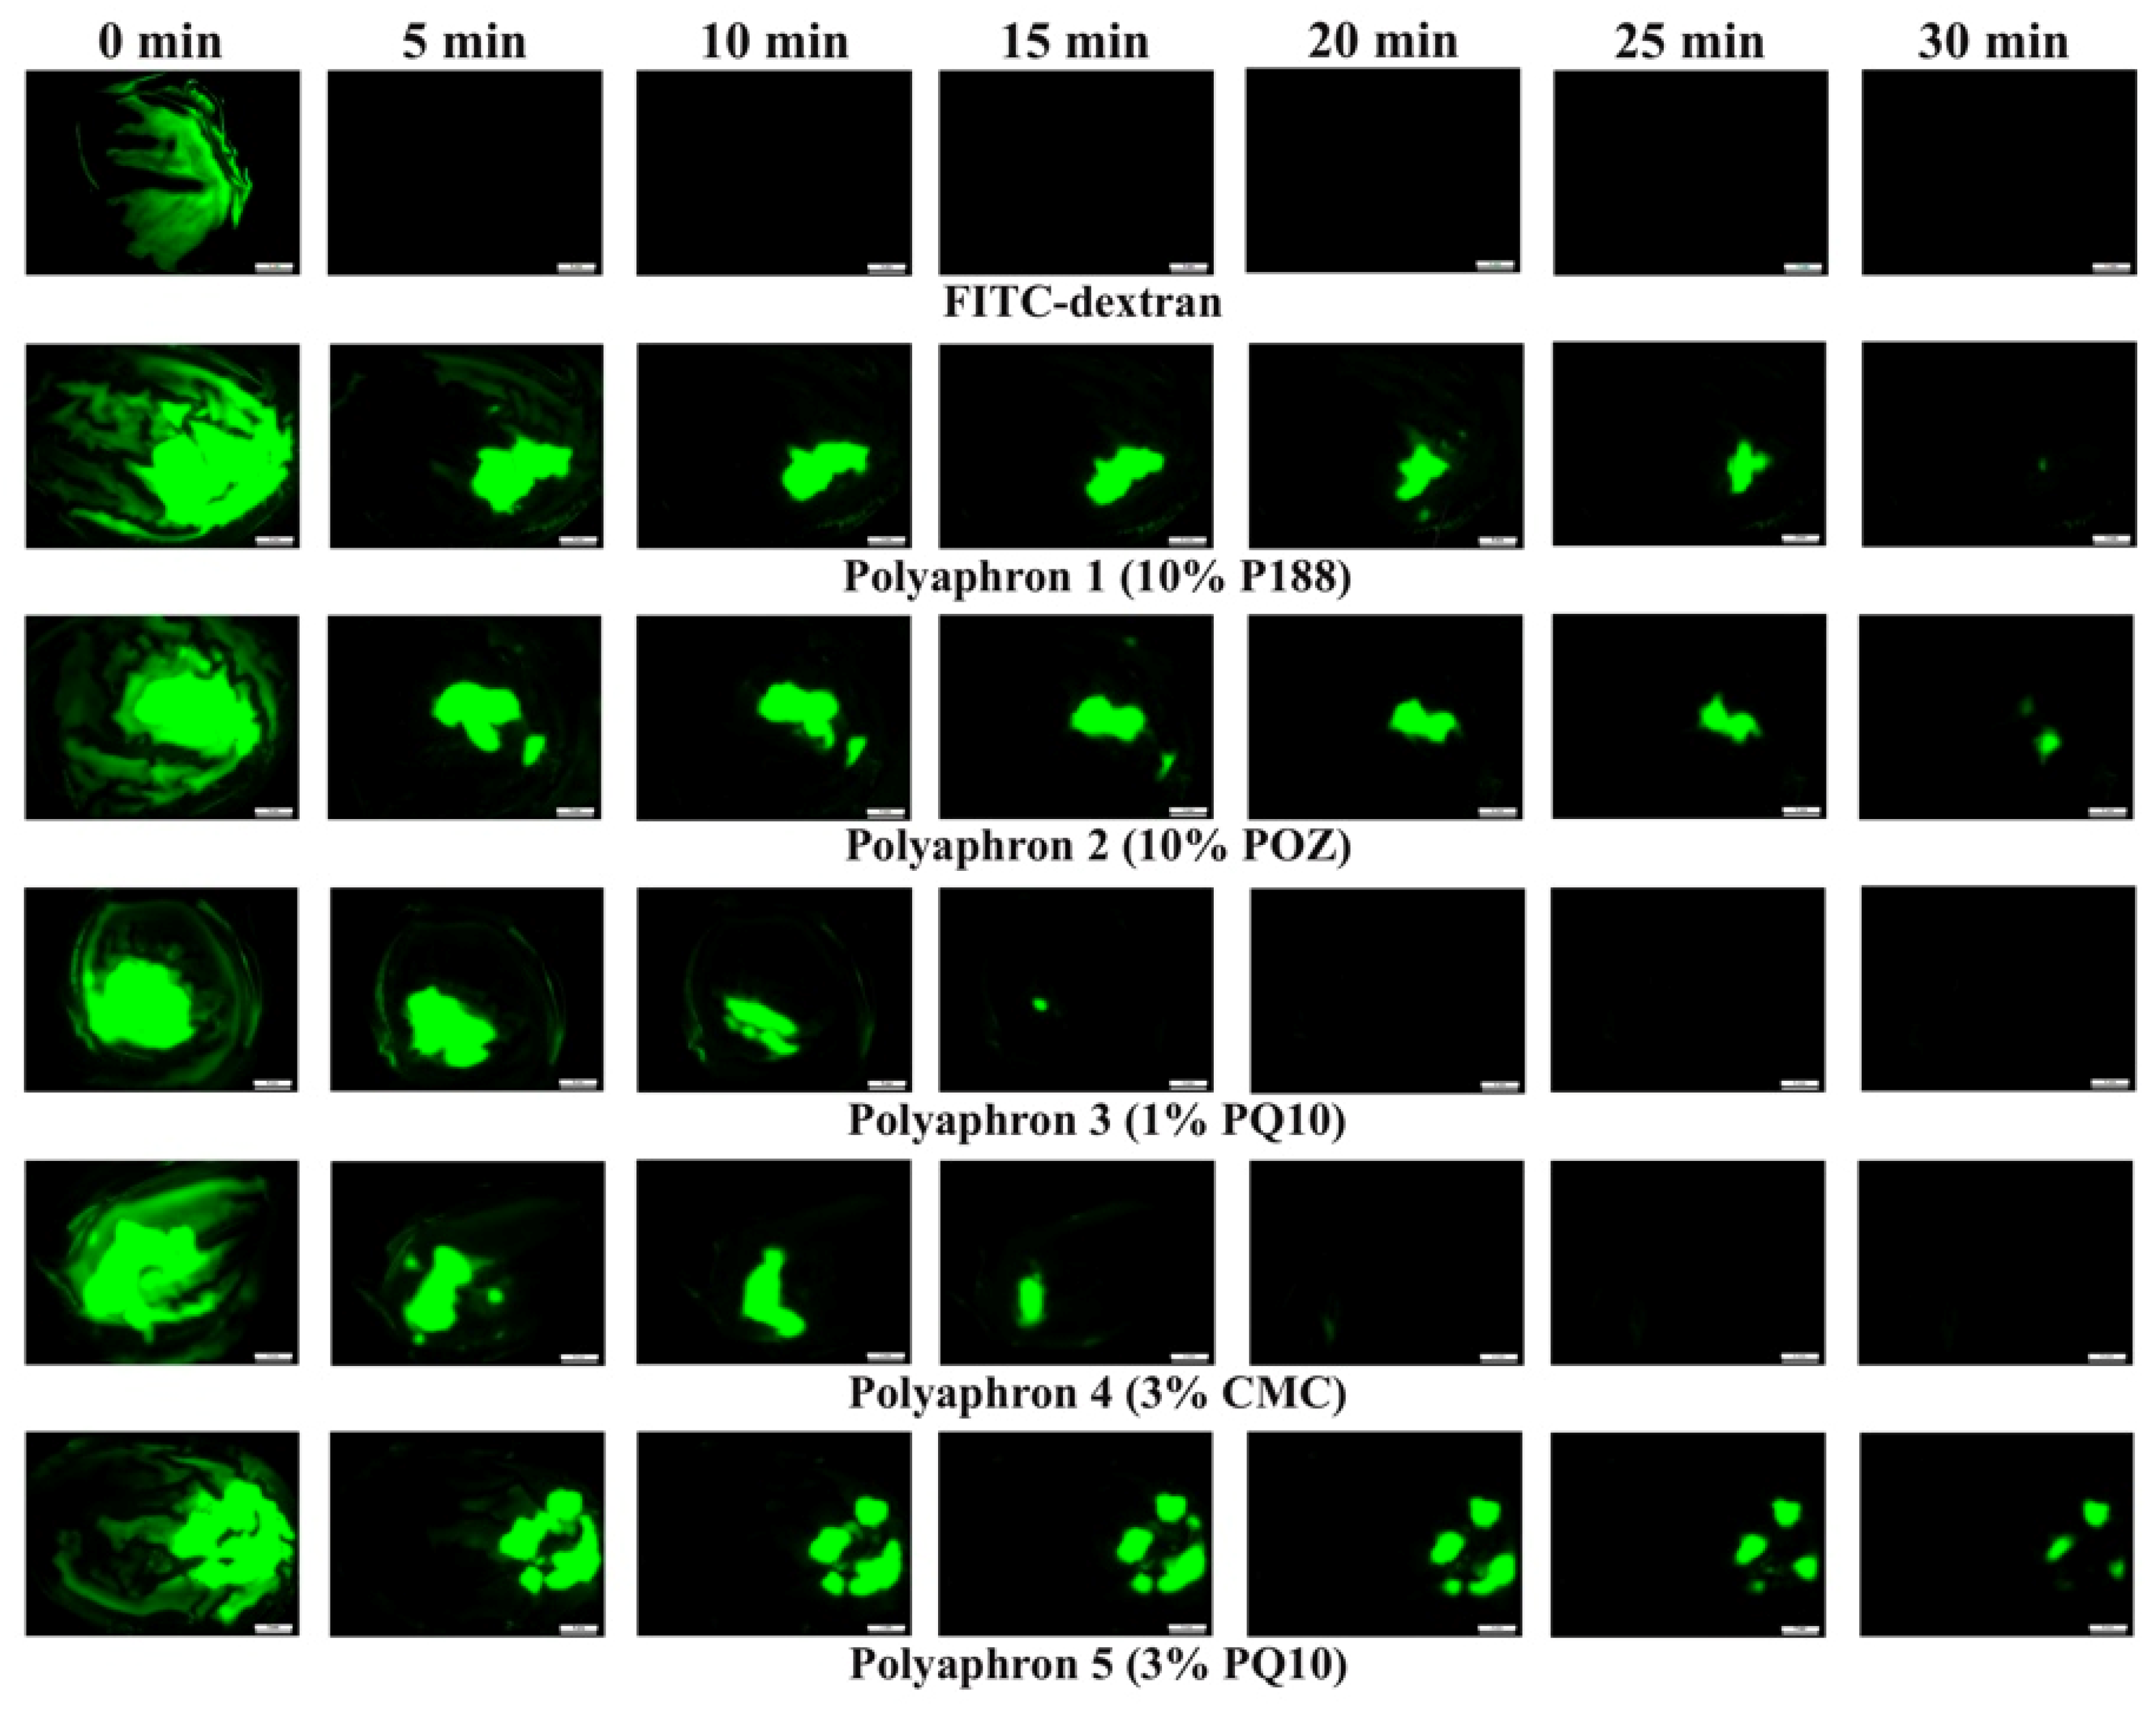
3.2. The In Vitro Retention on the Bovine Cornea
3.3. The Toxicity Assessment
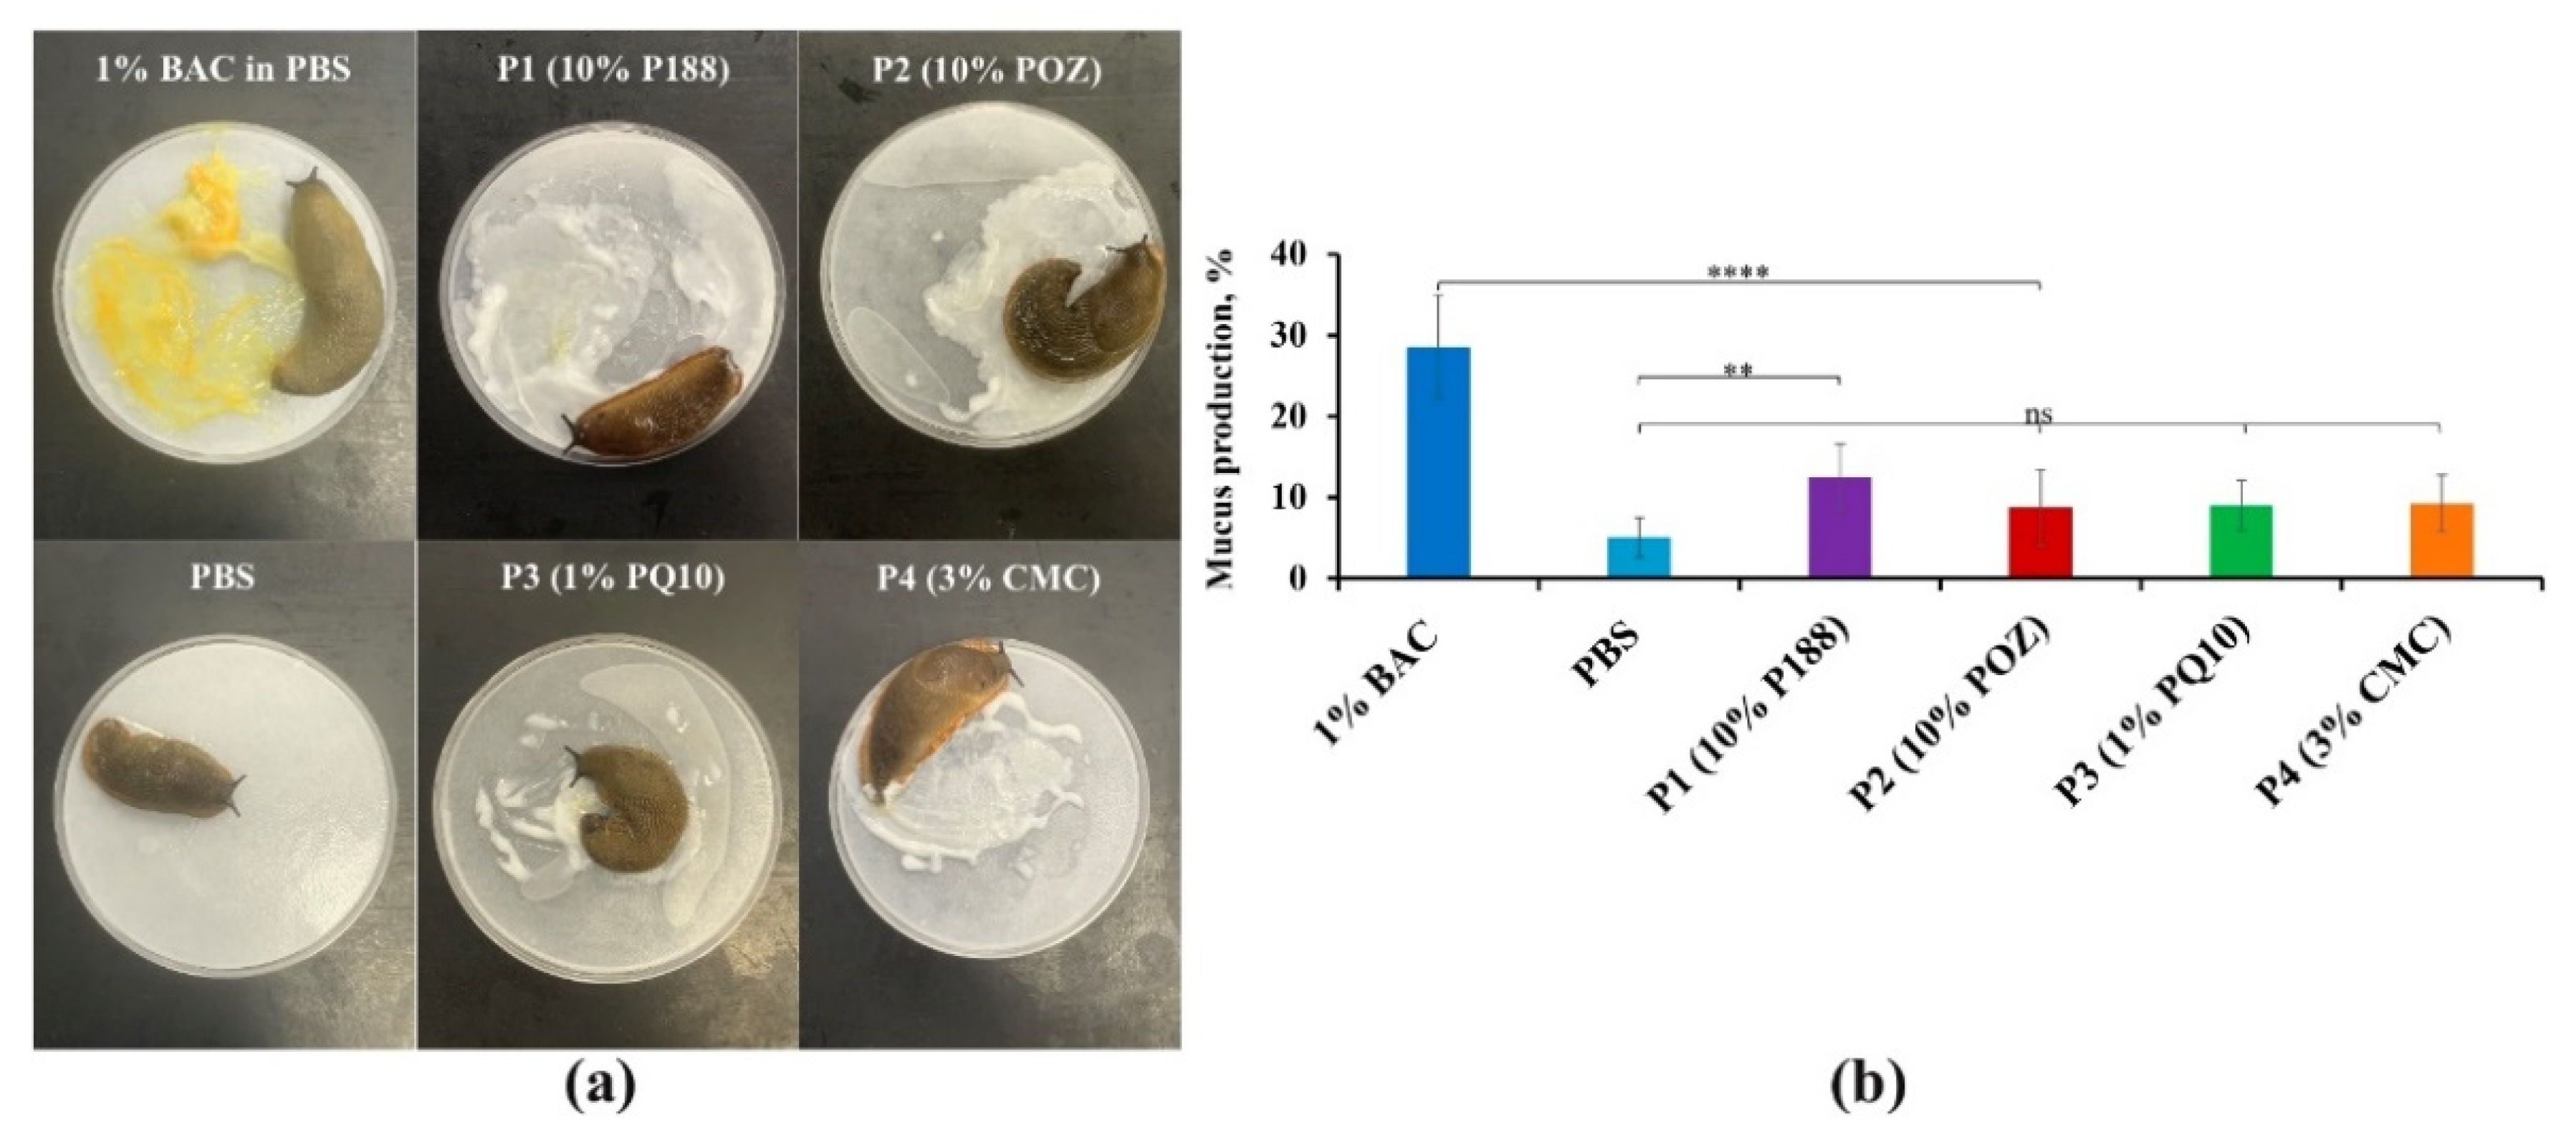
3.3.1. The Slug Mucosal Irritation Test
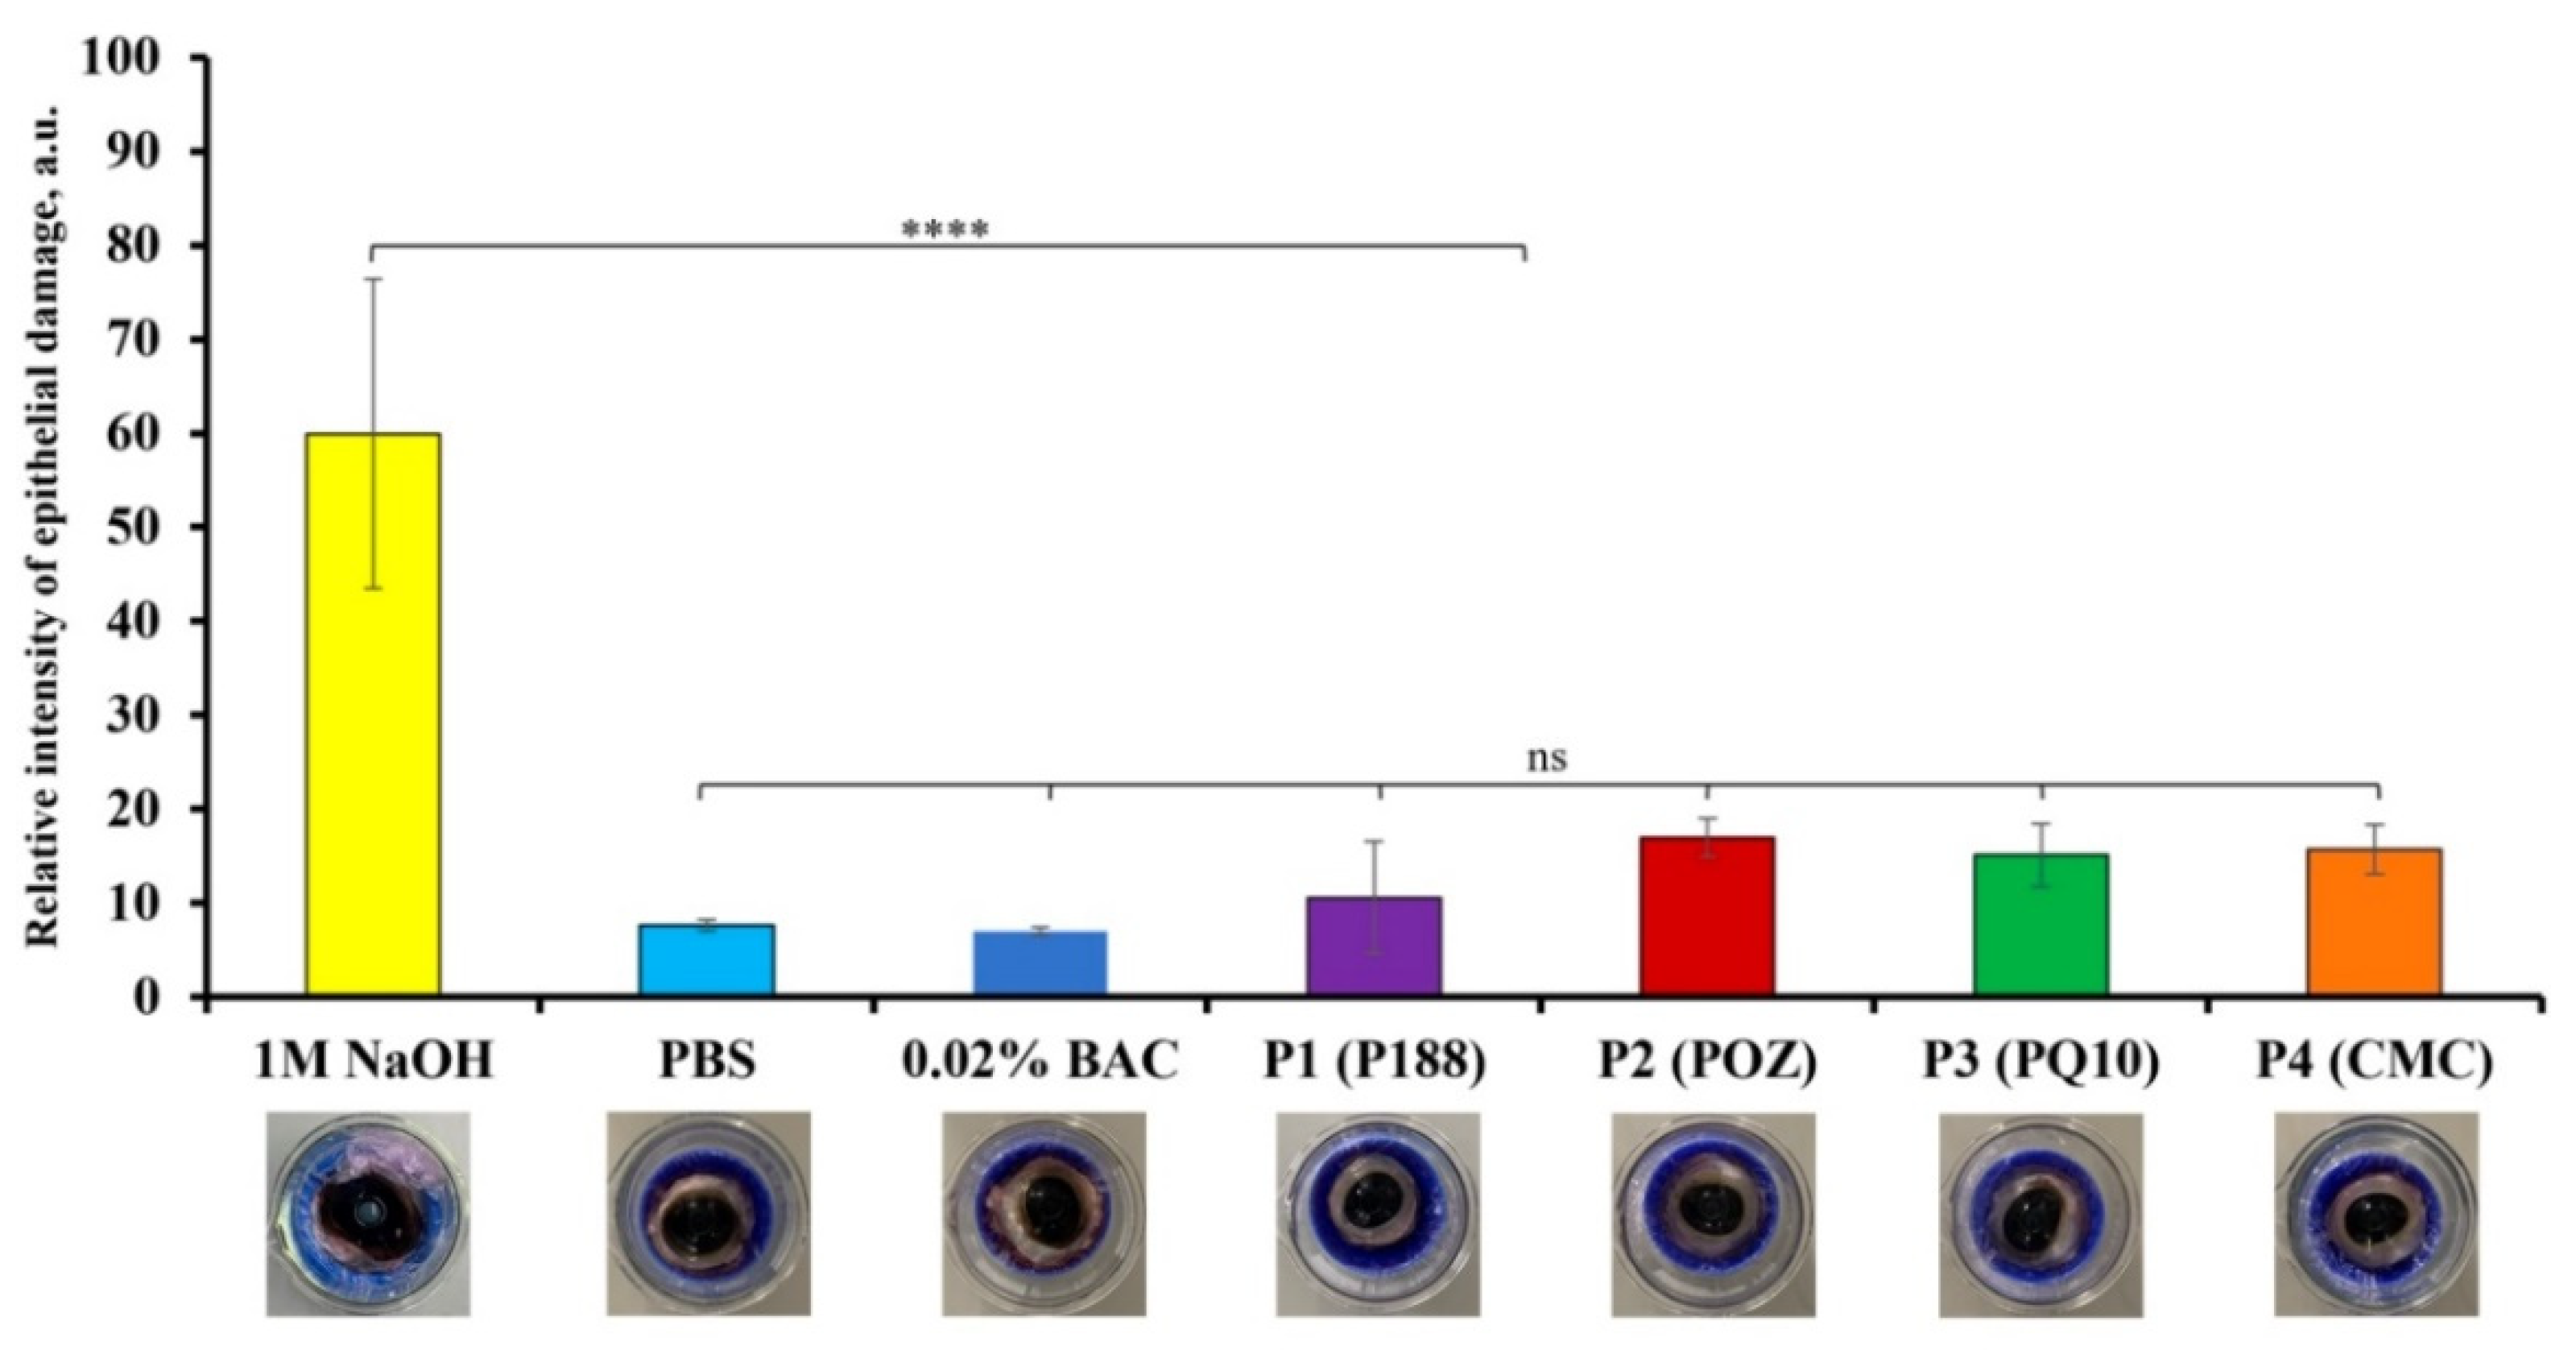
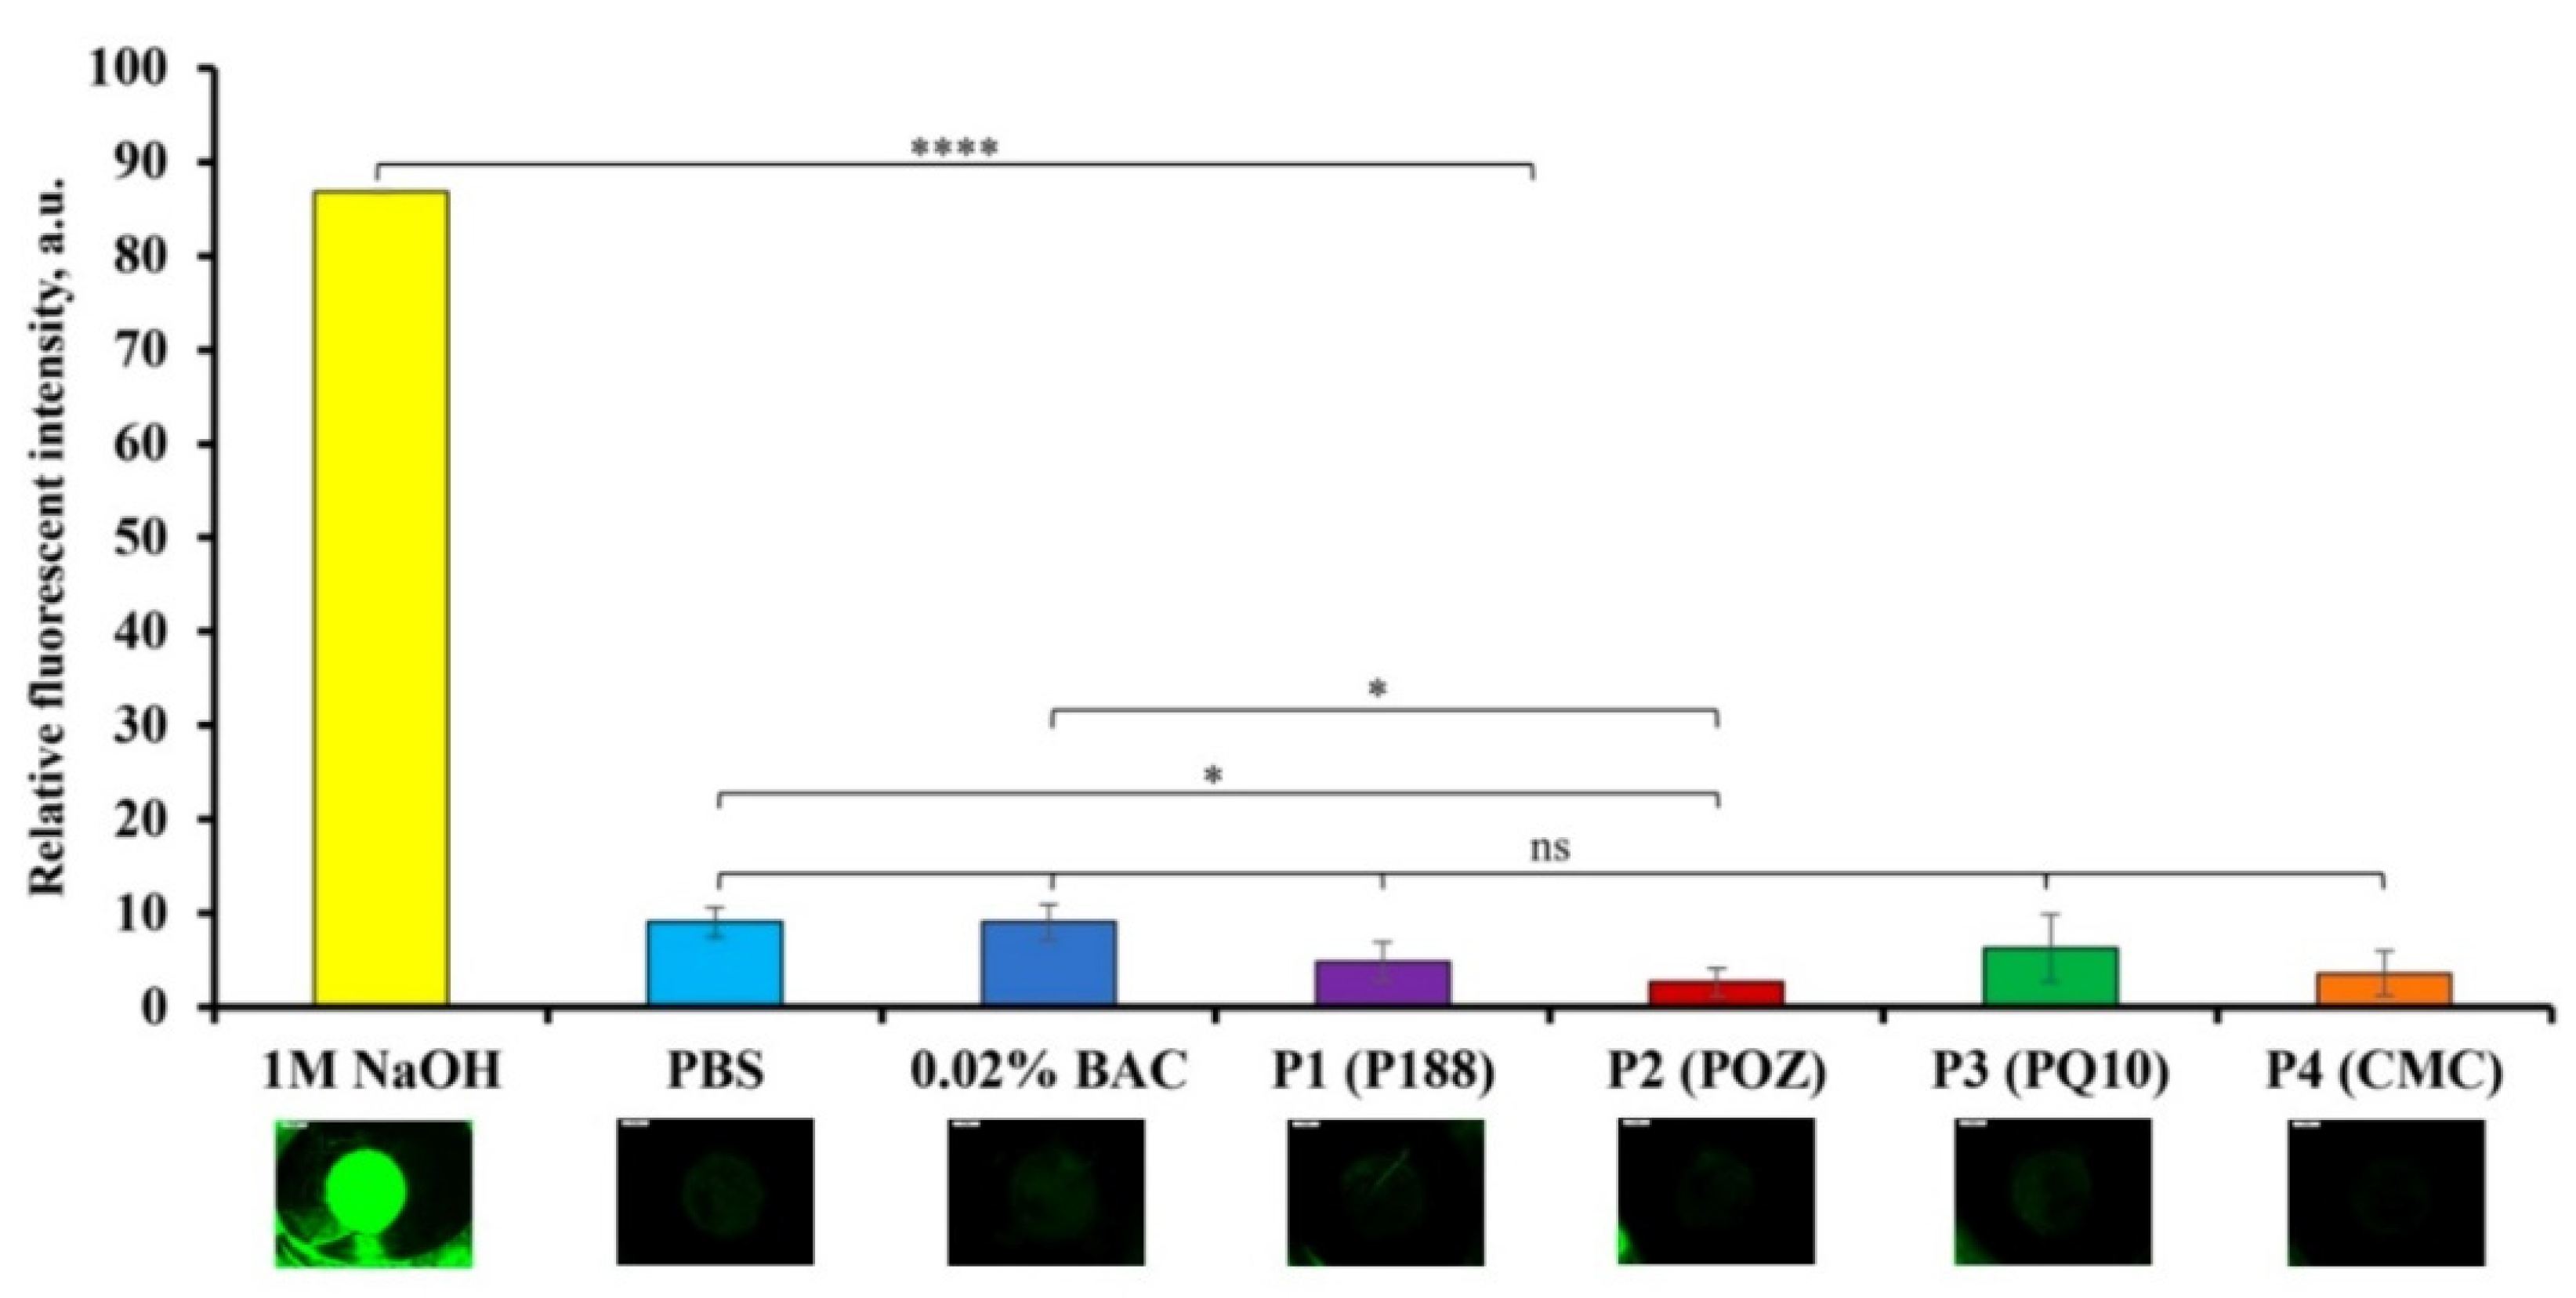
3.3.2. The Bovine Corneal Opacity and Permeability (BCOP) Test
4. Conclusions
Supplementary Materials
Author Contributions
Funding
Institutional Review Board Statement
Informed Consent Statement
Data Availability Statement
Acknowledgments
Conflicts of Interest
References
- WHO. Blindness and Vision Impairment. Available online: https://www.who.int/news-room/fact-sheets/detail/blindness-and-visual-impairment (accessed on 17 January 2022).
- Järvinen, T.; Järvinen, K. Prodrugs for improved ocular drug delivery. Adv. Drug Deliv. Rev. 1996, 19, 203–224. [Google Scholar] [CrossRef]
- Tamilvanan, S. Oil-in-water lipid emulsions: Implications for parenteral and ocular delivering systems. Prog. Lipid Res. 2004, 43, 489–533. [Google Scholar] [CrossRef] [PubMed]
- Lang, J.C. Ocular drug delivery conventional ocular formulations. Adv. Drug Deliv. Rev. 1995, 16, 39–43. [Google Scholar] [CrossRef]
- Üstündağ Okur, N.; Çağlar, E.Ş.; Siafaka, P.I. Novel ocular drug delivery systems: An update on microemulsions. J. Ocul. Pharmacol. Ther. 2020, 36, 342–354. [Google Scholar] [CrossRef]
- Agrahari, V.; Mandal, A.; Agrahari, V.; Trinh, H.M.; Joseph, M.; Ray, A.; Hadji, H.; Mitra, R.; Pal, D.; Mitra, A.K. A comprehensive insight on ocular pharmacokinetics. Drug Deliv. Transl. Res. 2016, 6, 735–754. [Google Scholar] [CrossRef]
- Tiwari, R.; Pandey, V.; Asati, S.; Soni, V.; Jain, D. Therapeutic challenges in ocular delivery of lipid based emulsion. Egypt. J. Basic Appl. Sci. 2018, 5, 121–129. [Google Scholar] [CrossRef]
- Haβe, A.; Keipert, S. Development and characterization of microemulsions for ocular application. Eur. J. Pharm. Biopharm. 1997, 43, 179–183. [Google Scholar] [CrossRef]
- Lidich, N.; Garti-Levy, S.; Aserin, A.; Garti, N. Potentiality of microemulsion systems in treatment of ophthalmic disorders: Keratoconus and dry eye syndrome–In vivo study. Colloids Surf. B Biointerfaces 2019, 173, 226–232. [Google Scholar] [CrossRef]
- Lidich, N.; Wachtel, E.J.; Aserin, A.; Garti, N. Water-dilutable microemulsions for transepithelial ocular delivery of riboflavin phosphate. J. Colloid Interface Sci. 2016, 463, 342–348. [Google Scholar] [CrossRef]
- Narang, A.S.; Delmarre, D.; Gao, D. Stable drug encapsulation in micelles and microemulsions. Int. J. Pharm. 2007, 345, 9–25. [Google Scholar] [CrossRef]
- Klang, S.; Abdulrazik, M.; Benita, S. Influence of emulsion droplet surface charge on indomethacin ocular tissue distribution. Pharm. Dev. Technol. 2000, 5, 521–532. [Google Scholar] [CrossRef] [PubMed]
- Kalam, M.A.; Alshamsan, A.; Aljuffali, I.A.; Mishra, A.K.; Sultana, Y. Delivery of gatifloxacin using microemulsion as vehicle: Formulation, evaluation, transcorneal permeation and aqueous humor drug determination. Drug Deliv. 2016, 23, 886–897. [Google Scholar] [CrossRef] [PubMed]
- Üstündag-Okur, N.; Gökçe, E.H.; Eğrilmez, S.; Özer, Ö.; Ertan, G. Novel ofloxacin-loaded microemulsion formulations for ocular delivery. J. Ocul. Pharmacol. Ther. 2014, 30, 319–332. [Google Scholar] [CrossRef] [PubMed]
- Vandamme, T.F. Microemulsions as ocular drug delivery systems: Recent developments and future challenges. Prog. Retin. Eye Res. 2002, 21, 15–34. [Google Scholar] [CrossRef]
- Benita, S.; Elbaz, E. Oil-in-Water Emulsions of Positively Charged Particles. WO Patent Application No. 1993018852A9, 15 March 1993. [Google Scholar]
- Peng, C.; Bengani, L.; Jung, H.; Leclerc, J.; Gupta, C.; Chauhan, A. Emulsions and microemulsions for ocular drug delivery. J. Drug Deliv. Sci. Technol. 2011, 21, 111–121. [Google Scholar] [CrossRef]
- Benita, S.; Muchtar, S. Ophthalmic Compositions. EP Patent Application No. 0521799A1, 7 January 1993. [Google Scholar]
- Sebba, F. Biliquid foams—A preliminary report. J. Colloid Interface Sci. 1972, 40, 468–474. [Google Scholar] [CrossRef]
- Sebba, F. The behaviour of minute oil droplets encapsulated in a water film. Colloid Polym. Sci. 1979, 257, 392–396. [Google Scholar] [CrossRef]
- Sebba, F. Foams and Biliquid Foams, Aphrons; Wiley: Hoboken, NJ, USA, 1987. [Google Scholar]
- Wheeler, D.A.; Steele, D.F. Pharmaceutical Composition. U.S. Patent Application No. 2010/0260835 A1, 14 October 2010. [Google Scholar]
- Wheeler, D.A.; Steele, D.F.; Georgiou, M.; Sindet-Pedersen, S. Topical Composition. U.S. Patent Application No. 2008/0234239 A1, 25 September 2008. [Google Scholar]
- Lamb, S.B.; Lamb, D.C.; Kelly, S.L.; Stuckey, D.C. Cytochrome P450 immobilisation as a route to bioremediation/biocatalysis. FEBS Lett. 1998, 431, 343–346. [Google Scholar] [CrossRef] [Green Version]
- Lye, G.J.; Stuckey, D.C. Extraction of erythromycin-A using colloidal liquid aphrons: I. Equilibrium partitioning. J. Chem. Technol. Biotechnol. Int. Res. Process Environ. Clean Technol. 2000, 75, 339–347. [Google Scholar] [CrossRef]
- Lye, G.; Stuckey, D. Extraction of erythromycin-A using colloidal liquid aphrons: Part II. Mass transfer kinetics. Chem. Eng. Sci. 2001, 56, 97–108. [Google Scholar] [CrossRef]
- Lallemand, F.; Schmitt, M.; Bourges, J.-L.; Gurny, R.; Benita, S.; Garrigue, J.-S. Cyclosporine A delivery to the eye: A comprehensive review of academic and industrial efforts. Eur. J. Pharm. Biopharm. 2017, 117, 14–28. [Google Scholar] [CrossRef] [PubMed]
- Srividya, B.; Cardoza, R.M.; Amin, P. Sustained ophthalmic delivery of ofloxacin from a pH triggered in situ gelling system. J. Control. Release 2001, 73, 205–211. [Google Scholar] [CrossRef]
- Chang, A.Y.; Purt, B. Biochemistry, Tear Film. In StatPearls [Internet]; StatPearls Publishing: Treasure Island, FL, USA, 2021. [Google Scholar]
- Van Haeringen, N.J. Clinical biochemistry of tears. Surv. Ophthalmol. 1981, 26, 84–96. [Google Scholar]
- Cave, R.A.; Cook, J.P.; Connon, C.J.; Khutoryanskiy, V.V. A flow system for the on-line quantitative measurement of the retention of dosage forms on biological surfaces using spectroscopy and image analysis. Int. J. Pharm. 2012, 428, 96–102. [Google Scholar] [CrossRef]
- Kessel, L.; Johnson, L.; Arvidsson, H.; Larsen, M. The relationship between body and ambient temperature and corneal temperature. Investig. Ophthalmol. Vis. Sci. 2010, 51, 6593–6597. [Google Scholar] [CrossRef] [PubMed]
- Khutoryanskaya, O.V.; Morrison, P.W.; Seilkhanov, S.K.; Mussin, M.N.; Ozhmukhametova, E.K.; Rakhypbekov, T.K.; Khutoryanskiy, V.V. Hydrogen-Bonded Complexes and Blends of Poly (acrylic acid) and Methylcellulose: Nanoparticles and Mucoadhesive Films for Ocular Delivery of Riboflavin. Macromol. Biosci. 2014, 14, 225–234. [Google Scholar] [CrossRef] [Green Version]
- Abdelkader, H.; Ismail, S.; Hussein, A.; Wu, Z.; Al-Kassas, R.; Alany, R.G. Conjunctival and corneal tolerability assessment of ocular naltrexone niosomes and their ingredients on the hen’s egg chorioallantoic membrane and excised bovine cornea models. Int. J. Pharm. 2012, 432, 1–10. [Google Scholar]
- Gautheron, P.; Dukik, M.; Alix, D.; Sina, J.F. Bovine corneal opacity and permeability test: An in vitro assay of ocular irritancy. Toxicol. Sci. 1992, 18, 442–449. [Google Scholar] [CrossRef]
- Goldstein, M.H.; Silva, F.Q.; Blender, N.; Tran, T.; Vantipalli, S. Ocular benzalkonium chloride exposure: Problems and solutions. Eye 2021, 36, 361–368. [Google Scholar] [CrossRef]
- Abilova, G.K.; Kaldybekov, D.B.; Ozhmukhametova, E.K.; Saimova, A.Z.; Kazybayeva, D.S.; Irmukhametova, G.S.; Khutoryanskiy, V.V. Chitosan/poly (2-ethyl-2-oxazoline) films for ocular drug delivery: Formulation, miscibility, in vitro and in vivo studies. Eur. Polym. J. 2019, 116, 311–320. [Google Scholar] [CrossRef]
- Hwang, Y.-S.; Chiang, P.-R.; Hong, W.-H.; Chiao, C.-C.; Chu, I.-M.; Hsiue, G.-H.; Shen, C.-R. Study in vivo intraocular biocompatibility of in situ gelation hydrogels: Poly (2-ethyl oxazoline)-block-poly (ε-caprolactone)-block-poly (2-ethyl oxazoline) copolymer, matrigel and pluronic F127. PLoS ONE 2013, 8, e67495. [Google Scholar] [CrossRef] [PubMed]
- Alasino, R.V.; Garcia, L.G.; Gramajo, A.L.; Pusterla, J.P.; Beltramo, D.M.; Luna, J.D. Ocular biocompatibility of polyquaternium 10 gel: Functional and morphological results. J. Mater. Sci. Mater. Med. 2015, 26, 64. [Google Scholar] [CrossRef] [PubMed]
- 3 Final Report on the Safety Assessment of Polyquaternium-10. J. Am. Coll. Toxicol. 1988, 7, 335–351. [CrossRef]
- Labetoulle, M.; Chiambaretta, F.; Shirlaw, A.; Leaback, R.; Baudouin, C. Osmoprotectants, carboxymethylcellulose and hyaluronic acid multi-ingredient eye drop: A randomised controlled trial in moderate to severe dry eye. Eye 2017, 31, 1409–1416. [Google Scholar] [CrossRef] [PubMed] [Green Version]
- Garrett, Q.; Simmons, P.A.; Xu, S.; Vehige, J.; Zhao, Z.; Ehrmann, K.; Willcox, M. Carboxymethylcellulose binds to human corneal epithelial cells and is a modulator of corneal epithelial wound healing. Investig. Ophthalmol. Vis. Sci. 2007, 48, 1559–1567. [Google Scholar] [CrossRef] [Green Version]
- Taylor, K.M.; Aulton, M.E. Ocular Drug Delivery. In Aulton’s Pharmaceutics E-Book: The Design and Manufacture of Medicines, 5th ed.; Elsevier Health Sciences: Amsterdam, The Netherlands, 2017; p. 690. [Google Scholar]
- Lu, G.; Gao, P. CHAPTER 3—Emulsions and Microemulsions for Topical and Transdermal Drug Delivery A2—Kulkarni, Vitthal S. In Handbook of Non-Invasive Drug Delivery Systems; William Andrew Publishing: Boston, MA, USA, 2010. [Google Scholar]
- Lye, G.; Stuckey, D. Structure and stability of colloidal liquid aphrons. Colloids Surf. A Physicochem. Eng. Asp. 1998, 131, 119–136. [Google Scholar] [CrossRef]
- Sheng, J.J. Alkaline-Surfactant-Polymer Flooding. In Modern Chemical Enhanced Oil Recovery: Theory and Practice; Elsevier Science: Amsterdam, The Netherlands, 2010; pp. 501–565. [Google Scholar]
- Macosko, C.W. Rheology principles. In Measurements and Applications; Wiley: Hoboken, NJ, USA, 1994. [Google Scholar]
- Welch, C.F.; Rose, G.D.; Malotky, D.; Eckersley, S.T. Rheology of high internal phase emulsions. Langmuir 2006, 22, 1544–1550. [Google Scholar] [CrossRef]
- Soliman, K.A.; Ullah, K.; Shah, A.; Jones, D.S.; Singh, T.R. Poloxamer-based in situ gelling thermoresponsive systems for ocular drug delivery applications. Drug Discov. Today 2019, 24, 1575–1586. [Google Scholar] [CrossRef]
- SWAN, K.C. Use of methyl cellulose in ophthalmology. Arch. Ophthalmol. 1945, 33, 378–380. [Google Scholar] [CrossRef]
- Ludwig, A. The use of mucoadhesive polymers in ocular drug delivery. Adv. Drug Deliv. Rev. 2005, 57, 1595–1639. [Google Scholar] [CrossRef]
- Lee, V.H.; Robinson, J.R. Topical ocular drug delivery: Recent developments and future challenges. J. Ocul. Pharmacol. Ther. 1986, 2, 67–108. [Google Scholar] [CrossRef] [PubMed]
- Prather, W.; Stoecker, J.; Vehige, J.; Simmons, P. Clinical performance of a new mid-viscosity artificial tear for dry eye treatment. Investig. Ophthalmol. Vis. Sci. 2002, 43, 3152. [Google Scholar]
- Paugh, J.R.; Chatelier, R.C.; Huff, J.W. Ocular residence time of carboxymethylcellulose solutions. In Lacrimal Gland, Tear Film, and Dry Eye Syndromes 2; Springer: Berlin/Heidelberg, Germany, 1998; pp. 761–767. [Google Scholar]
- Draize, J.H. Methods for the study of irritation and toxicity of substances applied topically to the skin and mucous membranes. J. Pharmacol. Exp. Ther. 1944, 82, 377–390. [Google Scholar]
- Bruner, L.H.; Carr, G.J.; Curren, R.D.; Chamberlain, M. Validation of alternative methods for toxicity testing. Environ. Health Perspect. 1998, 106, 477–484. [Google Scholar]
- EMA. Ethical Use of Animals in Medicine Testing. Available online: https://www.ema.europa.eu/en/human-regulatory/research-development/ethical-use-animals-medicine-testing (accessed on 27 January 2022).
- Wilhelmus, K.R. The Draize eye test. Surv. Ophthalmol. 2001, 45, 493–515. [Google Scholar] [CrossRef]
- Scott, L.; Eskes, C.; Hoffmann, S.; Adriaens, E.; Alepée, N.; Bufo, M.; Clothier, R.; Facchini, D.; Faller, C.; Guest, R. A proposed eye irritation testing strategy to reduce and replace in vivo studies using bottom–up and top–down approaches. Toxicol. Vitr. 2010, 24, 1–9. [Google Scholar] [CrossRef]
- Lenoir, J.; Claerhout, I.; Kestelyn, P.; Klomp, A.; Remon, J.-P.; Adriaens, E. The slug mucosal irritation (SMI) assay: Development of a screening tool for the evaluation of ocular discomfort caused by shampoos. Toxicol. Vitr. 2011, 25, 1919–1925. [Google Scholar] [CrossRef]
- Adriaens, E.; Dhondt, M.; Remon, J.P. Refinement of the Slug Mucosal Irritation test as an alternative screening test for eye irritation. Toxicol. Vitr. 2005, 19, 79–89. [Google Scholar] [CrossRef]
- Verstraelen, S.; Jacobs, A.; De Wever, B.; Vanparys, P. Improvement of the Bovine Corneal Opacity and Permeability (BCOP) assay as an in vitro alternative to the Draize rabbit eye irritation test. Toxicol. Vitr. 2013, 27, 1298–1311. [Google Scholar] [CrossRef]
- Lee, M.; Hwang, J.-H.; Lim, K.-M. Alternatives to in vivo Draize rabbit eye and skin irritation tests with a focus on 3D reconstructed human cornea-like epithelium and epidermis models. Toxicol. Res. 2017, 33, 191–203. [Google Scholar] [CrossRef] [Green Version]
- Adriaens, E.; Remon, J.P. Gastropods as an evaluation tool for screening the irritating potency of absorption enhancers and drugs. Pharm. Res. 1999, 16, 1240–1244. [Google Scholar] [CrossRef] [PubMed]
- Adriaens, E.; Dierckens, K.; Bauters, T.G.; Nelis, H.J.; Van Goethem, F.; Vanparys, P.; Remon, J.P. The mucosal toxicity of different benzalkonium chloride analogues evaluated with an alternative test using slugs. Pharm. Res. 2001, 18, 937–942. [Google Scholar] [CrossRef] [PubMed]
- Kaldybekov, D.B.; Filippov, S.K.; Radulescu, A.; Khutoryanskiy, V.V. Maleimide-functionalised PLGA-PEG nanoparticles as mucoadhesive carriers for intravesical drug delivery. Eur. J. Pharm. Biopharm. 2019, 143, 24–34. [Google Scholar] [CrossRef]
- Singh-Joy, S.D.; McLain, V.C. Safety assessment of poloxamers 101, 105, 108, 122, 123, 124, 181, 182, 183, 184, 185, 188, 212, 215, 217, 231, 234, 235, 237, 238, 282, 284, 288, 331, 333, 334, 335, 338, 401, 402, 403, and 407, poloxamer 105 benzoate, and poloxamer 182 dibenzoate as used in cosmetics. Int. J. Toxicol. 2008, 27, 93–128. [Google Scholar] [PubMed]
- Schrage, A.; Kolle, S.N.; Moreno, M.C.R.; Norman, K.; Raabe, H.; Curren, R.; van Ravenzwaay, B.; Landsiedel, R. The bovine corneal opacity and permeability test in routine ocular irritation testing and its improvement within the limits of OECD test guideline 437. Altern. Lab. Anim. 2011, 39, 37–53. [Google Scholar] [CrossRef] [PubMed]
- Morrison, P.W.; Porfiryeva, N.N.; Chahal, S.; Salakhov, I.A.; Lacourt, C.; Semina, I.I.; Moustafine, R.I.; Khutoryanskiy, V.V. Crown ethers: Novel permeability enhancers for ocular drug delivery? Mol. Pharm. 2017, 14, 3528–3538. [Google Scholar] [CrossRef] [Green Version]


| Polyaphrons | Oil Phase (Discontinuous), % | Aqueous Phase (Continuous), % | |||||
|---|---|---|---|---|---|---|---|
| CCT | Brij® L4 | Water | P188 | POZ | PQ10 | CMC | |
| P1 (10% P188) | 89.1 | 0.9 | 9 | 1 | - | - | - |
| P2 (10% POZ) | 89.1 | 0.9 | 9 | - | 1 | - | - |
| P3 (1% PQ10) | 89.1 | 0.9 | 9.9 | - | - | 0.1 | - |
| P4 (3% CMC) | 89.1 | 0.9 | 9.7 | - | - | - | 0.3 |
| P5 (3% PQ10) | 89.1 | 0.9 | 9.7 | - | - | 0.3 | - |
| Polyaphrons | pH (n = 3) | Zeta Potential, mV (1:250 Diluted, n = 3) | Size, μm (Mastersizer, n = 5) | Size, μm (Cryo-SEM, n = 20) |
|---|---|---|---|---|
| P1 (10% P188) | 5.91 ± 0.26 | −17.8 ± 0.5 | 7.02 ± 0.03 | 8.15 ± 1.54 |
| P2 (10% POZ) | 6.37 ± 0.15 | −11.3 ± 0.5 | 6.38 ± 0.19 | 6.74 ± 2.10 |
| P3 (1% PQ10) | 6.02 ± 0.21 | 29.8 ± 1.3 | 7.80 ± 0.01 | 8.21 ± 2.50 |
| P4 (3% CMC) | 6.73 ± 0.09 | −25.6 ± 0.4 | 5.62 ± 0.01 | 5.49 ± 0.36 |
Publisher’s Note: MDPI stays neutral with regard to jurisdictional claims in published maps and institutional affiliations. |
© 2022 by the authors. Licensee MDPI, Basel, Switzerland. This article is an open access article distributed under the terms and conditions of the Creative Commons Attribution (CC BY) license (https://creativecommons.org/licenses/by/4.0/).
Share and Cite
Moiseev, R.V.; Steele, F.; Khutoryanskiy, V.V. Polyaphron Formulations Stabilised with Different Water-Soluble Polymers for Ocular Drug Delivery. Pharmaceutics 2022, 14, 926. https://doi.org/10.3390/pharmaceutics14050926
Moiseev RV, Steele F, Khutoryanskiy VV. Polyaphron Formulations Stabilised with Different Water-Soluble Polymers for Ocular Drug Delivery. Pharmaceutics. 2022; 14(5):926. https://doi.org/10.3390/pharmaceutics14050926
Chicago/Turabian StyleMoiseev, Roman V., Fraser Steele, and Vitaliy V. Khutoryanskiy. 2022. "Polyaphron Formulations Stabilised with Different Water-Soluble Polymers for Ocular Drug Delivery" Pharmaceutics 14, no. 5: 926. https://doi.org/10.3390/pharmaceutics14050926
APA StyleMoiseev, R. V., Steele, F., & Khutoryanskiy, V. V. (2022). Polyaphron Formulations Stabilised with Different Water-Soluble Polymers for Ocular Drug Delivery. Pharmaceutics, 14(5), 926. https://doi.org/10.3390/pharmaceutics14050926