
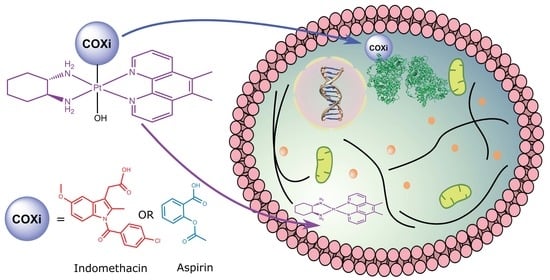
Cyclooxygenase-Inhibiting Platinum(IV) Prodrugs with Potent Anticancer Activity

 , , , ,
Abstract
:
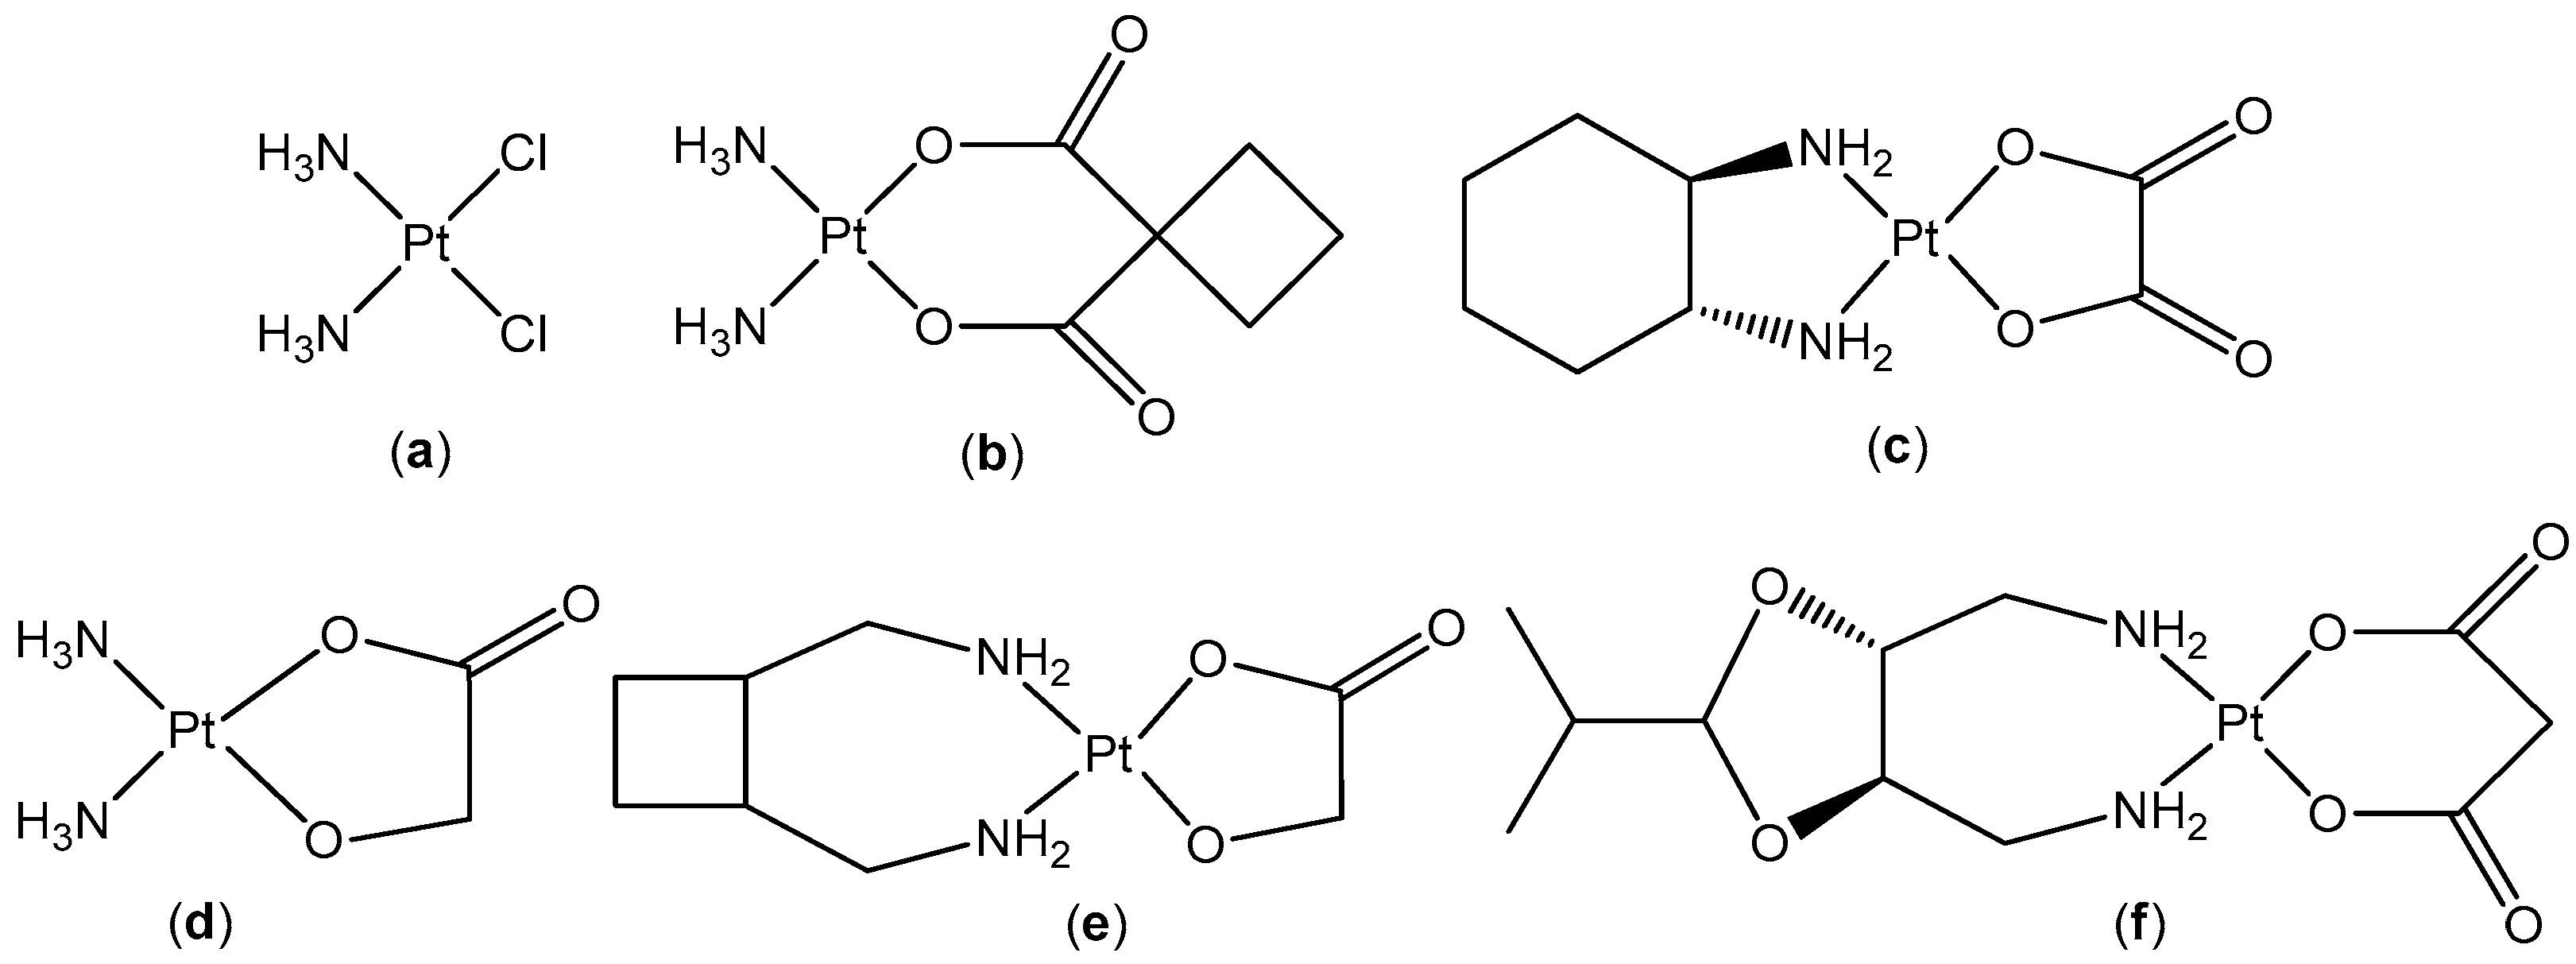
1. Introduction
2. Materials and Methods
2.1. Materials
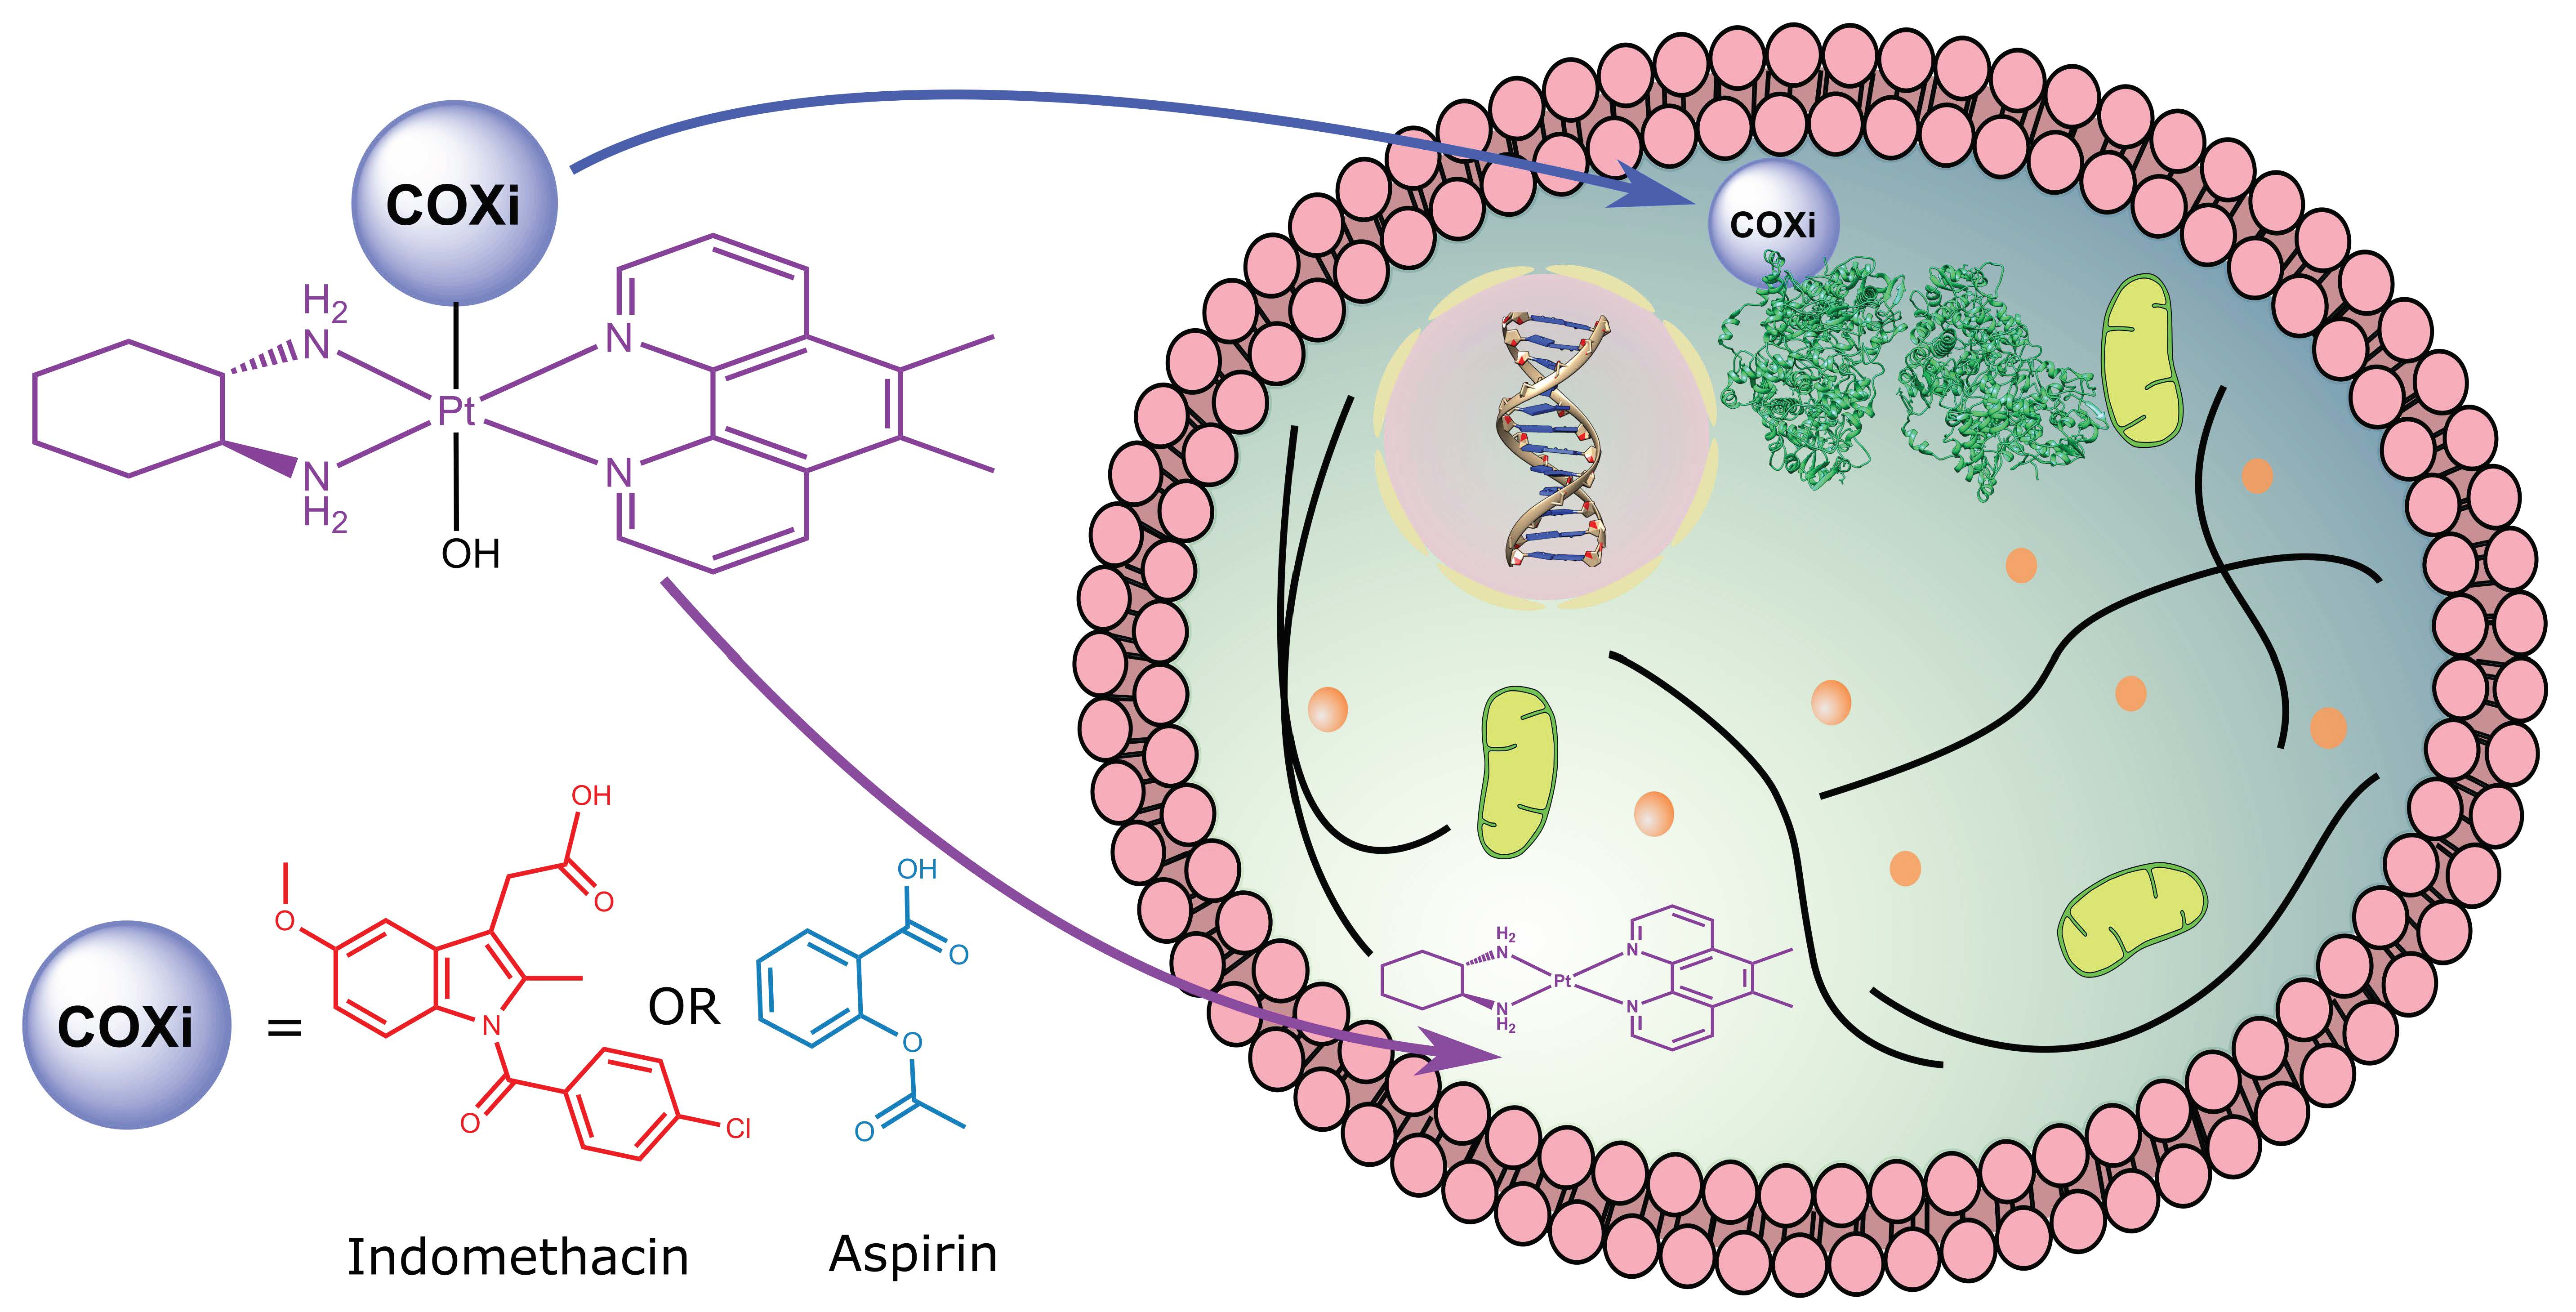
2.2. Synthesis of [Pt(PL)(SSDACH)]Cl2 (PHENSS(II) and 56MESS(II)) and [Pt(PL)(SSDACH)(OH)2](NO3)2 (PHENSS(IV) and 56MESS(IV)) (where PL = Phen or 56Me2Phen)
2.3. Synthesis of Indomethacin N-hydroxysuccinimide (Indomethacin-NHS)
2.4. Synthesis of 2-acetoxybenzoic Anhydride (Aspirin Anhydride)
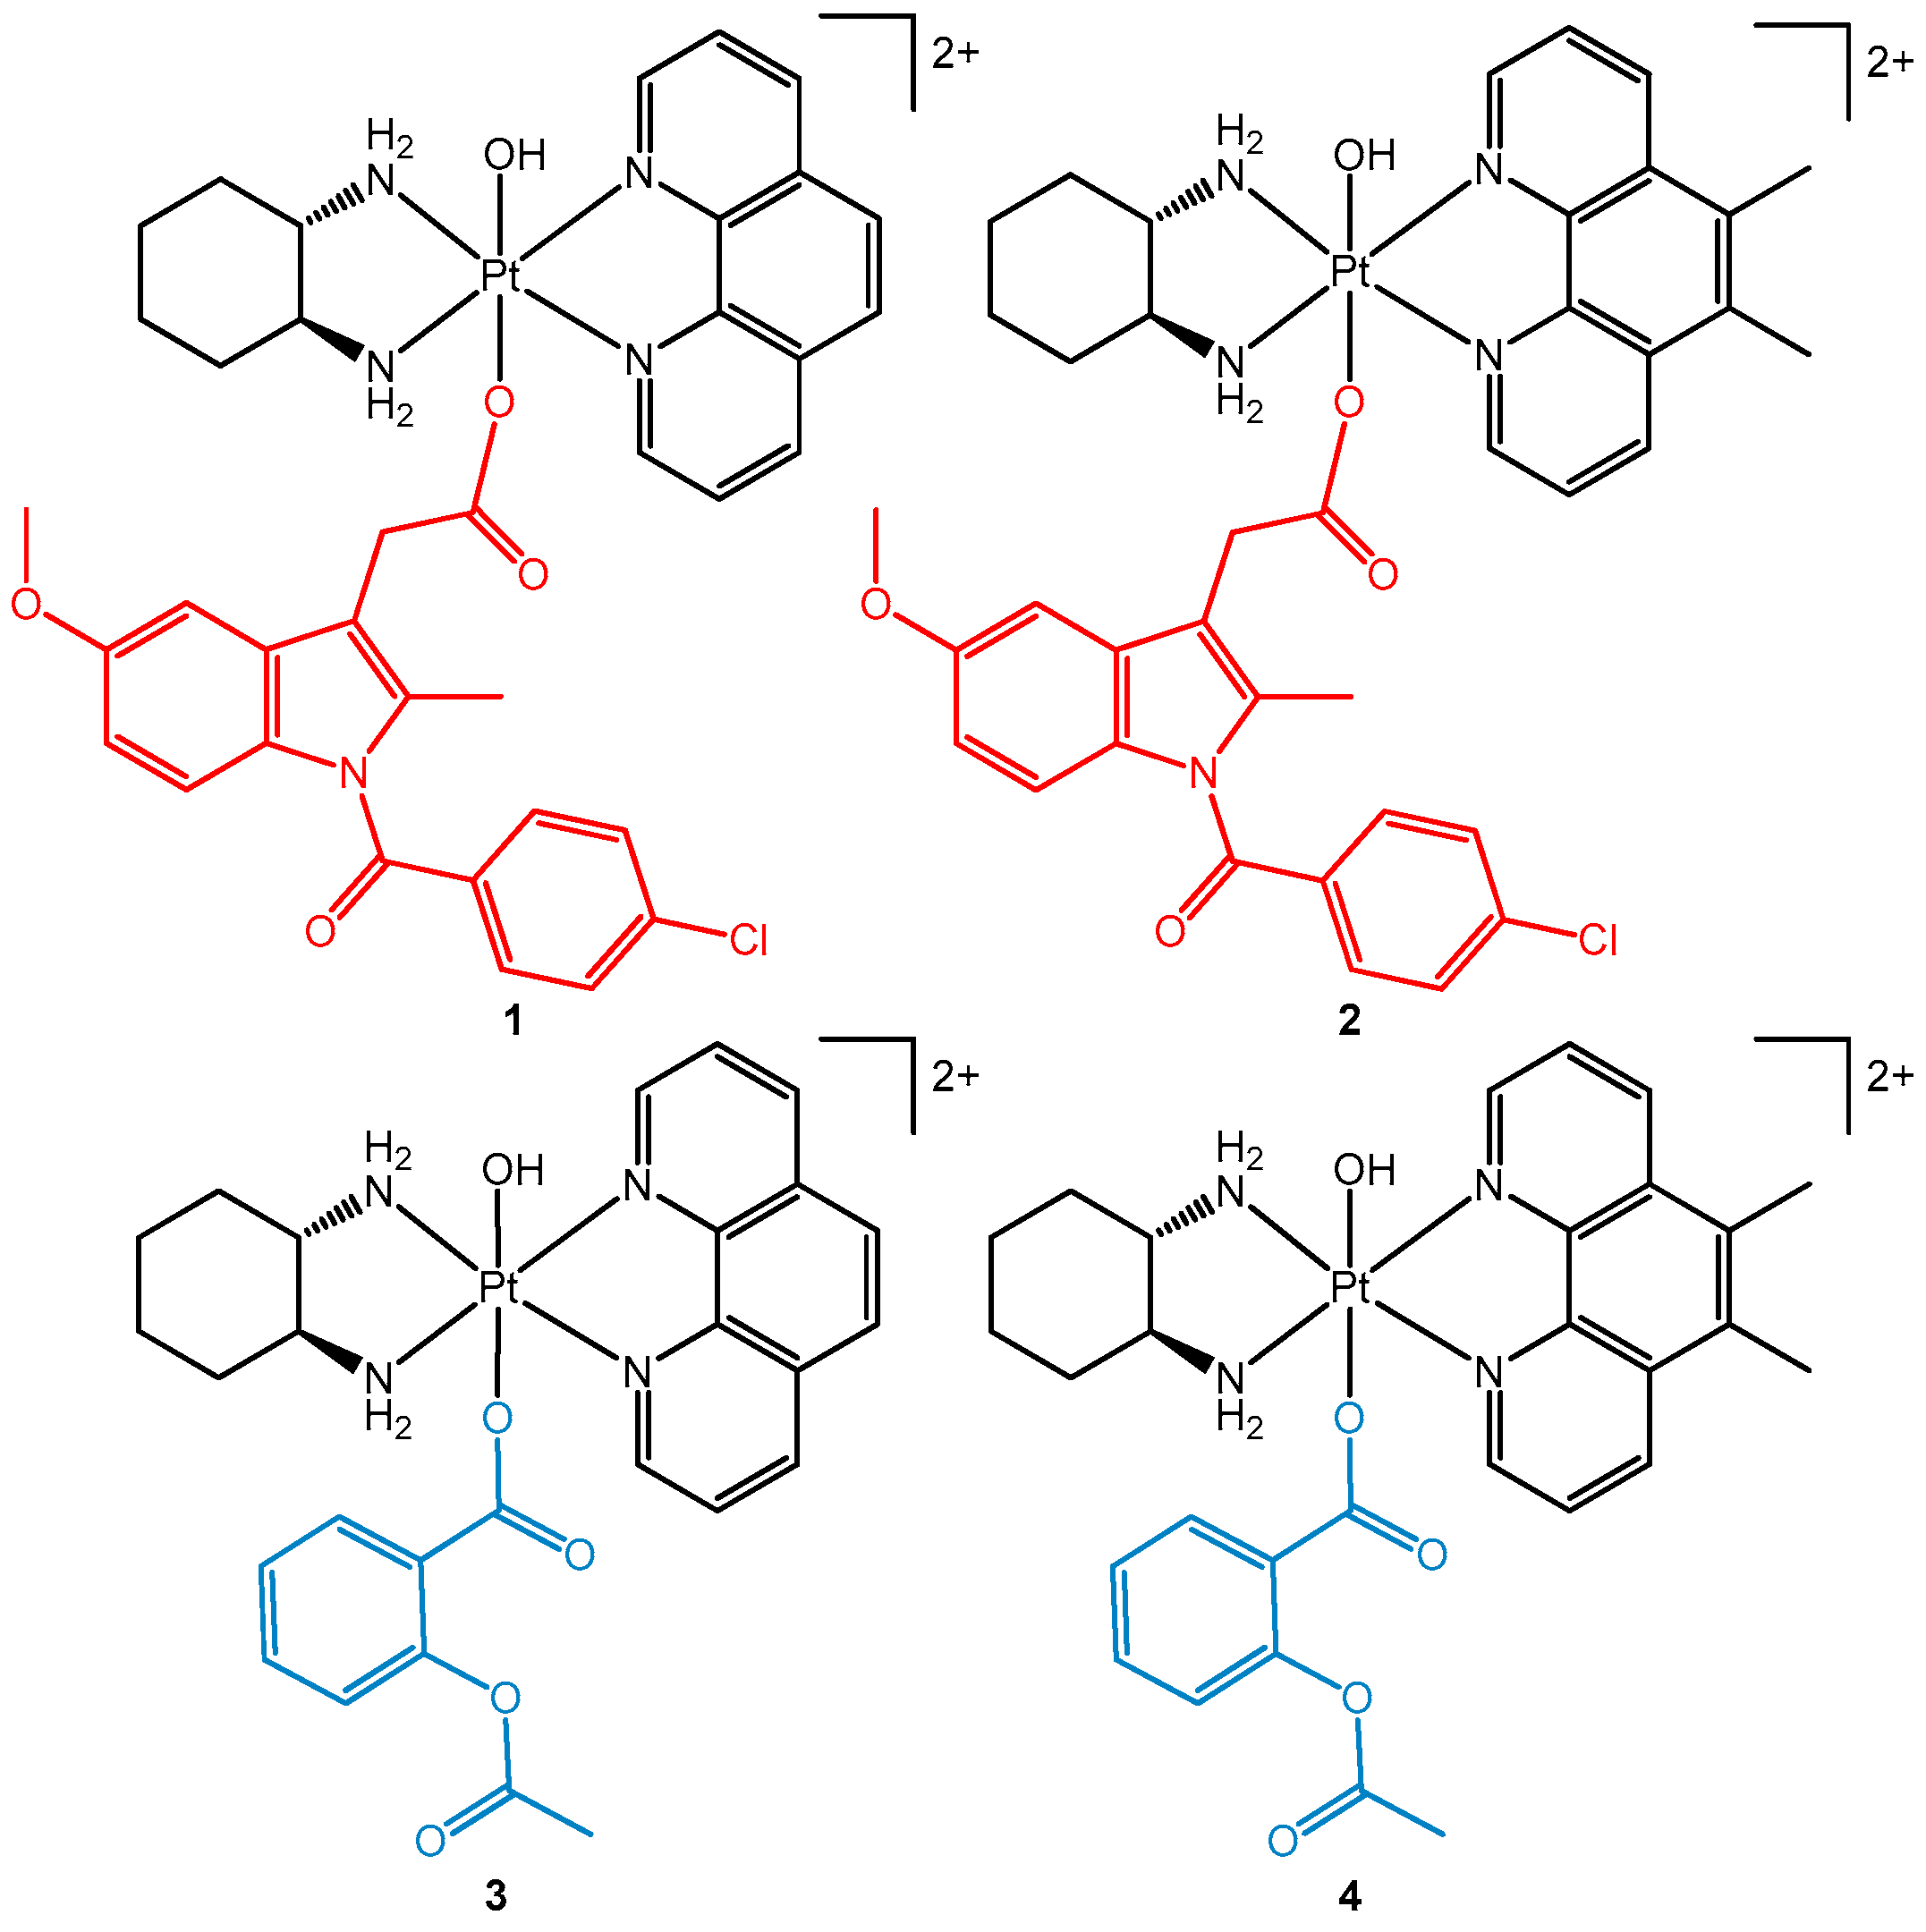
2.5. Synthesis of [Pt(PL)(SSDACH)(Indomethacin)(OH)](NO3)2 (where PL= Phen (1) or 56Me2Phen (2))
2.5.1. [Pt(Phen)(SSDACH)(Indomethacin)(OH)](NO3)2 (1)
2.5.2. [Pt(56Me2Phen)(SSDACH)(Indomethacin)(OH)](NO3)2 (2)
2.6. Synthesis of [Pt(PL)(SSDACH)(Aspirin)(OH)](NO3)2 (PL= Phen (3) or 56Me2Phen (4))
2.6.1. [Pt(Phen)(SSDACH)(Aspirin)(OH)](NO3)2 (3)
2.6.2. [Pt(56Me2Phen)(SSDACH)(Aspirin)(OH)](NO3)2 (4)
2.7. NMR Spectroscopy
2.8. Flash Chromatography
2.9. Ultraviolet (UV) Absorption Spectroscopy
2.10. Circular Dichroism (CD) Spectroscopy
2.11. Synchrotron Radiation Circular Dichroism (SRCD) Spectroscopy
2.12. Mass Spectrometry (MS)
2.13. High Performance Liquid Chromatography (HPLC) Conditions and Lipophilicity Measurements
2.14. In Vitro Cytotoxicity Assay
2.15. COX Inhibition Assay
- Background samples: COX-2 was inactivated by transferring 20 µL of the enzyme to an Eppendorf tube which was placed in boiling water for 3 min. Solutions containing the reaction buffer (160 µL), heme (10 µL), inactivated COX-2 enzyme (10 µL) and the inhibitor vehicle (DMSO, 10 µL) were prepared in duplicate.
- COX-2 100% initial activity samples: Solutions containing the reaction buffer (160 µL), heme (10 µL), COX-2 enzyme (10 µL) and the inhibitor vehicle (DMSO, 10 µL) were prepared in duplicate.
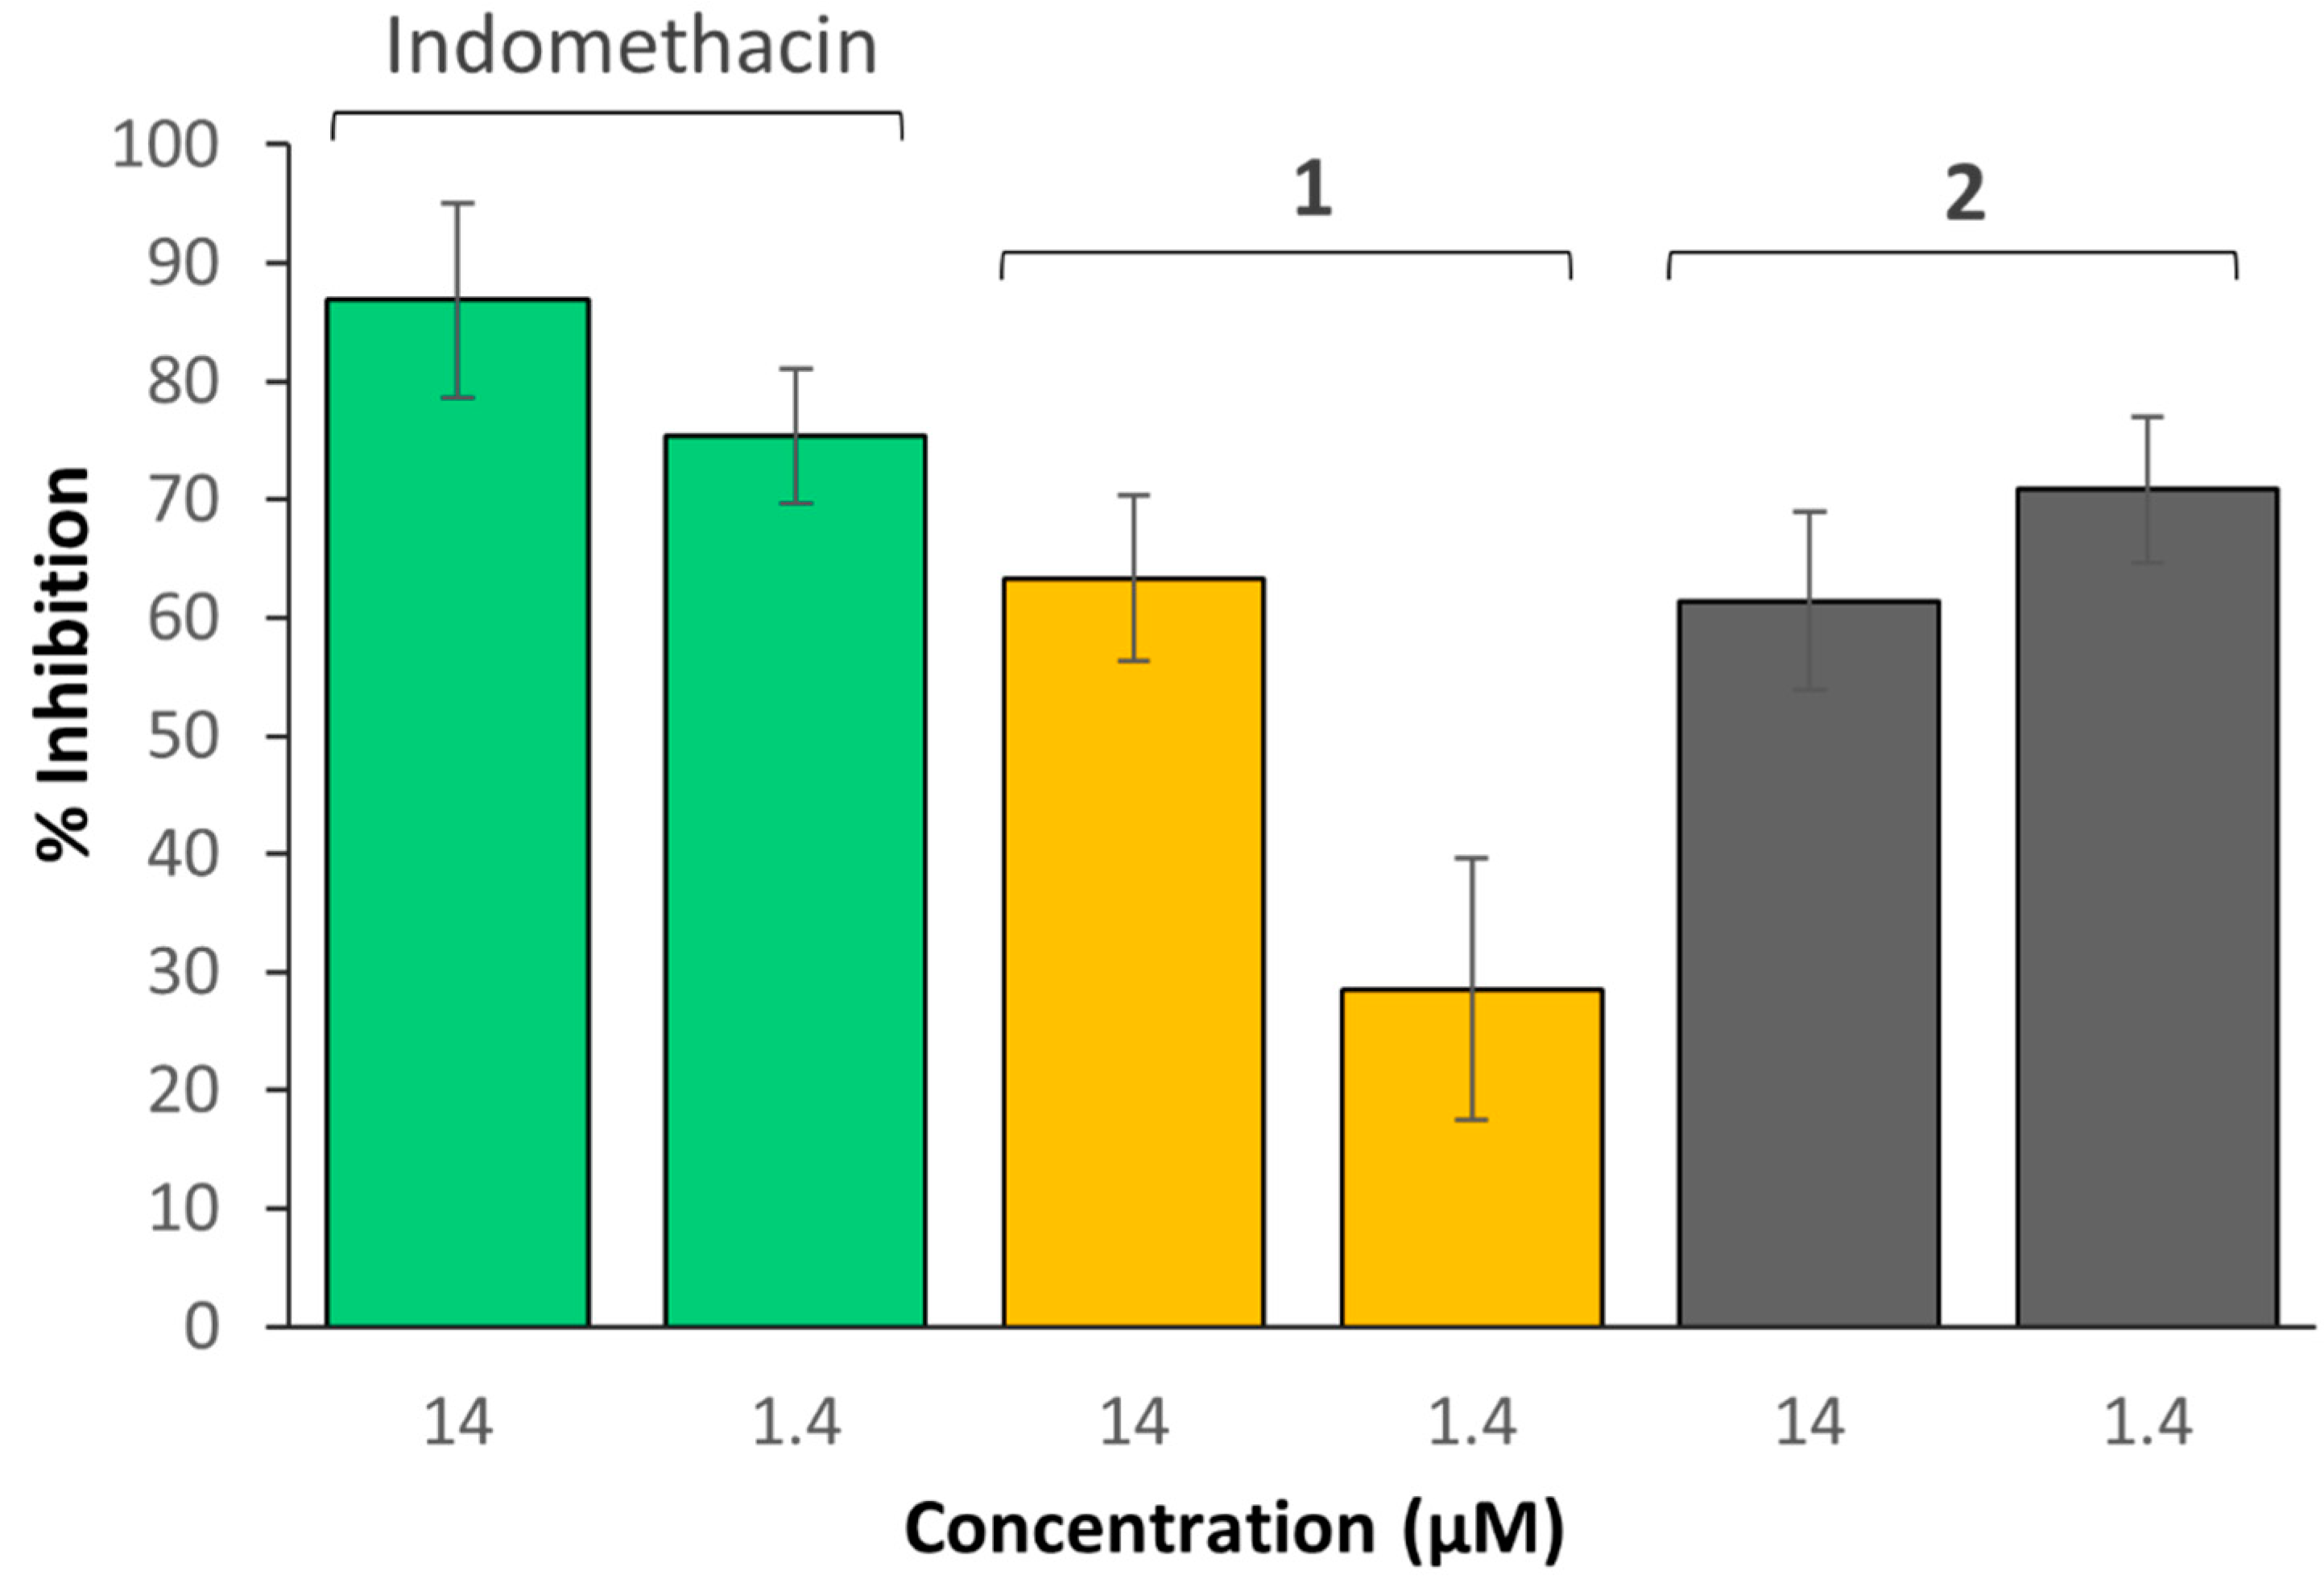
- COX-2 inhibitor samples: Solutions containing the reaction buffer (160 µL), heme (10 µL), COX-2 enzyme (10 µL) and the sample being investigated (10 µL; indomethacin, complex 1 or 2 at 14 and 1.4 µM, each; aspirin, complex 3 or 4 at 700, 70 and 7 µM each) were added together.
2.16. Cellular Accumulation
2.17. Platinum Analysis
3. Results and Discussion
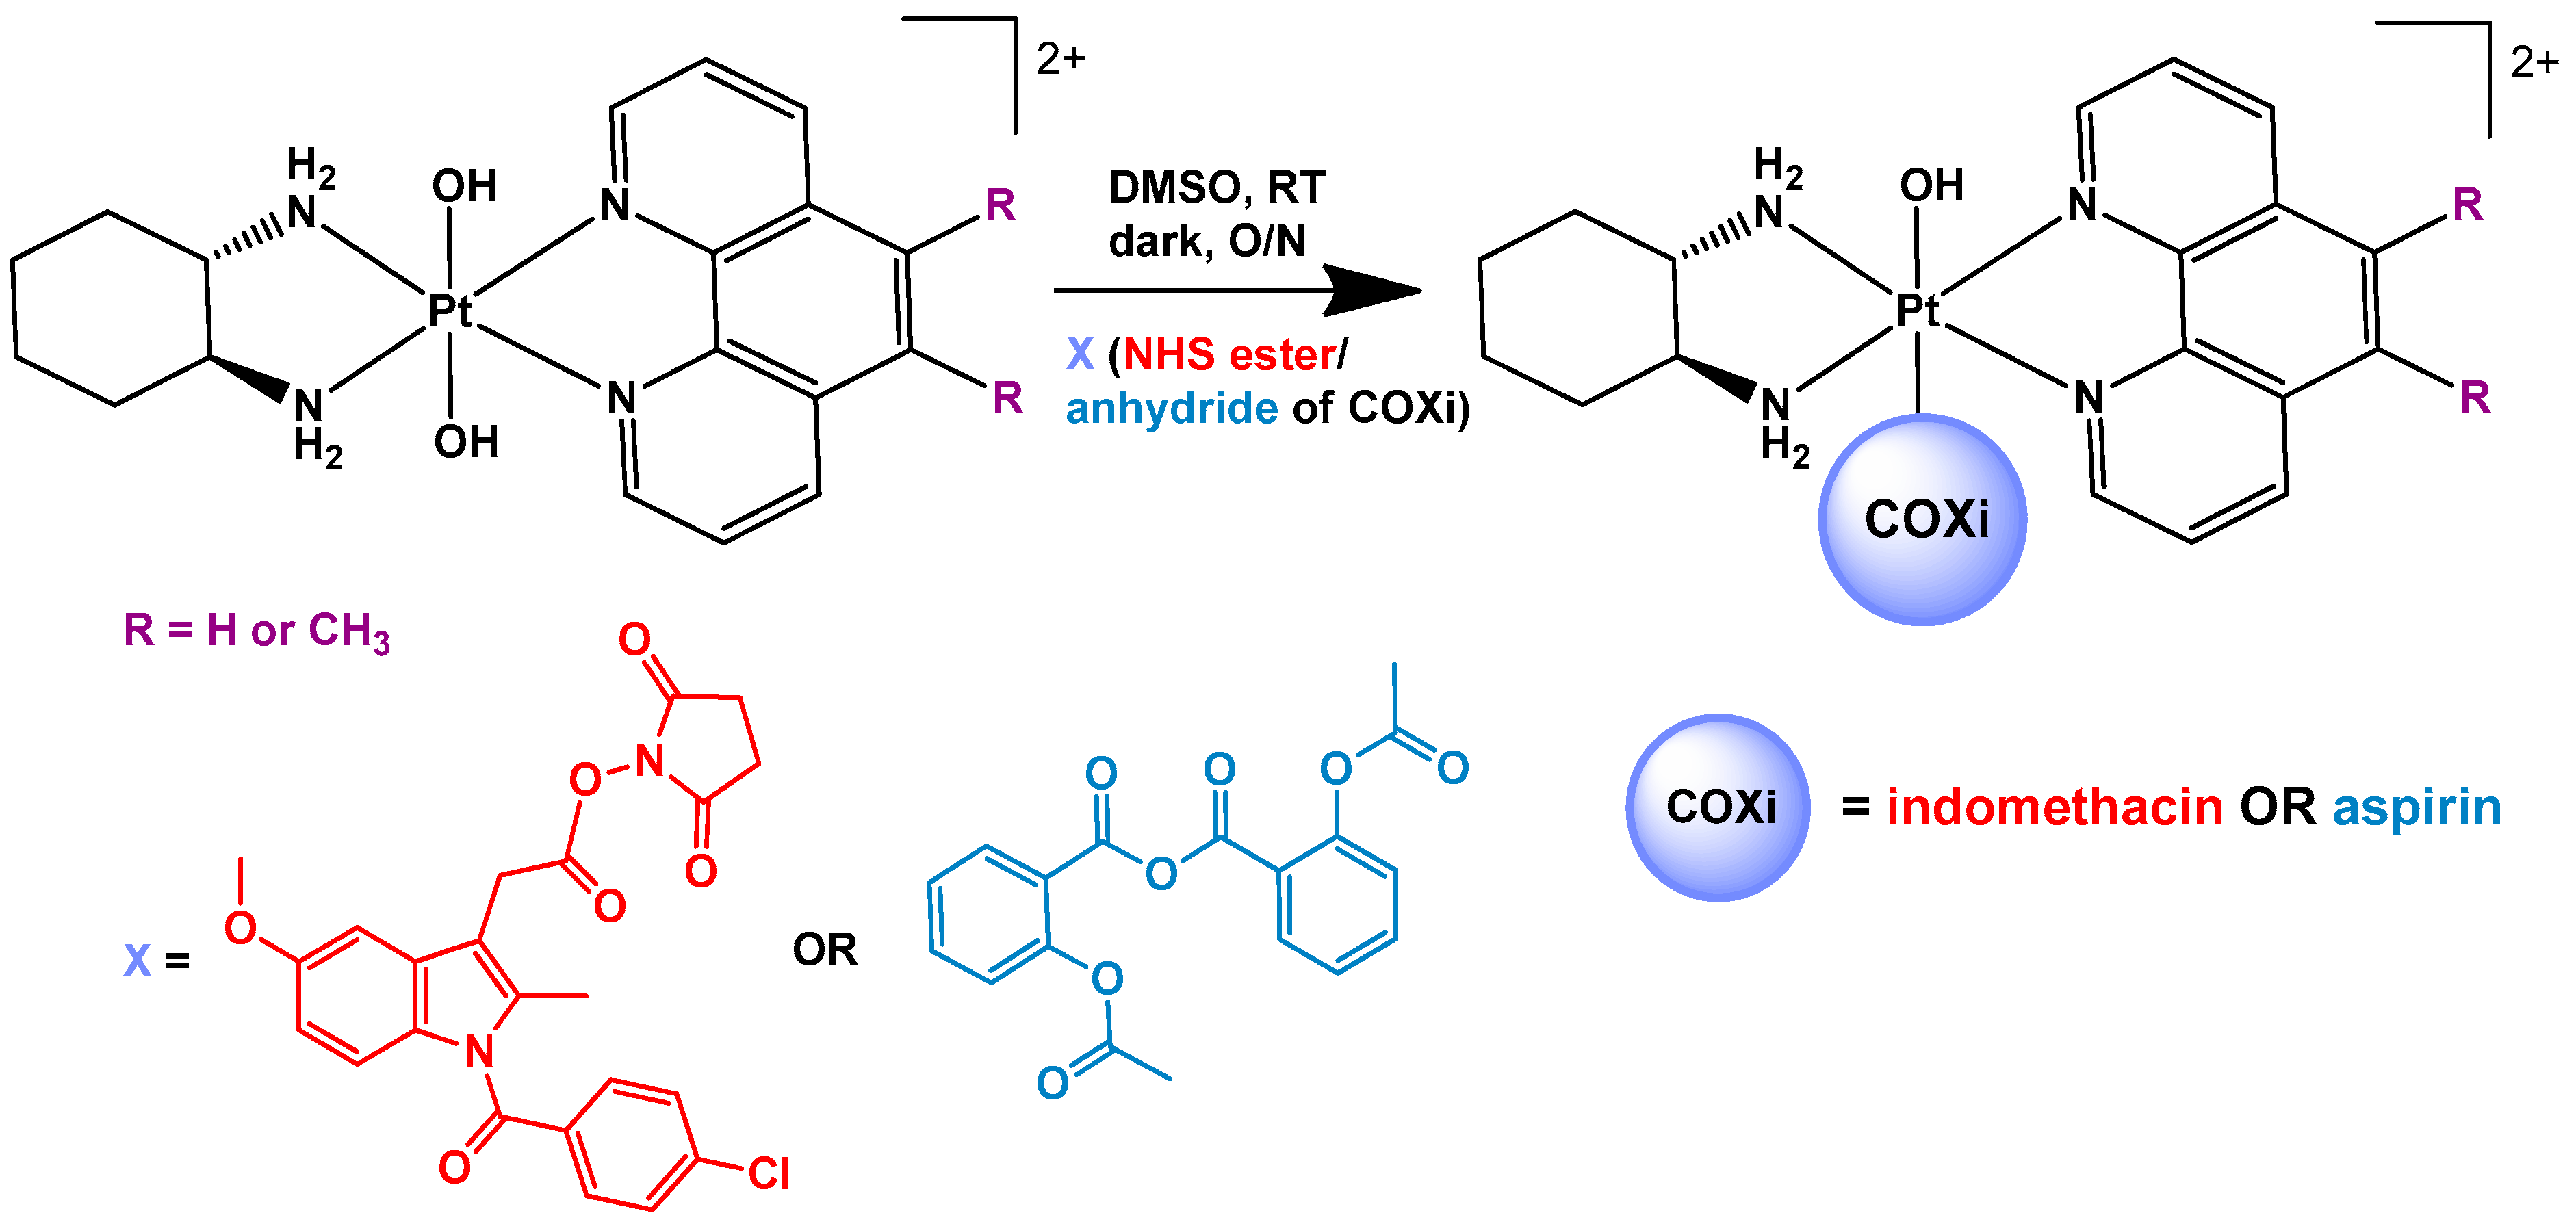
3.1. Synthesis and Characterisation
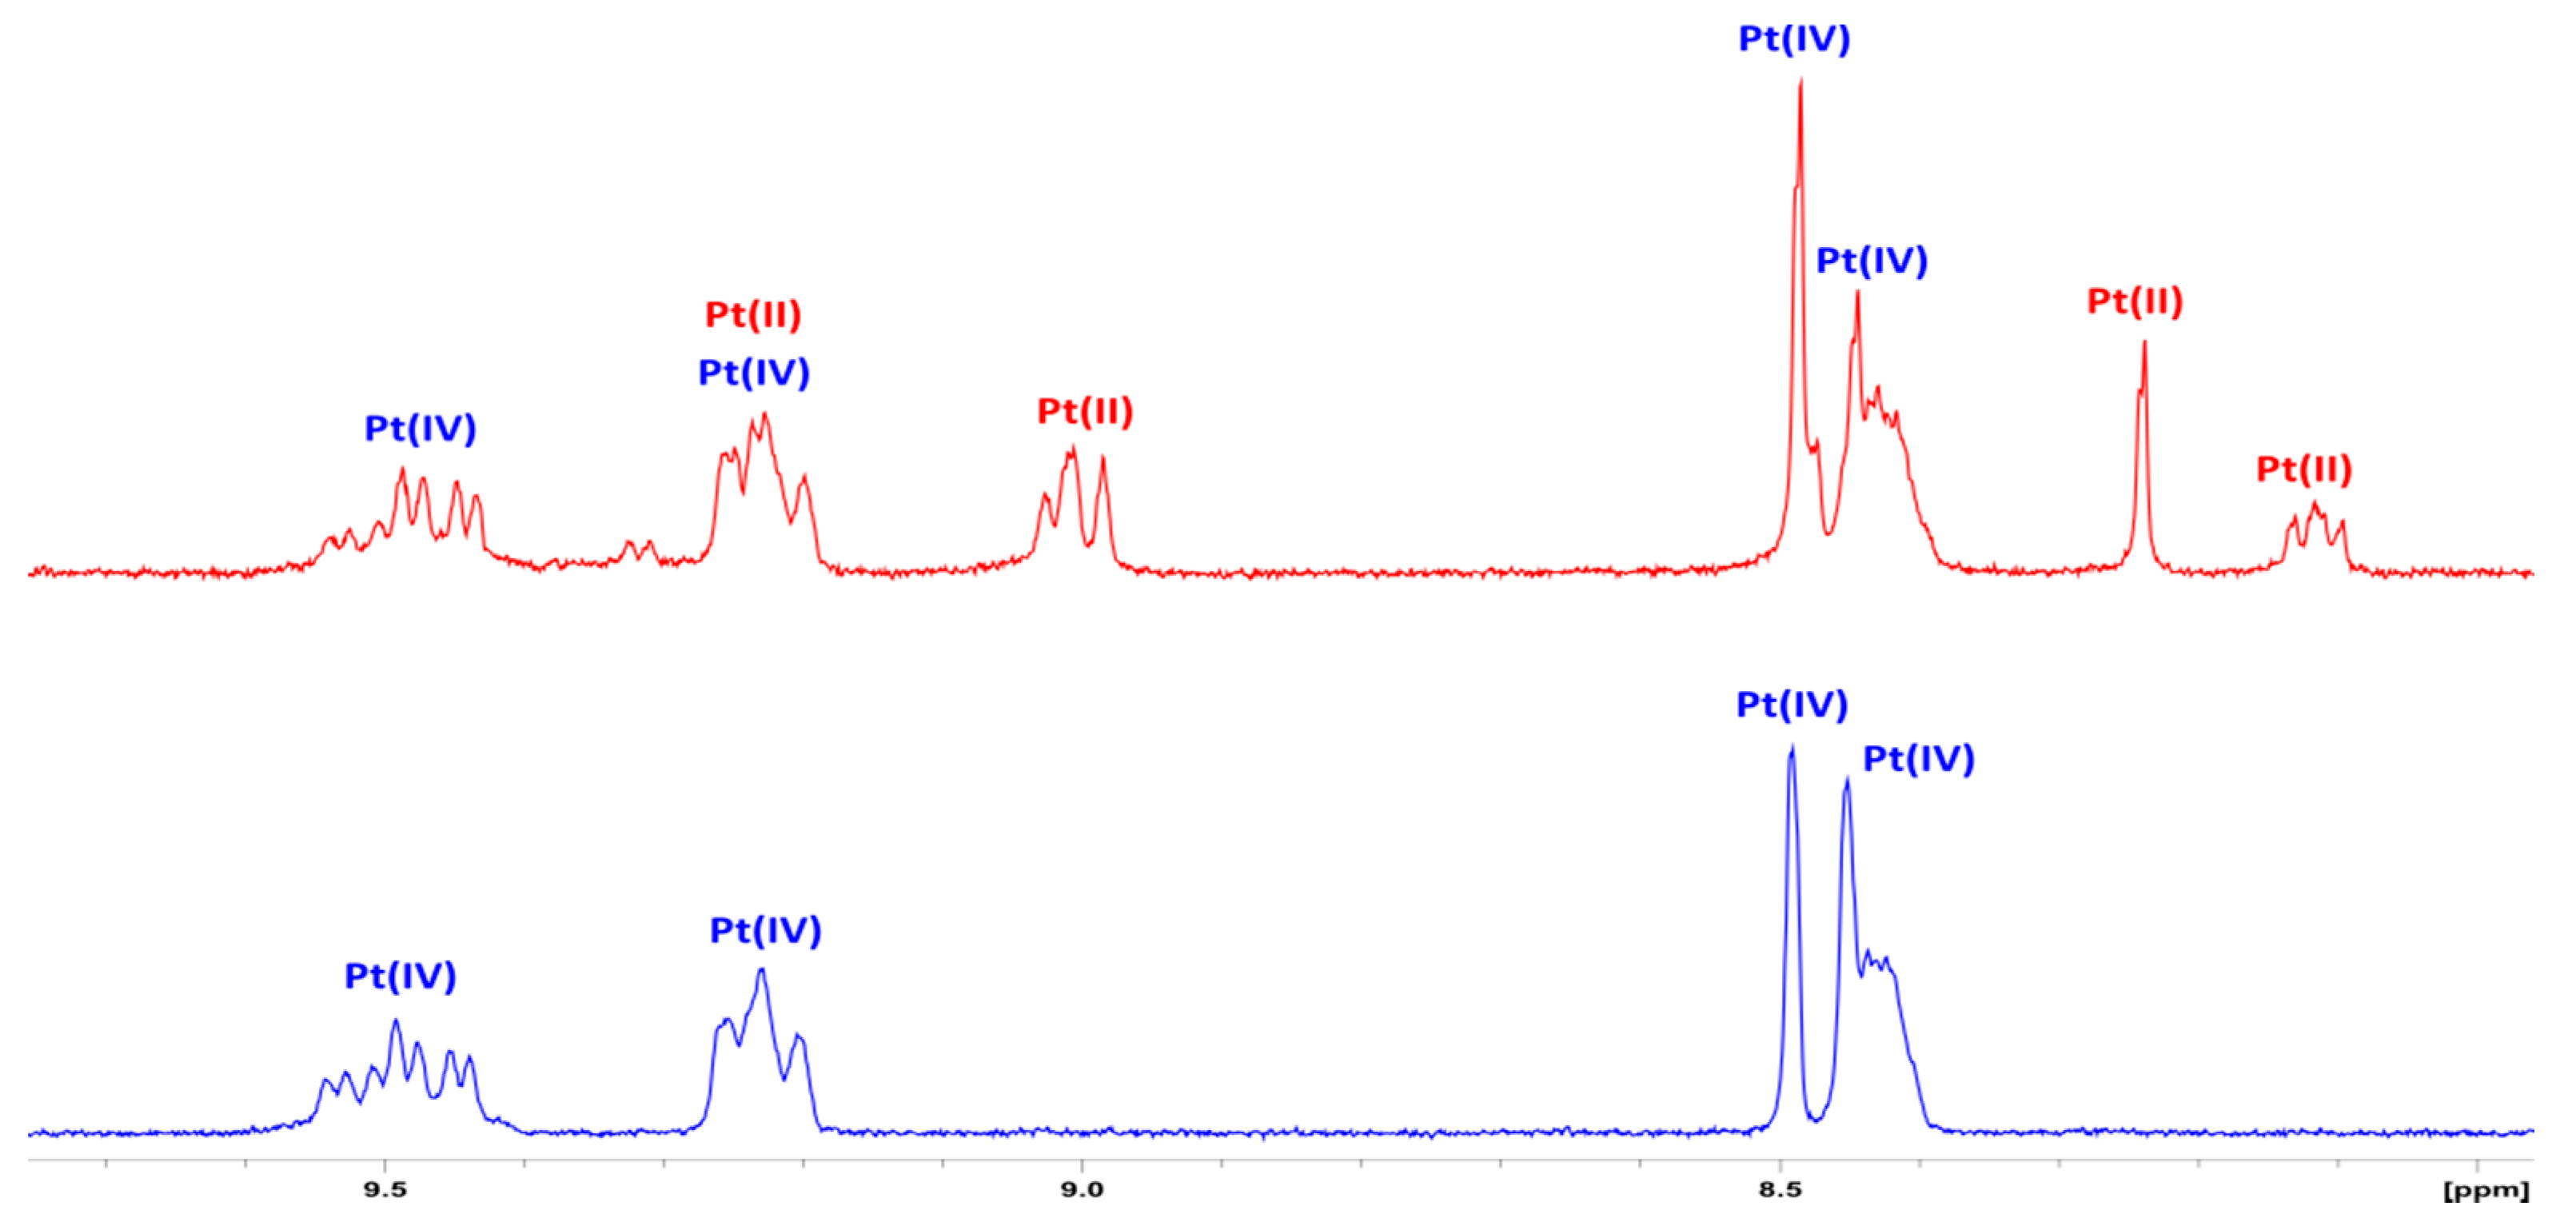
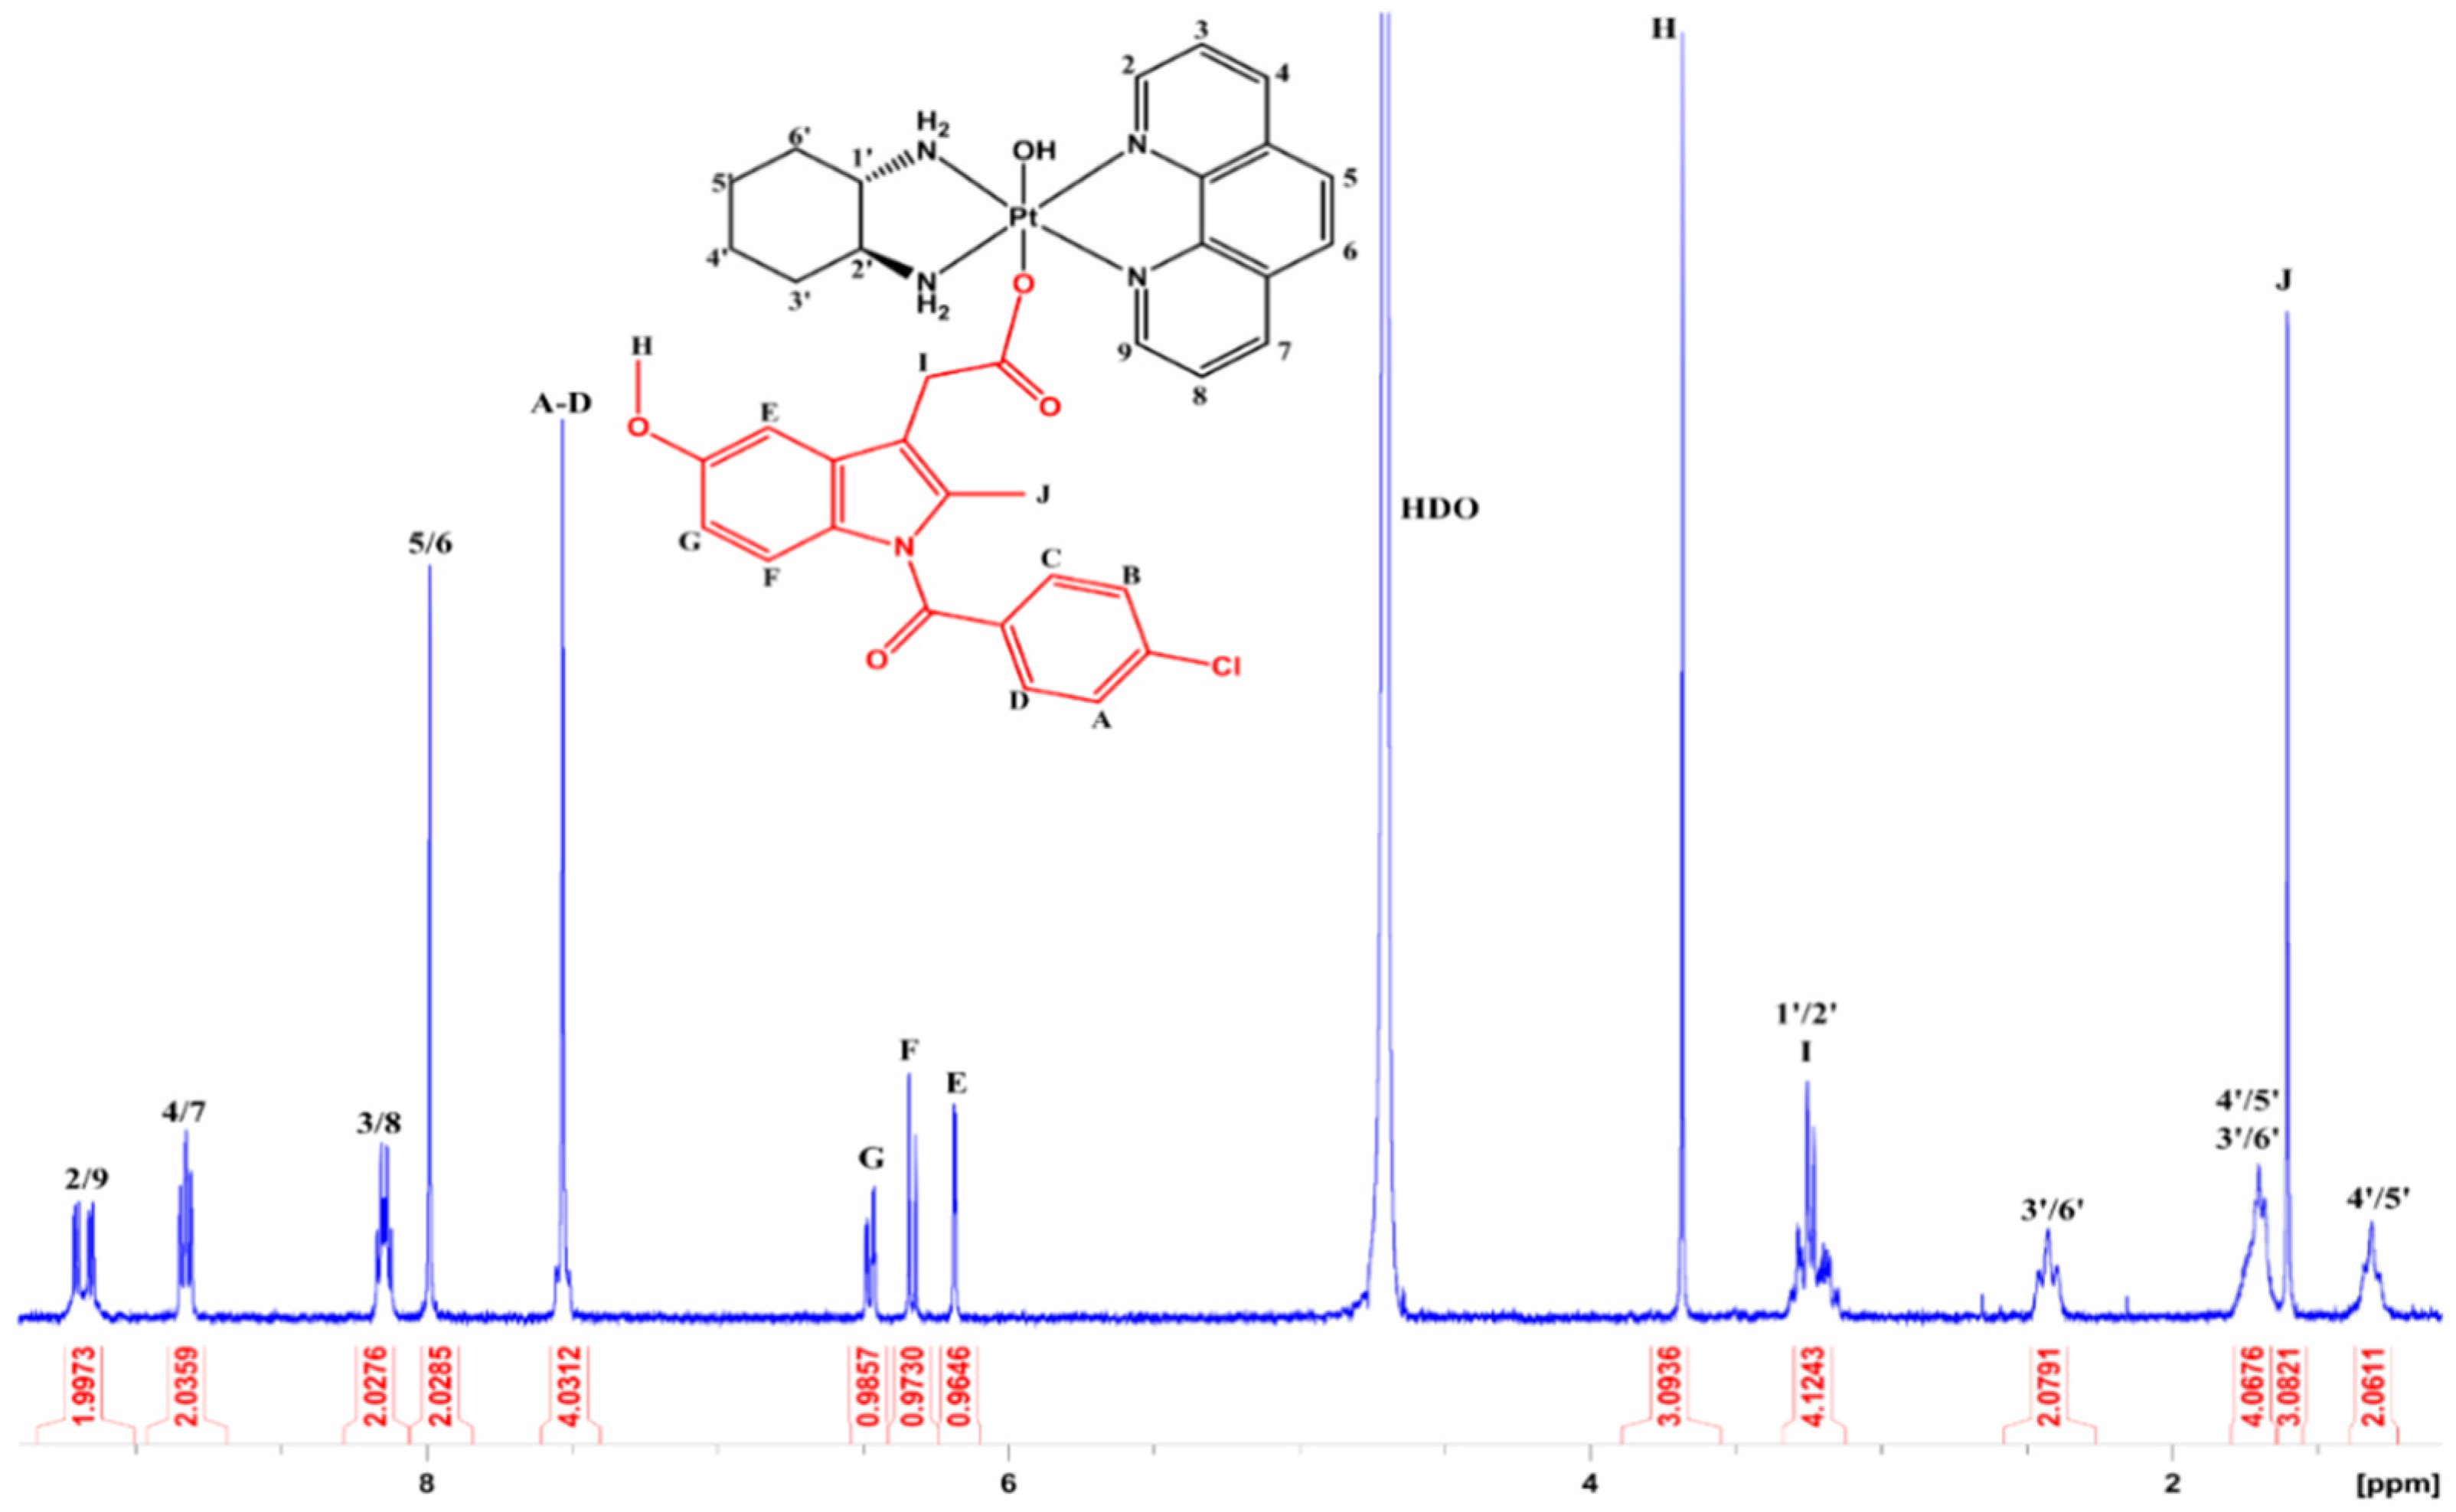
3.2. NMR Spectroscopy
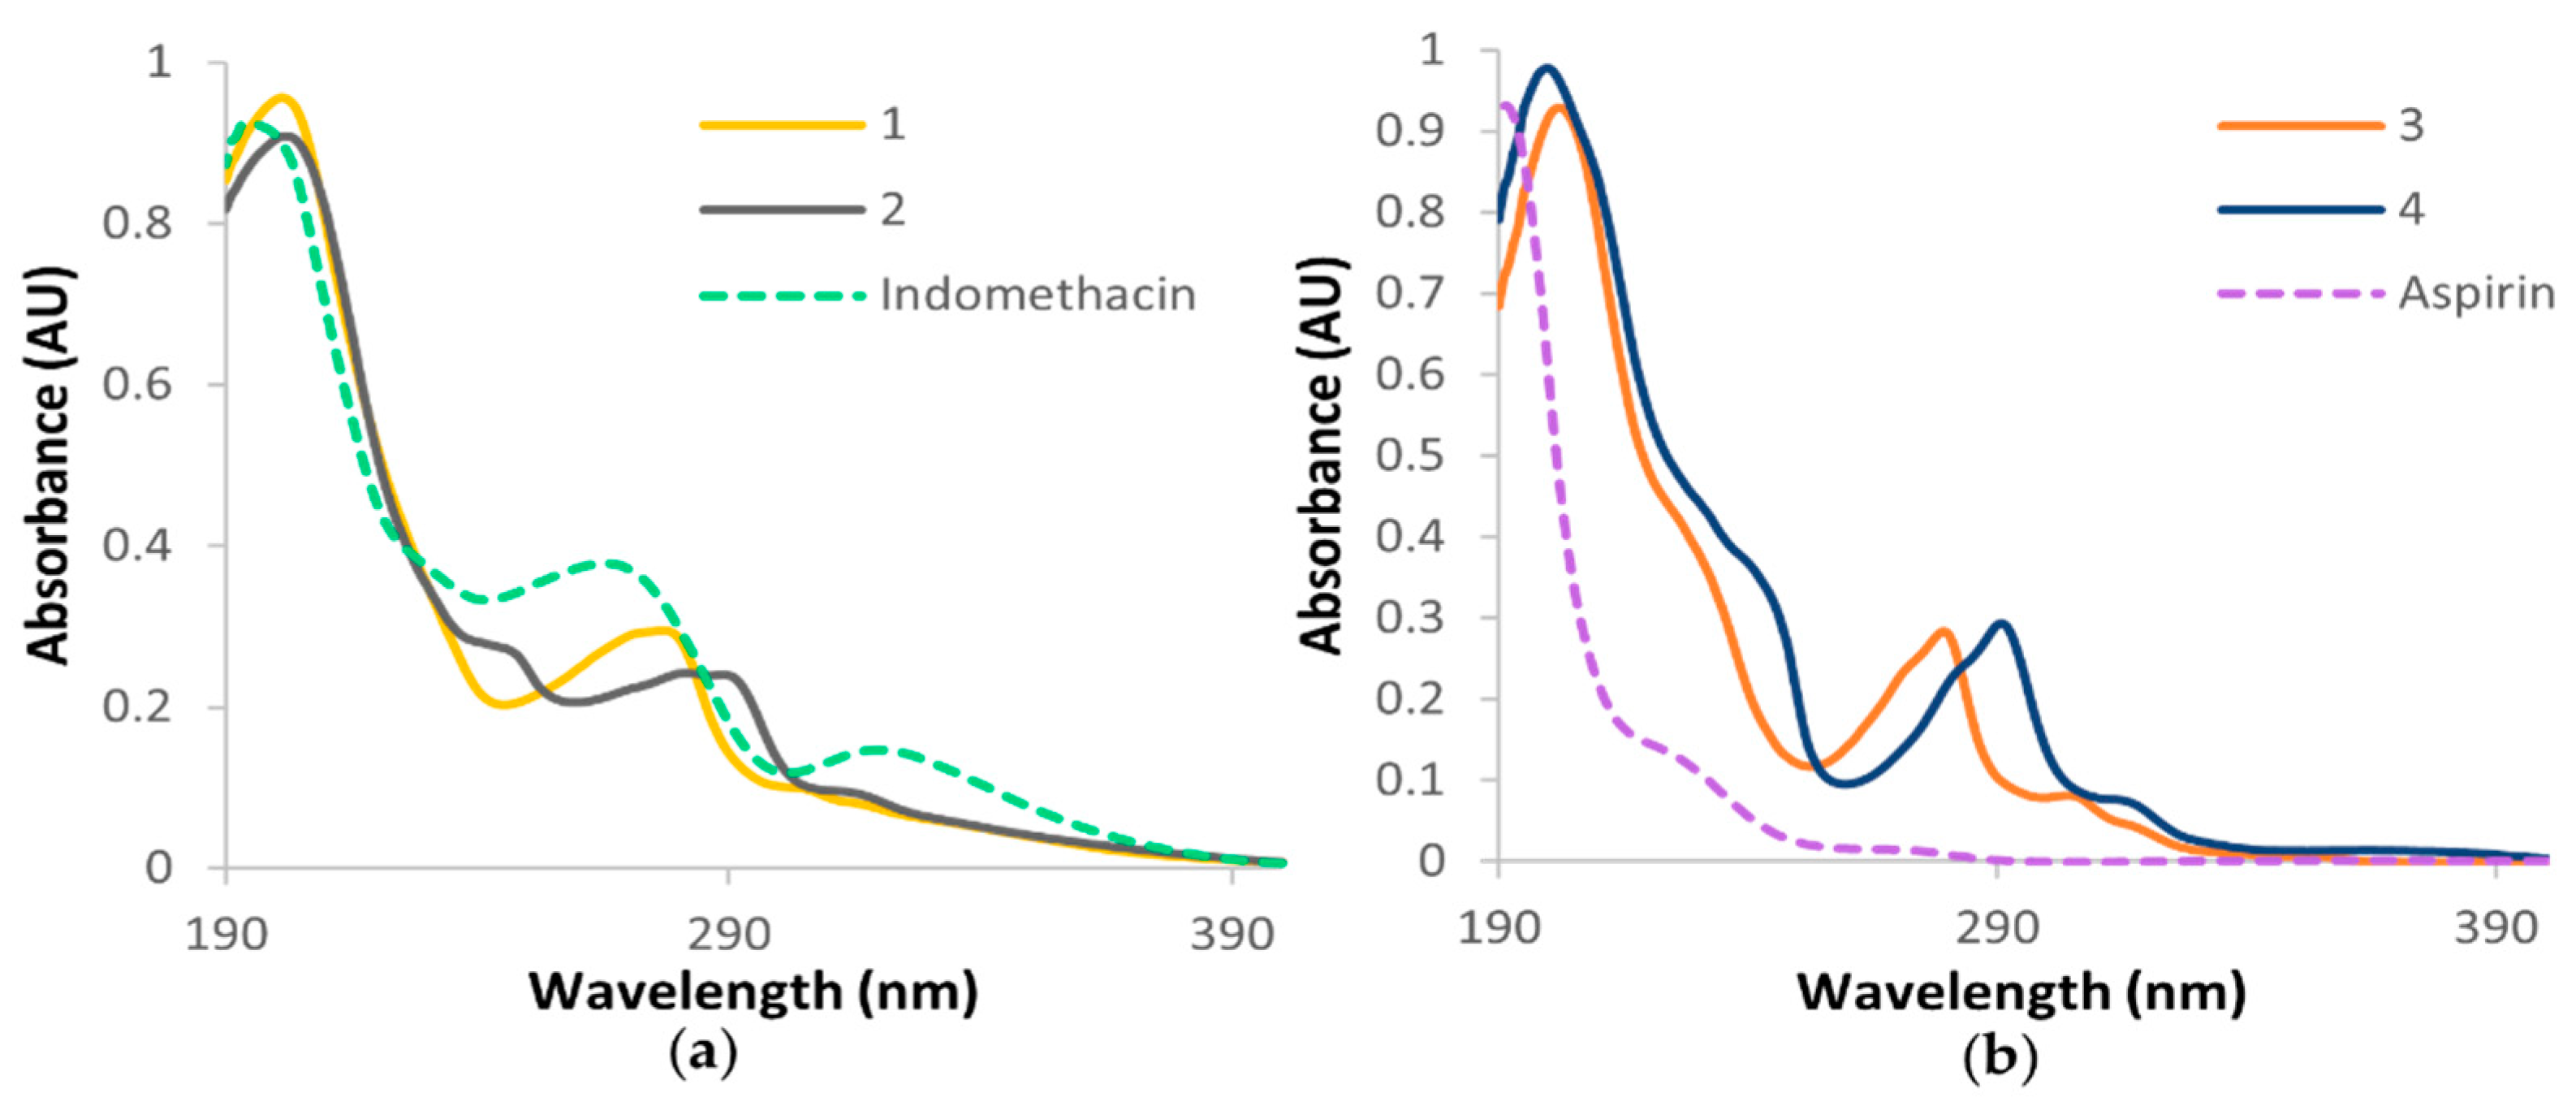
3.3. Electronic Spectra
3.4. Preliminary Reduction Studies
3.5. Lipophilicity Studies
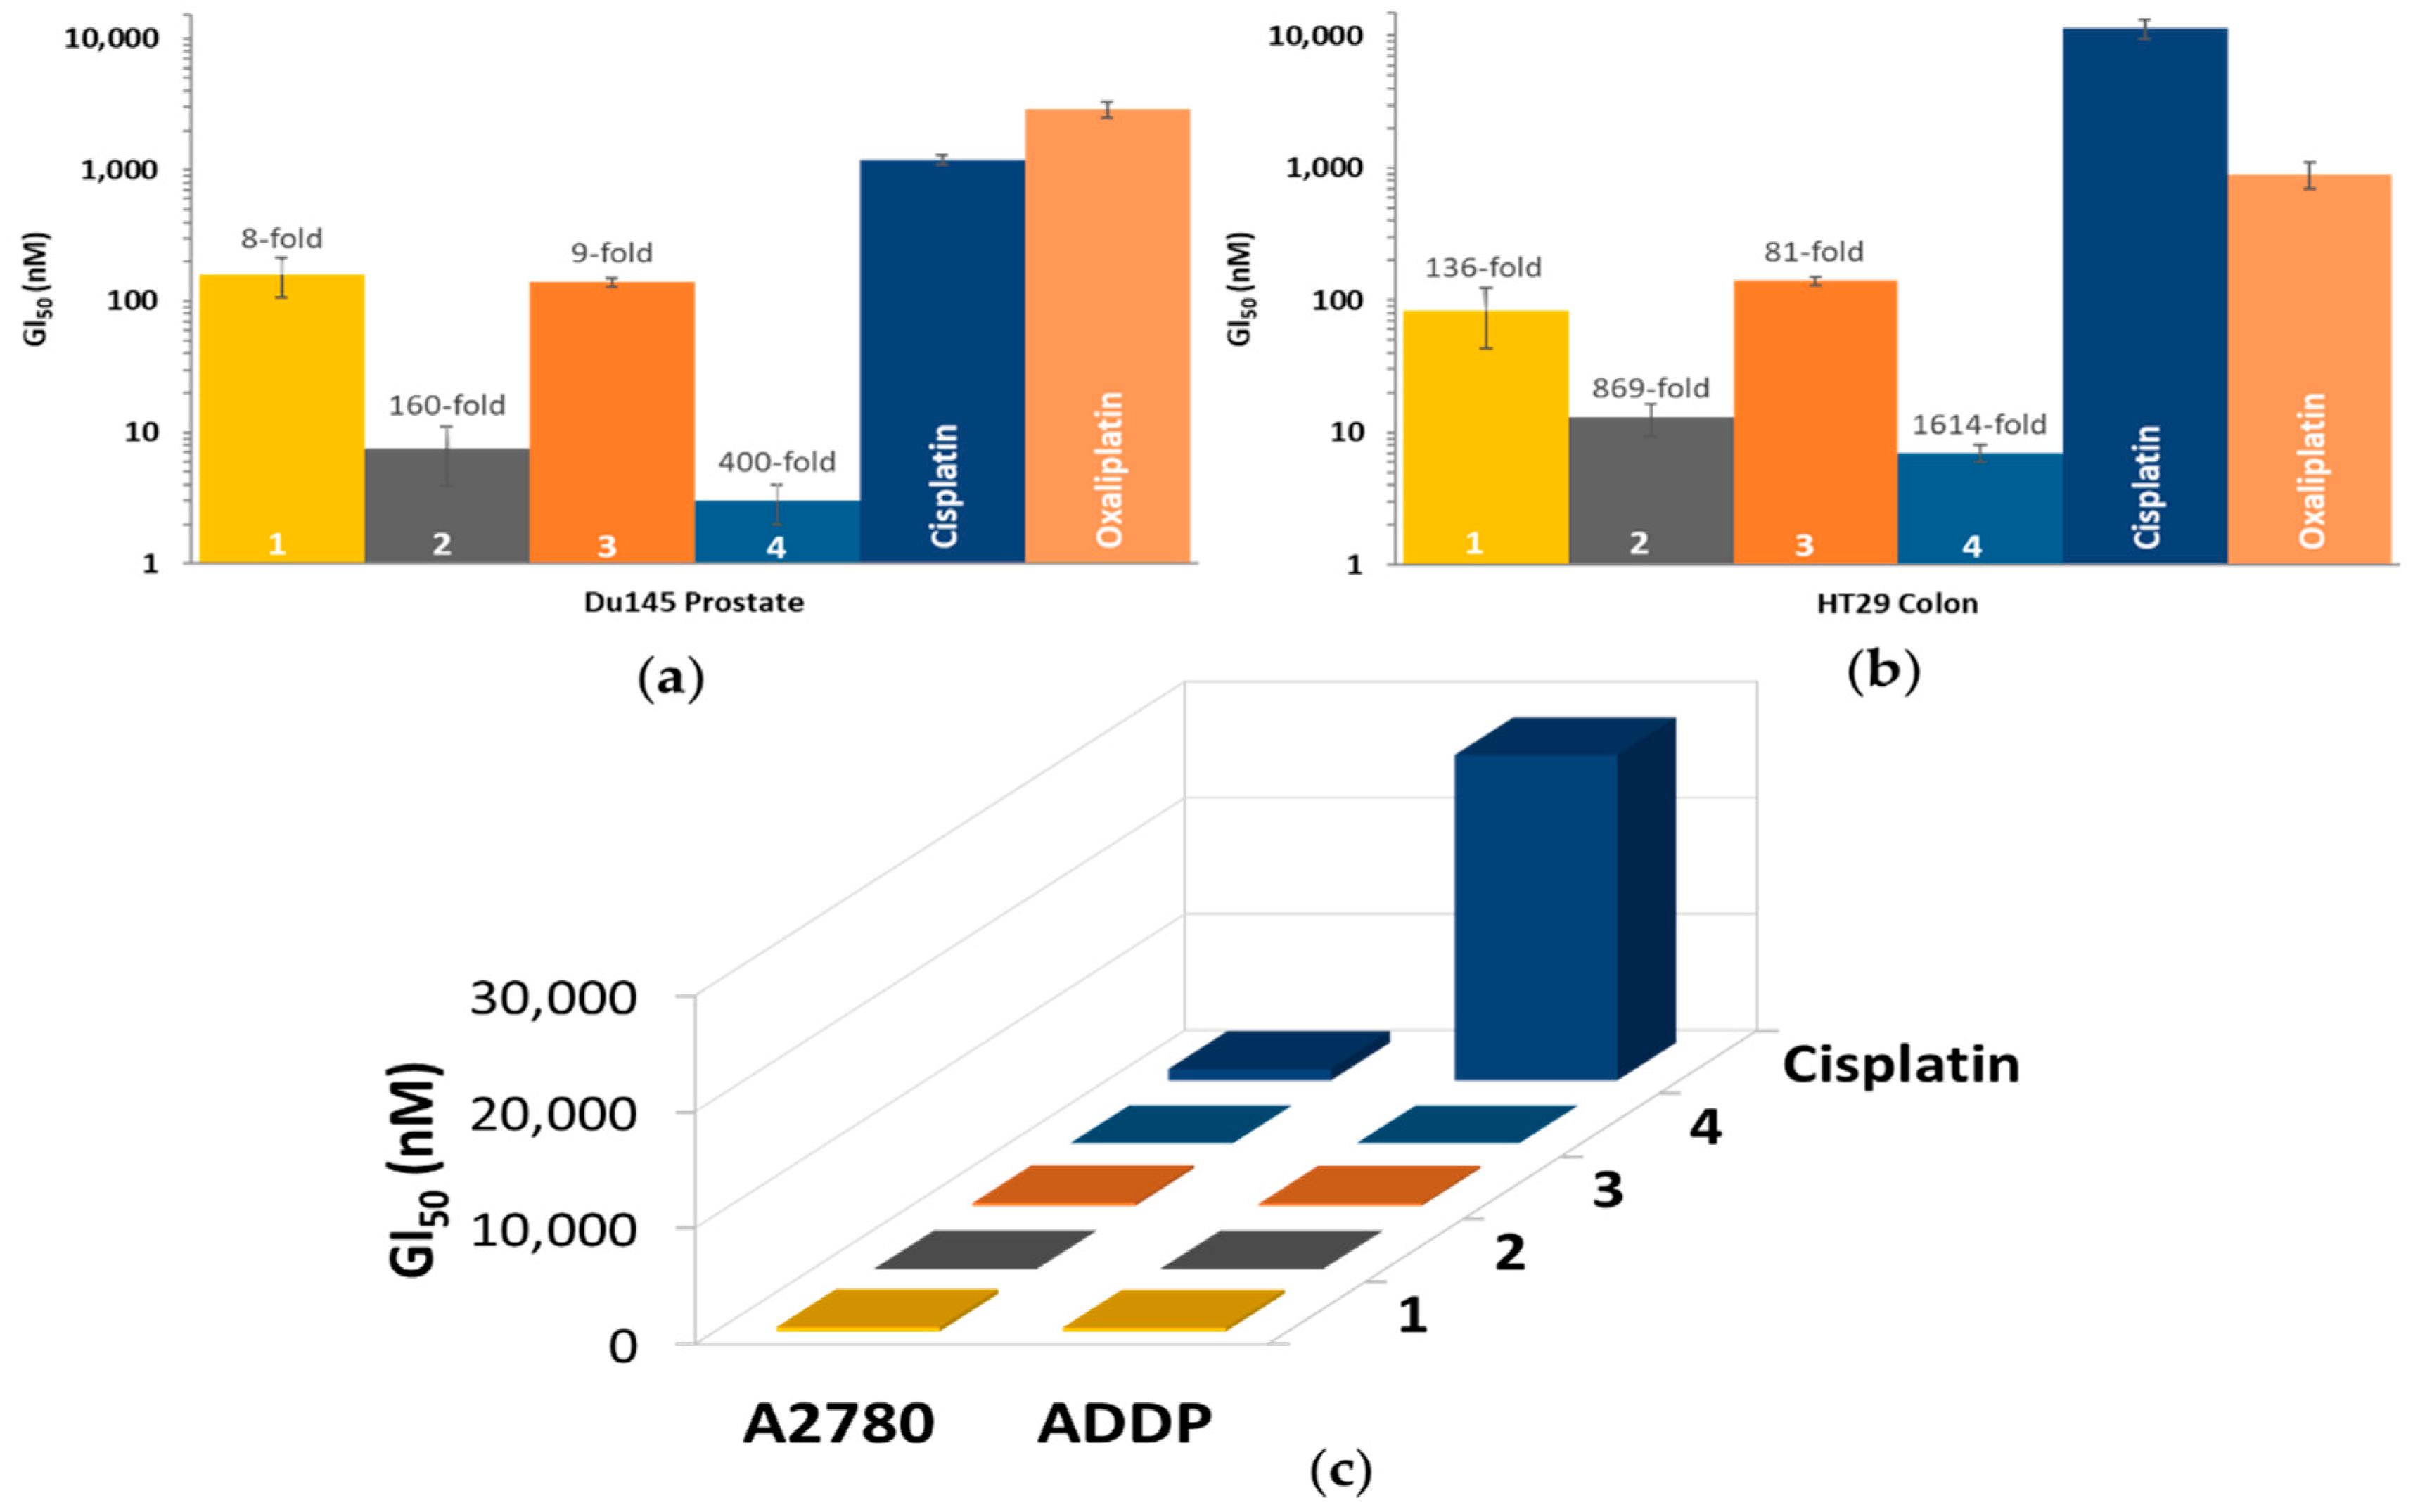
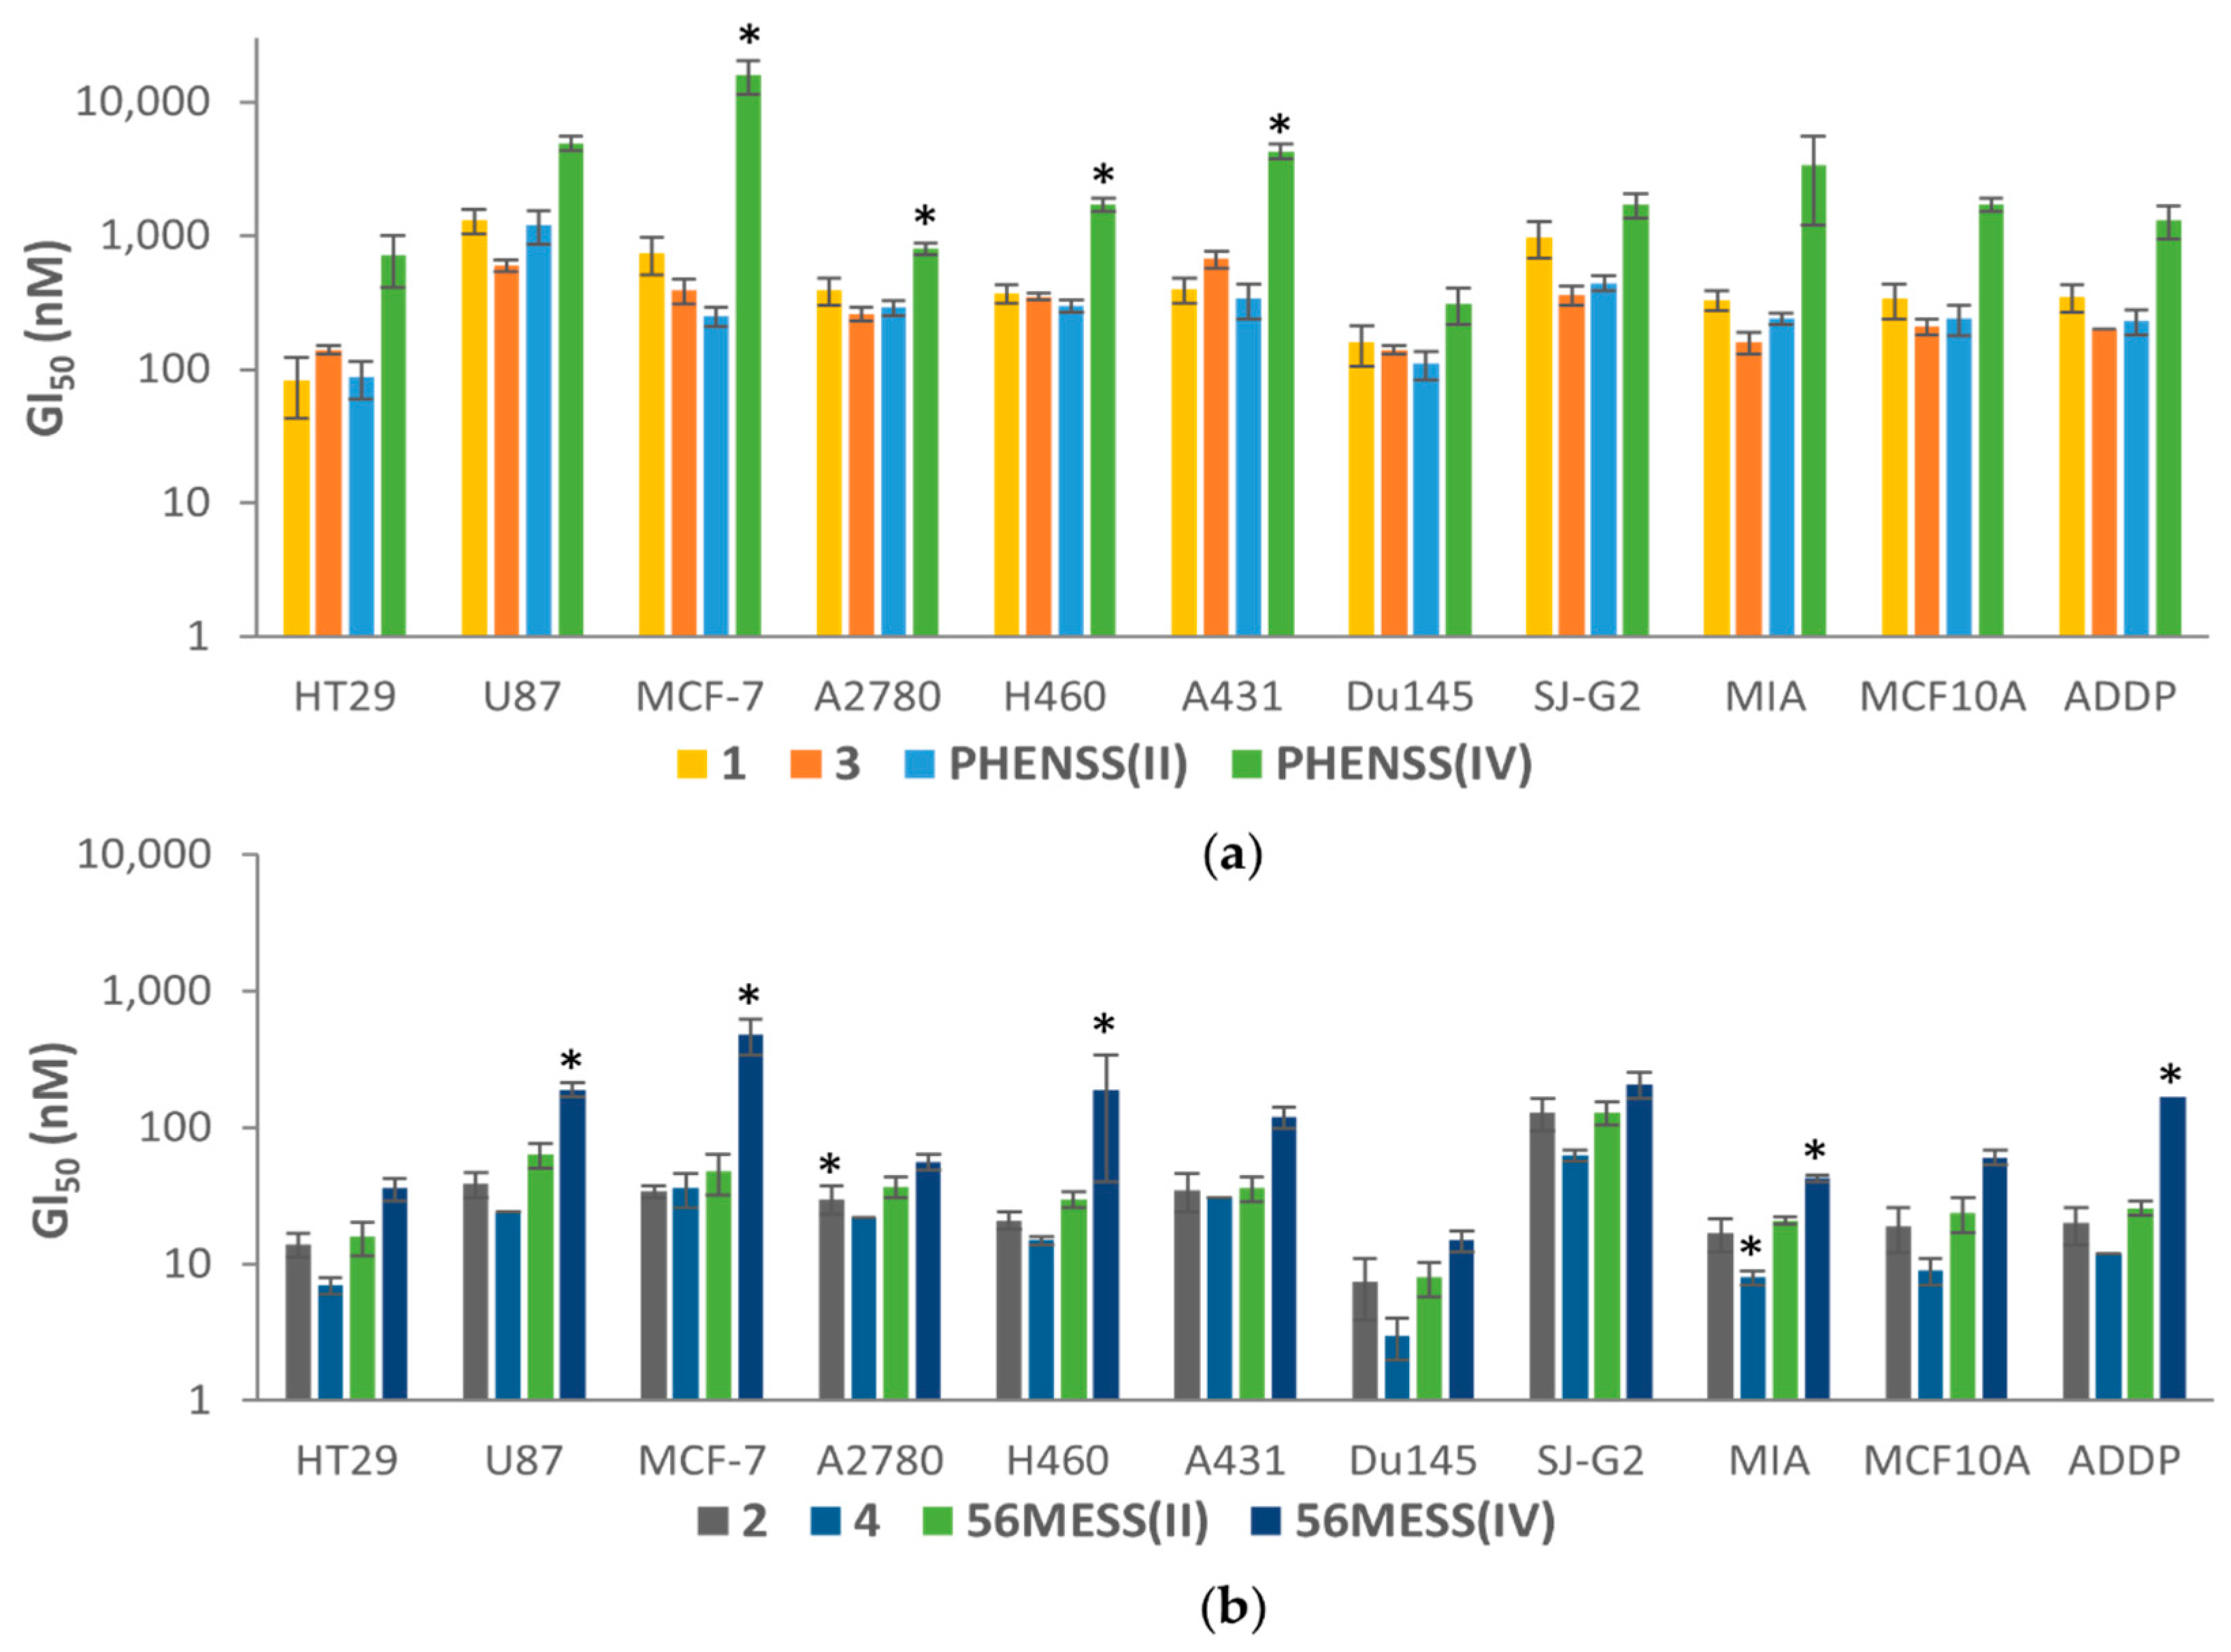
3.6. In Vitro Cytotoxicity
3.7. COX Inhibition
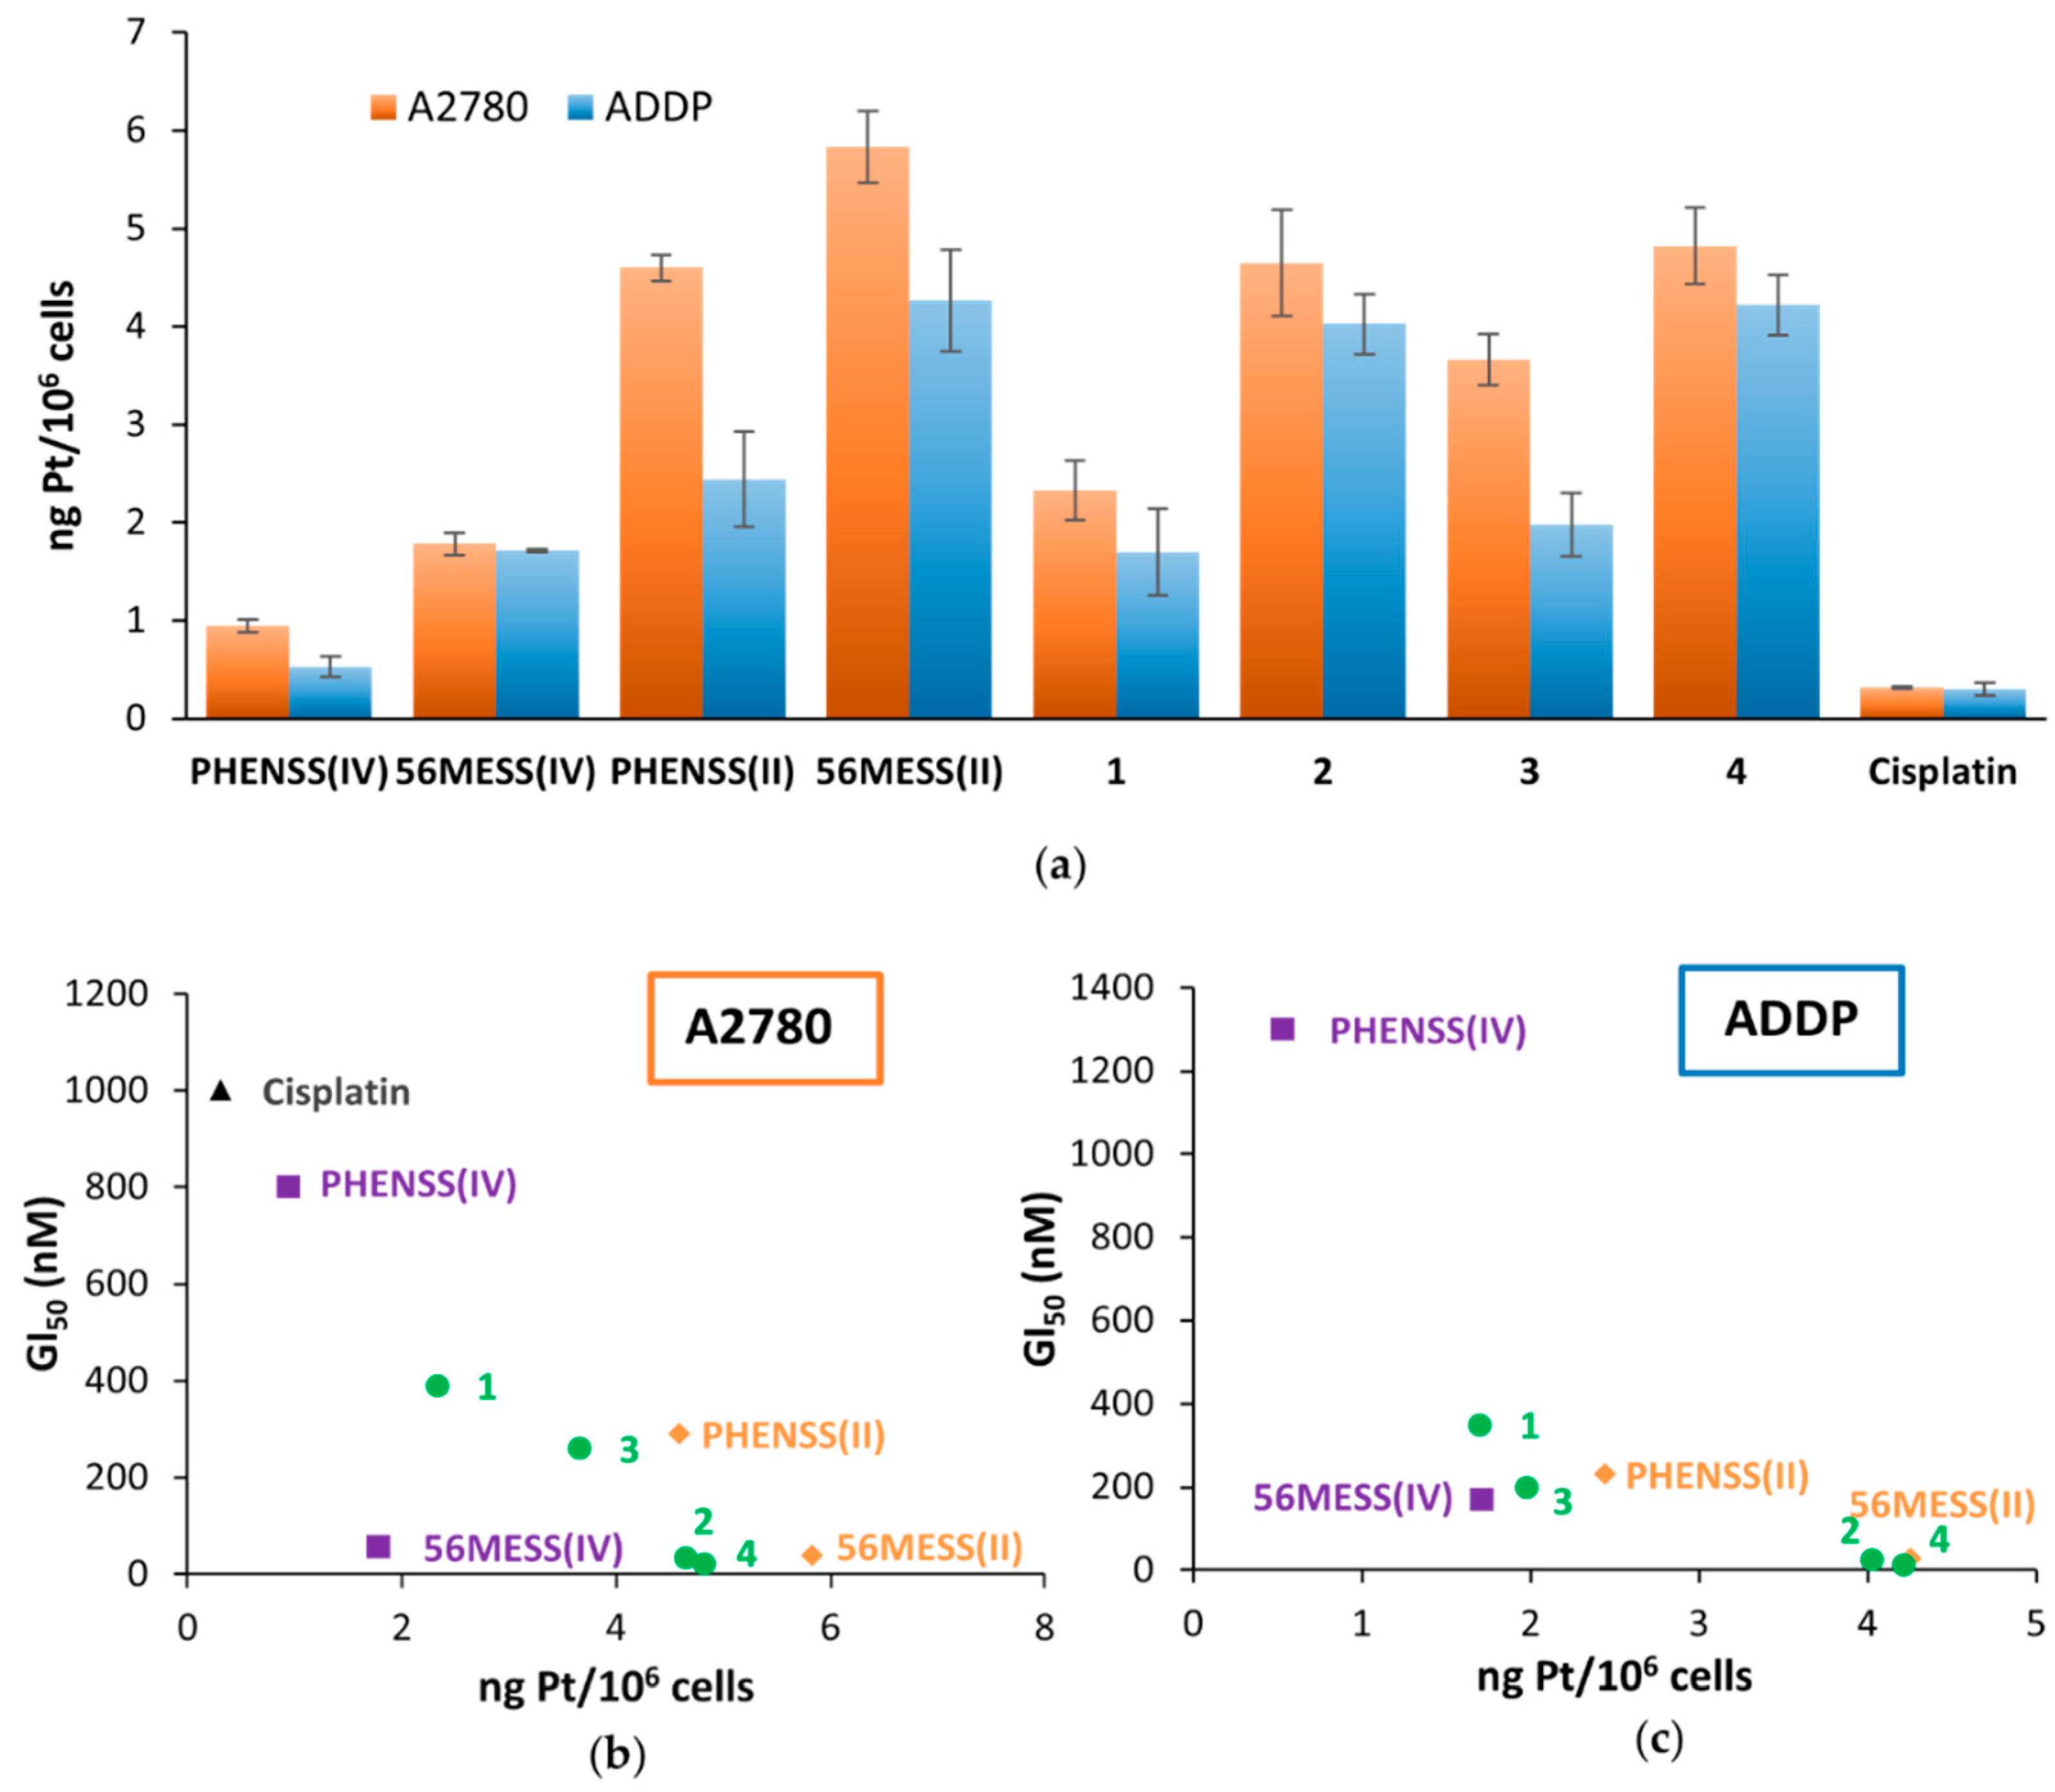
3.8. Platinum Uptake Studies
4. Conclusions
5. Patents
Supplementary Materials
Author Contributions
Funding
Institutional Review Board Statement
Informed Consent Statement
Data Availability Statement
Acknowledgments
Conflicts of Interest
References
- Johnstone, T.C.; Park, G.Y.; Lippard, S.J. Understanding and improving platinum anticancer drugs–phenanthriplatin. Anticancer Res. 2014, 34, 471–476. [Google Scholar] [PubMed]
- Rosenberg, B.; Van Camp, L.; Krigas, T. Inhibition of Cell Division in Escherichia coli by Electrolysis Products from a Platinum Electrode. Nature 1965, 205, 698–699. [Google Scholar] [CrossRef] [PubMed]
- Rosenberg, B.; Van Camp, L.; Trosko, J.E.; Mansour, V.H. Platinum compounds: A new class of potent antitumour agents. Nature 1969, 222, 385–386. [Google Scholar] [CrossRef] [PubMed]
- Rottenberg, S.; Disler, C.; Perego, P. The rediscovery of platinum-based cancer therapy. Nat. Rev. Cancer 2021, 21, 37–50. [Google Scholar] [CrossRef]
- Deo, K.M.; Ang, D.L.; McGhie, B.; Rajamanickam, A.; Dhiman, A.; Khoury, A.; Holland, J.; Bjelosevic, A.; Pages, B.; Gordon, C. Platinum coordination compounds with potent anticancer activity. Coord. Chem. Rev. 2018, 375, 148–163. [Google Scholar] [CrossRef]
- Johnstone, T.C.; Suntharalingam, K.; Lippard, S.J. The next generation of platinum drugs: Targeted Pt (II) agents, nanoparticle delivery, and Pt (IV) prodrugs. Chem. Rev. 2016, 116, 3436–3486. [Google Scholar] [CrossRef] [Green Version]
- Khoury, A.; Deo, K.M.; Aldrich-Wright, J.R. Recent advances in platinum-based chemotherapeutics that exhibit inhibitory and targeted mechanisms of action. J. Inorg. Biochem. 2020, 207, 111070. [Google Scholar] [CrossRef]
- Boulikas, T.; Pantos, A.; Bellis, E.; Christofis, P. Designing platinum compounds in cancer: Structures and mechanisms. Cancer Ther. 2007, 5, 537–583. [Google Scholar]
- Zhang, C.; Xu, C.; Gao, X.; Yao, Q. Platinum-based drugs for cancer therapy and anti-tumor strategies. Theranostics 2022, 12, 2115–2132. [Google Scholar] [CrossRef]
- Todd, R.C.; Lippard, S.J. Inhibition of transcription by platinum antitumor compounds. Metallomics 2009, 1, 280–291. [Google Scholar] [CrossRef] [Green Version]
- Jamieson, E.R.; Lippard, S.J. Structure, recognition, and processing of cisplatin− DNA adducts. Chem. Rev. 1999, 99, 2467–2498. [Google Scholar] [CrossRef] [PubMed]
- Bruno, P.M.; Liu, Y.; Park, G.Y.; Murai, J.; Koch, C.E.; Eisen, T.J.; Pritchard, J.R.; Pommier, Y.; Lippard, S.J.; Hemann, M.T. A subset of platinum-containing chemotherapeutic agents kills cells by inducing ribosome biogenesis stress. Nat. Med. 2017, 23, 461–473. [Google Scholar] [CrossRef] [PubMed]
- Garg, A.D.; More, S.; Rufo, N.; Mece, O.; Sassano, M.L.; Agostinis, P.; Zitvogel, L.; Kroemer, G.; Galluzzi, L. Trial watch: Immunogenic cell death induction by anticancer chemotherapeutics. Oncoimmunology 2017, 6, e1386829. [Google Scholar] [CrossRef] [PubMed] [Green Version]
- Wheate, N.J.; Taleb, R.I.; Krause-Heuer, A.M.; Cook, R.L.; Wang, S.; Higgins, V.J.; Aldrich-Wright, J.R. Novel platinum (II)-based anticancer complexes and molecular hosts as their drug delivery vehicles. Dalton Trans. 2007, 43, 5055–5064. [Google Scholar] [CrossRef] [Green Version]
- Brodie, C.R.; Collins, J.G.; Aldrich-Wright, J.R. DNA binding and biological activity of some platinum (II) intercalating compounds containing methyl-substituted 1, 10-phenanthrolines. Dalton Trans. 2004, 8, 1145–1152. [Google Scholar] [CrossRef]
- Kostrhunova, H.; Zajac, J.; Novohradsky, V.; Kasparkova, J.; Malina, J.; Aldrich-Wright, J.R.; Petruzzella, E.; Sirota, R.; Gibson, D.; Brabec, V. A Subset of New Platinum Antitumor Agents Kills Cells by a Multimodal Mechanism of Action Also Involving Changes in the Organization of the Microtubule Cytoskeleton. J. Med. Chem. 2019, 62, 5176–5190. [Google Scholar] [CrossRef] [PubMed]
- Moretto, J.; Chauffert, B.; Ghiringhelli, F.; Aldrich-Wright, J.R.; Bouyer, F. Discrepancy between in vitro and in vivo antitumor effect of a new platinum (II) metallointercalator. Investig. New Drugs 2011, 29, 1164–1176. [Google Scholar] [CrossRef]
- Macias, F.J.; Deo, K.M.; Wormell, P.; Clegg, J.K.; Zhang, Y.; Li, F.; Zheng, G.; Sakoff, J.; Gilbert, J.; Aldrich-Wright, J.R. Synthesis and analysis of the structure, diffusion and cytotoxicity of heterocyclic platinum (IV) complexes. Eur. J. Chem. 2015, 21, 16990–17001. [Google Scholar] [CrossRef]
- Harper, B.W.; Petruzzella, E.; Sirota, R.; Faccioli, F.F.; Aldrich-Wright, J.R.; Gandin, V.; Gibson, D. Synthesis, characterization and in vitro and in vivo anticancer activity of Pt (iv) derivatives of [Pt (1 S, 2 S-DACH)(5, 6-dimethyl-1, 10-phenanthroline)]. Dalton Trans. 2017, 46, 7005–7019. [Google Scholar] [CrossRef]
- Hall, M.D.; Hambley, T.W. Platinum (IV) antitumour compounds: Their bioinorganic chemistry. Coord. Chem. Rev. 2002, 232, 49–67. [Google Scholar] [CrossRef]
- Hall, M.D.; Mellor, H.R.; Callaghan, R.; Hambley, T.W. Basis for Design and Development of Platinum(IV) Anticancer Complexes. J. Med. Chem. 2007, 50, 3403–3411. [Google Scholar] [CrossRef] [PubMed]
- Karges, J.; Stokes, R.W.; Cohen, S.M. Metal complexes for therapeutic applications. Trends Chem. 2021, 3, 523–534. [Google Scholar] [CrossRef]
- Johnstone, T.C.; Wilson, J.J.; Lippard, S.J. Monofunctional and higher-valent platinum anticancer agents. Inorg. Chem. 2013, 52, 12234–12249. [Google Scholar] [CrossRef] [Green Version]
- Bruijnincx, P.C.; Sadler, P.J. New trends for metal complexes with anticancer activity. Curr. Opin. Chem. Biol. 2008, 12, 197–206. [Google Scholar] [CrossRef] [PubMed] [Green Version]
- Deo, K.M.; Sakoff, J.; Gilbert, J.; Zhang, Y.; Wright, J.R.A. Synthesis, characterisation and potent cytotoxicity of unconventional platinum (IV) complexes with modified lipophilicity. Dalton Trans. 2019, 48, 17217–17227. [Google Scholar] [CrossRef] [PubMed]
- Chen, C.K.; Zhang, J.Z.; Aitken, J.B.; Hambley, T.W. Influence of equatorial and axial carboxylato ligands on the kinetic inertness of platinum (IV) complexes in the presence of ascorbate and cysteine and within DLD-1 cancer cells. J. Med. Chem. 2013, 56, 8757–8764. [Google Scholar] [CrossRef]
- Zhong, Y.; Jia, C.; Zhang, X.; Liao, X.; Yang, B.; Cong, Y.; Pu, S.; Gao, C. Targeting drug delivery system for platinum (IV)-Based antitumor complexes. Eur. J. Med. Chem. 2020, 194, 112229. [Google Scholar] [CrossRef]
- Xu, Z.; Wang, Z.; Deng, Z.; Zhu, G. Recent advances in the synthesis, stability, and activation of platinum (IV) anticancer prodrugs. Coord. Chem. Rev. 2021, 442, 213991. [Google Scholar] [CrossRef]
- Chen, S.; Ng, K.-Y.; Zhou, Q.; Yao, H.; Deng, Z.; Tse, M.-K.; Zhu, G. The influence of different carbonate ligands on the hydrolytic stability and reduction of platinum (IV) prodrugs. Dalton Trans. 2022, 51, 885–897. [Google Scholar] [CrossRef]
- Kenny, R.G.; Marmion, C.J. Toward multi-targeted platinum and ruthenium drugs—A new paradigm in cancer drug treatment regimens? Chem. Rev. 2019, 119, 1058–1137. [Google Scholar] [CrossRef]
- Cheng, Q.; Shi, H.; Wang, H.; Min, Y.; Wang, J.; Liu, Y. The ligation of aspirin to cisplatin demonstrates significant synergistic effects on tumor cells. Chem. Comm. 2014, 50, 7427–7430. [Google Scholar] [CrossRef] [PubMed]
- Pathak, R.K.; Marrache, S.; Choi, J.H.; Berding, T.B.; Dhar, S. The Prodrug Platin-A: Simultaneous Release of Cisplatin and Aspirin. Angew. Chem. Int. Ed. 2014, 53, 1963–1967. [Google Scholar] [CrossRef] [PubMed]
- Neumann, W.; Crews, B.C.; Marnett, L.J.; Hey-Hawkins, E. Conjugates of cisplatin and cyclooxygenase inhibitors as potent antitumor agents overcoming cisplatin resistance. ChemMedChem 2014, 9, 1150–1153. [Google Scholar] [CrossRef] [PubMed] [Green Version]
- Neumann, W.; Crews, B.C.; Sárosi, M.B.; Daniel, C.M.; Ghebreselasie, K.; Scholz, M.S.; Marnett, L.J.; Hey-Hawkins, E. Conjugation of cisplatin analogues and cyclooxygenase inhibitors to overcome cisplatin resistance. Chem. Med. Chem. 2015, 10, 183–192. [Google Scholar] [CrossRef] [PubMed] [Green Version]
- Spector, D.; Krasnovskaya, O.; Pavlov, K.; Erofeev, A.; Gorelkin, P.; Beloglazkina, E.; Majouga, A. Pt (IV) Prodrugs with NSAIDs as Axial Ligands. Int. J. Mol. Sci. 2021, 22, 3817. [Google Scholar] [CrossRef]
- Liu, B.; Qu, L.; Yan, S. Cyclooxygenase-2 promotes tumor growth and suppresses tumor immunity. Cancer Cell Int. 2015, 15, 106. [Google Scholar] [CrossRef] [Green Version]
- De Marzo, A.M.; Platz, E.A.; Sutcliffe, S.; Xu, J.; Grönberg, H.; Drake, C.G.; Nakai, Y.; Isaacs, W.B.; Nelson, W.G. Inflammation in prostate carcinogenesis. Nat. Rev. Cancer 2007, 7, 256–269. [Google Scholar] [CrossRef] [Green Version]
- Oldfield, S.P.; Hall, M.D.; Platts, J.A. Calculation of Lipophilicity of a Large, Diverse Dataset of Anticancer Platinum Complexes and the Relation to Cellular Uptake. J. Med. Chem. 2007, 50, 5227–5237. [Google Scholar] [CrossRef]
- Abu Ammar, A.; Raveendran, R.; Gibson, D.; Nassar, T.; Benita, S. A Lipophilic Pt(IV) Oxaliplatin Derivative Enhances Antitumor Activity. J. Med. Chem. 2016, 59, 9035–9046. [Google Scholar] [CrossRef]
- Tarleton, M.; Gilbert, J.; Robertson, M.J.; McCluskey, A.; Sakoff, J.A. Library synthesis and cytotoxicity of a family of 2-phenylacrylonitriles and discovery of an estrogen dependent breast cancer lead compound. Med. Chem. Comm. 2011, 2, 31–37. [Google Scholar] [CrossRef]
- Deo, K.M.; Sakoff, J.; Gilbert, J.; Zhang, Y.; Wright, J.R.A. Synthesis, characterisation and influence of lipophilicity on cellular accumulation and cytotoxicity of unconventional platinum (IV) prodrugs as potent anticancer agents. Dalton Trans. 2019, 48, 17228–17240. [Google Scholar] [CrossRef] [PubMed]
- Still, B.M.; Kumar, P.A.; Aldrich-Wright, J.R.; Price, W.S. 195Pt NMR—Theory and application. Chem. Soc. Rev. 2007, 36, 665–686. [Google Scholar] [CrossRef] [PubMed]
- Hansch, C.; Leo, A.; Hoekman, D.; Livingstone, D. Exploring QSAR: Hydrophobic, Electronic, and Steric Constants; American Chemical Society: Washington, DC, USA, 1995; Volume 2. [Google Scholar]
- Kasim, N.A.; Whitehouse, M.; Ramachandran, C.; Bermejo, M.; Lennernäs, H.; Hussain, A.S.; Junginger, H.E.; Stavchansky, S.A.; Midha, K.K.; Shah, V.P.; et al. Molecular Properties of WHO Essential Drugs and Provisional Biopharmaceutical Classification. Mol. Pharm. 2004, 1, 85–96. [Google Scholar] [CrossRef] [PubMed]


| Complex | Log kw | Axial Ligand | Pt(II) Congener |
|---|---|---|---|
| 3 | 0.41 | Aspirin | PHENSS |
| 4 | 0.65 | Aspirin | 56MESS |
| 1 | 1.08 | Indomethacin | PHENSS |
| 2 | 1.28 | Indomethacin | 56MESS |
Publisher’s Note: MDPI stays neutral with regard to jurisdictional claims in published maps and institutional affiliations. |
© 2022 by the authors. Licensee MDPI, Basel, Switzerland. This article is an open access article distributed under the terms and conditions of the Creative Commons Attribution (CC BY) license (https://creativecommons.org/licenses/by/4.0/).
Share and Cite
Khoury, A.; Sakoff, J.A.; Gilbert, J.; Scott, K.F.; Karan, S.; Gordon, C.P.; Aldrich-Wright, J.R. Cyclooxygenase-Inhibiting Platinum(IV) Prodrugs with Potent Anticancer Activity. Pharmaceutics 2022, 14, 787. https://doi.org/10.3390/pharmaceutics14040787
Khoury A, Sakoff JA, Gilbert J, Scott KF, Karan S, Gordon CP, Aldrich-Wright JR. Cyclooxygenase-Inhibiting Platinum(IV) Prodrugs with Potent Anticancer Activity. Pharmaceutics. 2022; 14(4):787. https://doi.org/10.3390/pharmaceutics14040787
Chicago/Turabian StyleKhoury, Aleen, Jennette A. Sakoff, Jayne Gilbert, Kieran F. Scott, Shawan Karan, Christopher P. Gordon, and Janice R. Aldrich-Wright. 2022. "Cyclooxygenase-Inhibiting Platinum(IV) Prodrugs with Potent Anticancer Activity" Pharmaceutics 14, no. 4: 787. https://doi.org/10.3390/pharmaceutics14040787
APA StyleKhoury, A., Sakoff, J. A., Gilbert, J., Scott, K. F., Karan, S., Gordon, C. P., & Aldrich-Wright, J. R. (2022). Cyclooxygenase-Inhibiting Platinum(IV) Prodrugs with Potent Anticancer Activity. Pharmaceutics, 14(4), 787. https://doi.org/10.3390/pharmaceutics14040787