
Fabrication and Modelling of a Reservoir-Based Drug Delivery System for Customizable Release

 ,
, 
Abstract
:
1. Introduction
2. Materials and Methods
2.1. Fabrication of Reservoir-Based Drug Delivery System
2.2. Functionalization of Microchannels by Poly(N-Isopropylacrylamide) (pNipam)
2.3. Characterization of Release Kinetics
2.4. Scanning Electron Microscopy
2.5. Synchroton Radiation-Based Micro Computed Tomography (SRμCT)
2.5.1. Imaging
2.5.2. Image Processing and Segmentation
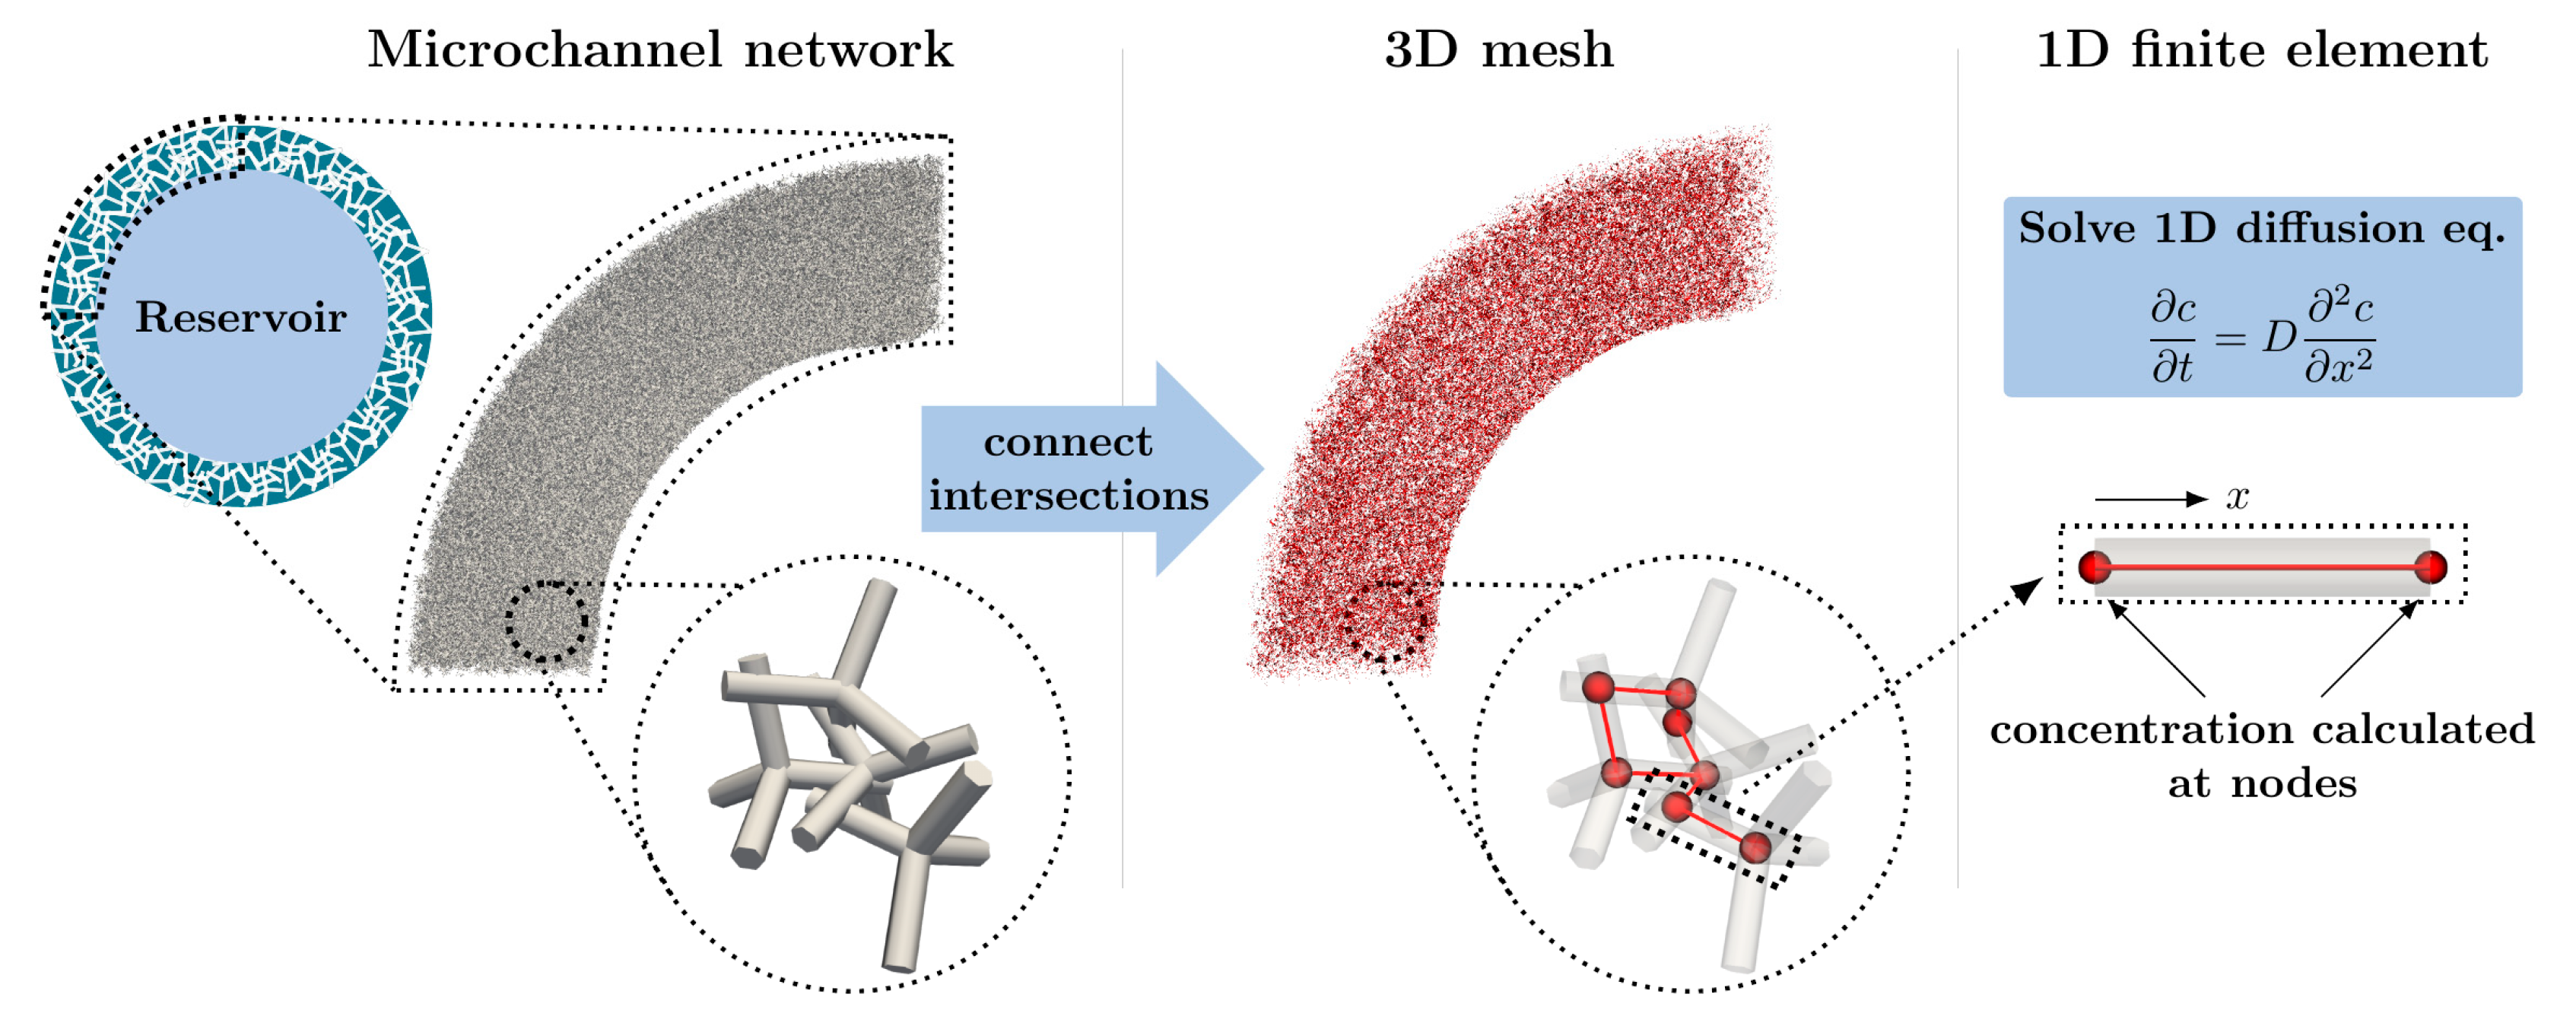
2.6. Computational Modelling and Simulation
3. Results and Discussion
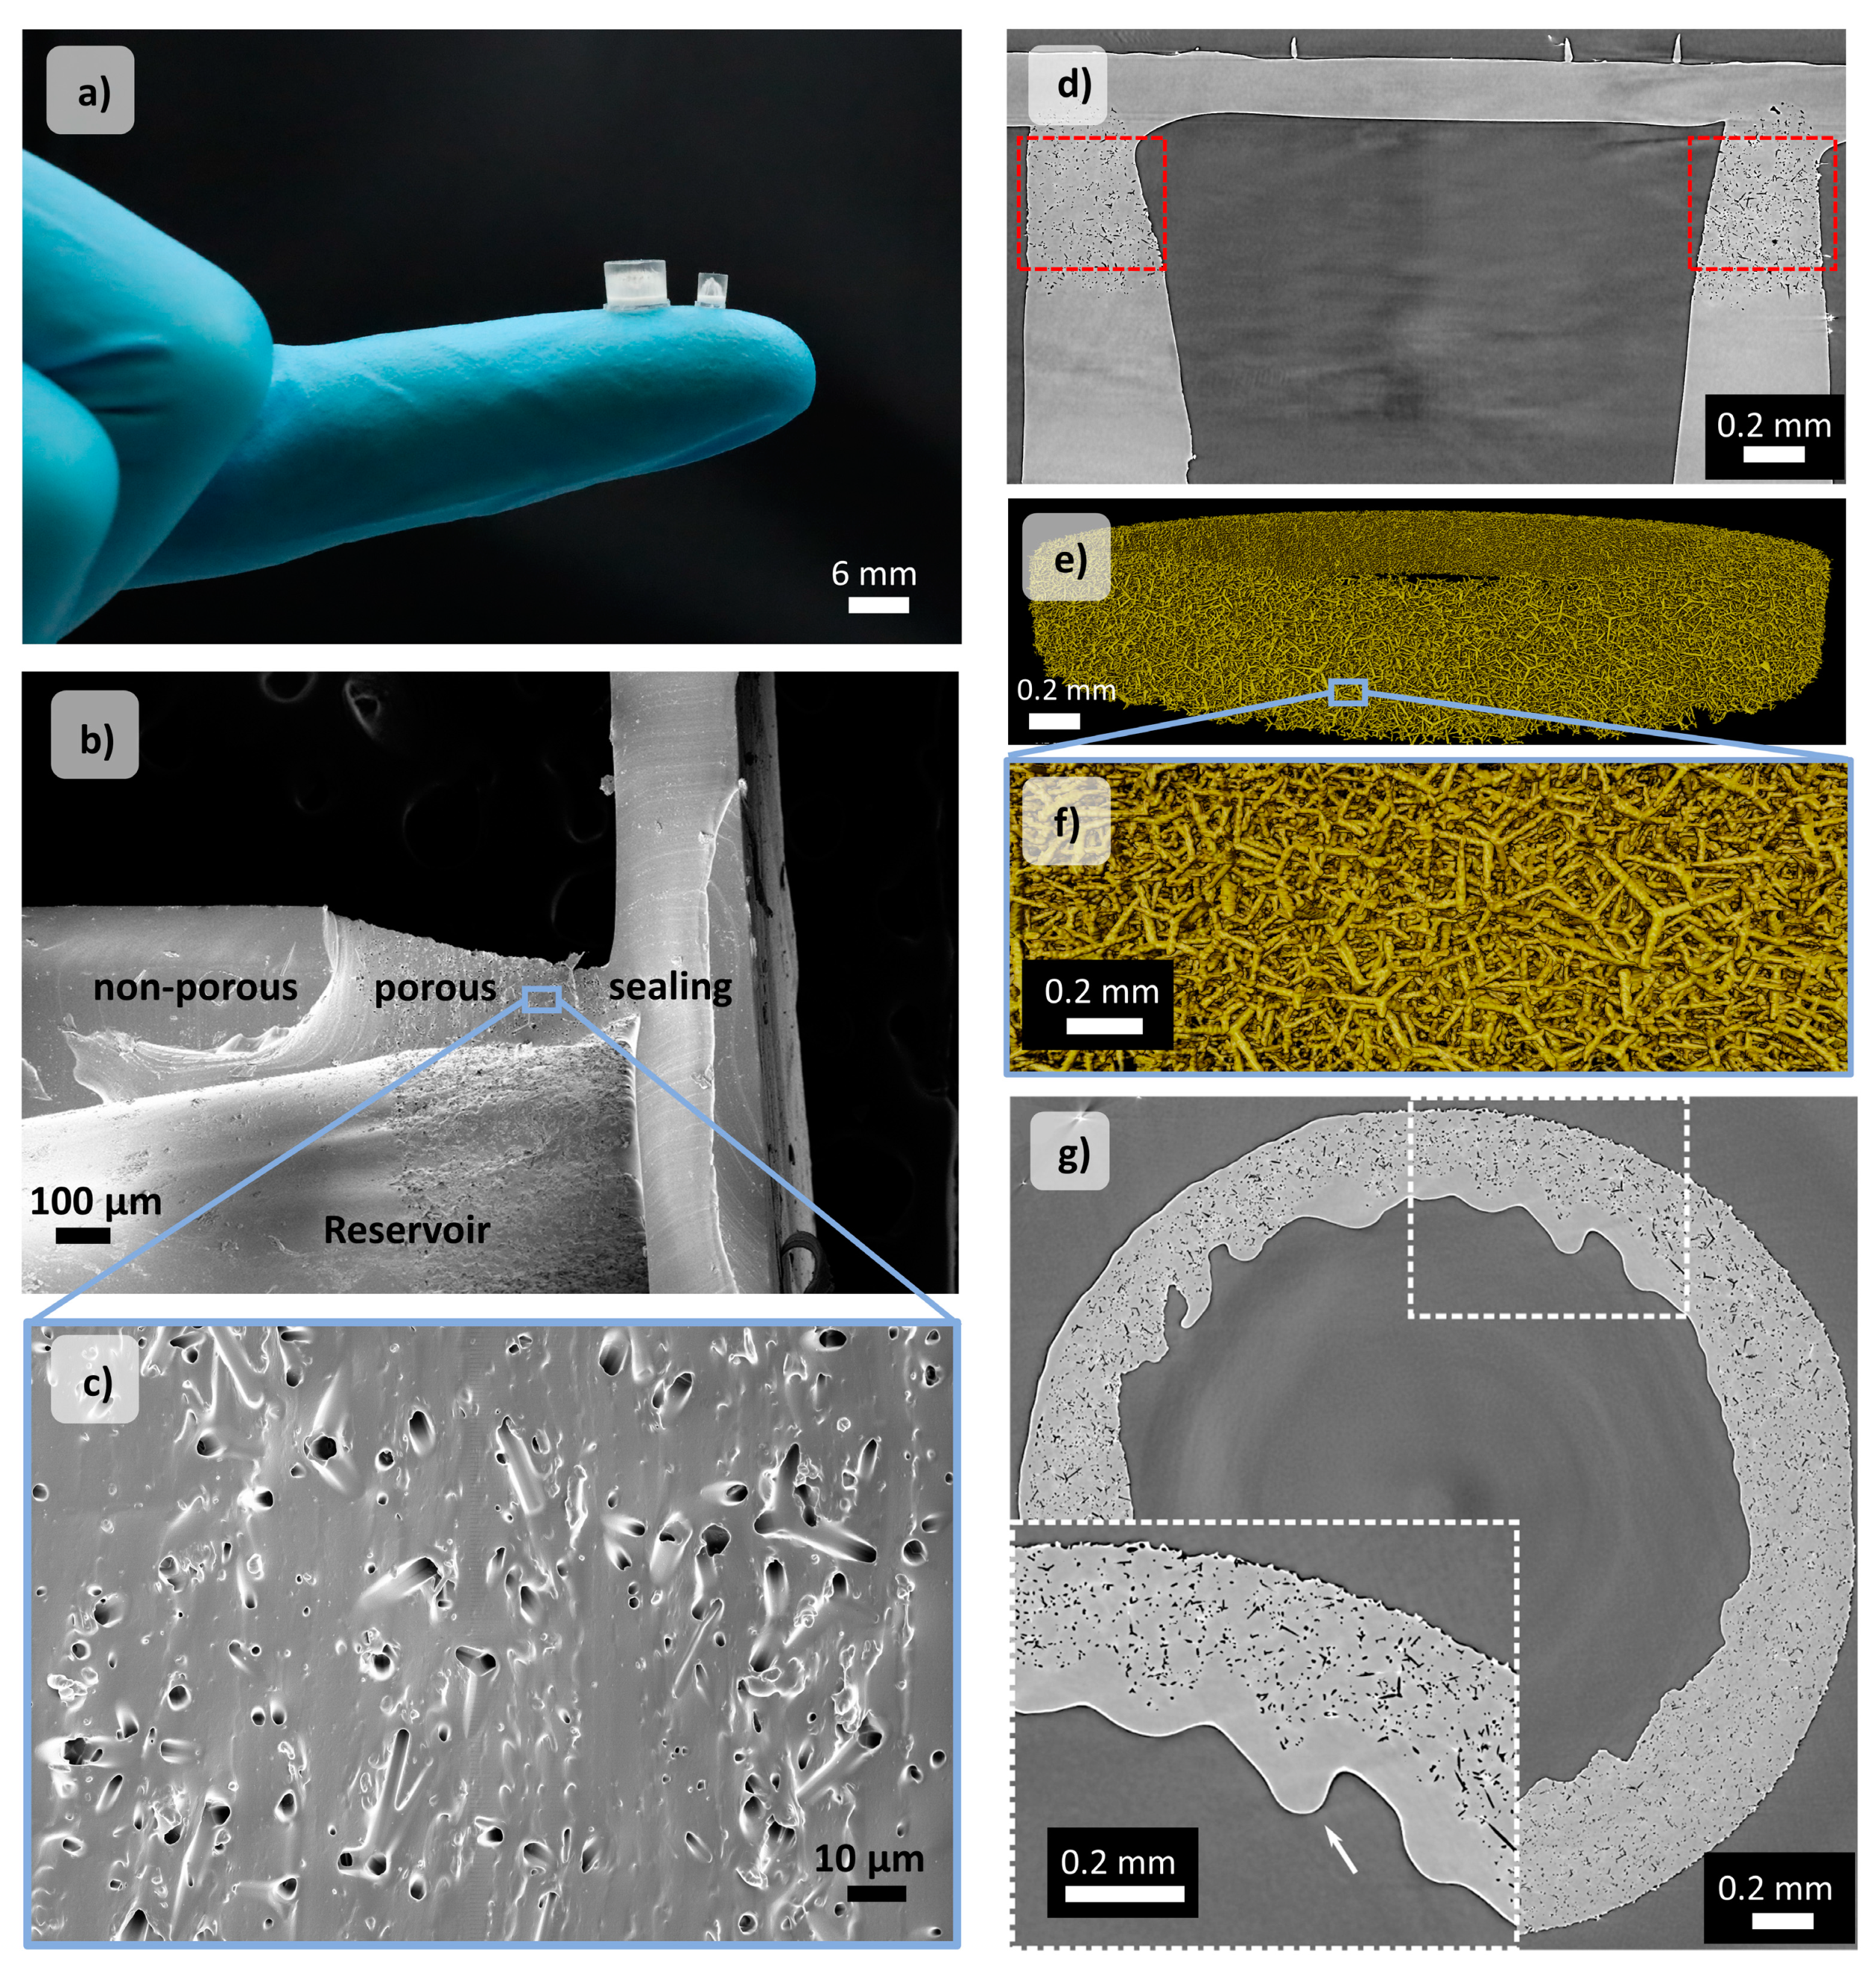
3.1. Scanning Electron Microscopy and Synchroton Radiation-Based Micro Computed Tomography (SRμCT)
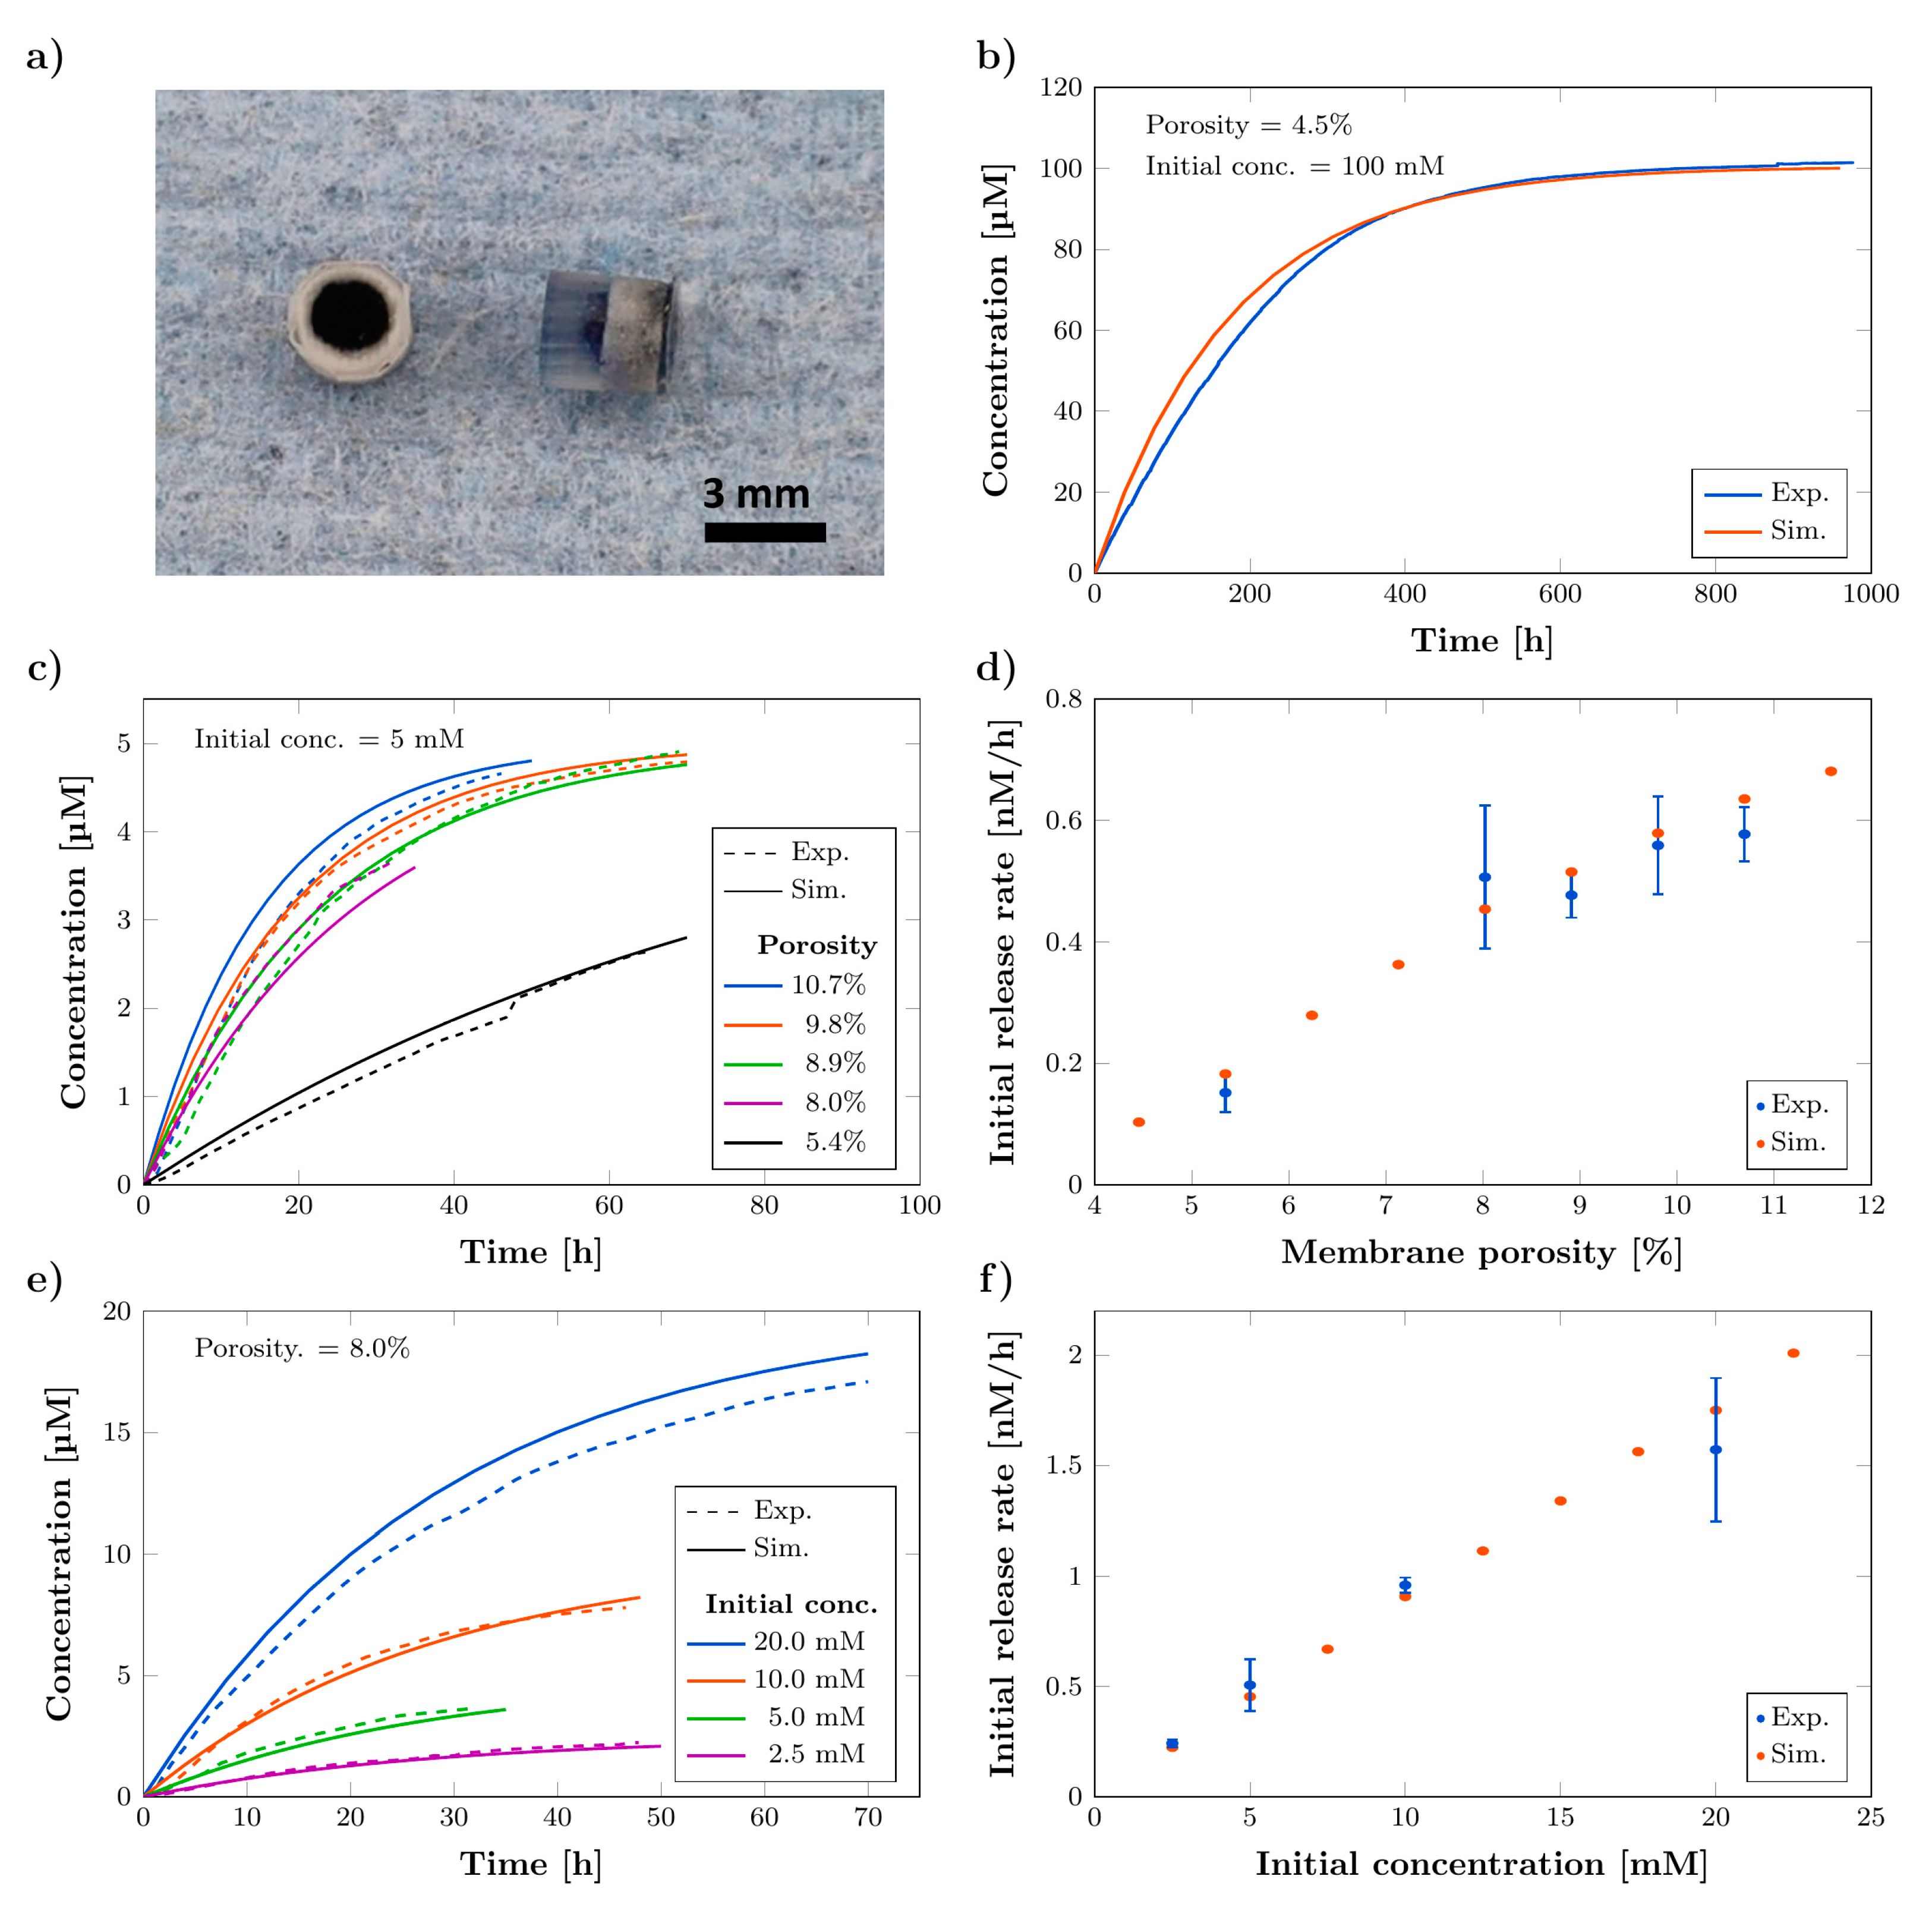
3.2. Chracterization of Release Kinetics
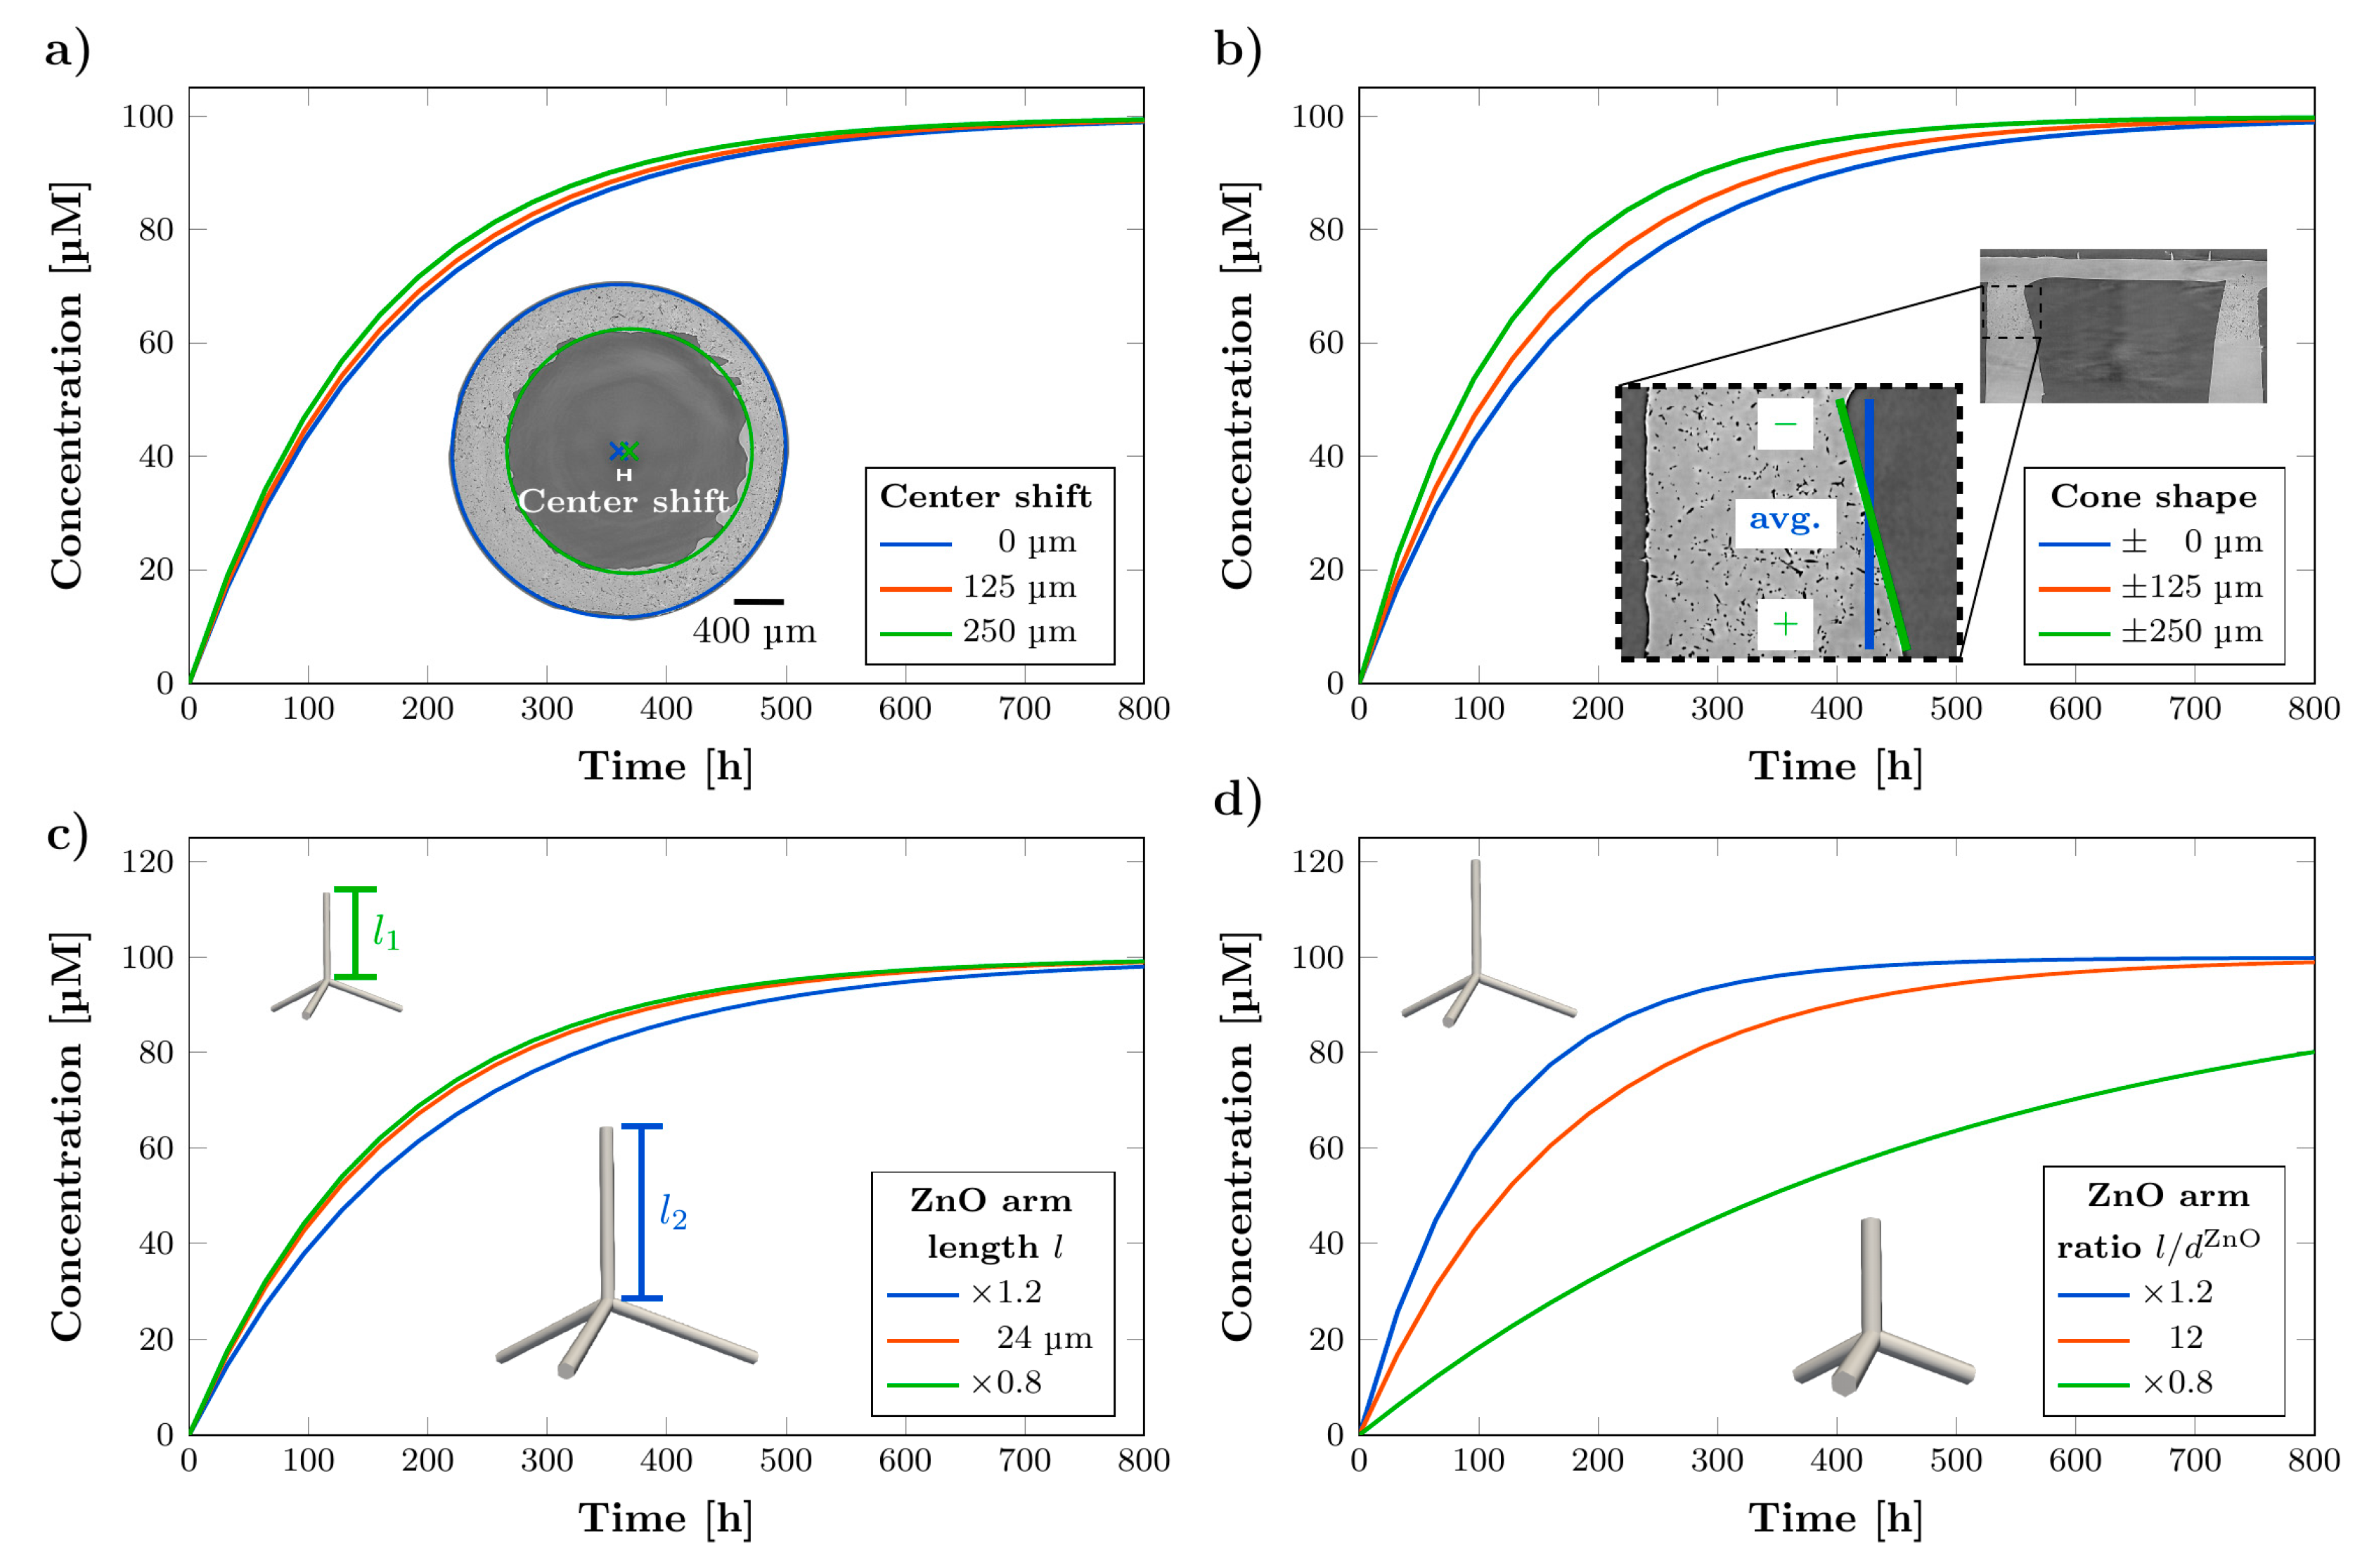
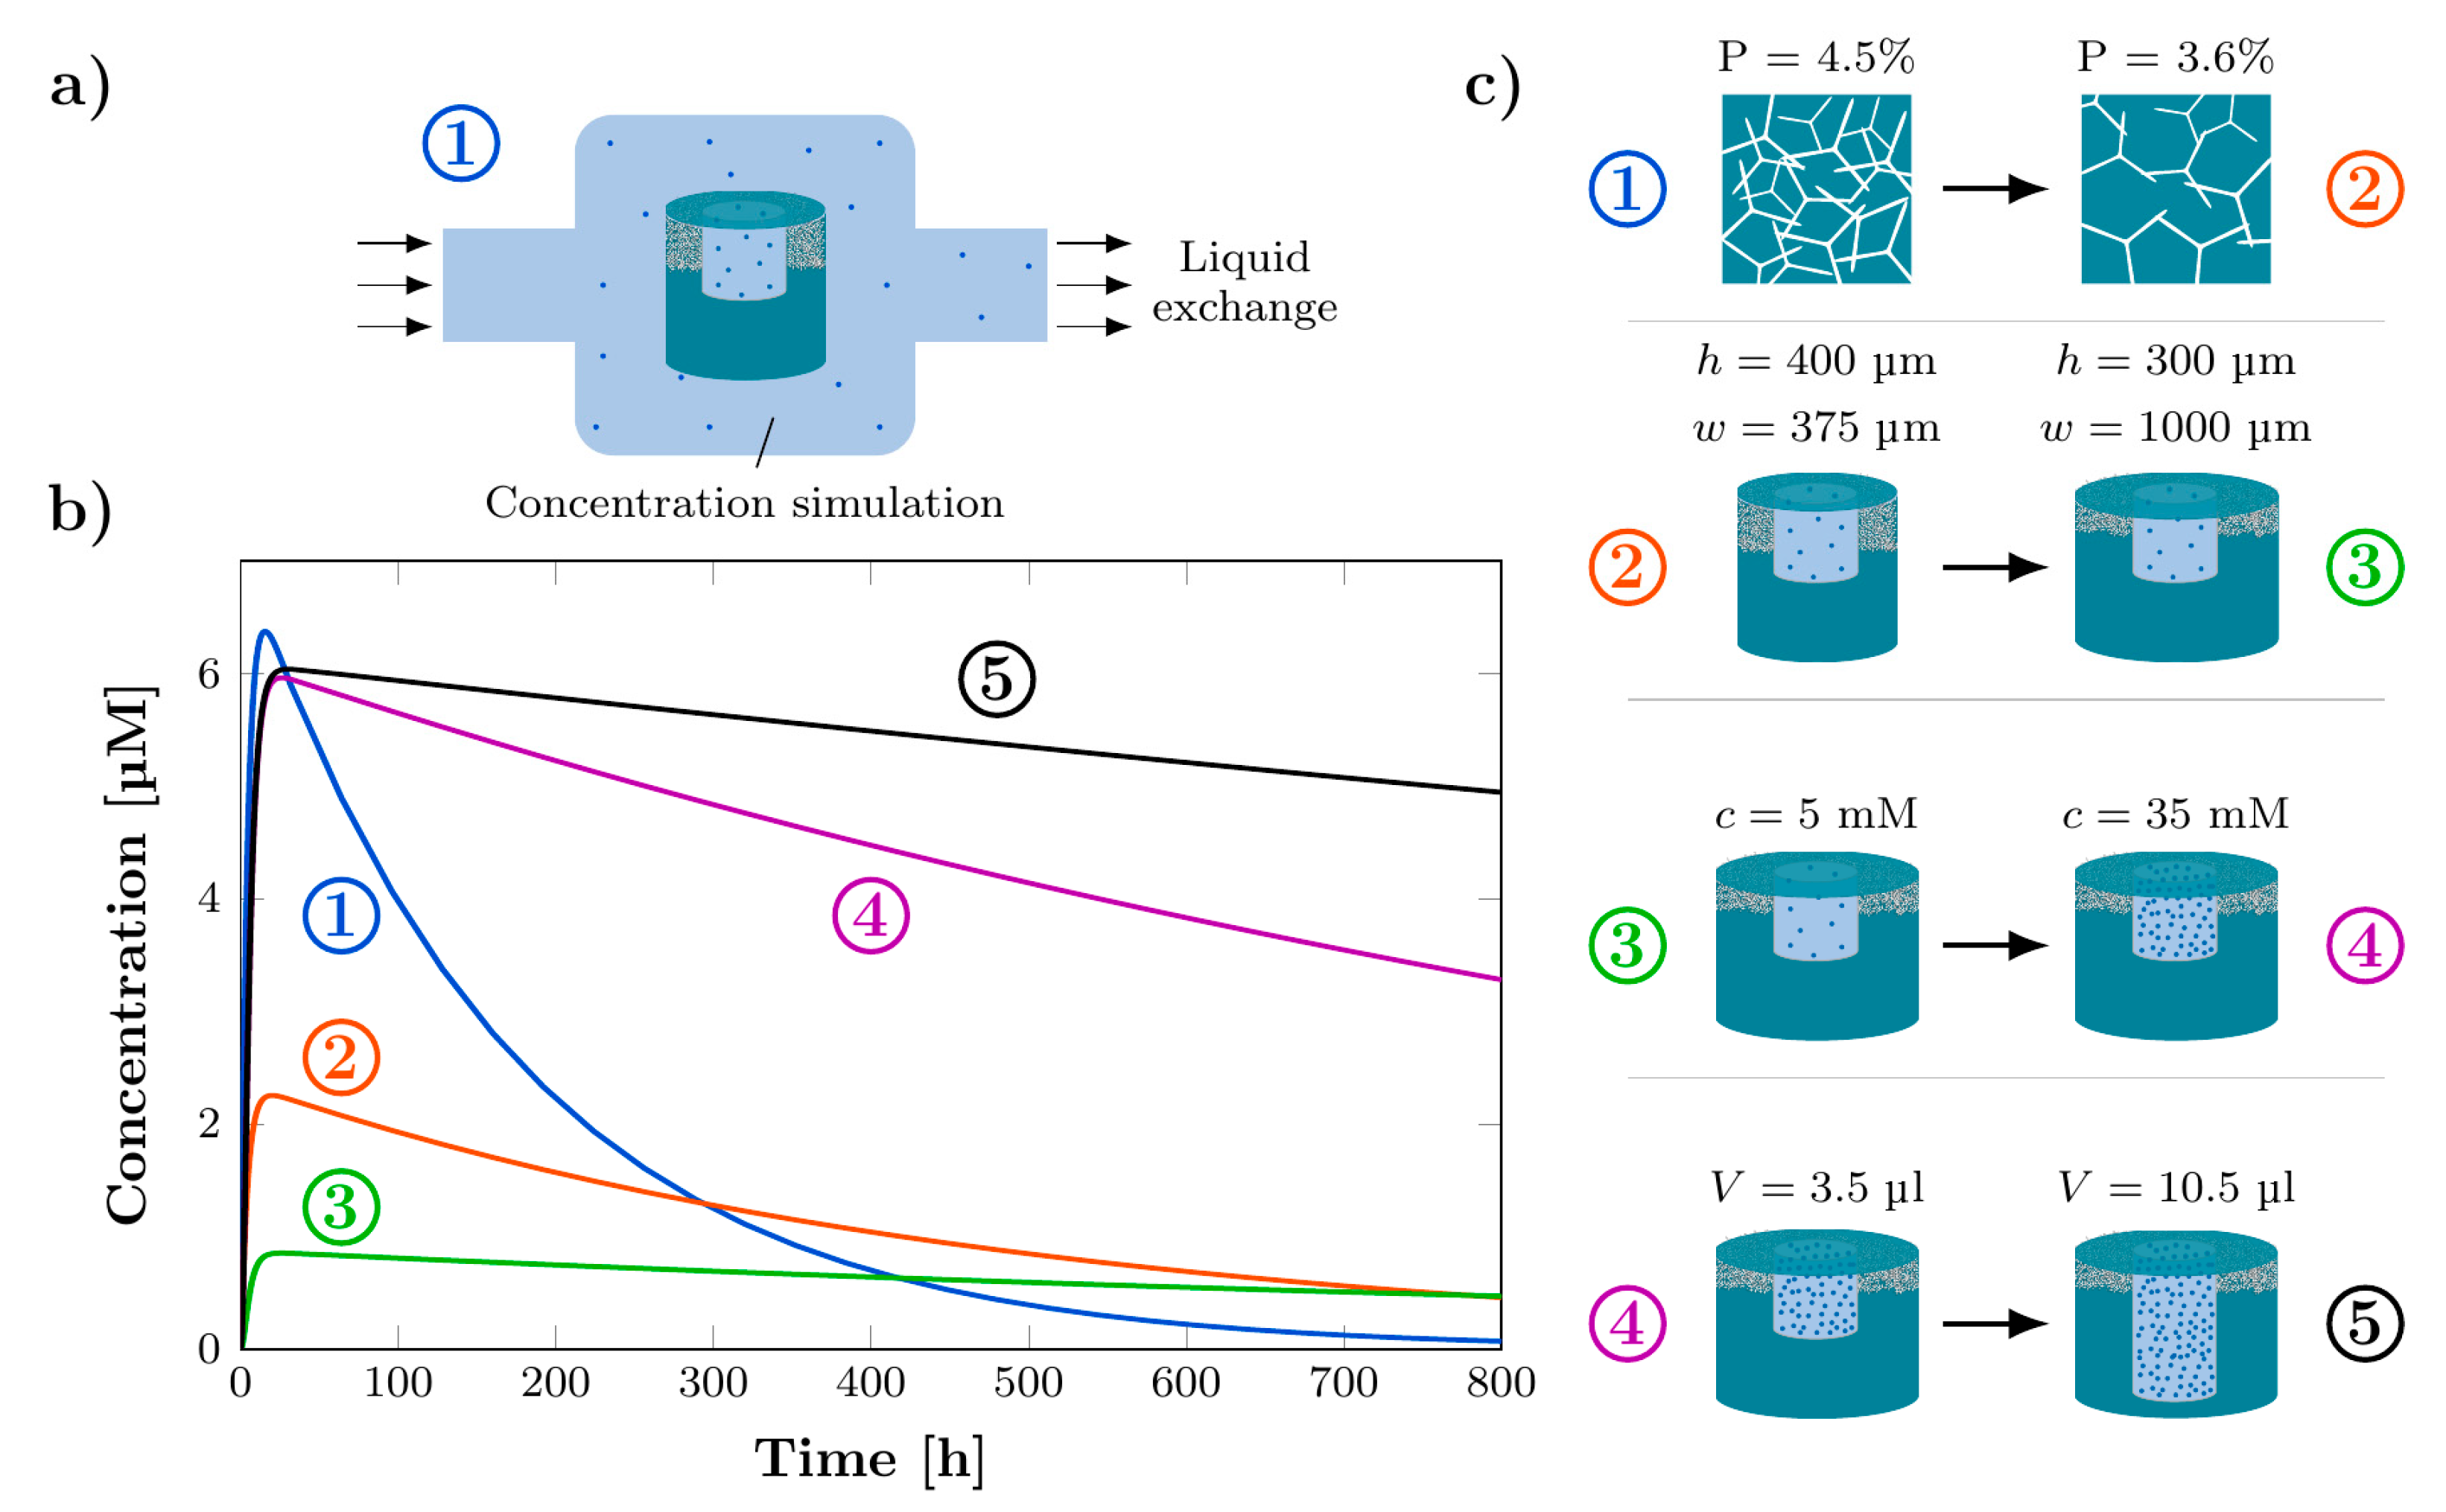
3.3. Influence of Parameters on Release Kinetics
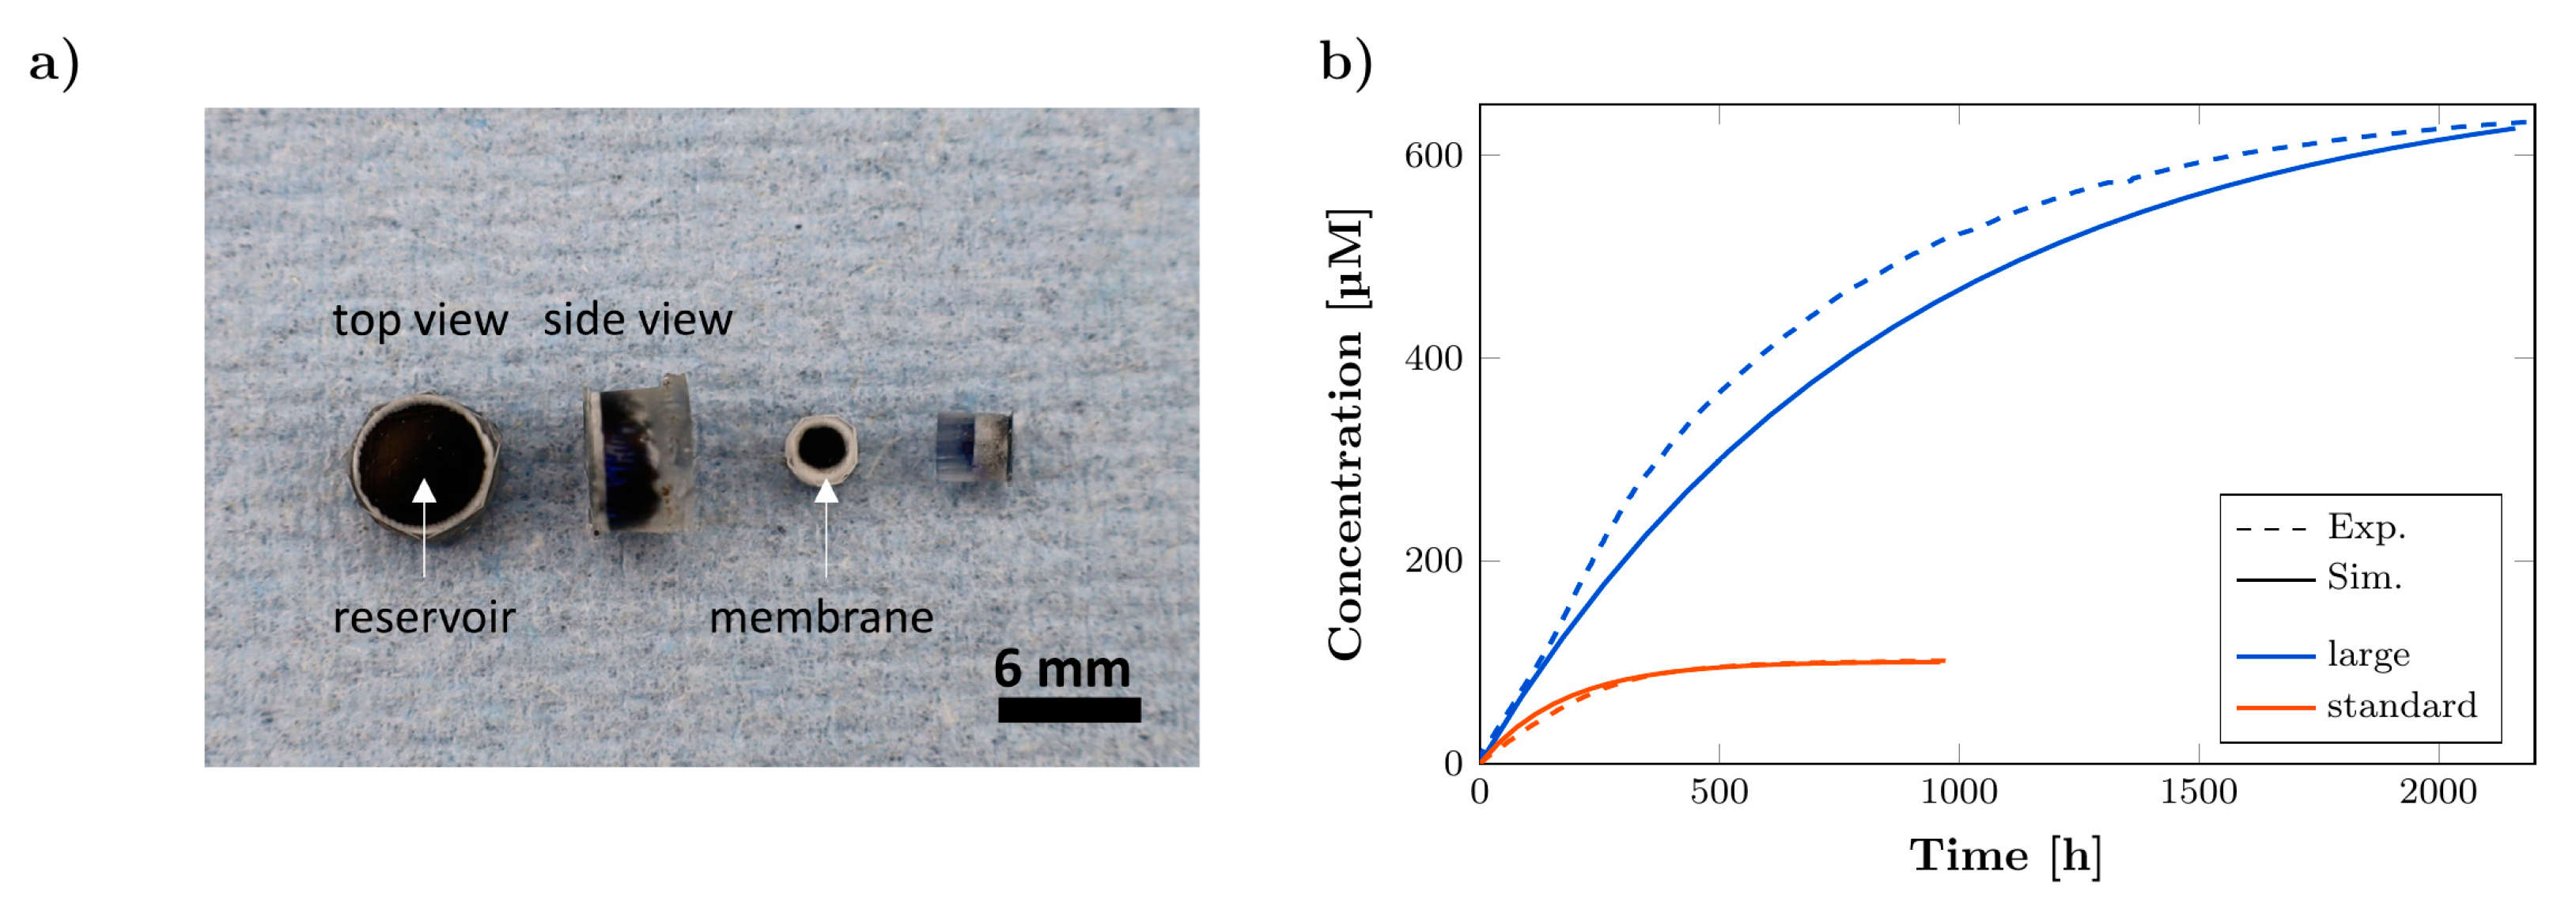
3.4. Long-Term Release Kinetics
3.5. Computational Simulation of Concentration Profiles for Exemplary In Vivo Conditions
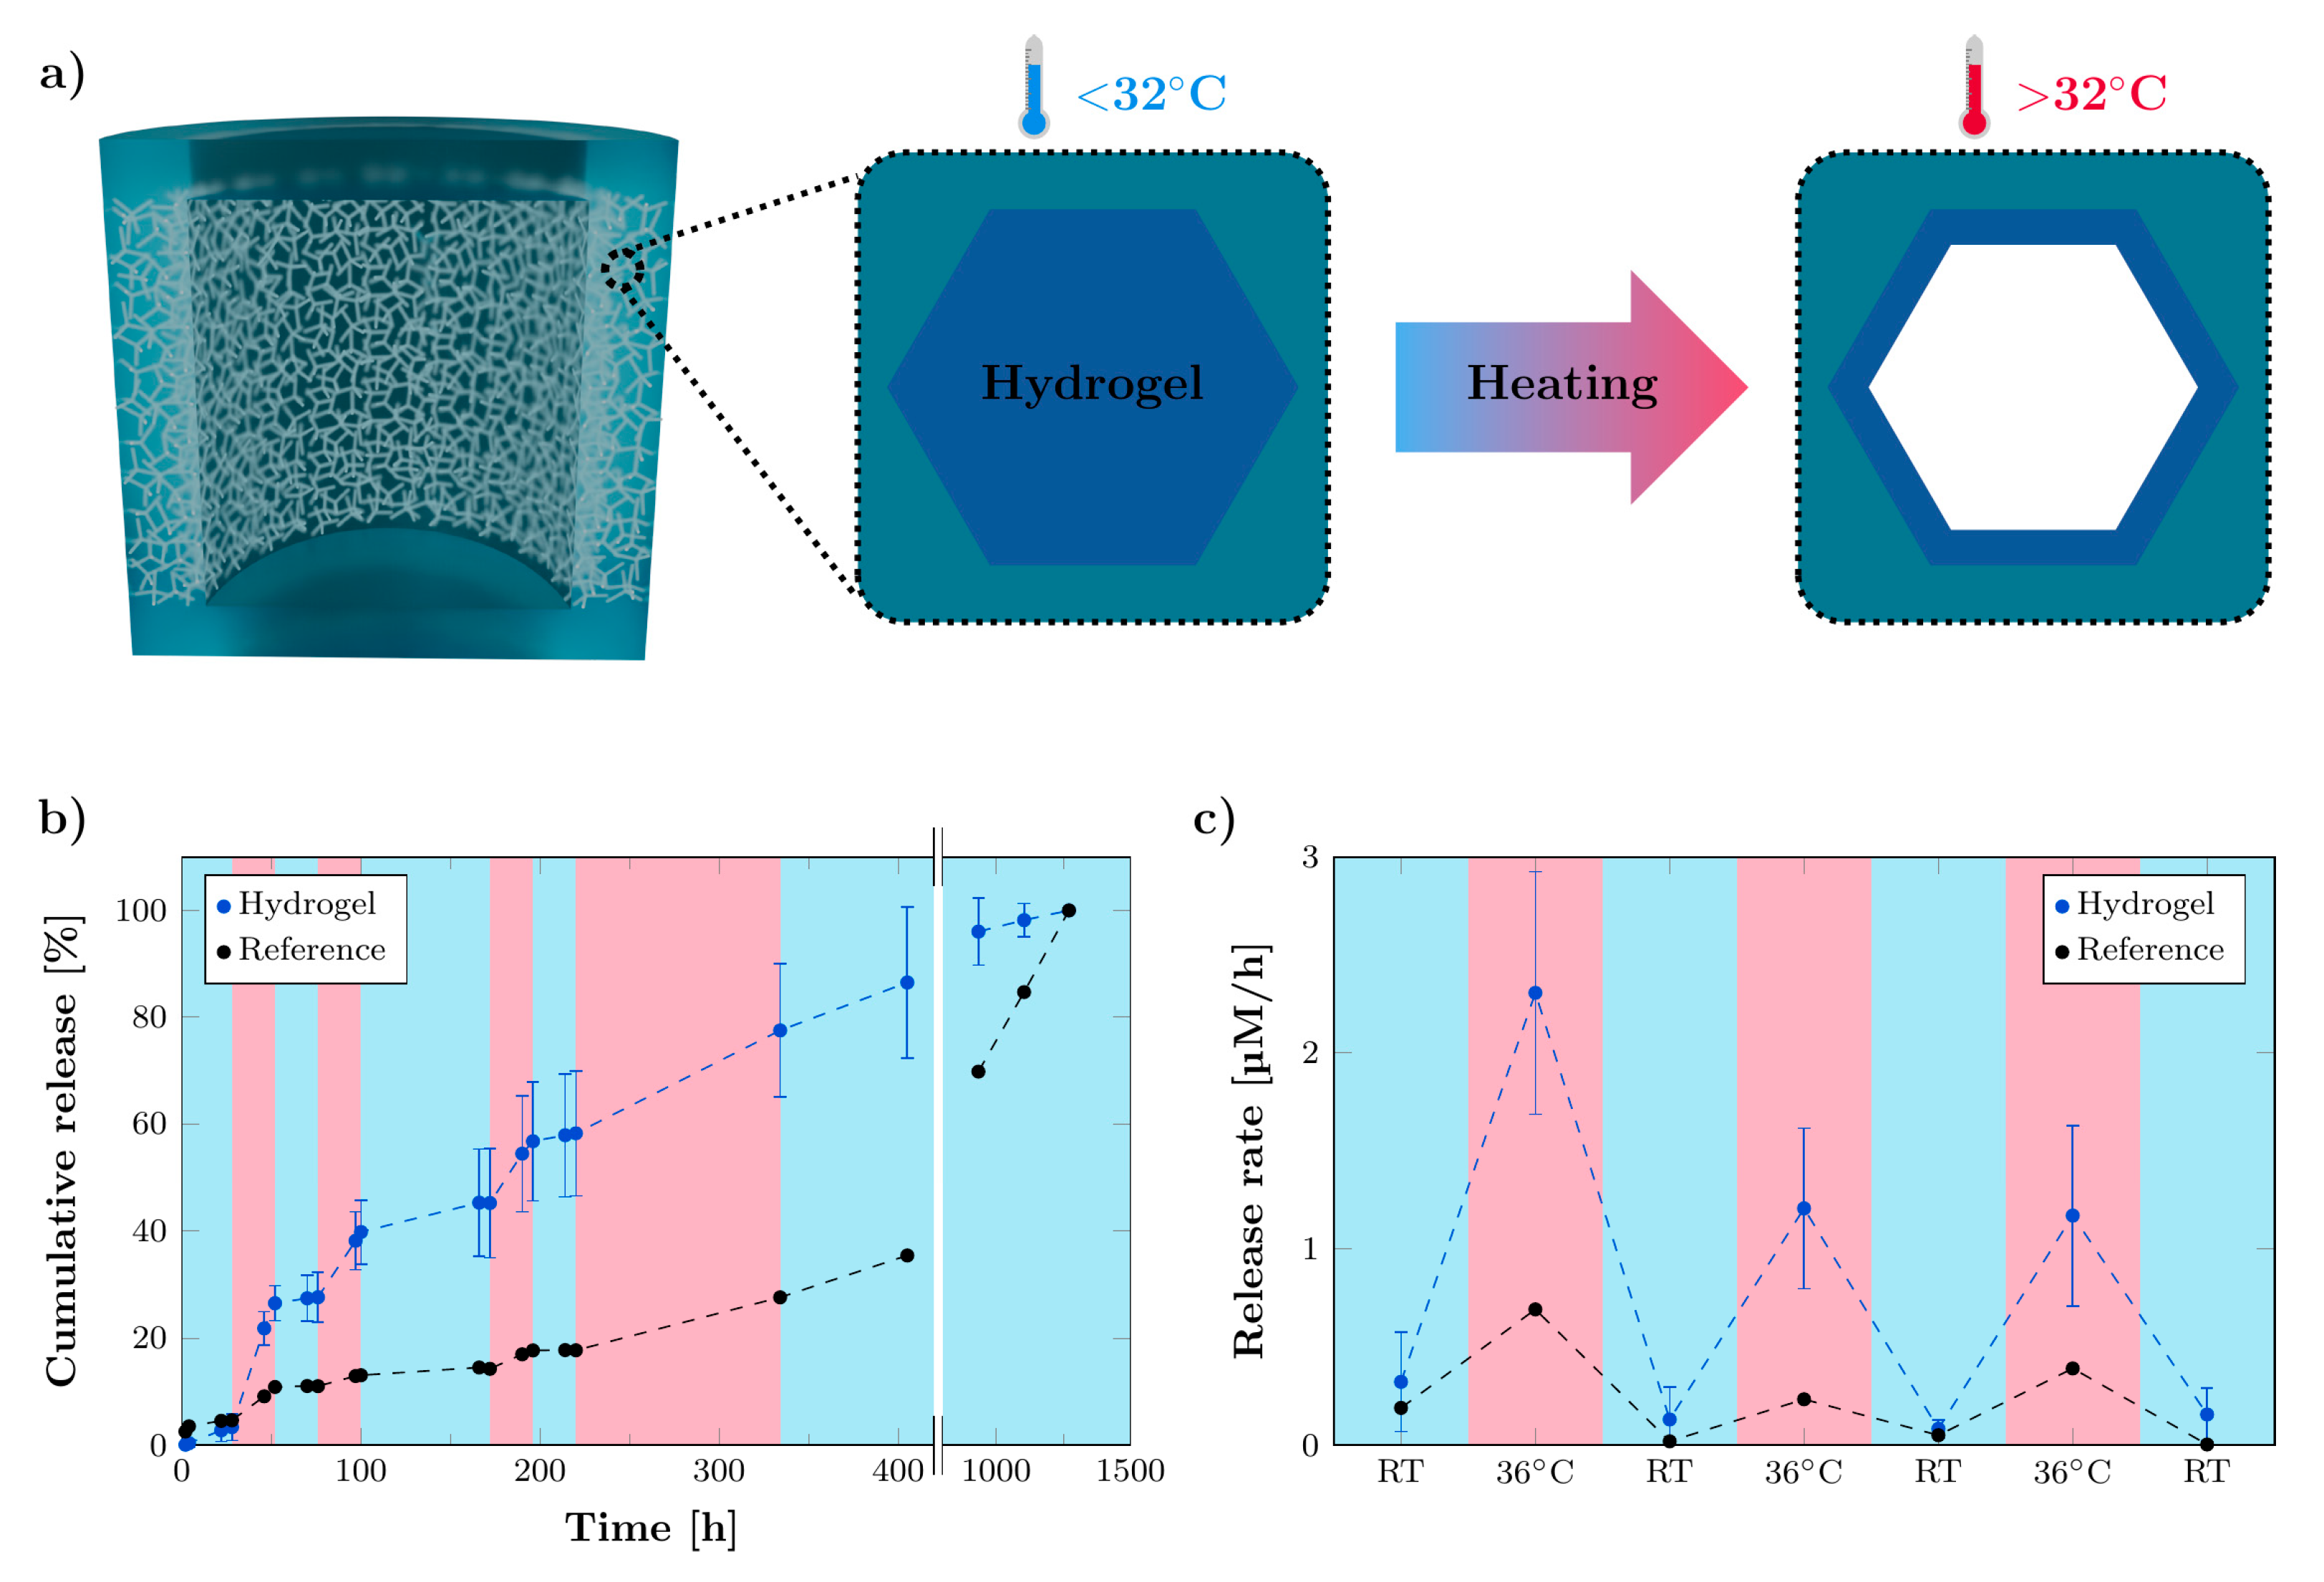
3.6. Functionalization of Microchannels by Thermo-Responsive Hydrogel for Stimuli-Responsive System
4. Conclusions
Supplementary Materials
Author Contributions
Funding
Institutional Review Board Statement
Informed Consent Statement
Data Availability Statement
Acknowledgments
Conflicts of Interest
References
- De Souza, R.; Zahedi, P.; Allen, C.J.; Piquette-Miller, M. Polymeric drug delivery systems for localized cancer chemotherapy. Drug Deliv. 2010, 17, 365–375. [Google Scholar] [CrossRef] [PubMed]
- Pena, E.S.; Graham-Gurysh, E.G.; Bachelder, E.M.; Ainslie, K.M. Design of biopolymer-based interstitial therapies for the treatment of glioblastoma. Int. J. Mol. Sci. 2021, 22, 13160. [Google Scholar] [CrossRef]
- Wait, S.D.; Prabhu, R.S.; Burri, S.H.; Atkins, T.G.; Asher, A.L. Polymeric drug delivery for the treatment of glioblastoma. Neuro Oncol. 2015, 17, ii9–ii23. [Google Scholar] [CrossRef] [Green Version]
- Guerin, C.; Olivi, A.; Weingart, J.D.; Lawson, H.C.; Brem, H. Recent advances in brain tumor therapy: Local intracerebral drug delivery by polymers. Investig. New Drugs 2004, 22, 27–37. [Google Scholar] [CrossRef]
- Brem, H.; Mahaley, M.S.; Vick, N.A.; Black, K.L.; Schold, S.C.; Burger, P.C.; Friedman, A.H.; Ciric, I.S.; Eller, T.W.; Cozzens, J.W. Interstitial chemotherapy with drug polymer implants for the treatment of recurrent gliomas. J. Neurosurg. 1991, 74, 441–446. [Google Scholar] [CrossRef]
- Li, J.; Zhao, J.; Tan, T.; Liu, M.; Zeng, Z.; Zeng, Y.; Zhang, L.; Fu, C.; Chen, D.; Xie, T. Nanoparticle drug delivery system for glioma and its efficacy improvement strategies: A Comprehensive Review. Int. J. Nanomed. 2020, 15, 2563–2582. [Google Scholar] [CrossRef] [PubMed] [Green Version]
- Tseng, Y.-Y.; Chen, T.-Y.; Liu, S.-J. Role of polymeric local drug delivery in multimodal treatment of malignant glioma: A Review. Int. J. Nanomed. 2021, 16, 4597–4614. [Google Scholar] [CrossRef]
- Bastiancich, C.; Malfanti, A.; Préat, V.; Rahman, R. Rationally designed drug delivery systems for the local treatment of resected glioblastoma. Adv. Drug Deliv. Rev. 2021, 177, 113951. [Google Scholar] [CrossRef] [PubMed]
- Jain, D.; Bajaj, A.; Athawale, R.; Shrikhande, S.; Goel, P.N.; Nikam, Y.; Gude, R.; Patil, S.; Prashant Raut, P. Surface-coated PLA nanoparticles loaded with temozolomide for improved brain deposition and potential treatment of gliomas: Development, characterization and in vivo studies. Drug Deliv. 2016, 23, 999–1016. [Google Scholar] [CrossRef] [PubMed]
- González-Gómez, P.; Crecente-Campo, J.; Zahonero, C.; de La Fuente, M.; Hernández-Laín, A.; Mira, H.; Sánchez-Gómez, P.; Garcia-Fuentes, M. Controlled release microspheres loaded with BMP7 suppress primary tumors from human glioblastoma. Oncotarget 2015, 6, 10950–10963. [Google Scholar] [CrossRef] [PubMed] [Green Version]
- Menei, P.; Jadaud, E.; Faisant, N.; Boisdron-Celle, M.; Michalak, S.; Fournier, D.; Delhaye, M.; Benoit, J.-P. Stereotaxic implantation of 5-fluorouracil-releasing microspheres in malignant glioma. Cancer 2004, 100, 405–410. [Google Scholar] [CrossRef]
- Bhaskaran, M.; Devegowda, V.G.; Gupta, V.K.; Shivachar, A.; Bhosale, R.R.; Arunachalam, M.; Vaishnavi, T. Current perspectives on therapies, including drug delivery systems, for managing glioblastoma multiforme. ACS Chem. Neurosci. 2020, 11, 2962–2977. [Google Scholar] [CrossRef] [PubMed]
- Norouzi, M.; Abdali, Z.; Liu, S.; Miller, D.W. Salinomycin-loaded nanofibers for glioblastoma therapy. Sci. Rep. 2018, 8, 9377. [Google Scholar] [CrossRef] [Green Version]
- Fonseca, L.M.; Bona, N.P.; Crizel, R.L.; Pedra, N.S.; Stefanello, F.M.; Lim, L.-T.; Carreño, N.L.V.; Dias, A.R.G.; Zavareze, E.D.R. Electrospun starch nanofibers as a delivery carrier for carvacrol as anti-glioma agent. Starch Stärke 2022, 74, 2100115. [Google Scholar] [CrossRef]
- Han, D.; Serra, R.; Gorelick, N.; Fatima, U.; Eberhart, C.G.; Brem, H.; Tyler, B.; Steckl, A.J. Multi-layered core-sheath fiber membranes for controlled drug release in the local treatment of brain tumor. Sci. Rep. 2019, 9, 17936. [Google Scholar] [CrossRef] [PubMed]
- Di Mascolo, D.; Palange, A.L.; Primavera, R.; Macchi, F.; Catelani, T.; Piccardi, F.; Spanò, R.; Ferreira, M.; Marotta, R.; Armirotti, A.; et al. Conformable hierarchically engineered polymeric micromeshes enabling combinatorial therapies in brain tumours. Nat. Nanotechnol. 2021, 16, 820–829. [Google Scholar] [CrossRef] [PubMed]
- McGirt, M.J.; Than, K.D.; Weingart, J.D.; Chaichana, K.L.; Attenello, F.J.; Olivi, A.; Laterra, J.; Kleinberg, L.R.; Grossman, S.A.; Brem, H.; et al. Gliadel (BCNU) wafer plus concomitant temozolomide therapy after primary resection of glioblastoma multiforme. J. Neurosurg. 2009, 110, 583–588. [Google Scholar] [CrossRef] [PubMed]
- Westphal, M.; Hilt, D.C.; Bortey, E.; Delavault, P.; Olivares, R.; Warnke, P.C.; Whittle, I.R.; Jääskeläinen, J.; Ram, Z. A phase 3 trial of local chemotherapy with biodegradable carmustine (BCNU) wafers (Gliadel wafers) in patients with primary malignant glioma. Neuro Oncol. 2003, 5, 79–88. [Google Scholar] [CrossRef] [PubMed]
- Kang, J.H.; Turabee, M.H.; Lee, D.S.; Kwon, Y.J.; Ko, Y.T. Temperature and pH-responsive in situ hydrogels of gelatin derivatives to prevent the reoccurrence of brain tumor. Biomed. Pharmacother. 2021, 143, 112144. [Google Scholar] [CrossRef] [PubMed]
- Bastiancich, C.; Danhier, P.; Préat, V.; Danhier, F. Anticancer drug-loaded hydrogels as drug delivery systems for the local treatment of glioblastoma. J. Control. Release 2016, 243, 29–42. [Google Scholar] [CrossRef]
- Wang, M.; Hou, J.; Yu, D.-G.; Li, S.; Zhu, J.; Chen, Z. Electrospun tri-layer nanodepots for sustained release of acyclovir. J. Alloys Compd. 2020, 846, 156471. [Google Scholar] [CrossRef]
- Brudno, Y.; Pezone, M.J.; Snyder, T.K.; Uzun, O.; Moody, C.T.; Aizenberg, M.; Mooney, D.J. Replenishable drug depot to combat post-resection cancer recurrence. Biomaterials 2018, 178, 373–382. [Google Scholar] [CrossRef] [PubMed]
- Yu, D.-G.; Wang, M.; Ge, R. Strategies for sustained drug release from electrospun multi-layer nanostructures. Wiley Interdiscip. Rev. Nanomed. Nanobiotechnol. 2021, e1772. [Google Scholar] [CrossRef] [PubMed]
- Graham-Gurysh, E.G.; Moore, K.M.; Schorzman, A.N.; Lee, T.; Zamboni, W.C.; Hingtgen, S.D.; Bachelder, E.M.; Ainslie, K.M. Tumor responsive and tunable polymeric platform for optimized delivery of paclitaxel to treat glioblastoma. ACS Appl. Mater. Interfaces 2020, 12, 19345–19356. [Google Scholar] [CrossRef]
- Lee, J.; Cho, H.R.; Cha, G.D.; Seo, H.; Lee, S.; Park, C.-K.; Kim, J.W.; Qiao, S.; Wang, L.; Kang, D.; et al. Flexible, sticky, and biodegradable wireless device for drug delivery to brain tumors. Nat. Commun. 2019, 10, 5205. [Google Scholar] [CrossRef]
- Wang, Z.; Yang, Z.; Jiang, J.; Shi, Z.; Mao, Y.; Qin, N.; Tao, T.H. Silk microneedle patch capable of on-demand multidrug delivery to the brain for glioblastoma treatment. Adv. Mater. 2022, 34, e2106606. [Google Scholar] [CrossRef] [PubMed]
- Fenton, O.S.; Olafson, K.N.; Pillai, P.S.; Mitchell, M.J.; Langer, R. Advances in biomaterials for drug delivery. Adv. Mater. 2018, 30, e1705328. [Google Scholar] [CrossRef]
- Sweetman, B.; Linninger, A.A. Cerebrospinal fluid flow dynamics in the central nervous system. Ann. Biomed. Eng. 2011, 39, 484–496. [Google Scholar] [CrossRef]
- Straehla, J.P.; Warren, K.E. Pharmacokinetic principles and their application to central nervous system tumors. Pharmaceutics 2020, 12, 948. [Google Scholar] [CrossRef]
- Stewart, S.A.; Domínguez-Robles, J.; Donnelly, R.F.; Larrañeta, E. Implantable polymeric drug delivery devices: Classification, manufacture, materials, and clinical applications. Polymers 2018, 10, 1379. [Google Scholar] [CrossRef] [Green Version]
- Floyd, J.A.; Galperin, A.; Ratner, B.D. Drug encapsulated polymeric microspheres for intracranial tumor therapy: A review of the literature. Adv. Drug Deliv. Rev. 2015, 91, 23–37. [Google Scholar] [CrossRef] [PubMed] [Green Version]
- Chen, S.; Boda, S.K.; Batra, S.K.; Li, X.; Xie, J. Emerging roles of electrospun nanofibers in cancer research. Adv. Healthc. Mater. 2018, 7, e1701024. [Google Scholar] [CrossRef] [PubMed]
- Hosseinzadeh, R.; Mirani, B.; Pagan, E.; Mirzaaghaei, S.; Nasimian, A.; Kawalec, P.; Silva Rosa, S.C.; Hamdi, D.; Fernandez, N.P.; Toyota, B.D.; et al. A drug-eluting 3D-printed mesh (GlioMesh) for management of glioblastoma. Adv. Ther. 2019, 2, 1900113. [Google Scholar] [CrossRef]
- Ramachandran, R.; Junnuthula, V.R.; Gowd, G.S.; Ashokan, A.; Thomas, J.; Peethambaran, R.; Thomas, A.; Unni, A.K.K.; Panikar, D.; Nair, S.V.; et al. Theranostic 3-Dimensional nano brain-implant for prolonged and localized treatment of recurrent glioma. Sci. Rep. 2017, 7, 43271. [Google Scholar] [CrossRef] [PubMed] [Green Version]
- Rasch, F.; Schmitt, C.; Saure, L.M.; Meyer, R.; Adamski, V.; Dengiz, D.; Scherließ, R.; Lucius, R.; Synowitz, M.; Mishra, Y.K.; et al. Macroscopic silicone microchannel matrix for tailored drug release and localized glioblastoma therapy. ACS Biomater. Sci. Eng. 2020, 6, 3388–3397. [Google Scholar] [CrossRef] [PubMed]
- Mishra, Y.K.; Kaps, S.; Schuchardt, A.; Paulowicz, I.; Jin, X.; Gedamu, D.; Freitag, S.; Claus, M.; Wille, S.; Kovalev, A.; et al. Fabrication of macroscopically flexible and highly porous 3D semiconductor networks from interpenetrating nanostructures by a simple flame transport approach. Part. Part. Syst. Charact. 2013, 30, 775–783. [Google Scholar] [CrossRef]
- Mishra, Y.K.; Modi, G.; Cretu, V.; Postica, V.; Lupan, O.; Reimer, T.; Paulowicz, I.; Hrkac, V.; Benecke, W.; Kienle, L.; et al. Direct growth of freestanding ZnO tetrapod networks for multifunctional applications in photocatalysis, UV photodetection, and gas sensing. ACS Appl. Mater. Interfaces 2015, 7, 14303–14316. [Google Scholar] [CrossRef] [PubMed]
- Moosmann, J.; Ershov, A.; Weinhardt, V.; Baumbach, T.; Prasad, M.S.; LaBonne, C.; Xiao, X.; Kashef, J.; Hofmann, R. Time-lapse X-ray phase-contrast microtomography for in vivo imaging and analysis of morphogenesis. Nat. Protoc. 2014, 9, 294–304. [Google Scholar] [CrossRef] [PubMed]
- Van Aarle, W.; Palenstijn, W.J.; de Beenhouwer, J.; Altantzis, T.; Bals, S.; Batenburg, K.J.; Sijbers, J. The ASTRA Toolbox: A platform for advanced algorithm development in electron tomography. Ultramicroscopy 2015, 157, 35–47. [Google Scholar] [CrossRef] [PubMed] [Green Version]
- Van Aarle, W.; Palenstijn, W.J.; Cant, J.; Janssens, E.; Bleichrodt, F.; Dabravolski, A.; de Beenhouwer, J.; Joost Batenburg, K.; Sijbers, J. Fast and flexible X-ray tomography using the ASTRA toolbox. Opt. Express 2016, 24, 25129–25147. [Google Scholar] [CrossRef] [PubMed]
- Bruns, S.; Stipp, S.L.S.; Sørensen, H.O. looking for the signal: A guide to iterative noise and artefact removal in X-ray tomographic reconstructions of porous geomaterials. Adv. Water Resour. 2017, 105, 96–107. [Google Scholar] [CrossRef]
- Doube, M.; Kłosowski, M.M.; Arganda-Carreras, I.; Cordelières, F.P.; Dougherty, R.P.; Jackson, J.S.; Schmid, B.; Hutchinson, J.R.; Shefelbine, S.J. BoneJ: Free and extensible bone image analysis in ImageJ. Bone 2010, 47, 1076–1079. [Google Scholar] [CrossRef] [Green Version]
- Siepmann, J.; Siepmann, F. Modeling of diffusion controlled drug delivery. J. Control. Release 2012, 161, 351–362. [Google Scholar] [CrossRef] [PubMed]
- Peppas, N.A.; Narasimhan, B. Mathematical models in drug delivery: How modeling has shaped the way we design new drug delivery systems. J. Control. Release 2014, 190, 75–81. [Google Scholar] [CrossRef] [PubMed]
- Selifonov, A.A.; Shapoval, O.G.; Mikerov, A.N.; Tuchin, V.V. Determination of the diffusion coefficient of methylene blue solutions in dentin of a human tooth using reflectance spectroscopy and their antibacterial activity during laser exposure. Opt. Spectrosc. 2019, 126, 758–768. [Google Scholar] [CrossRef]
- Lin, S.H.; Kleinberg, L.R. Carmustine wafers: Localized delivery of chemotherapeutic agents in CNS malignancies. Expert Rev. Anticancer Ther. 2008, 8, 343–359. [Google Scholar] [CrossRef] [PubMed]
- Fisher, J.P.; Adamson, D.C. Current FDA-approved therapies for high-grade malignant gliomas. Biomedicines 2021, 9, 324. [Google Scholar] [CrossRef]
- Zhao, M.; Bozzato, E.; Joudiou, N.; Ghiassinejad, S.; Danhier, F.; Gallez, B.; Préat, V. Codelivery of paclitaxel and temozolomide through a photopolymerizable hydrogel prevents glioblastoma recurrence after surgical resection. J. Control. Release 2019, 309, 72–81. [Google Scholar] [CrossRef] [PubMed]
- Malfanti, A.; Catania, G.; Degros, Q.; Wang, M.; Bausart, M.; Préat, V. Design of bio-responsive hyaluronic acid-doxorubicin conjugates for the local treatment of glioblastoma. Pharmaceutics 2022, 14, 124. [Google Scholar] [CrossRef]
- Mitchell, M.J.; Billingsley, M.M.; Haley, R.M.; Wechsler, M.E.; Peppas, N.A.; Langer, R. Engineering precision nanoparticles for drug delivery. Nat. Rev. Drug Discov. 2021, 20, 101–124. [Google Scholar] [CrossRef]
- Gazaille, C.; Sicot, M.; Saulnier, P.; Eyer, J.; Bastiat, G. Local delivery and glioblastoma: Why not combining sustained release and targeting? Front. Med. Technol. 2021, 3, 791596. [Google Scholar] [CrossRef] [PubMed]
- Nance, E.; Zhang, C.; Shih, T.-Y.; Xu, Q.; Schuster, B.S.; Hanes, J. Brain-penetrating nanoparticles improve paclitaxel efficacy in malignant glioma following local administration. ACS Nano 2014, 8, 10655–10664. [Google Scholar] [CrossRef] [PubMed]
- Podewitz, M.; Wang, Y.; Quoika, P.K.; Loeffler, J.R.; Schauperl, M.; Liedl, K.R. Coil-globule transition thermodynamics of poly(N-isopropylacrylamide). J. Phys. Chem. B 2019, 123, 8838–8847. [Google Scholar] [CrossRef] [PubMed]
- Ilmain, F.; Tanaka, T.; Kokufuta, E. Volume transition in a gel driven by hydrogen bonding. Nature 1991, 349, 400–401. [Google Scholar] [CrossRef]
- Heskins, M.; Guillet, J.E. Solution properties of poly(N-isopropylacrylamide). J. Macromol. Sci. Part A Chem. 1968, 2, 1441–1455. [Google Scholar] [CrossRef]
- Timko, B.P.; Dvir, T.; Kohane, D.S. Remotely triggerable drug delivery systems. Adv. Mater. 2010, 22, 4925–4943. [Google Scholar] [CrossRef] [PubMed]
- Gu, Z.; Zhu, S.; Yan, L.; Zhao, F.; Zhao, Y. Graphene-based smart platforms for combined cancer therapy. Adv. Mater. 2019, 31, e1800662. [Google Scholar] [CrossRef] [PubMed]
- Andrade, F.; Roca-Melendres, M.M.; Durán-Lara, E.F.; Rafael, D.; Schwartz, S. Stimuli-responsive hydrogels for cancer treatment: The role of pH, light, ionic strength and magnetic field. Cancers 2021, 13, 1164. [Google Scholar] [CrossRef] [PubMed]


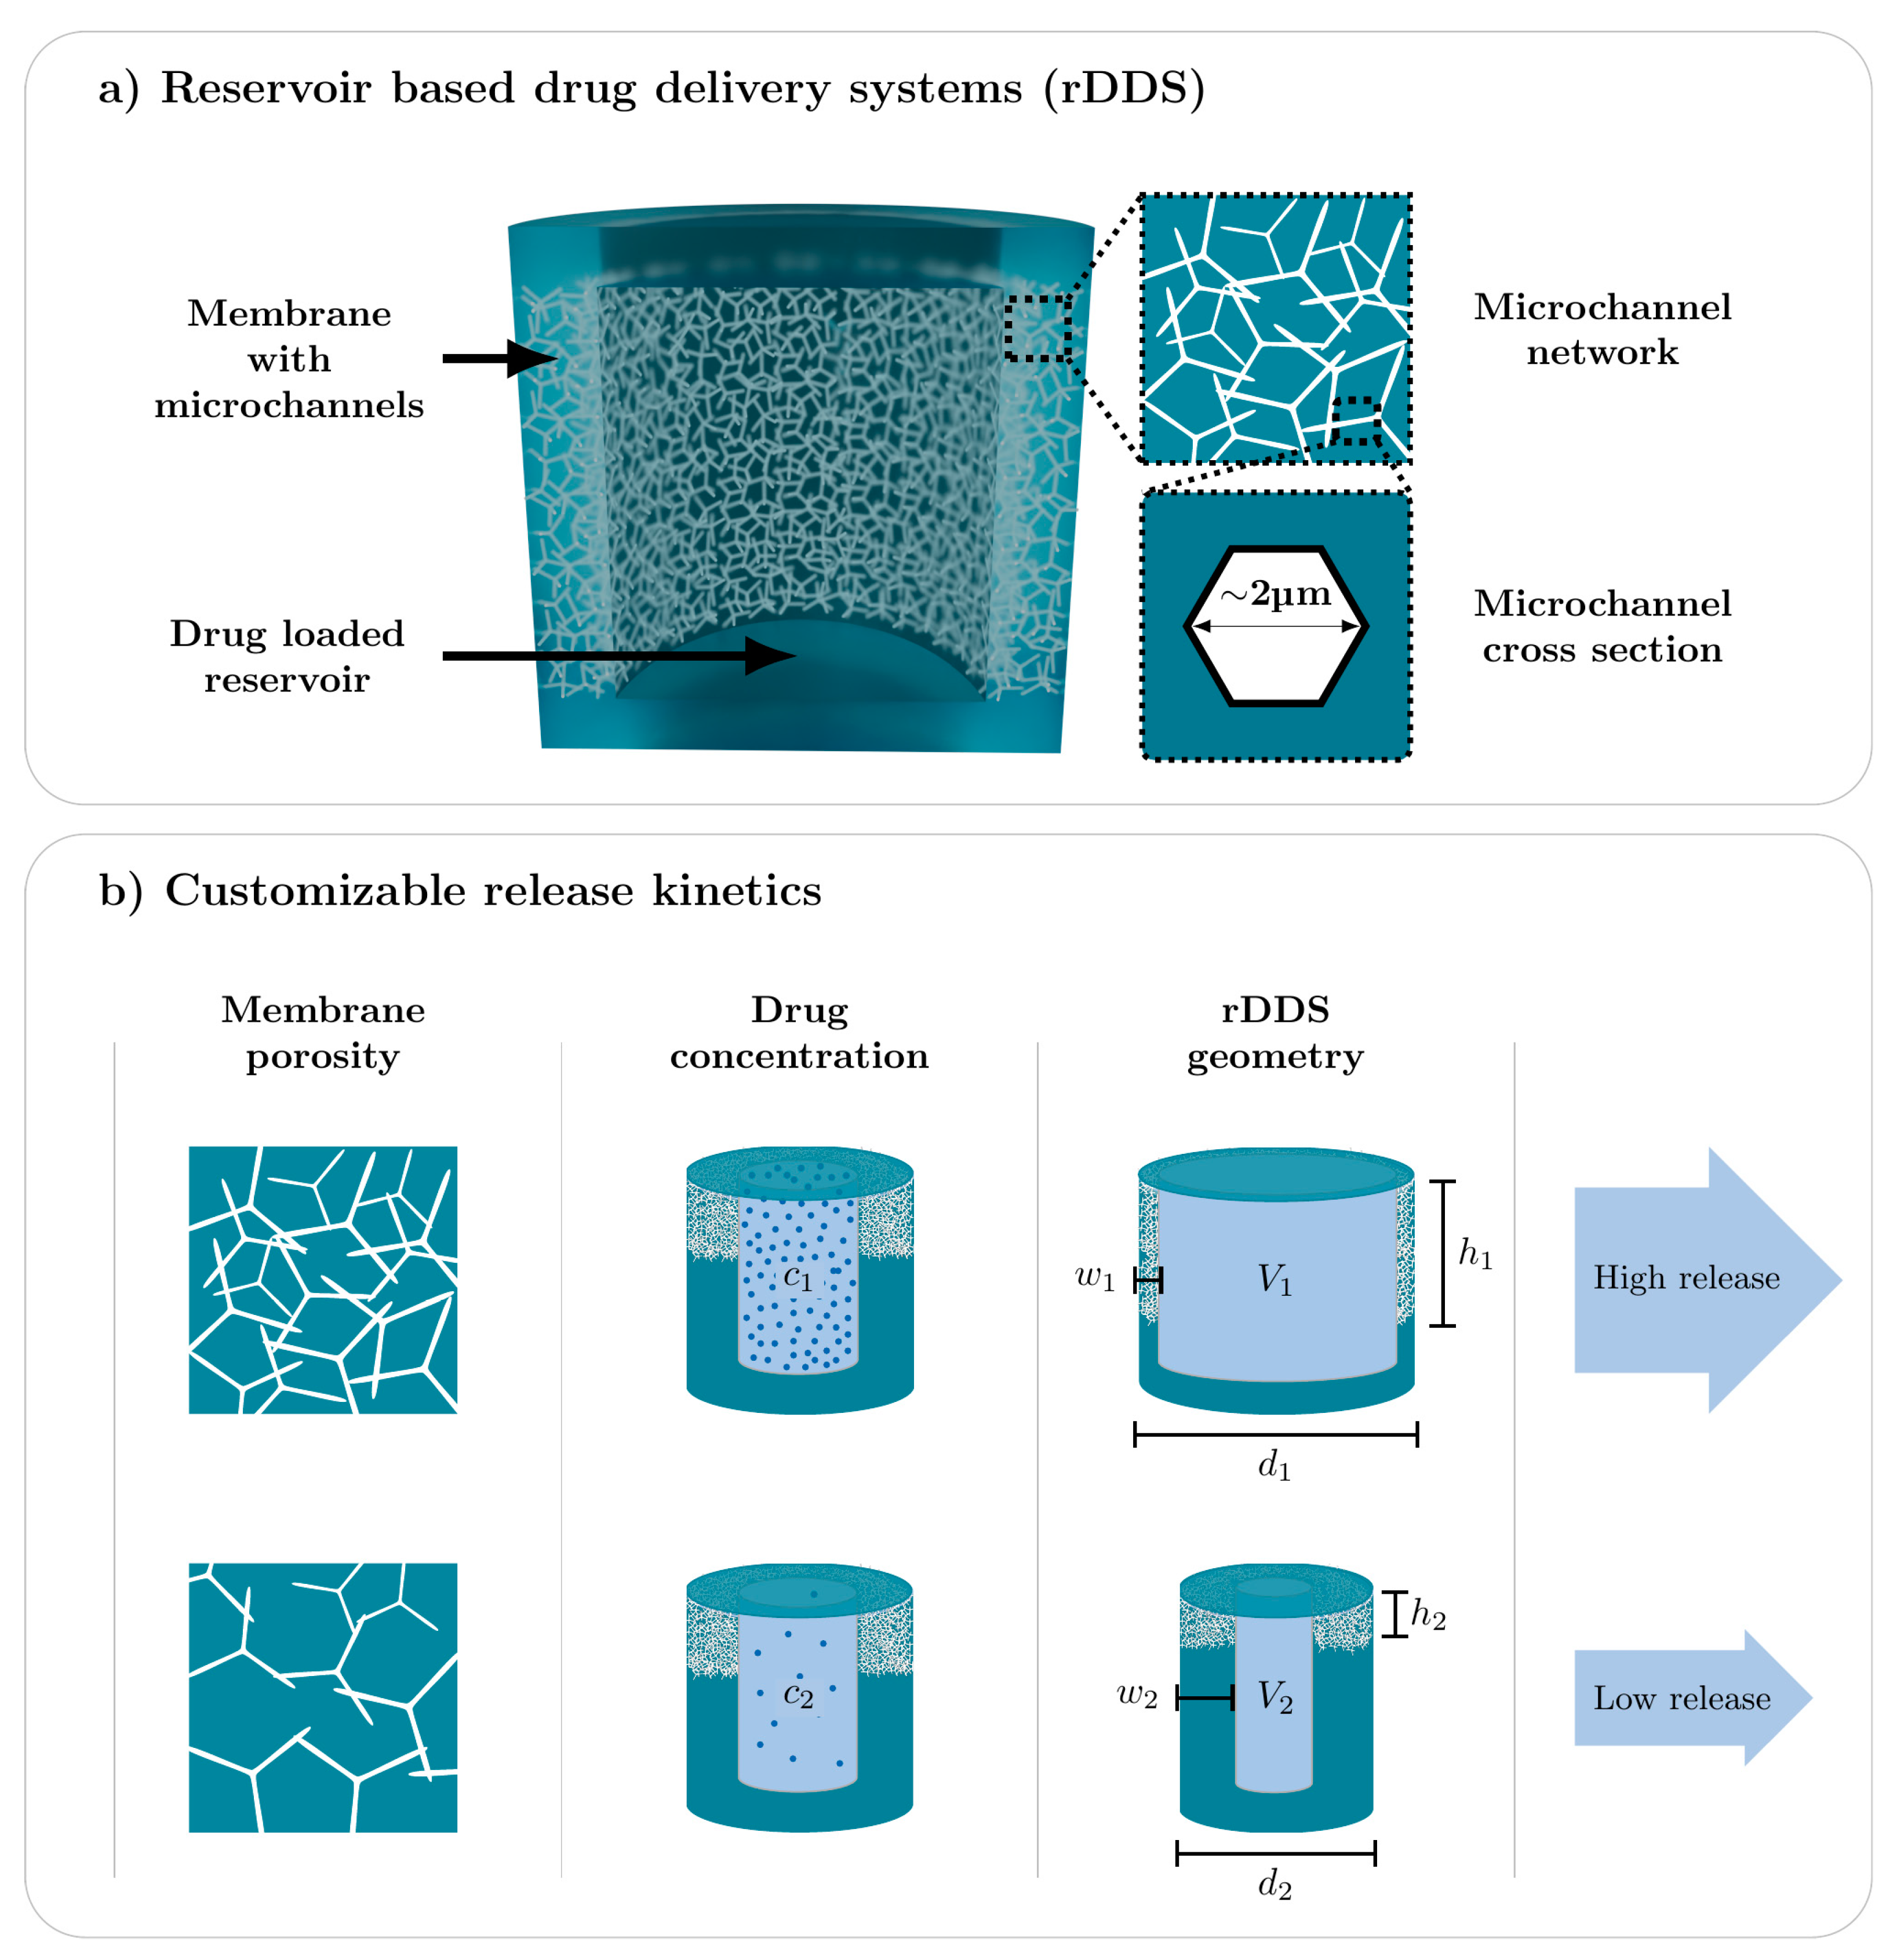
| Parameter | Symbol | Quantity | Schematic |
|---|---|---|---|
| Membrane porosity | P | 4.5% | 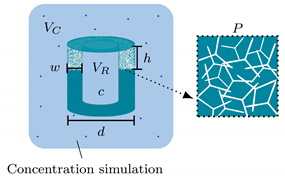 |
| Membrane width | w | 375 μm | |
| Membrane height | h | 400 μm | |
| rDDS diameter | d | 3000 μm | |
| Reservoir volume | VR | 3.5 μL | |
| Initial concentration | c | 100 mM | |
| Cavity volume | Vc | 3500 μL |
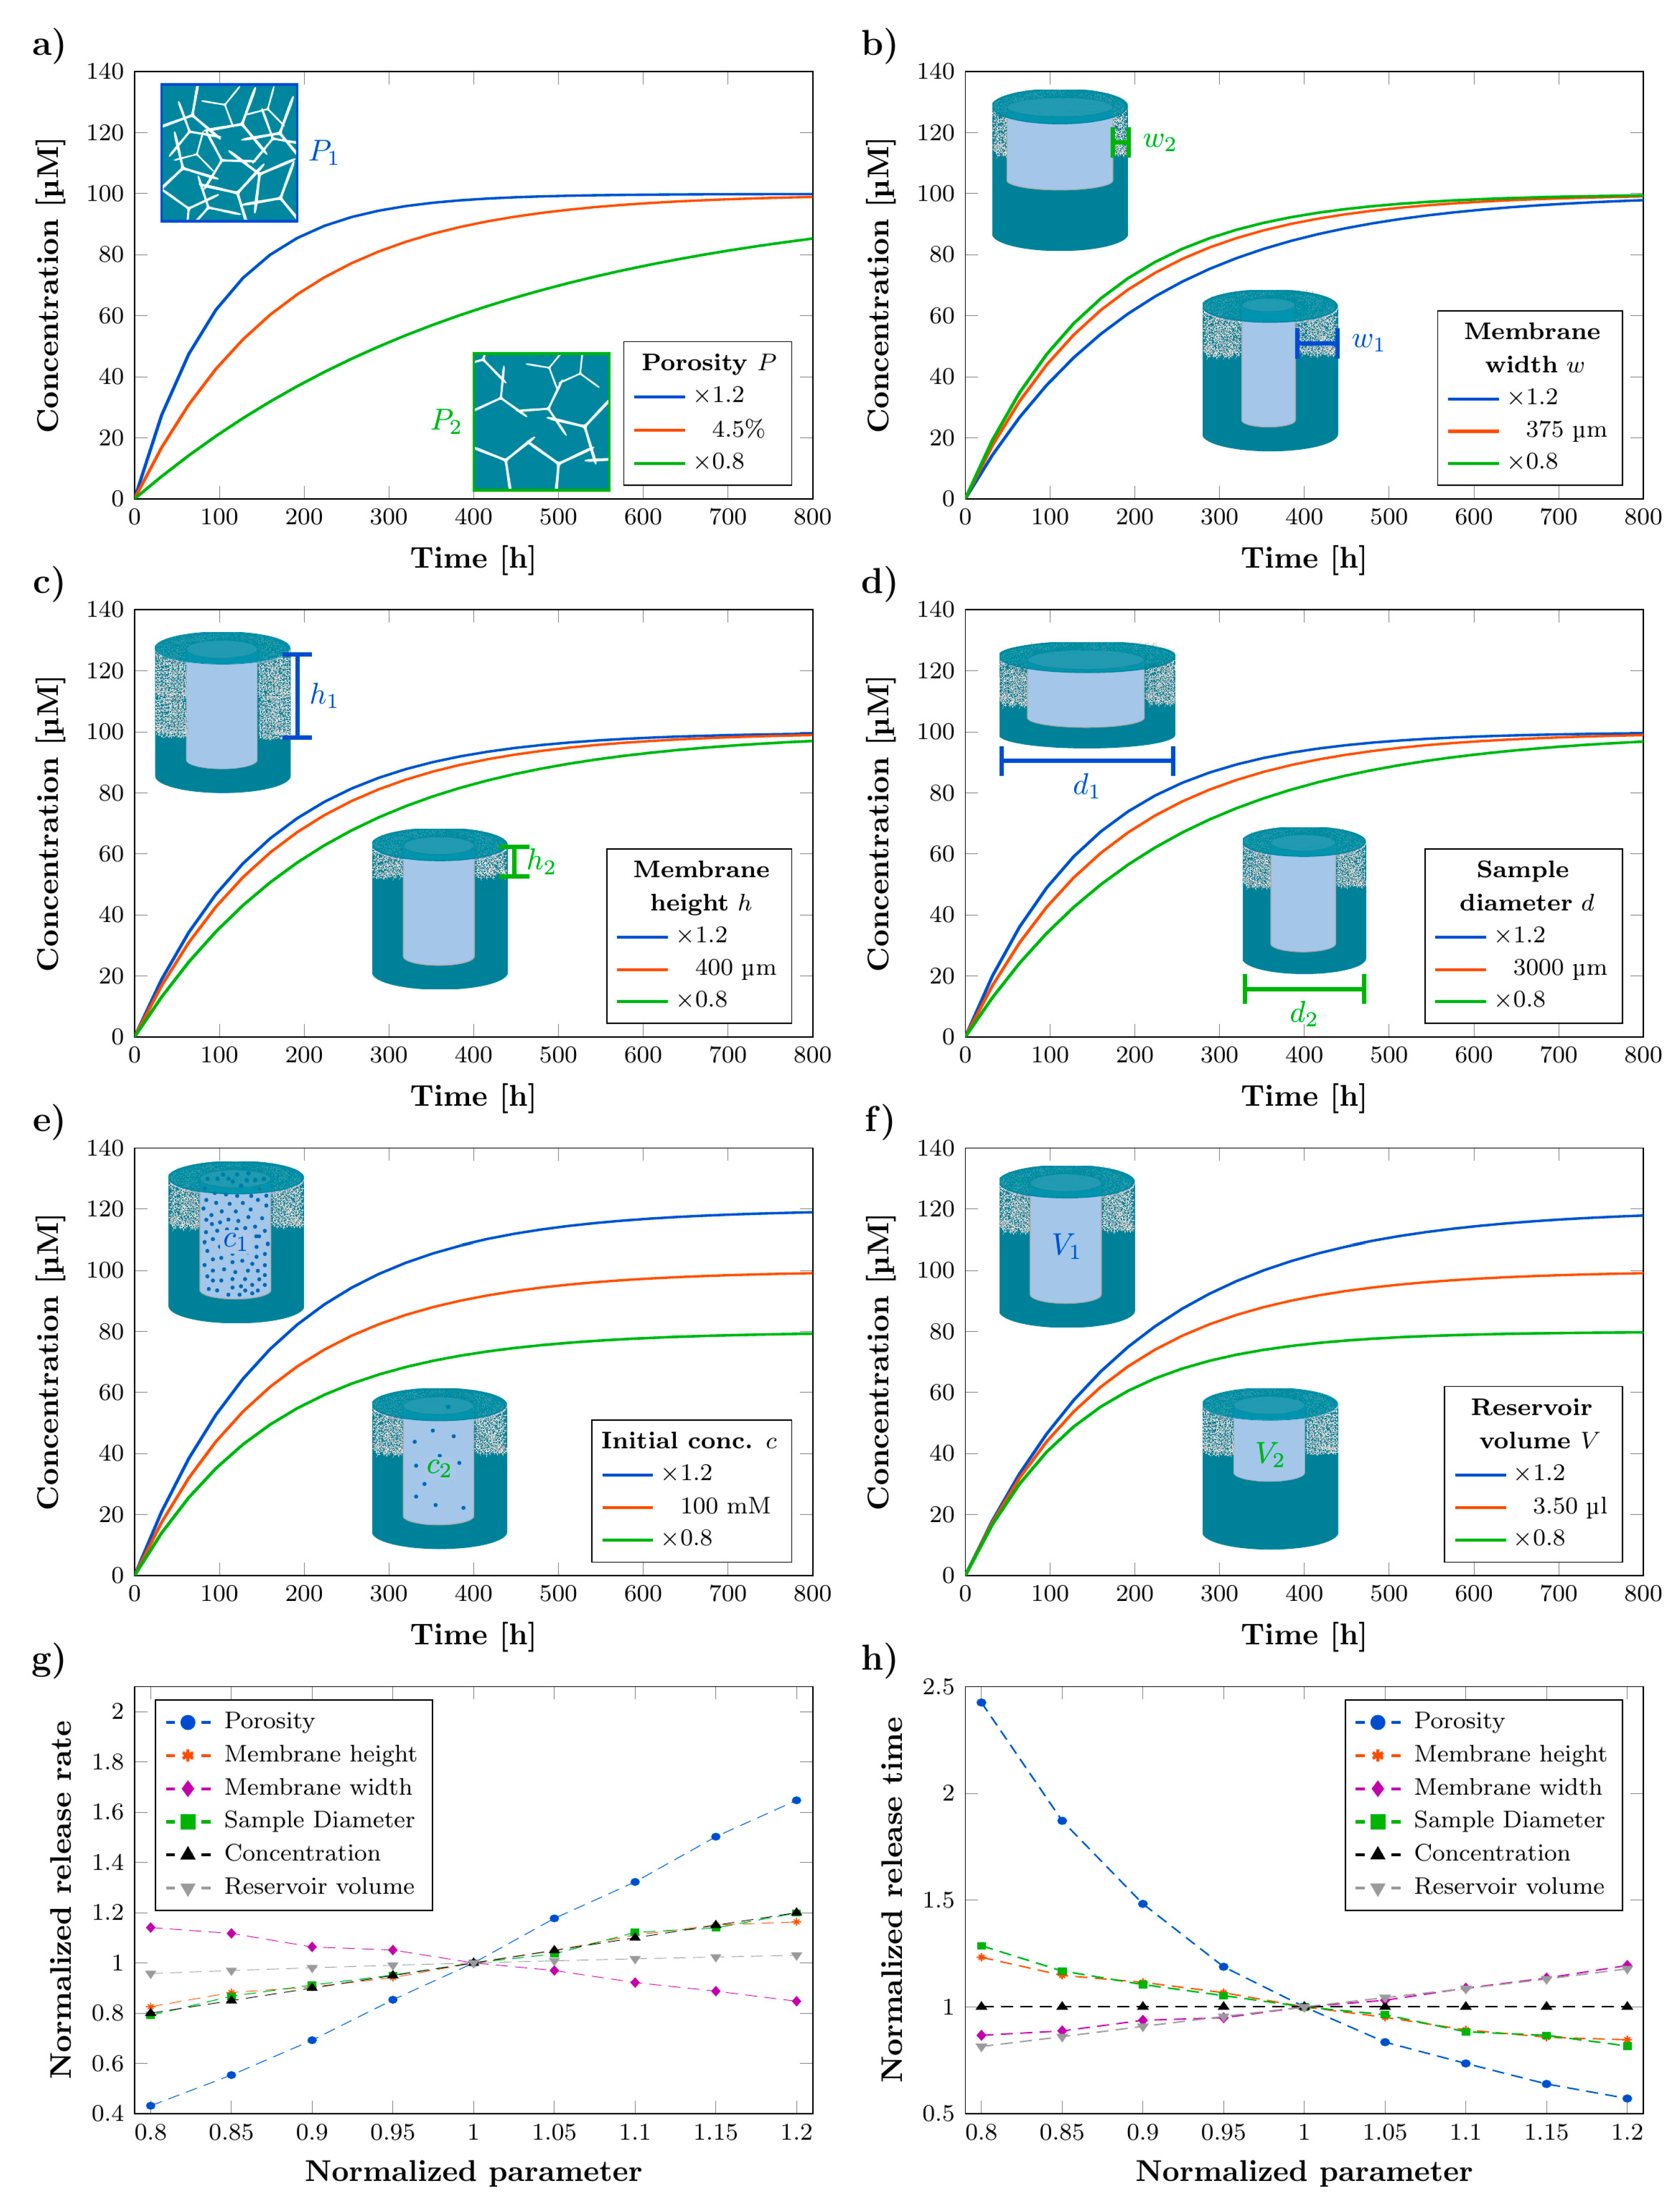
| Parameter | Change | Change in Release Rate | Change in Release Time |
|---|---|---|---|
| Membrane porosity | +20% −20% | +65% | −43% |
| −57% | +143% | ||
| Membrane width | +20% −20% | −15% | −13% |
| +14% | +19% | ||
| Membrane height | +20% −20% | +16% | −15% |
| −17% | +23% | ||
| Sample diameter | +20% −20% | +20% | −18% |
| −21% | +29% | ||
| Initial concentration | +20% −20% | +20% | 0% |
| −20% | 0% | ||
| Reservoir volume | +20% −20% | +3% | −19% |
| −4% | +18% |
Publisher’s Note: MDPI stays neutral with regard to jurisdictional claims in published maps and institutional affiliations. |
© 2022 by the authors. Licensee MDPI, Basel, Switzerland. This article is an open access article distributed under the terms and conditions of the Creative Commons Attribution (CC BY) license (https://creativecommons.org/licenses/by/4.0/).
Share and Cite
Hauck, M.; Dittmann, J.; Zeller-Plumhoff, B.; Madurawala, R.; Hellmold, D.; Kubelt, C.; Synowitz, M.; Held-Feindt, J.; Adelung, R.; Wulfinghoff, S.; et al. Fabrication and Modelling of a Reservoir-Based Drug Delivery System for Customizable Release. Pharmaceutics 2022, 14, 777. https://doi.org/10.3390/pharmaceutics14040777
Hauck M, Dittmann J, Zeller-Plumhoff B, Madurawala R, Hellmold D, Kubelt C, Synowitz M, Held-Feindt J, Adelung R, Wulfinghoff S, et al. Fabrication and Modelling of a Reservoir-Based Drug Delivery System for Customizable Release. Pharmaceutics. 2022; 14(4):777. https://doi.org/10.3390/pharmaceutics14040777
Chicago/Turabian StyleHauck, Margarethe, Jan Dittmann, Berit Zeller-Plumhoff, Roshani Madurawala, Dana Hellmold, Carolin Kubelt, Michael Synowitz, Janka Held-Feindt, Rainer Adelung, Stephan Wulfinghoff, and et al. 2022. "Fabrication and Modelling of a Reservoir-Based Drug Delivery System for Customizable Release" Pharmaceutics 14, no. 4: 777. https://doi.org/10.3390/pharmaceutics14040777
APA StyleHauck, M., Dittmann, J., Zeller-Plumhoff, B., Madurawala, R., Hellmold, D., Kubelt, C., Synowitz, M., Held-Feindt, J., Adelung, R., Wulfinghoff, S., & Schütt, F. (2022). Fabrication and Modelling of a Reservoir-Based Drug Delivery System for Customizable Release. Pharmaceutics, 14(4), 777. https://doi.org/10.3390/pharmaceutics14040777