
Acetic Acid as Processing Aid Dramatically Improves Organic Solvent Solubility of Weakly Basic Drugs for Spray Dried Dispersion Manufacture


 , , and
Abstract
:
1. Introduction
2. Materials and Methods
2.1. Material Sourcing
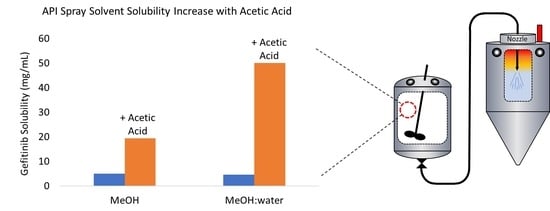
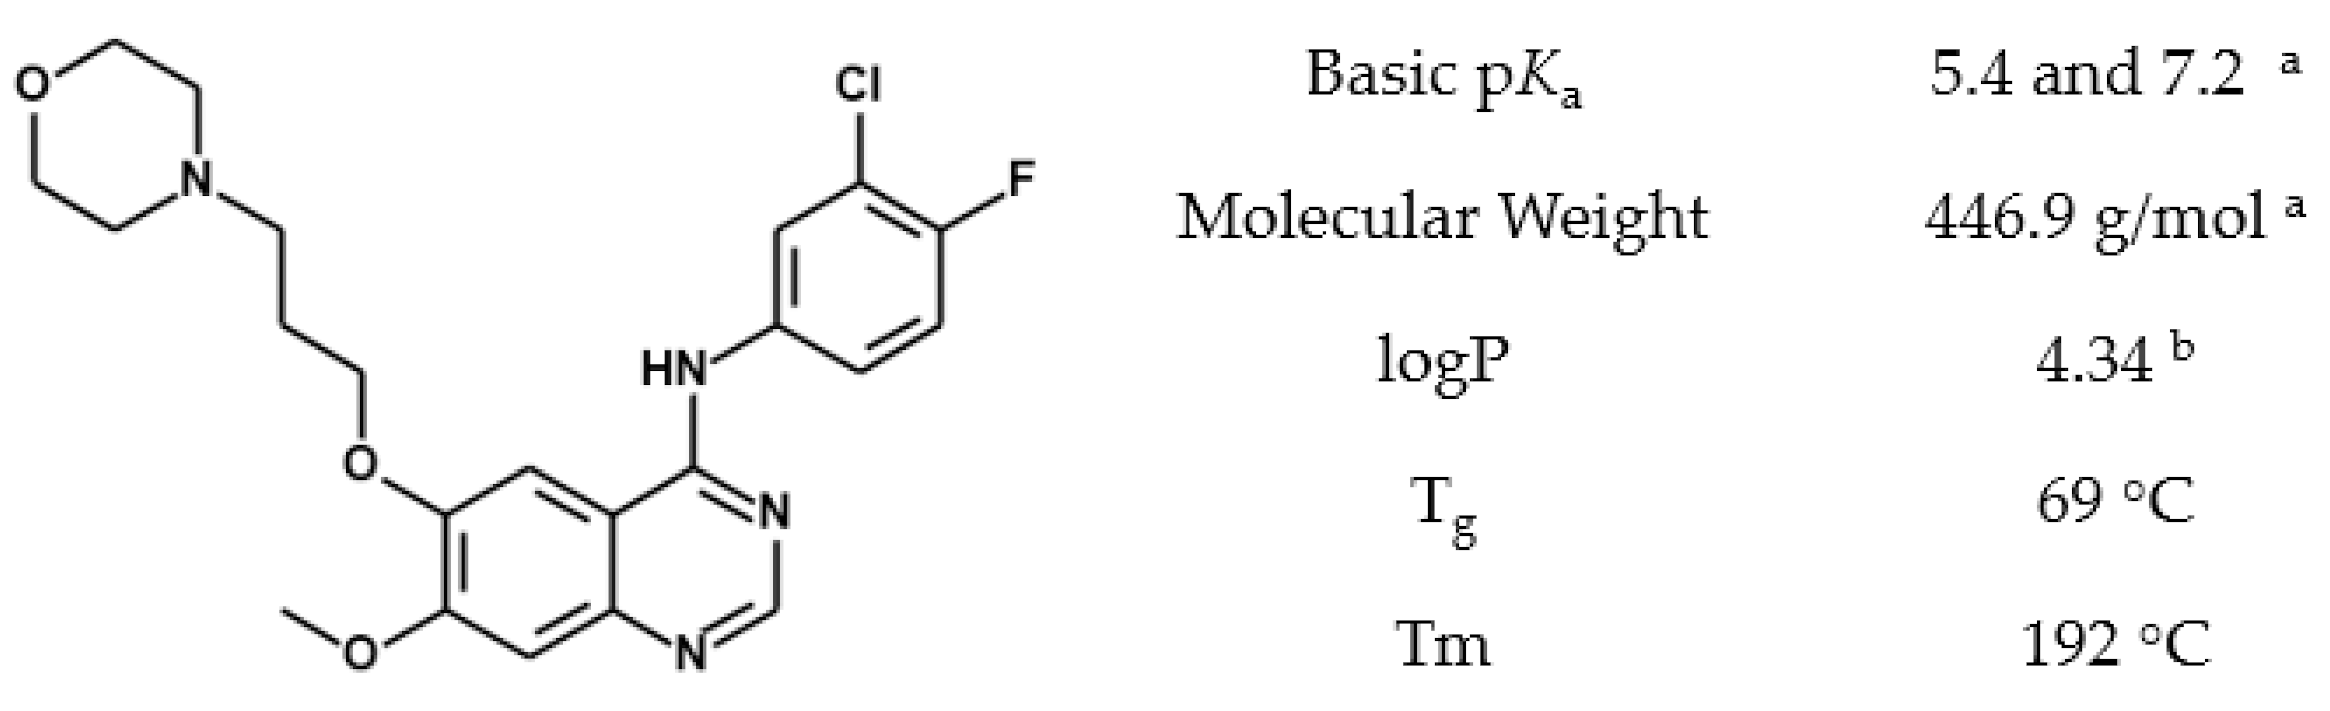
2.2. Gefitinib Solubility
2.3. pKa Assessment by 1H-NMR
2.4. Spray Dry Manufacturing
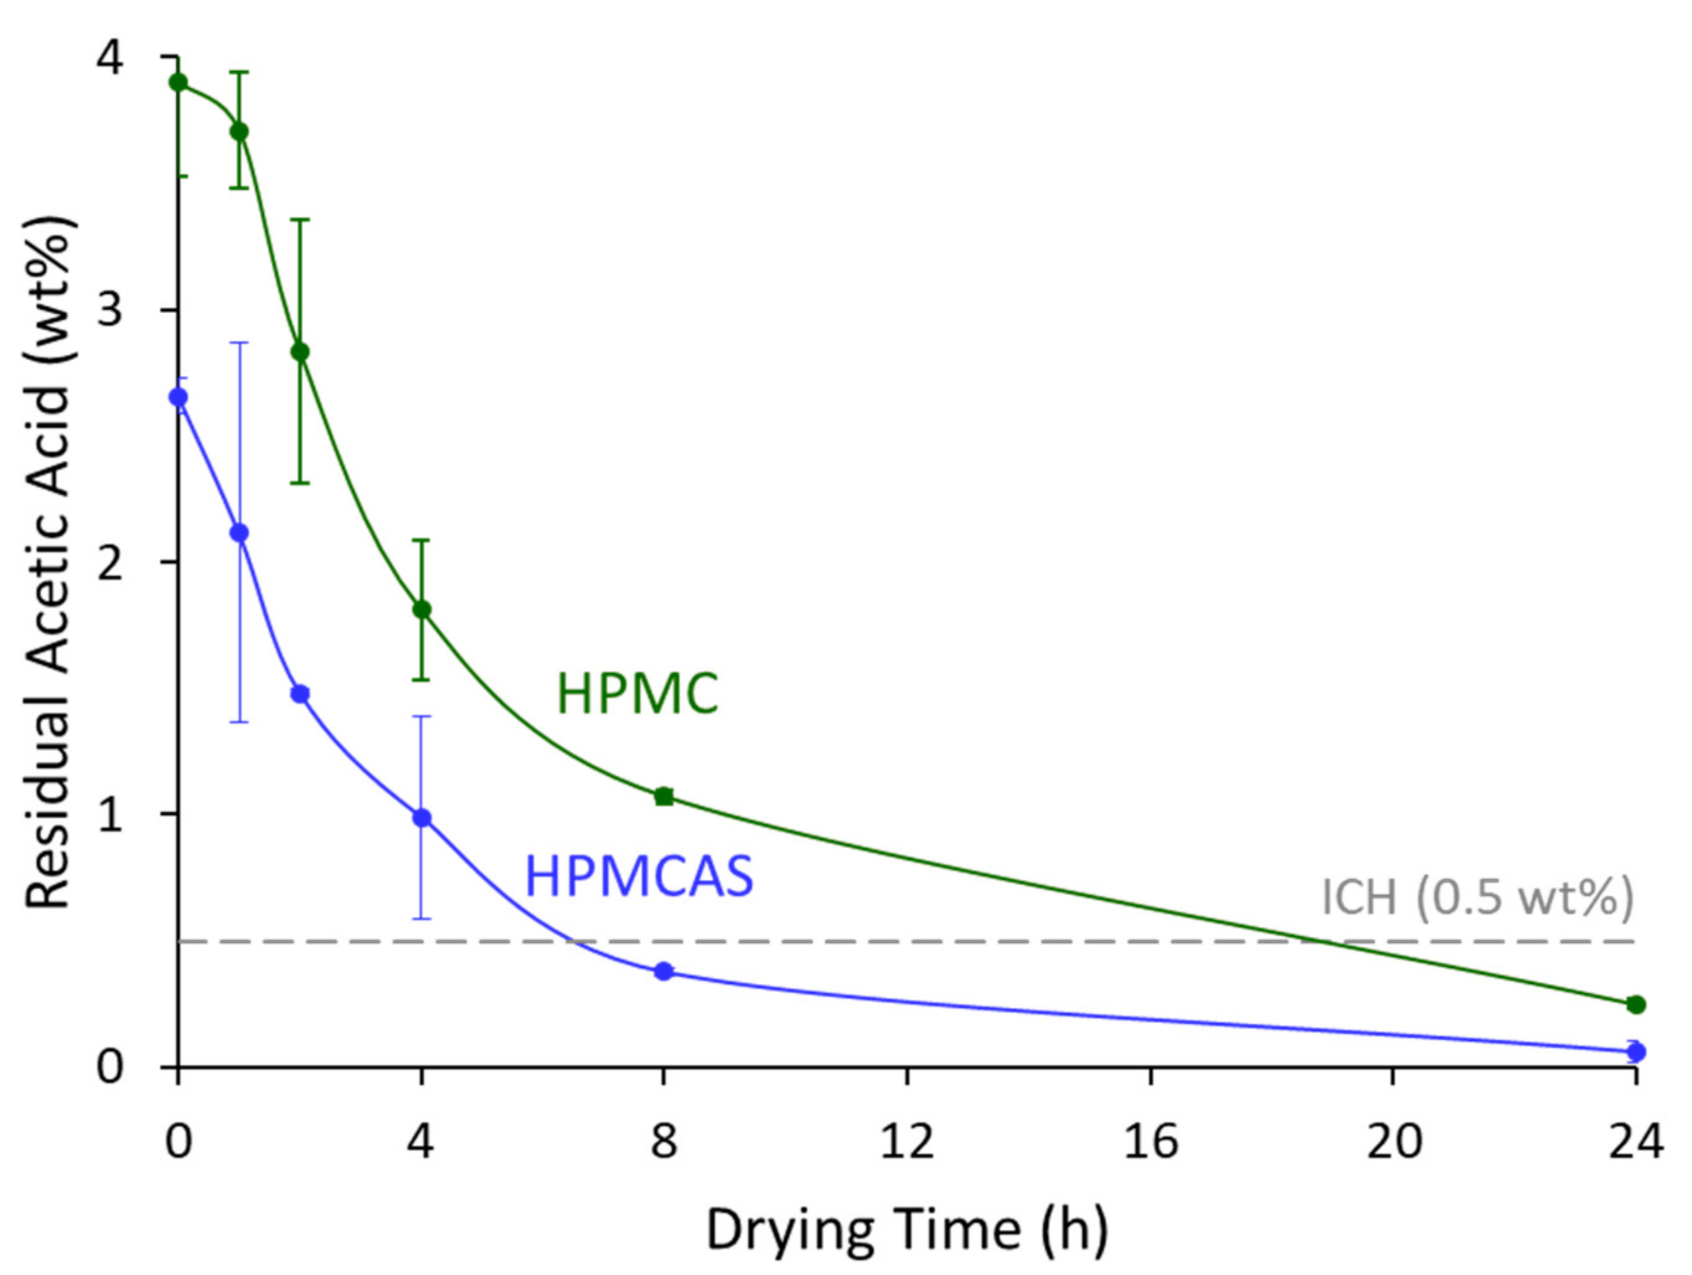
2.5. Secondary Drying
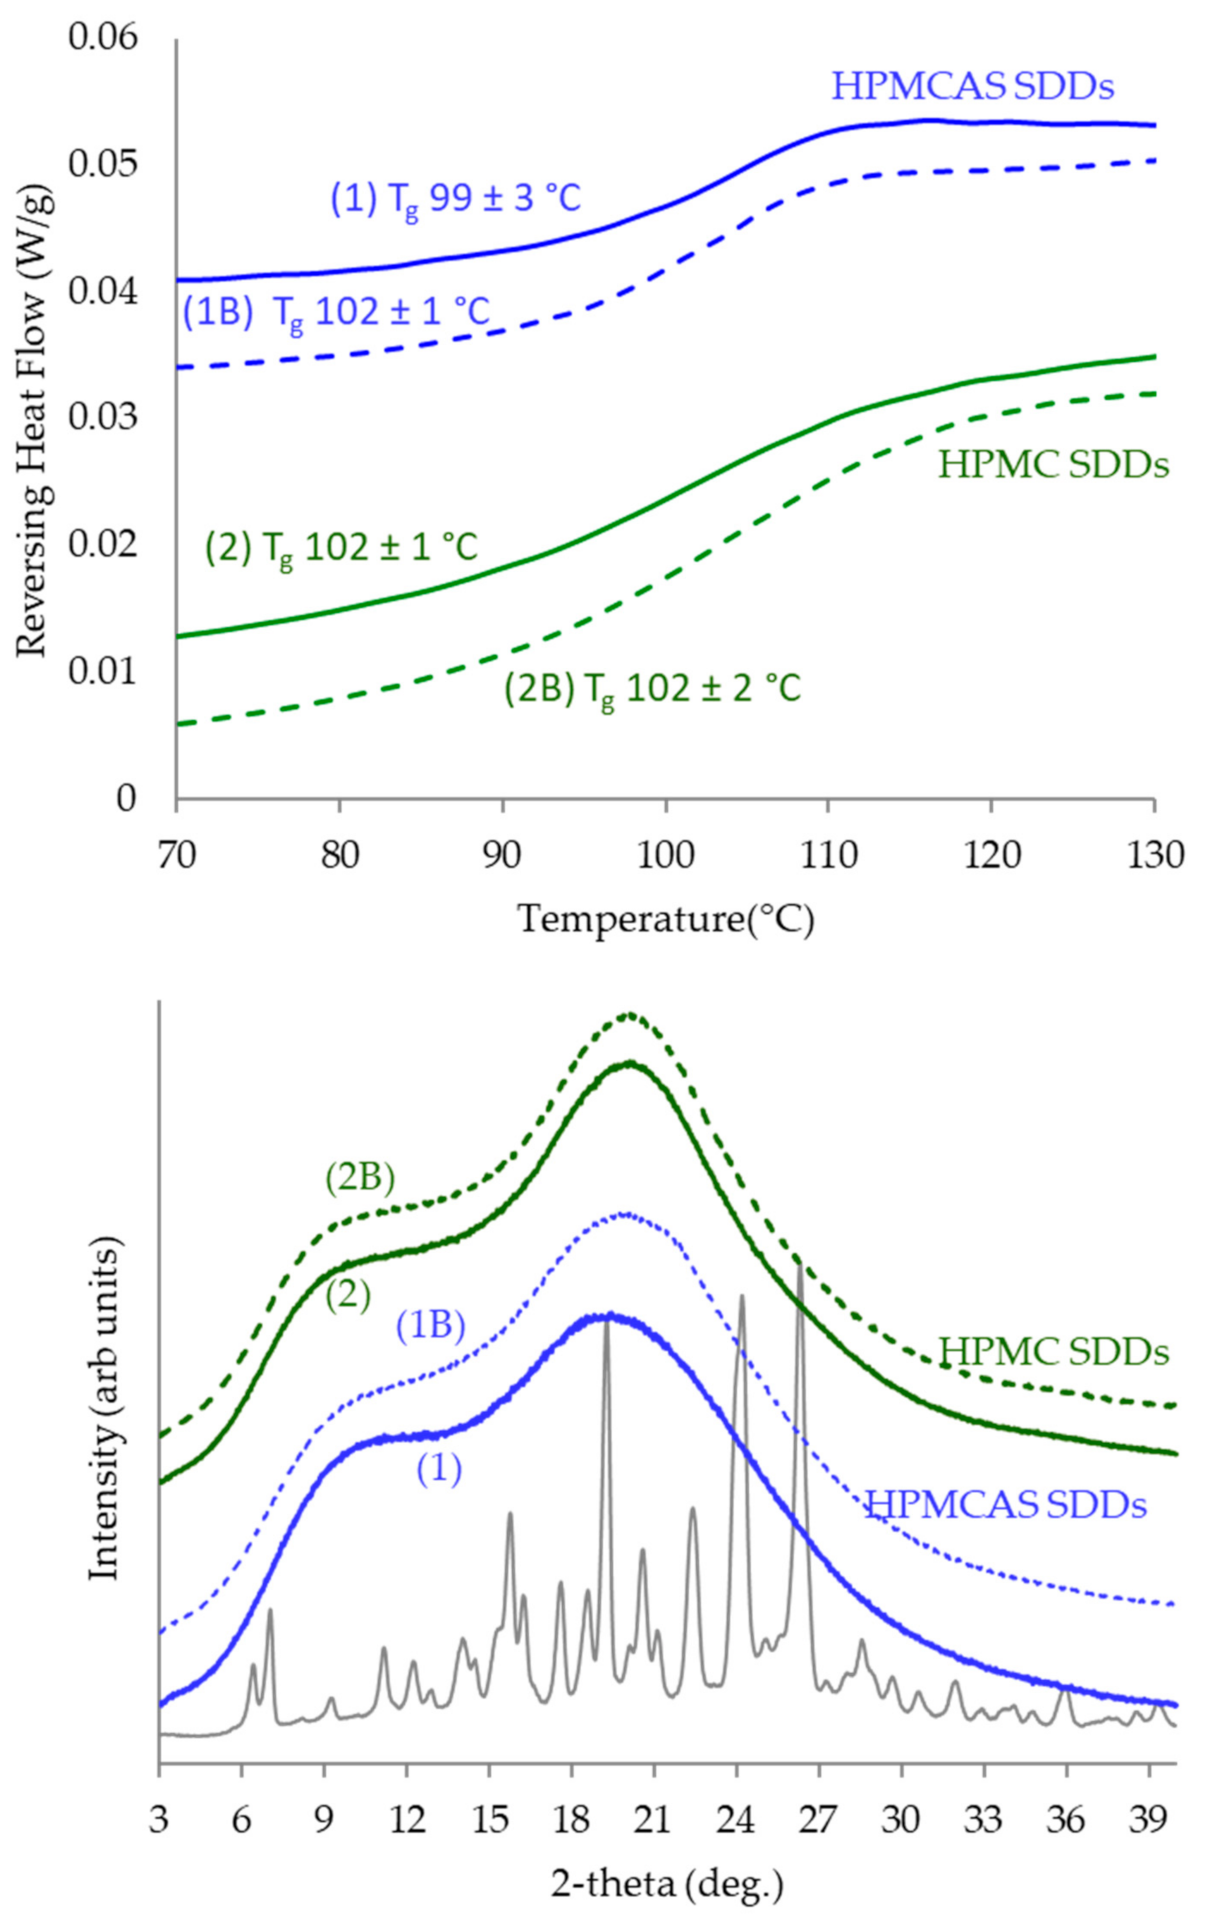
2.6. Powder X-ray Diffraction (PXRD)
2.7. Differential Scanning Calorimetry (DSC)
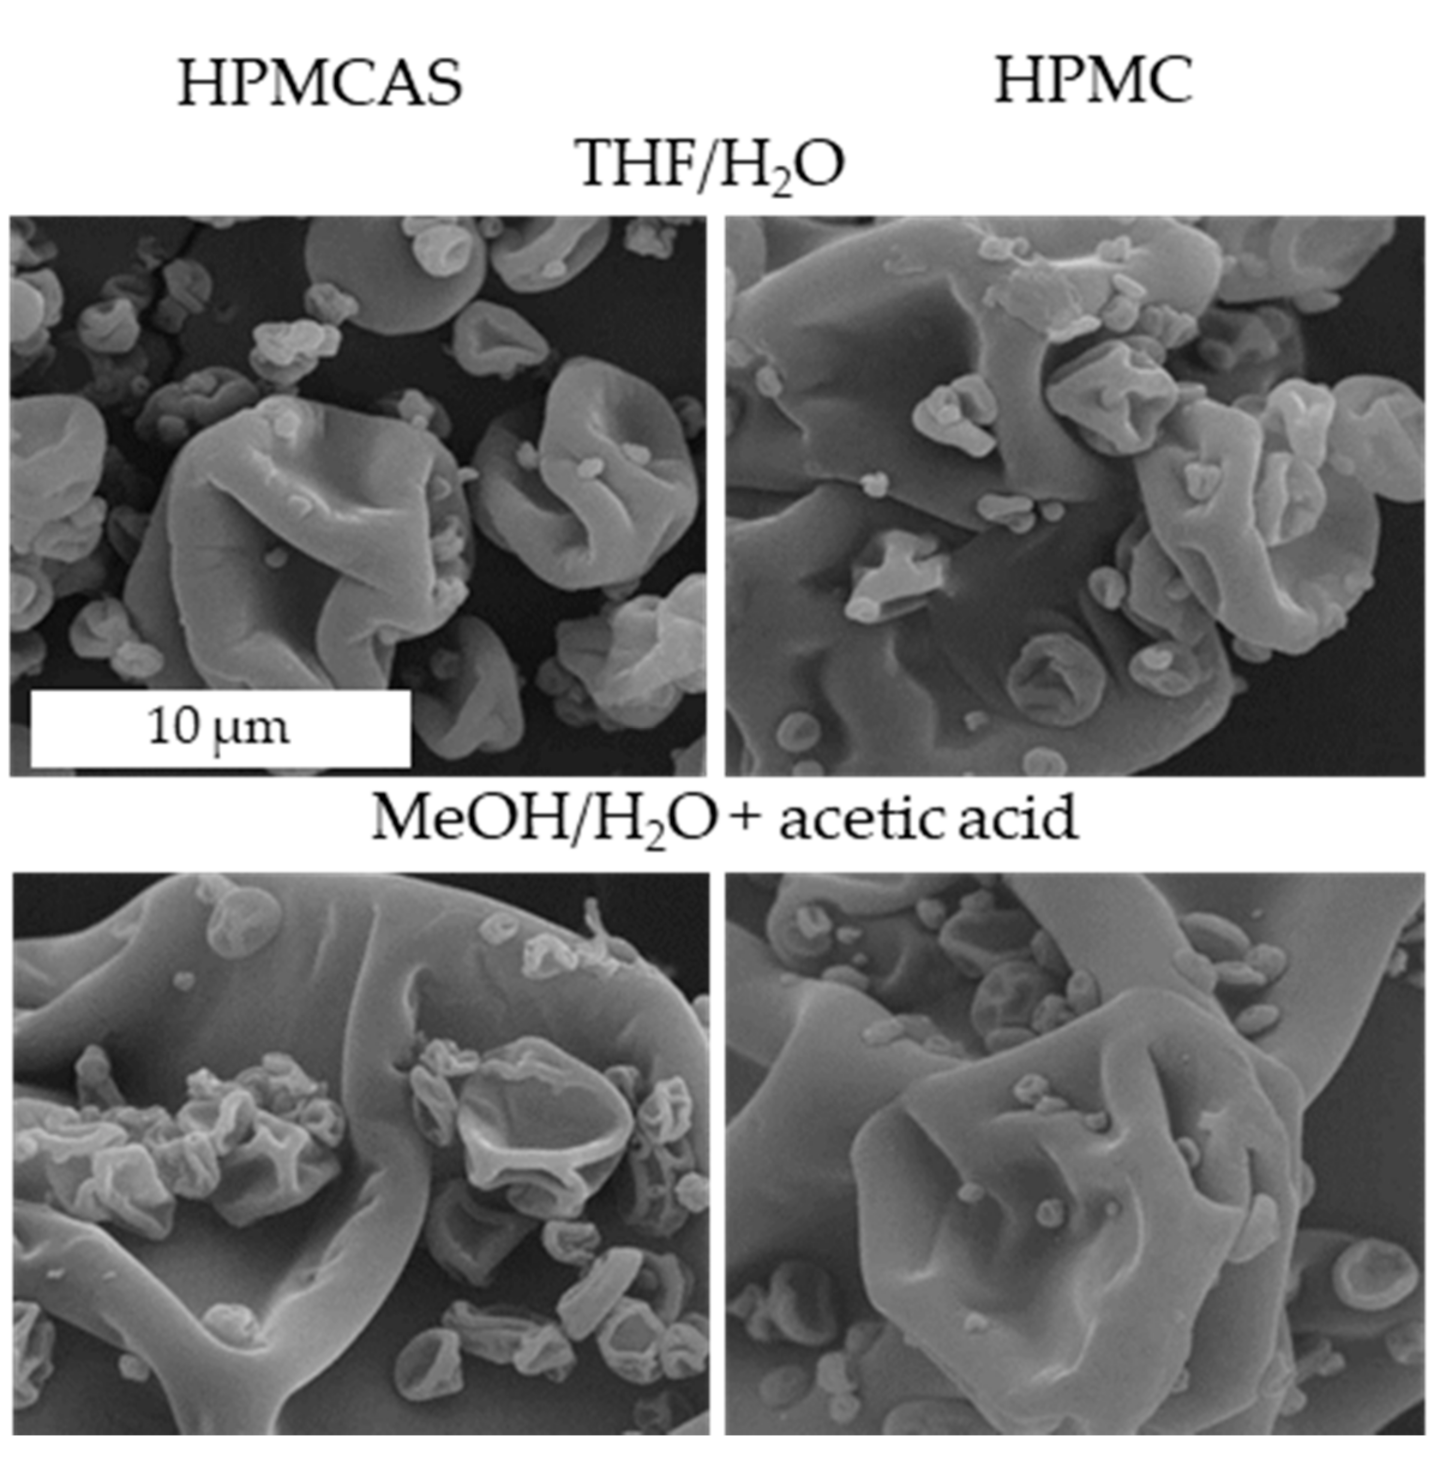
2.8. Scanning Electron Microscopy (SEM)
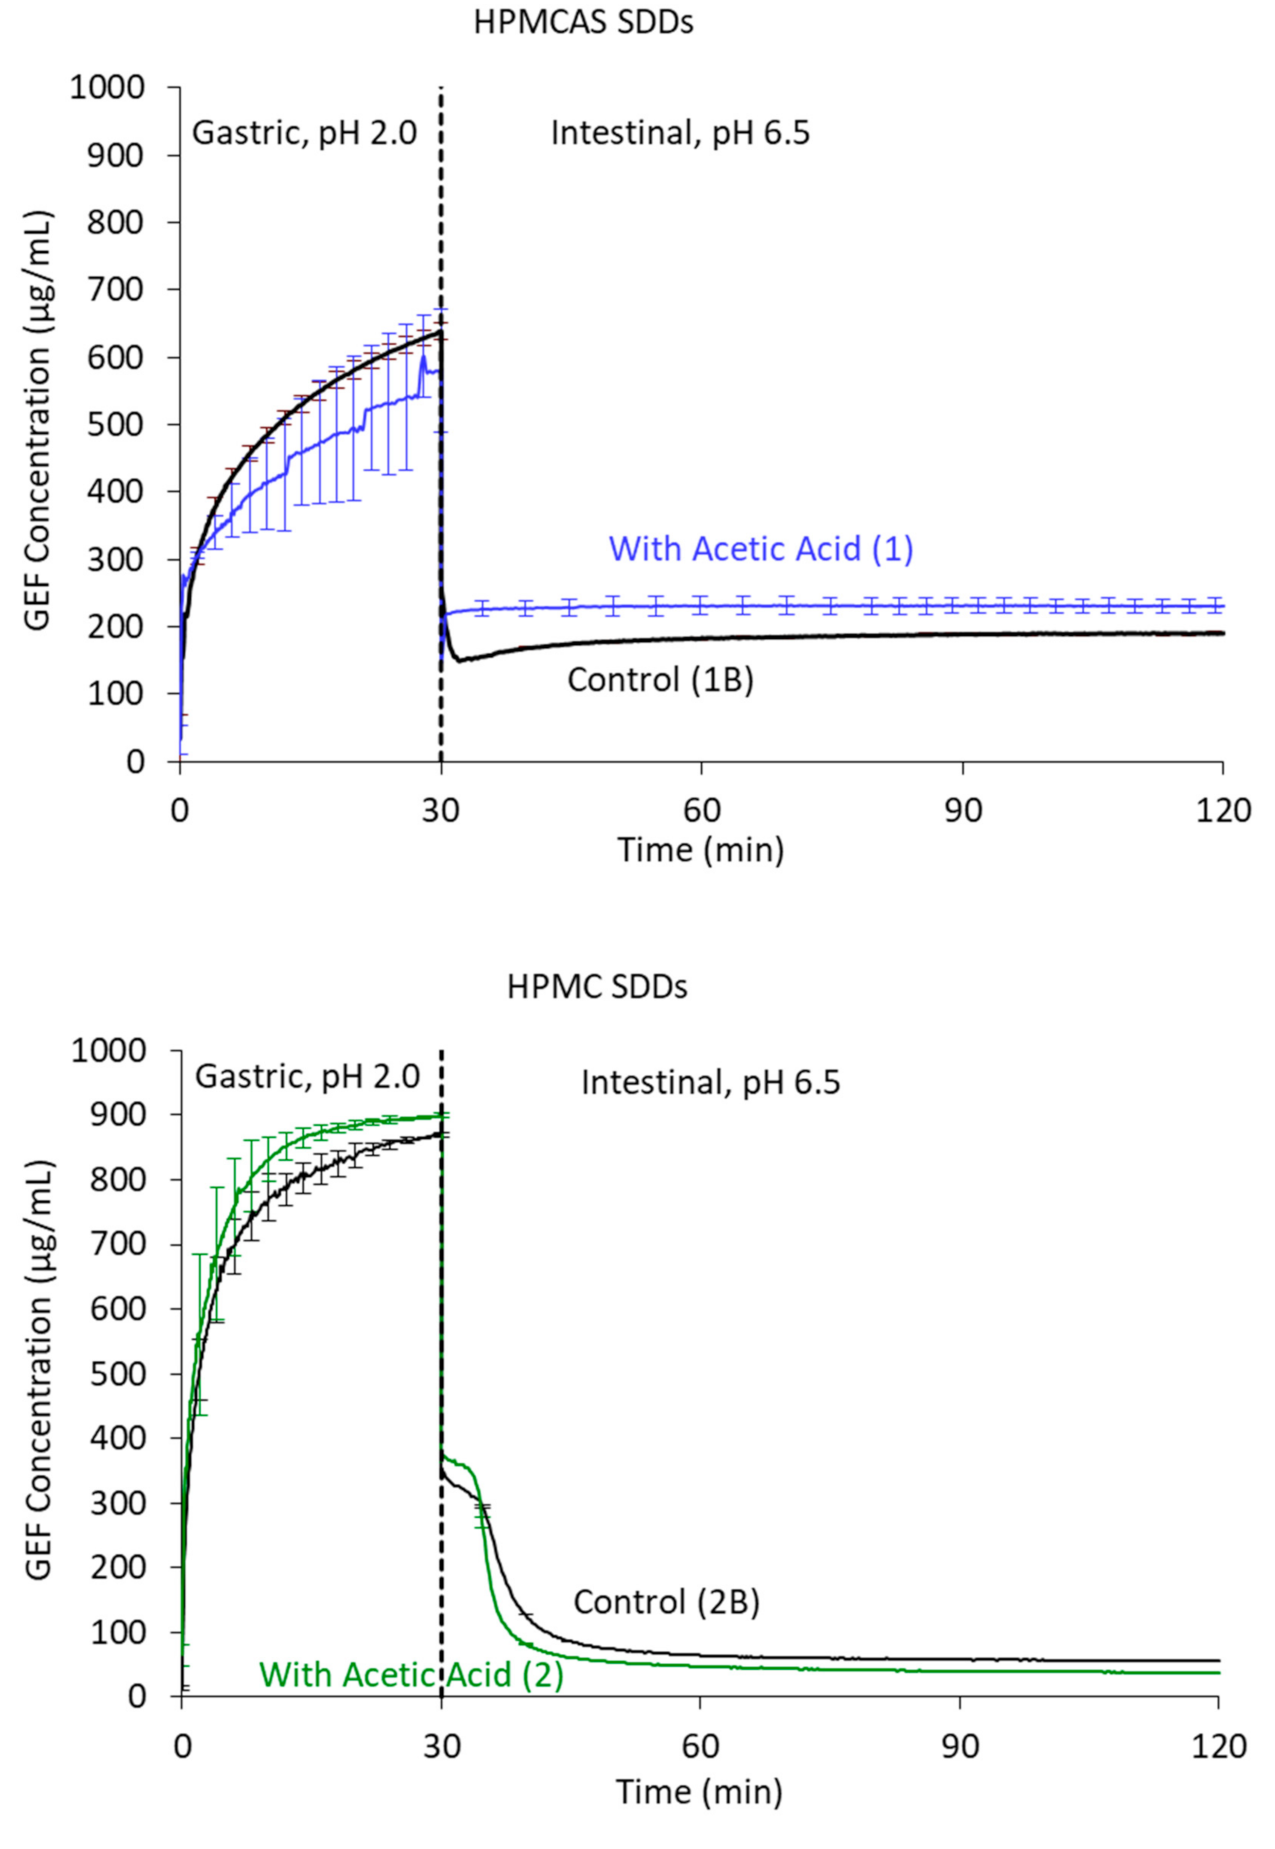
2.9. In Vitro Dissolution Testing
3. Results
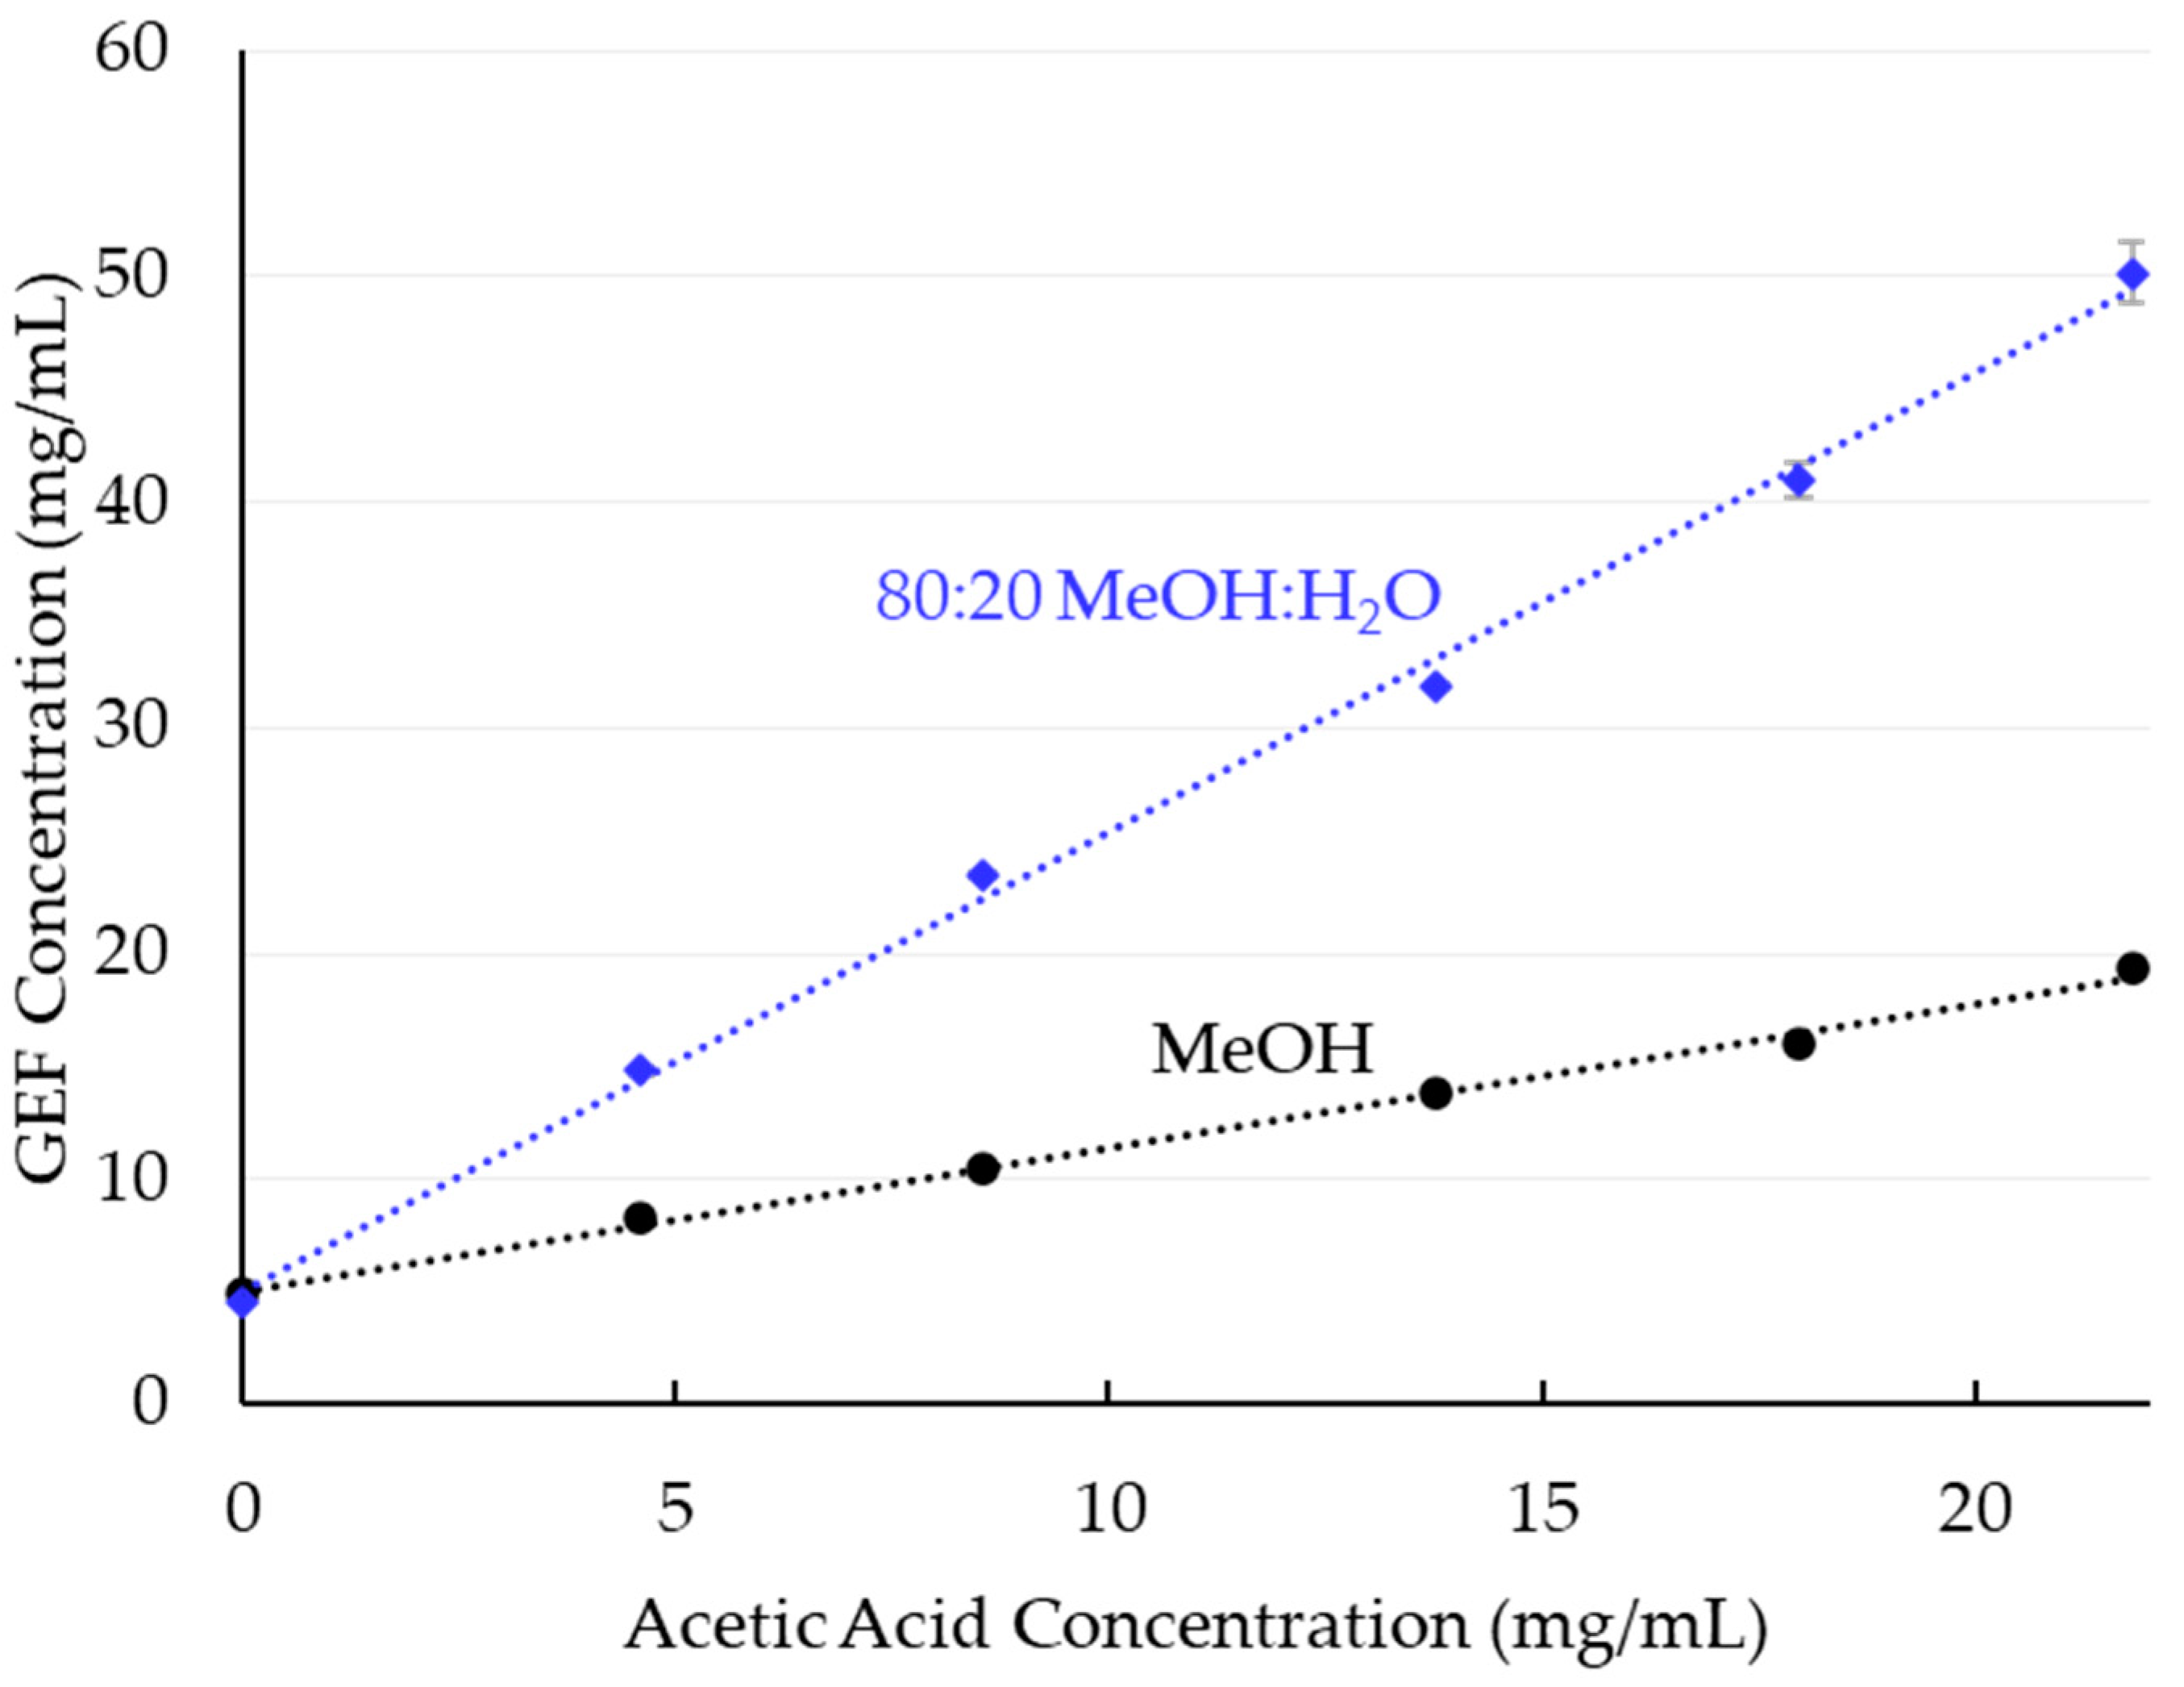
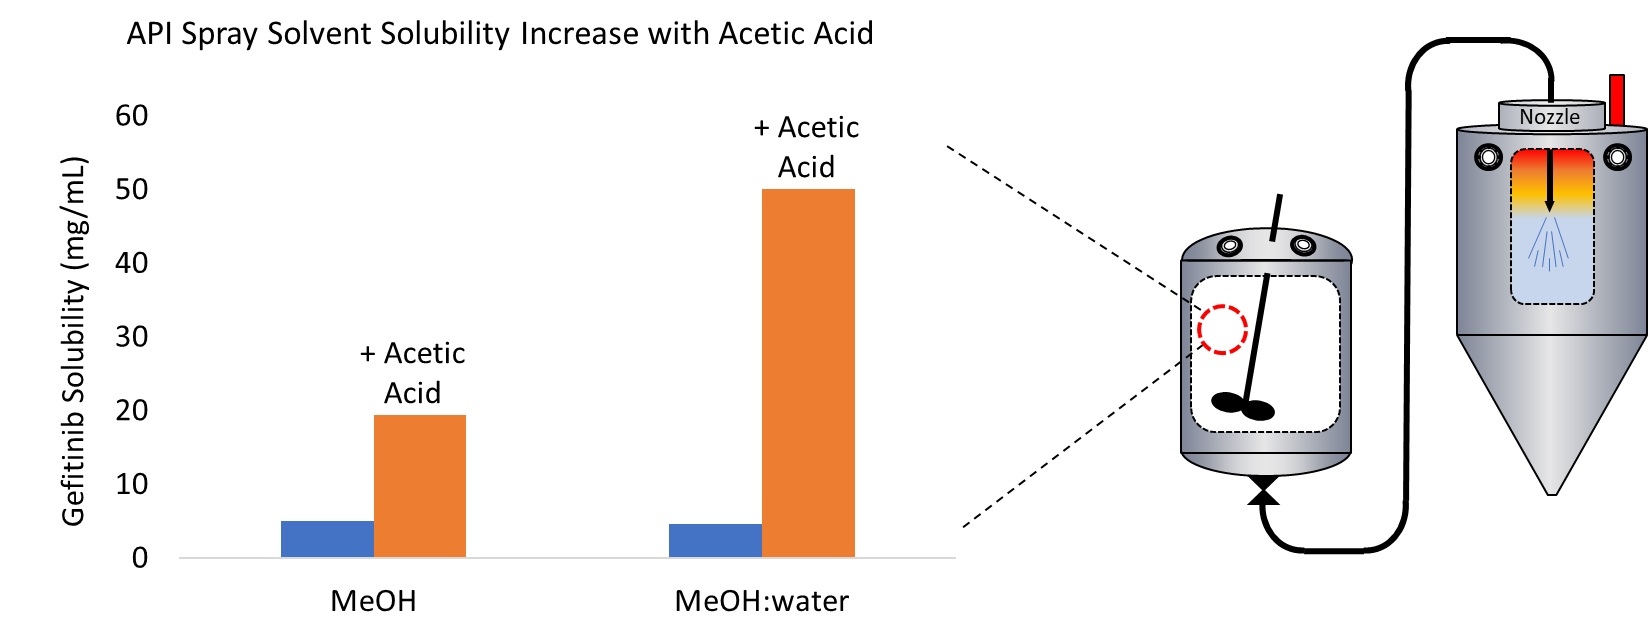
3.1. Solubility
3.2. Gefitinib Protonation by Acetic Acid
3.3. Solvent Removal
3.4. SDD Characterization
4. Discussion
4.1. Gefitinib Solubility
4.2. SDD Characterization and Performance
4.3. Throughput Increase and Material Savings
5. Conclusions
6. Patents
Supplementary Materials
Author Contributions
Funding
Institutional Review Board Statement
Informed Consent Statement
Data Availability Statement
Acknowledgments
Conflicts of Interest
References
- Bennett-Lenane, H.; O’Shea, J.P.; O’Driscoll, C.M.; Griffin, B.T. A retrospective biopharmaceutical analysis of >800 approved oral drug products: Are drug properties of solid dispersions and lipid-based formulations distinctive? J. Pharm. Sci. 2020, 109, 3248–3261. [Google Scholar] [CrossRef] [PubMed]
- Lloyd, I. Pharma R&D Annual Review 2019; Pharmaprojects: London, UK, 2019. [Google Scholar]
- Almeida e Sousa, L.; Reutzel-Edens, S.M.; Stephenson, G.A.; Taylor, L.S. Assessment of the amorphous “solubility” of a group of diverse drugs using new experimental and theoretical approaches. Mol. Pharm. 2015, 12, 484–495. [Google Scholar] [CrossRef] [PubMed]
- Ilevbare, G.A.; Taylor, L.S. Liquid–liquid phase separation in highly supersaturated aqueous solutions of poorly water-soluble drugs: Implications for solubility enhancing formulations. Cryst. Growth Des. 2013, 13, 1497–1509. [Google Scholar] [CrossRef]
- Murdande, S.B.; Pikal, M.J.; Shanker, R.M.; Bogner, R.H. Solubility advantage of amorphous pharmaceuticals: I. A thermodynamic analysis. J. Pharm. Sci. 2010, 99, 1254–1264. [Google Scholar] [CrossRef]
- Yoshioka, M.; Hancock, B.C.; Zografi, G. Crystallization of indomethacin from the amorphous state below and above its glass transition temperature. J. Pharm. Sci. 1994, 83, 1700–1705. [Google Scholar] [CrossRef]
- Mosharraf, M.; Nyström, C. The effect of particle size and shape on the surface specific dissolution rate of microsized practically insoluble drugs. Int. J. Pharm. 1995, 122, 35–47. [Google Scholar] [CrossRef]
- Davis, M.; Walker, G. Recent strategies in spray drying for the enhanced bioavailability of poorly water-soluble drugs. J. Control. Release 2018, 269, 110–127. [Google Scholar] [CrossRef]
- Blagden, N.; de Matas, M.; Gavan, P.T.; York, P. Crystal engineering of active pharmaceutical ingredients to improve solubility and dissolution rates. Adv. Drug Deliv. Rev. 2007, 59, 617–630. [Google Scholar] [CrossRef]
- Ziaee, A.; Albadarin, A.B.; Padrela, L.; Femmer, T.; O’Reilly, E.; Walker, G. Spray drying of pharmaceuticals and biopharmaceuticals: Critical parameters and experimental process optimization approaches. Eur. J. Pharm. Sci. 2019, 127, 300–318. [Google Scholar] [CrossRef]
- Chavan, R.B.; Rathi, S.; Jyothi, V.G.S.S.; Shastri, N.R. Cellulose based polymers in development of amorphous solid dispersions. Asian J. Pharm. Sci. 2019, 14, 248–264. [Google Scholar] [CrossRef]
- He, Y.; Ho, C. Amorphous solid dispersions: Utilization and challenges in drug discovery and development. J. Pharm. Sci. 2015, 104, 3237–3258. [Google Scholar] [CrossRef]
- Sedo, K. A Year in Review of the Drug Delivery Pipeline and Innovations. In Partnership Opportunities in Drug Delivery; The Conference Forum: Boston, MA, USA, 2019. [Google Scholar]
- Baumann, J.M.; Adam, M.S.; Wood, J.D. Engineering advances in spray drying for pharmaceuticals. Annu. Rev. Chem. Biomol. Eng. 2021, 12, 217–240. [Google Scholar] [CrossRef]
- Hugo, M.; Kunath, K.; Dressman, J. Selection of excipient, solvent and packaging to optimize the performance of spray-dried formulations: Case example fenofibrate. Drug Dev. Ind. Pharm. 2013, 39, 402–412. [Google Scholar] [CrossRef]
- Dobry, D.; Settell, D.; Baumann, J. Spray Drying and Scale-Up; John Wiley & Sons: Hoboken, NJ, USA, 2015; pp. 315–340. [Google Scholar]
- Ekdahl, A.; Mudie, D.; Malewski, D.; Amidon, G.; Goodwin, A. Effect of spray-dried particle morphology on mechanical and flow properties of felodipine in pvp va amorphous solid dispersions. J. Pharm. Sci. 2019, 108, 3657–3666. [Google Scholar] [CrossRef]
- Nyqvist, H.; Brodin, A. Ring shear cell measurements of granule flowability and the correlation to weight variations at tableting. Acta Pharm. Suec. 1982, 19, 81–90. [Google Scholar]
- Hossaini, R.; Chipperfield, M.P.; Montzka, S.A.; Leeson, A.A.; Dhomse, S.S.; Pyle, J.A. The increasing threat to stratospheric ozone from dichloromethane. Nat. Commun. 2017, 8, 15962. [Google Scholar] [CrossRef]
- Bale, A.S.; Barone, S.; Scott, C.S.; Cooper, G.S. A review of potential neurotoxic mechanisms among three chlorinated organic solvents. Toxicol. Appl. Pharmacol. 2011, 255, 113–126. [Google Scholar] [CrossRef]
- Friesen, D.T.; Newbold, D.D.; Baumann, J.M.; DuBose, D.B.; Millard, D.L. Spray-Drying Process. US Patent Applic. No. US 2019/0262791 A1, 29 August 2019. [Google Scholar]
- Friesen, D.T.; Newbold, D.D.; Baumann, J.M.; Dubose, D.B.; Millard, D.L. High-Temperature Spray Drying Process and Apparatus. U.S. Patent US 9,248,584 B2, 2 February 2016. [Google Scholar]
- Serajuddin, A.T.M. Salt formation to improve drug solubility. Adv. Drug Deliv. Rev. 2007, 59, 603–616. [Google Scholar] [CrossRef]
- Ketner, R.J.; Lorenz, D.A.; Lyon, D.K. Spray Dried Formulation. U.S. Patent US 8,372,836 B2, 12 February 2013. [Google Scholar]
- Miller, W.K.; Morgen, M.M. Solid Dispersions of Low-Water Solubility Actives. U.S. Patent US9,737,538 B2, 22 August 2017. [Google Scholar]
- AstraZeneca (Ed.) Highlights of Prescribing Information-Iressa (Gefitinib) Tablets for Oral Use; U.S. Food and Drug Administration: Silver Spring, MD, USA, 2015. [Google Scholar]
- Gilday, J.P.G.; Stephen, A.; Ymen, B.I.; Bohlin, M. Novel Crystalline Forms of the Anti-Cancer Compound zd1839. European Patent EP1480650B1, 28 April 2010. [Google Scholar]
- ICH. International council for harmonisation of technical requirements for pharmaceutical for human use. In Impurities: Guideline for Residual Solvents; International Council on Harmonization: Geneva, Switzerland, 2021. [Google Scholar]
- Rossini, E.; Bochevarov, A.D.; Knapp, E.W. Empirical conversion of pka values between different solvents and interpretation of the parameters: Application to water, acetonitrile, dimethyl sulfoxide, and methanol. ACS Omega 2018, 3, 1653–1662. [Google Scholar] [CrossRef]
- Konno, H.; Handa, T.; Alonzo, D.E.; Taylor, L.S. Effect of polymer type on the dissolution profile of amorphous solid dispersions containing felodipine. Eur. J. Pharm. Biopharm. 2008, 70, 493–499. [Google Scholar] [CrossRef]
- Friesen, D.T.; Shanker, R.; Crew, M.; Smithey, D.T.; Curatolo, W.J.; Nightingale, J.A.S. Hydroxypropyl methylcellulose acetate succinate-based spray-dried dispersions: An overview. Mol. Pharm. 2008, 5, 1003–1019. [Google Scholar] [CrossRef]
- Miller, W.K.; Morgen Michael, M. Ammonia as a Processing Aid for Sprayed Solid Dispersions. International Patent Applic. No. WO 2021/028832 A1, 18 February 2021. [Google Scholar]


| Lot ID | Dispersion Polymer | Solvent Composition | Dissolved Solids (Drug + Polymer) Concentration (wt%) | GEF Concentration | ||
|---|---|---|---|---|---|---|
| Solvent | (wt%) | (wt%) | (mg/mL) | |||
| 1 | HPMCAS | MeOH | 84.5 | 8.7 | 2.17 | 19.6 |
| H2O | 14.8 | |||||
| acetic acid | 0.7 a | |||||
| 2 | HPMC | MeOH | 79.5 | 8.6 | 2.15 | 19.5 |
| H2O | 19.9 | |||||
| acetic acid | 0.6 b | |||||
| 1B | HPMCAS | THF | 95 | 8.7 | 2.18 | 21.3 |
| H2O | 5 | |||||
| 2B | HPMC | THF | 80 | 8.6 | 2.15 | 21.3 |
| H2O | 20 | |||||
| Acetic Acid Conc. (mg/mL) | MeOH | 80:20 MeOH:H2O | ||
|---|---|---|---|---|
| Fraction Drug Ionized | Calc. Δ pKa | Fraction Drug Ionized | Calc. Δ pKa | |
| 13.8 | 0.60 | −0.89 | 0.78 | 0.05 |
| 21.8 | 0.68 | −0.74 | 0.81 | 0.13 |
| Parameter | MeOH | 80:20 MeOH:H2O | |||
|---|---|---|---|---|---|
| No Acetic Acid | +Acetic Acid a | No Acetic Acid | +Acetic Acid a | ||
| GEF Solubility | (mg/mL) | 5 | 19.3 | 4.6 | 50 |
| (wt%) | 0.62 | 2.2 | 0.54 | 4.8 | |
| Dissolved Solids (wt%) | 2.5 | 8.9 | 2.2 | 19.4 | |
| Solvent Volume (L) | 4970 | 1300 | 5430 | 500 | |
| Spray Time (Hours) | 80.6 | 22.5 | 92.6 | 10.3 | |
Publisher’s Note: MDPI stays neutral with regard to jurisdictional claims in published maps and institutional affiliations. |
© 2022 by the authors. Licensee MDPI, Basel, Switzerland. This article is an open access article distributed under the terms and conditions of the Creative Commons Attribution (CC BY) license (https://creativecommons.org/licenses/by/4.0/).
Share and Cite
Adam, M.S.; Miller, W.K.; Pluntze, A.M.; Stewart, A.M.; Cape, J.L.; Grass, M.E.; Morgen, M.M. Acetic Acid as Processing Aid Dramatically Improves Organic Solvent Solubility of Weakly Basic Drugs for Spray Dried Dispersion Manufacture. Pharmaceutics 2022, 14, 555. https://doi.org/10.3390/pharmaceutics14030555
Adam MS, Miller WK, Pluntze AM, Stewart AM, Cape JL, Grass ME, Morgen MM. Acetic Acid as Processing Aid Dramatically Improves Organic Solvent Solubility of Weakly Basic Drugs for Spray Dried Dispersion Manufacture. Pharmaceutics. 2022; 14(3):555. https://doi.org/10.3390/pharmaceutics14030555
Chicago/Turabian StyleAdam, Molly S., Warren K. Miller, Amanda M. Pluntze, Aaron M. Stewart, Jonathan L. Cape, Michael E. Grass, and Michael M. Morgen. 2022. "Acetic Acid as Processing Aid Dramatically Improves Organic Solvent Solubility of Weakly Basic Drugs for Spray Dried Dispersion Manufacture" Pharmaceutics 14, no. 3: 555. https://doi.org/10.3390/pharmaceutics14030555
APA StyleAdam, M. S., Miller, W. K., Pluntze, A. M., Stewart, A. M., Cape, J. L., Grass, M. E., & Morgen, M. M. (2022). Acetic Acid as Processing Aid Dramatically Improves Organic Solvent Solubility of Weakly Basic Drugs for Spray Dried Dispersion Manufacture. Pharmaceutics, 14(3), 555. https://doi.org/10.3390/pharmaceutics14030555