
Endothelial Iron Homeostasis Regulates Blood-Brain Barrier Integrity via the HIF2α—Ve-Cadherin Pathway

 , and
, and 
Abstract
:1. Introduction
2. Materials and Methods
2.1. Reagents
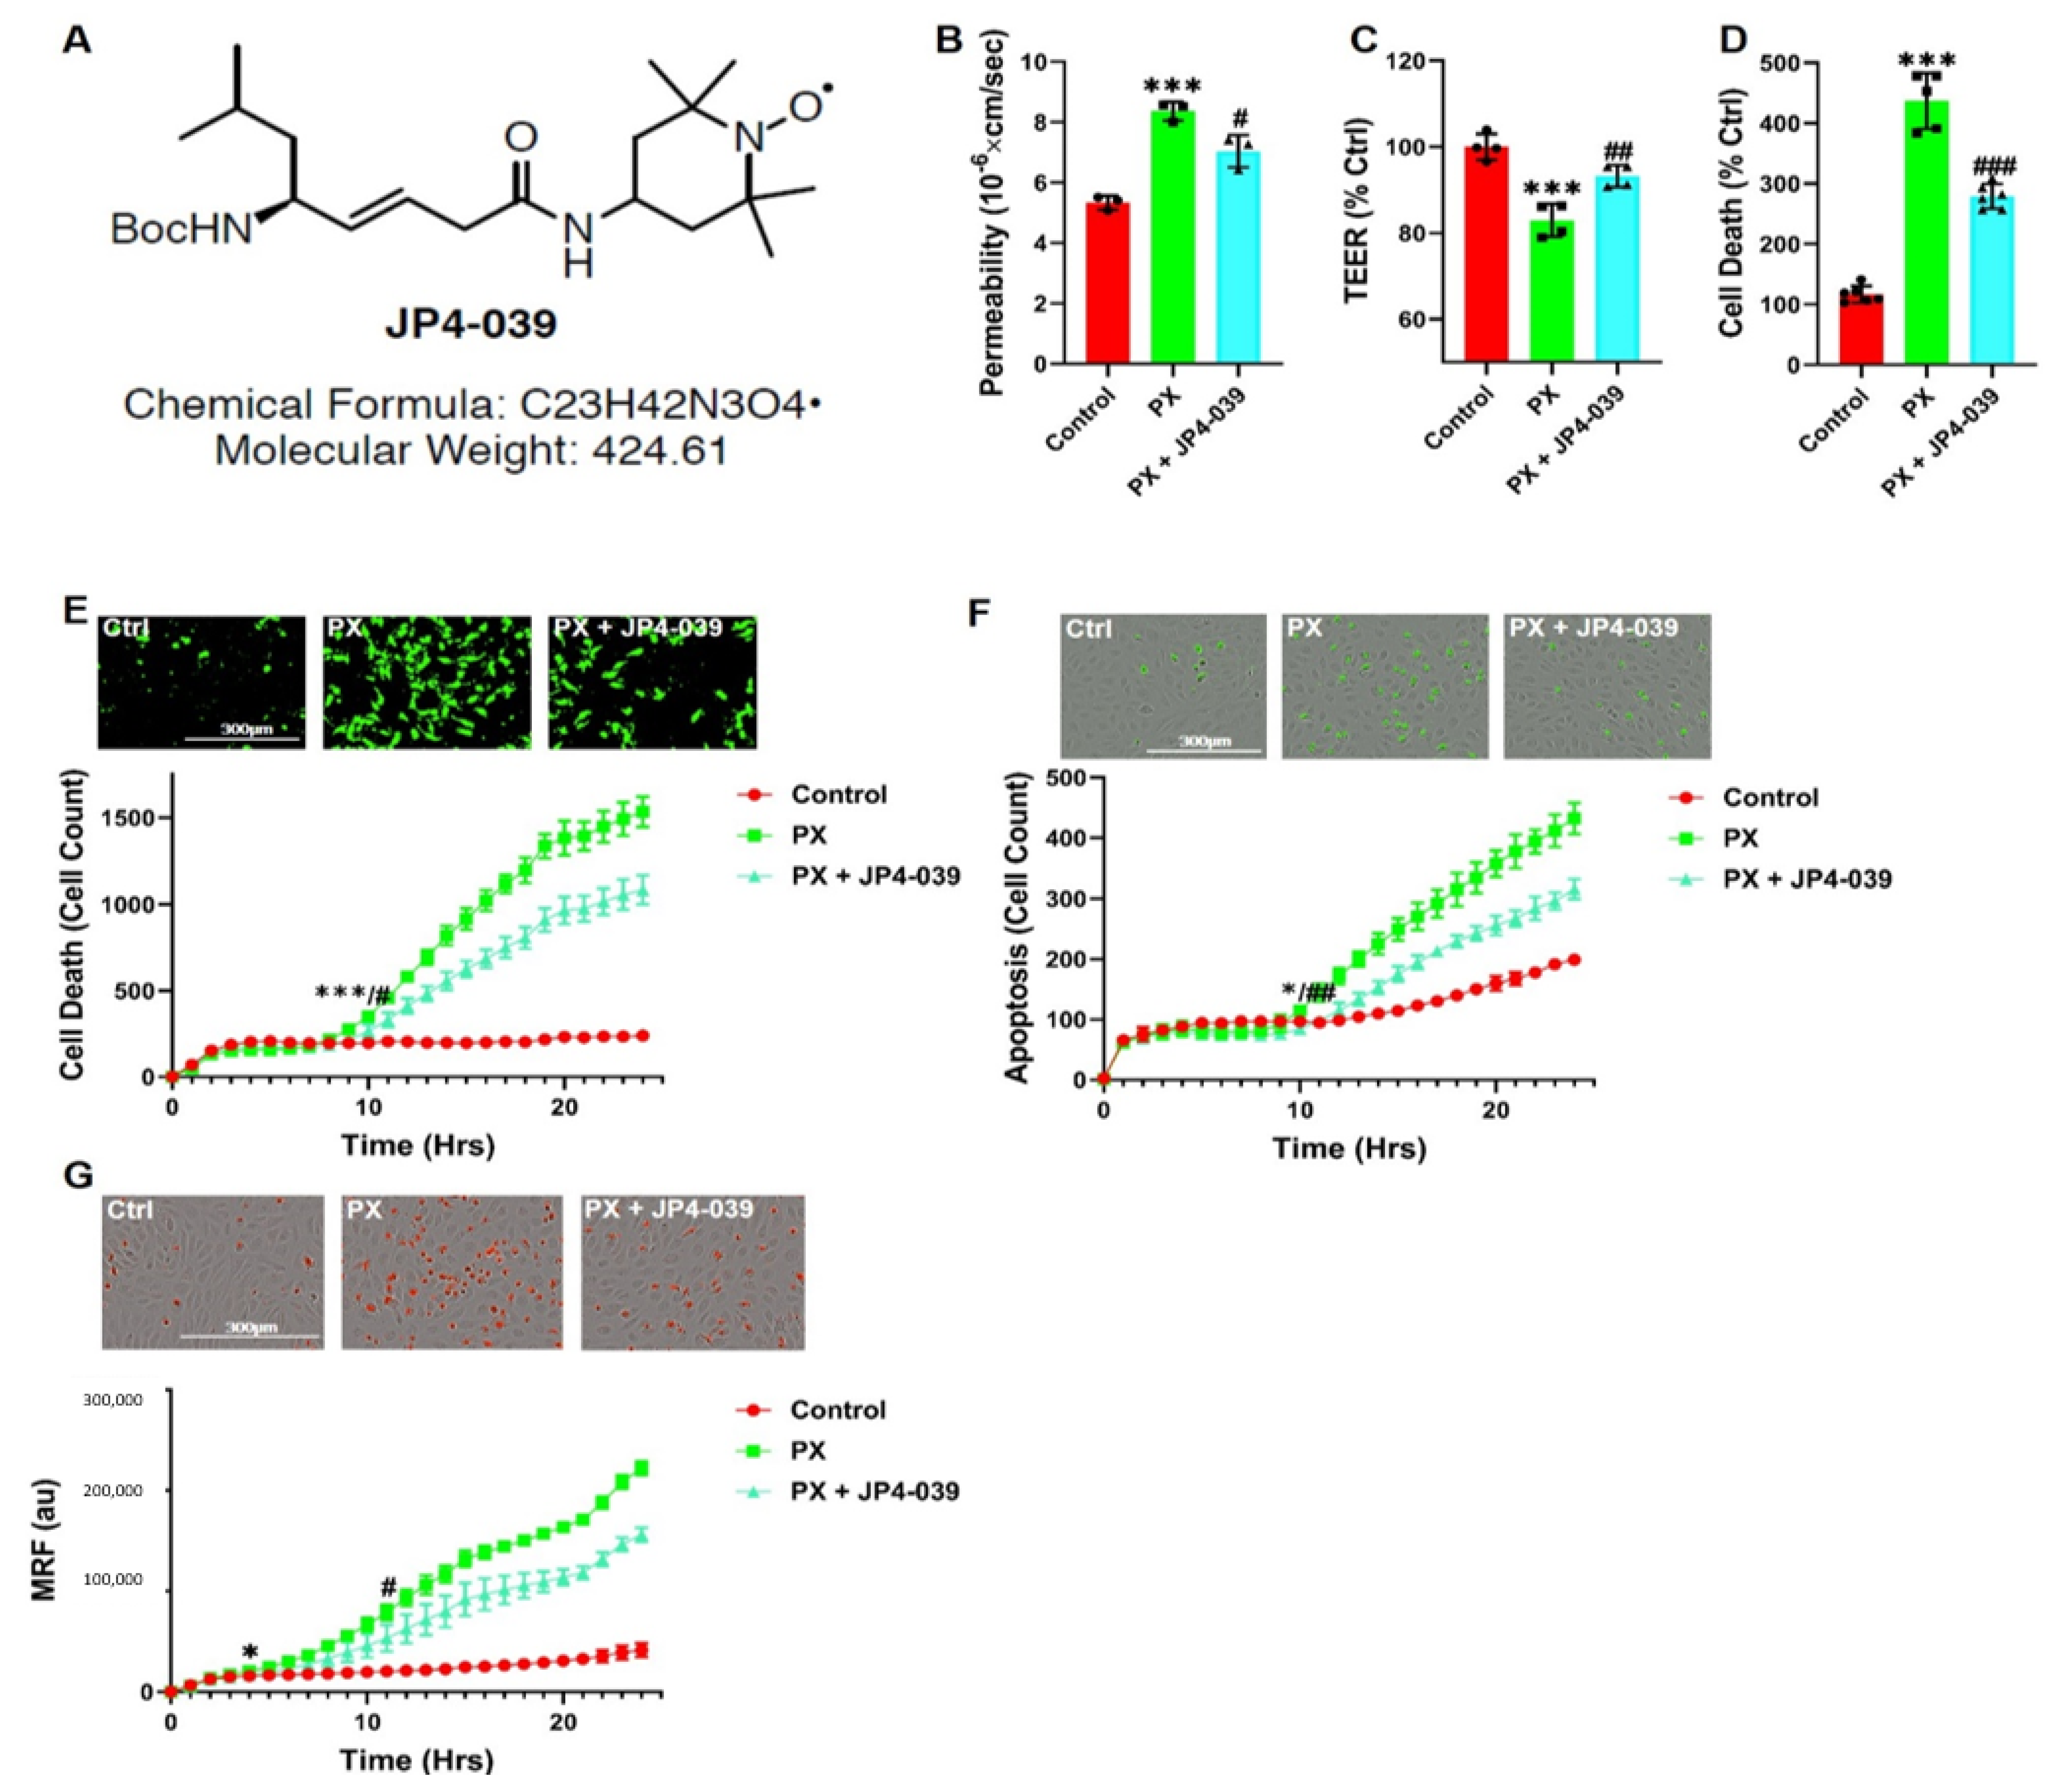
2.2. JP4-039
2.3. Media
2.4. BBB In-Vitro Model
2.5. Permeability Assay
2.6. TEER Assay
2.7. Cell Death by LDH Release
2.8. Cell Death by Cytotoxgreen Staining
2.9. Oxidative Stress Analysis
2.10. Apoptosis Analysis
2.11. Mitochondrial ROS Formation Analysis
2.12. Mitochondrial Membrane Depolarization Analysis
2.13. Lipid Peroxidation Analysis
2.14. Labile Iron Pool Measurements
2.15. Western Blot Assay
2.16. Immunocytochemistry
2.17. Gene Expression—rtPCR
2.18. Flow Cytometry (FACS)
2.19. Data and Statistical Analysis
3. Results
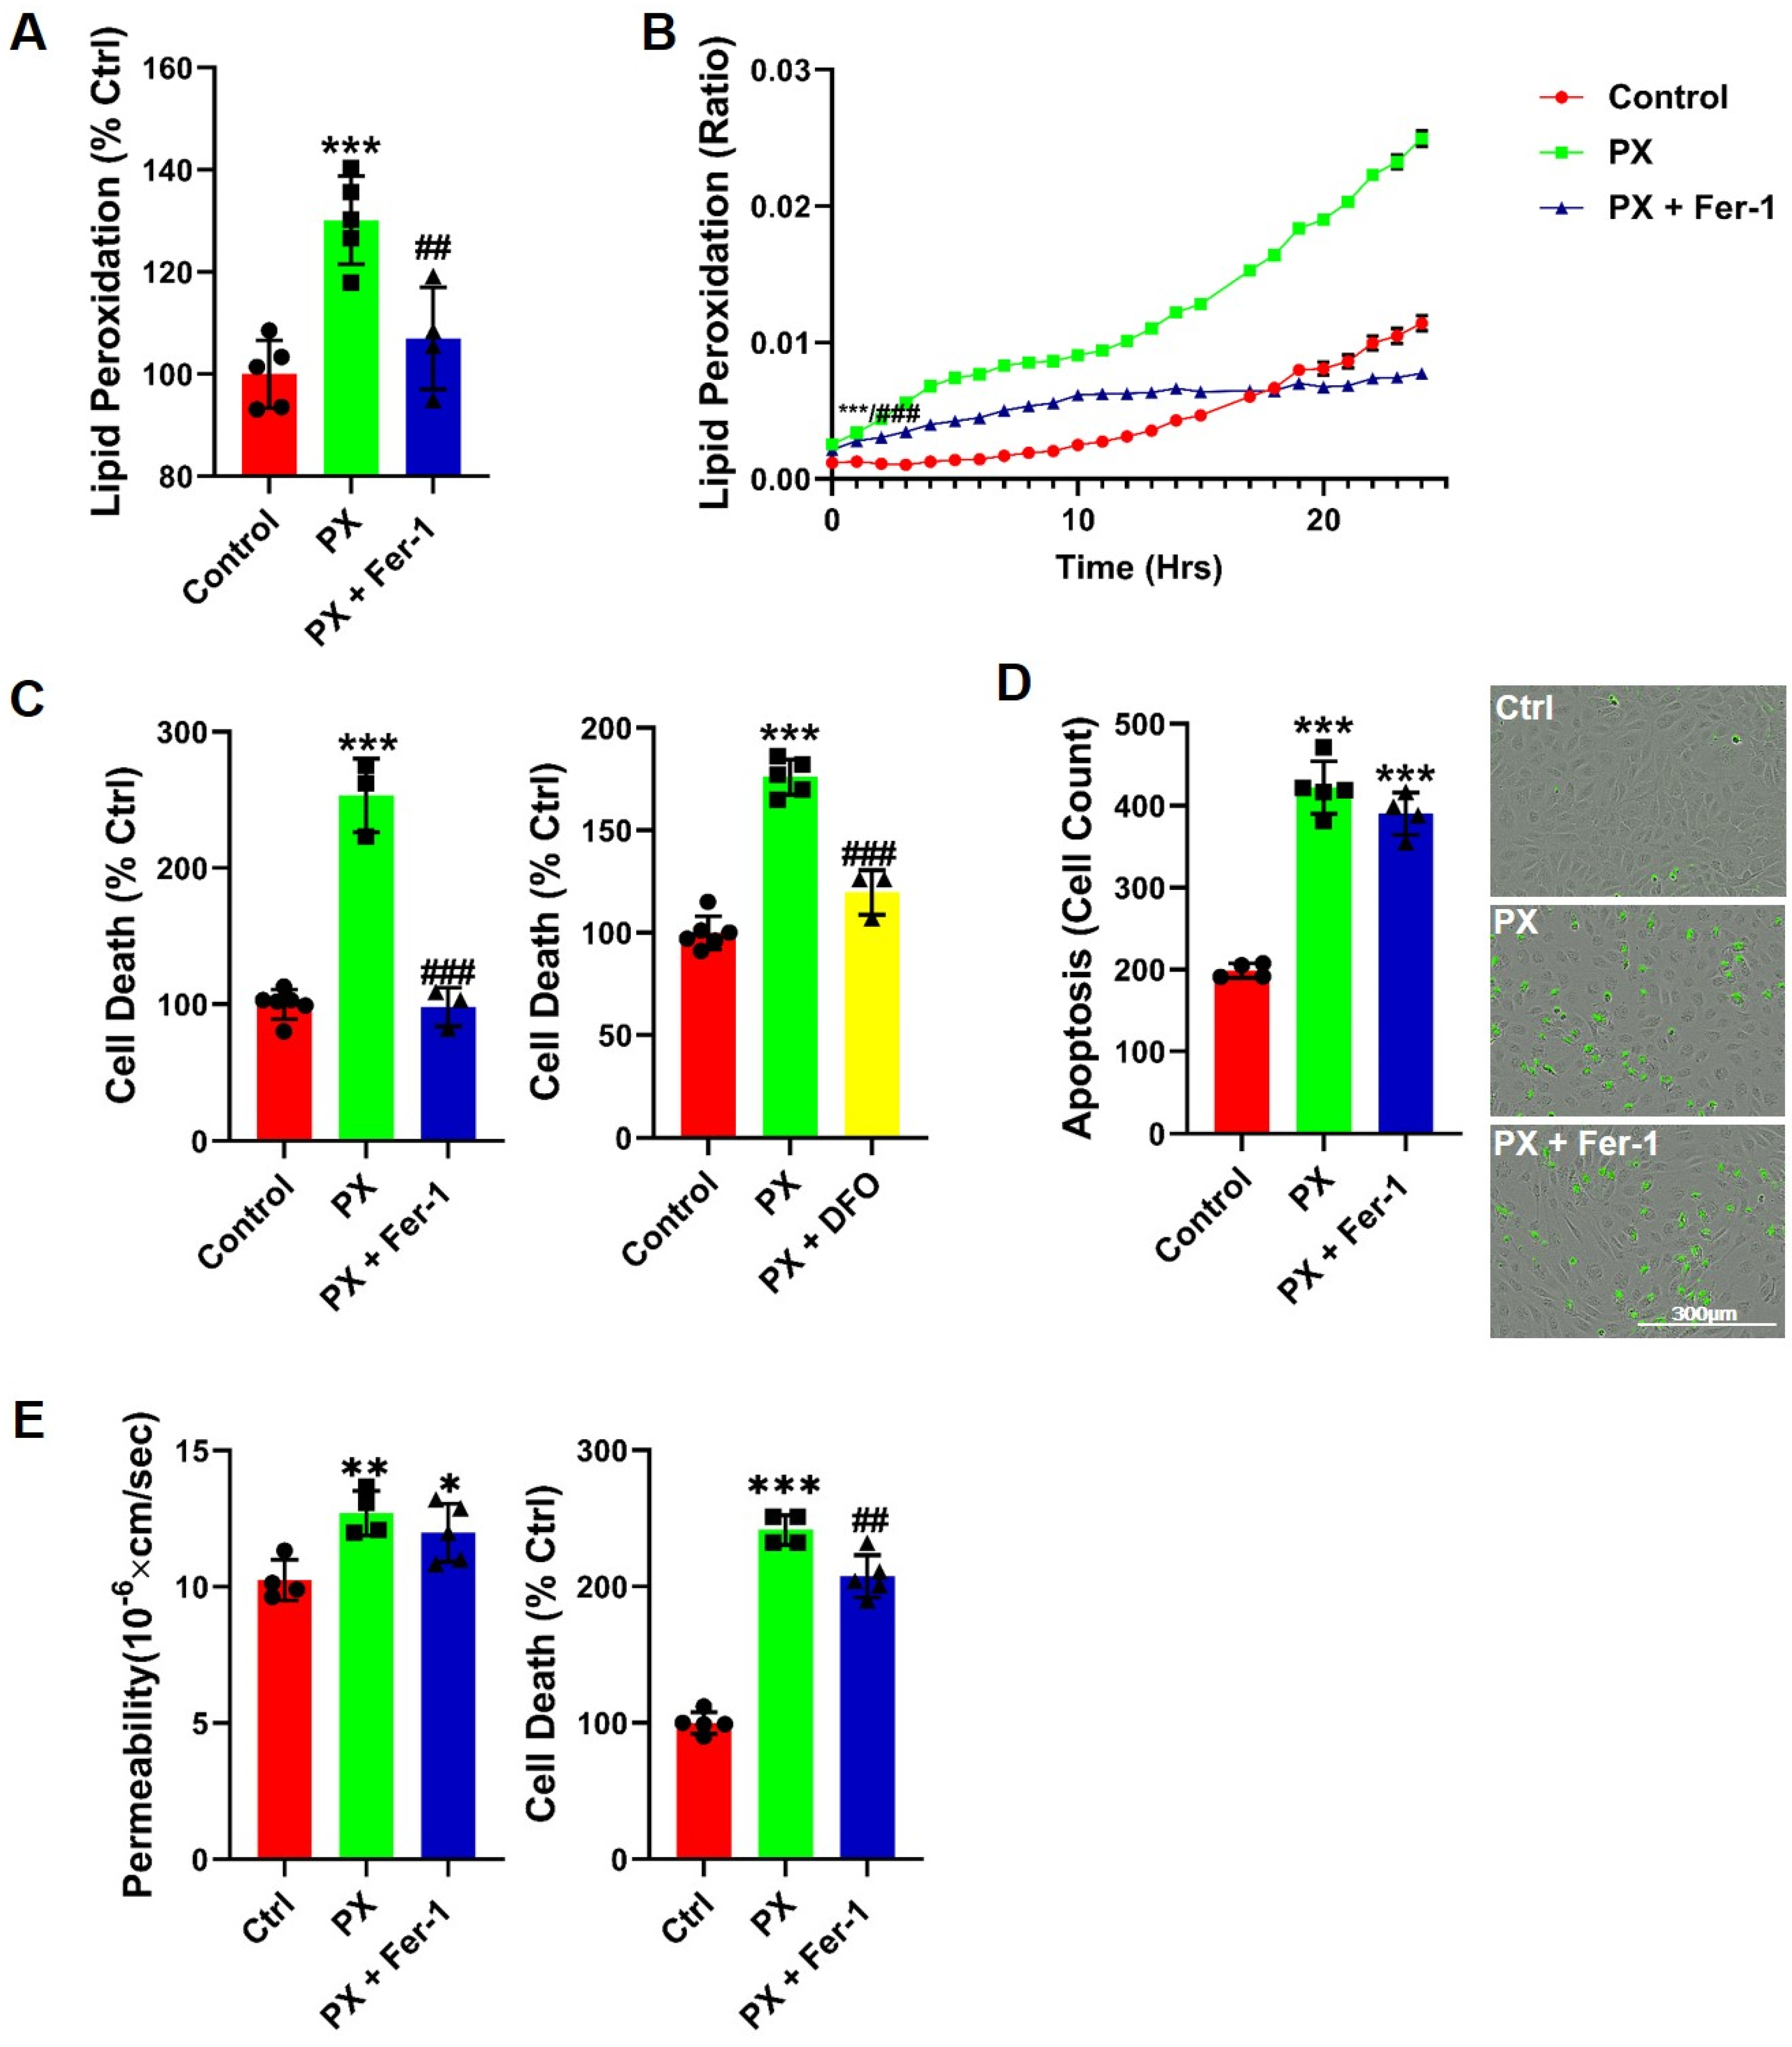
3.1. Lipid Peroxidation Is Rapidly Induced in a BBB Injury Model
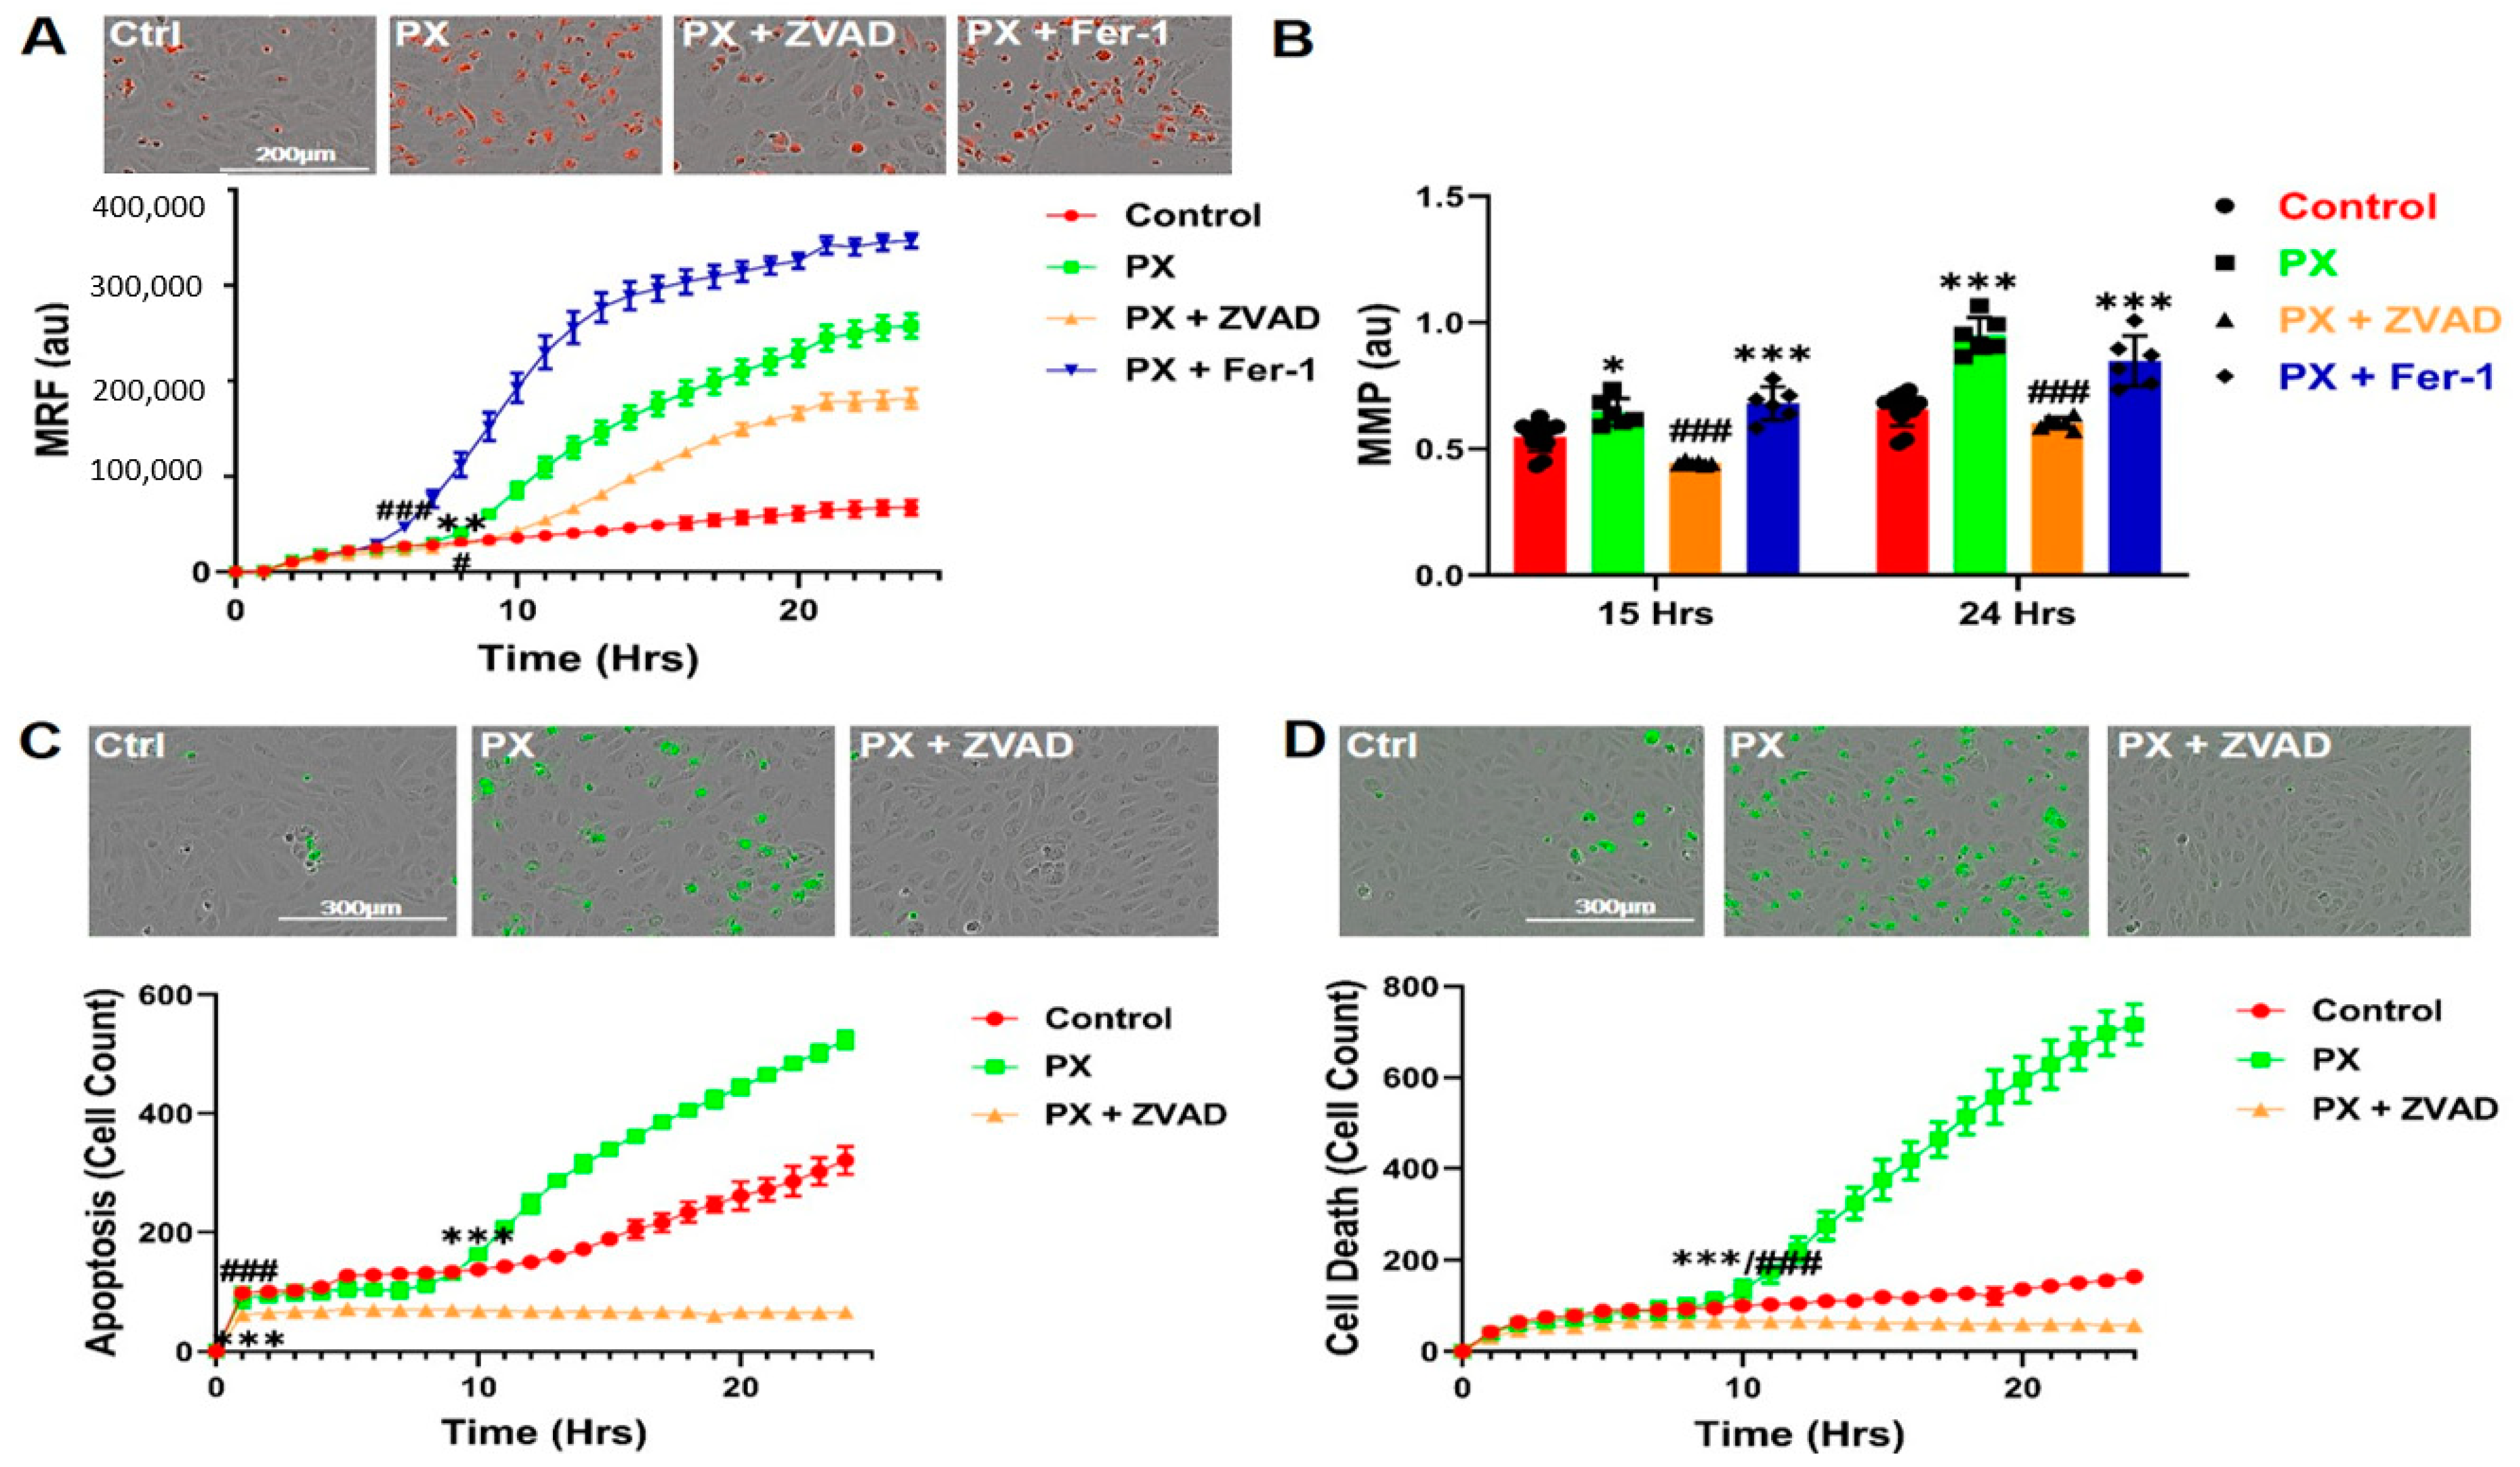
3.2. Kinetics of Mitochondrial ROS Formation
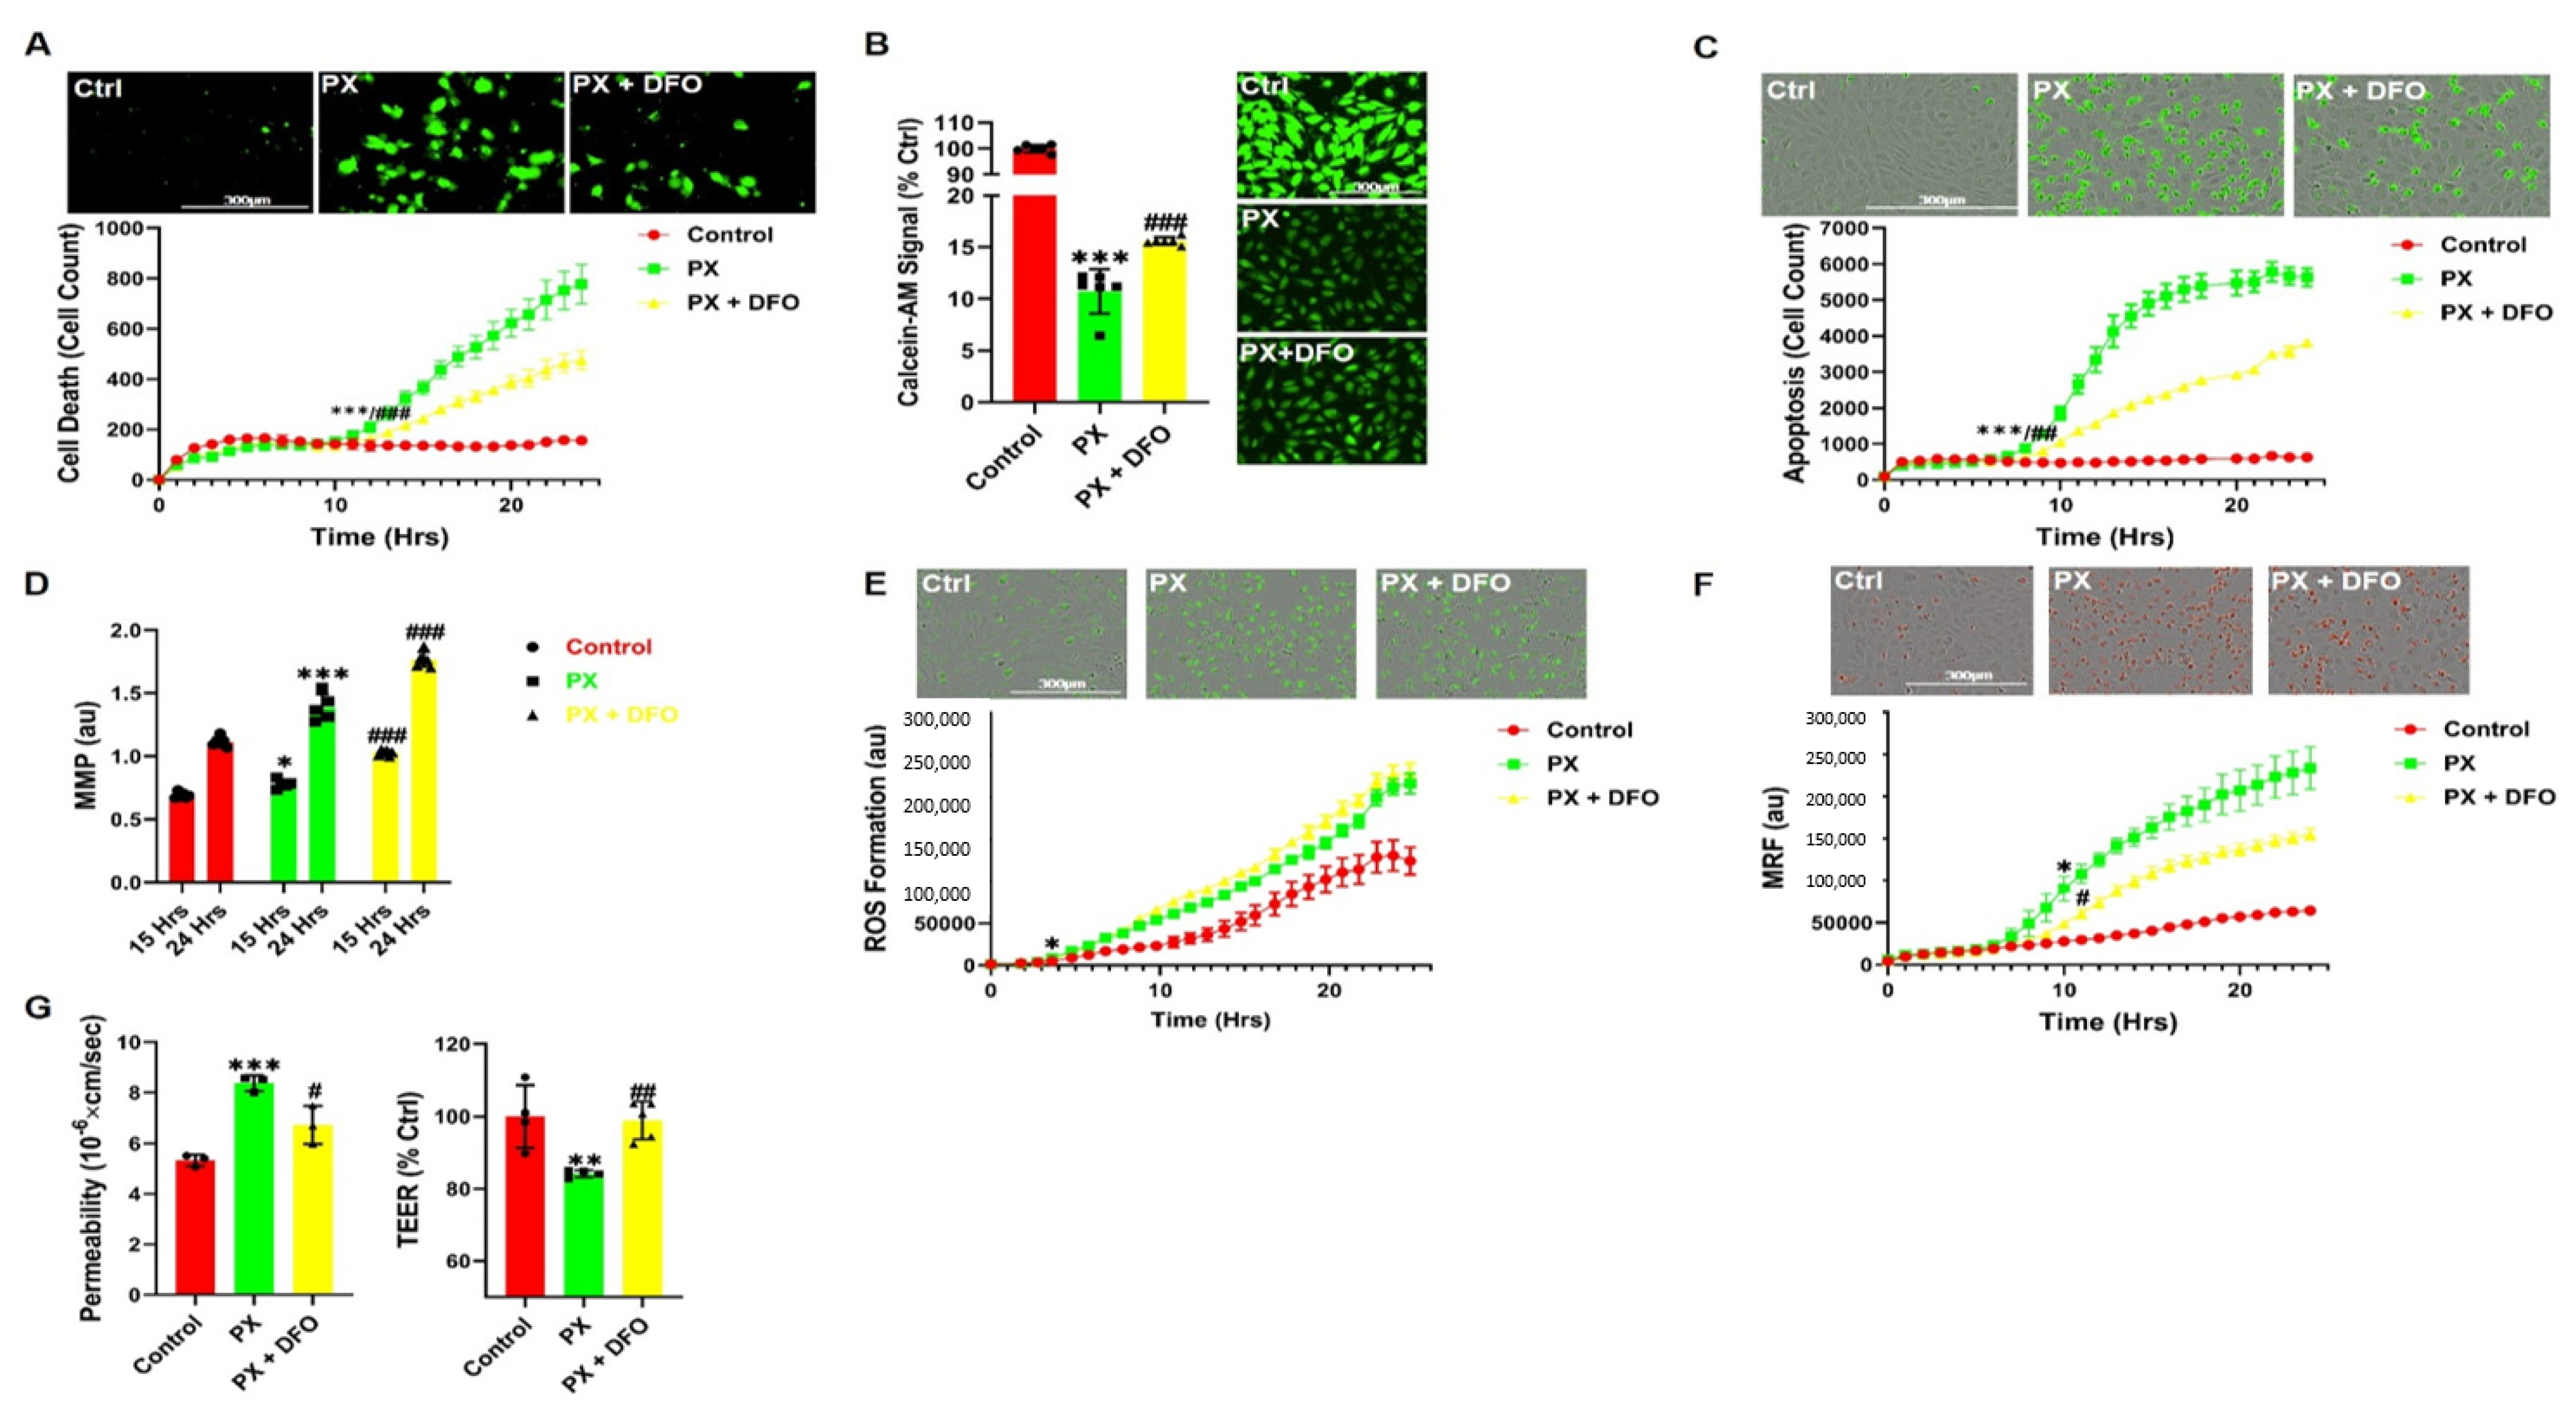
3.3. The Iron Chelator DFO Rescues Both Cell Viability and Functionality
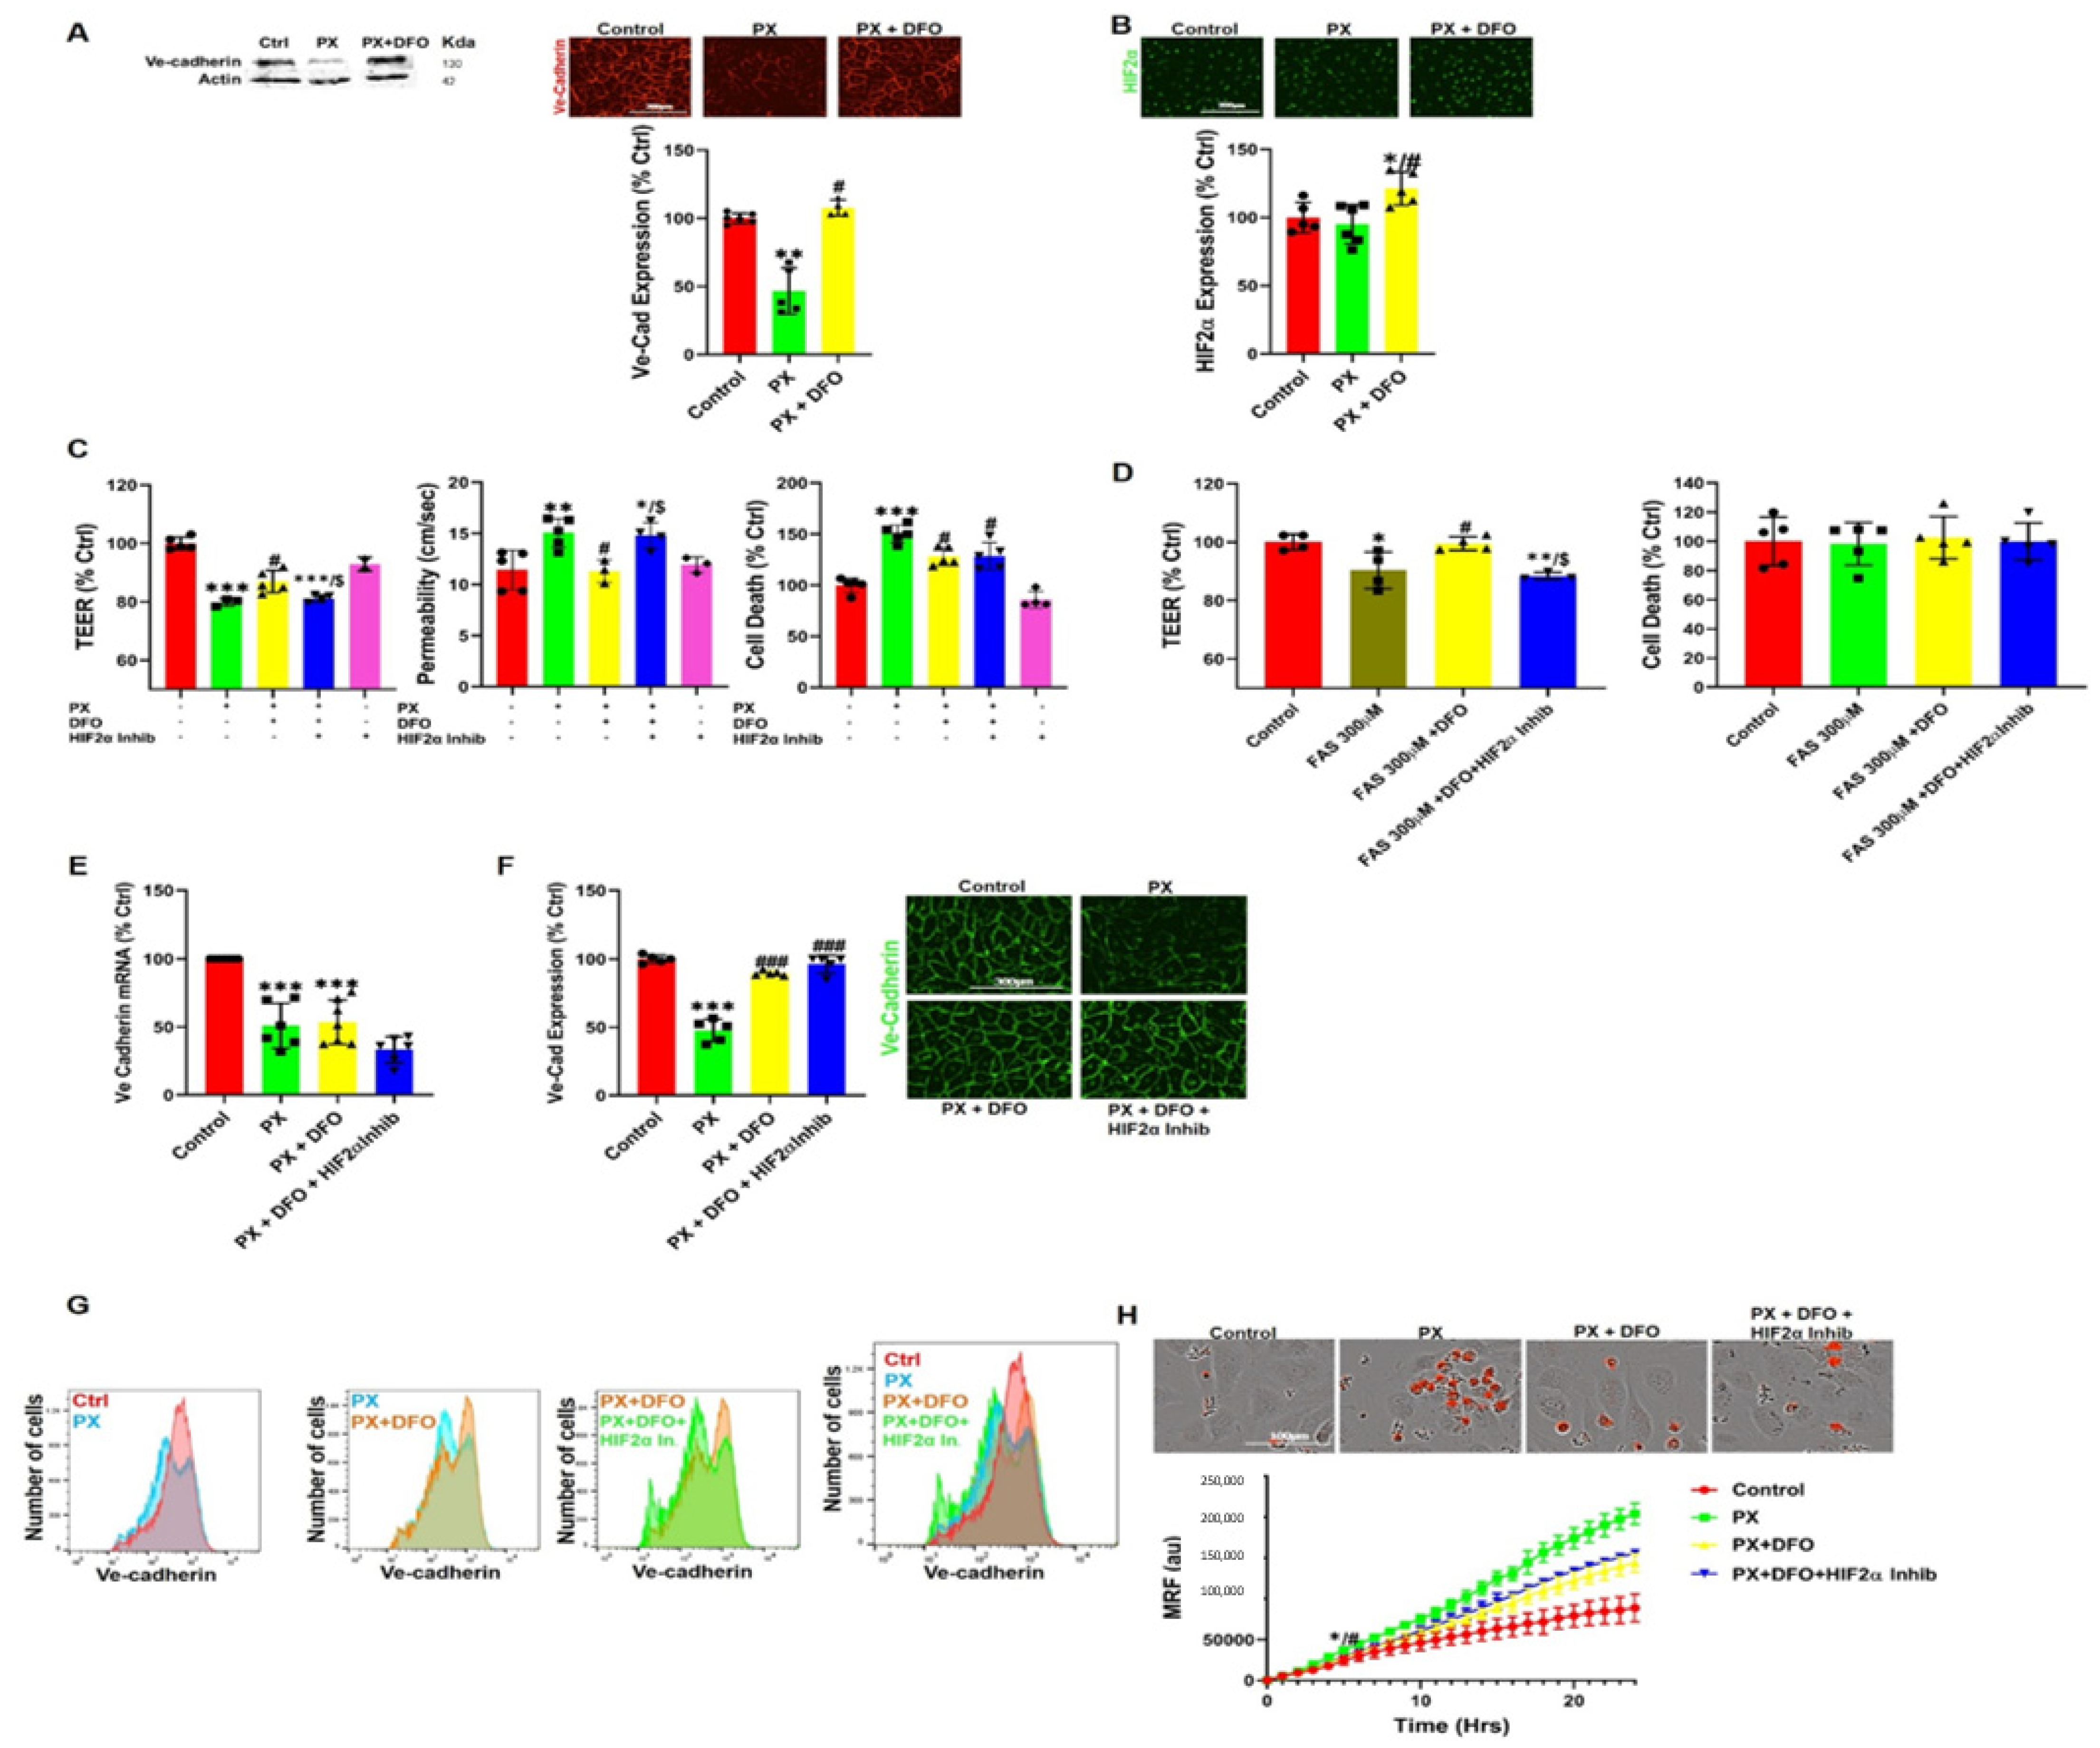
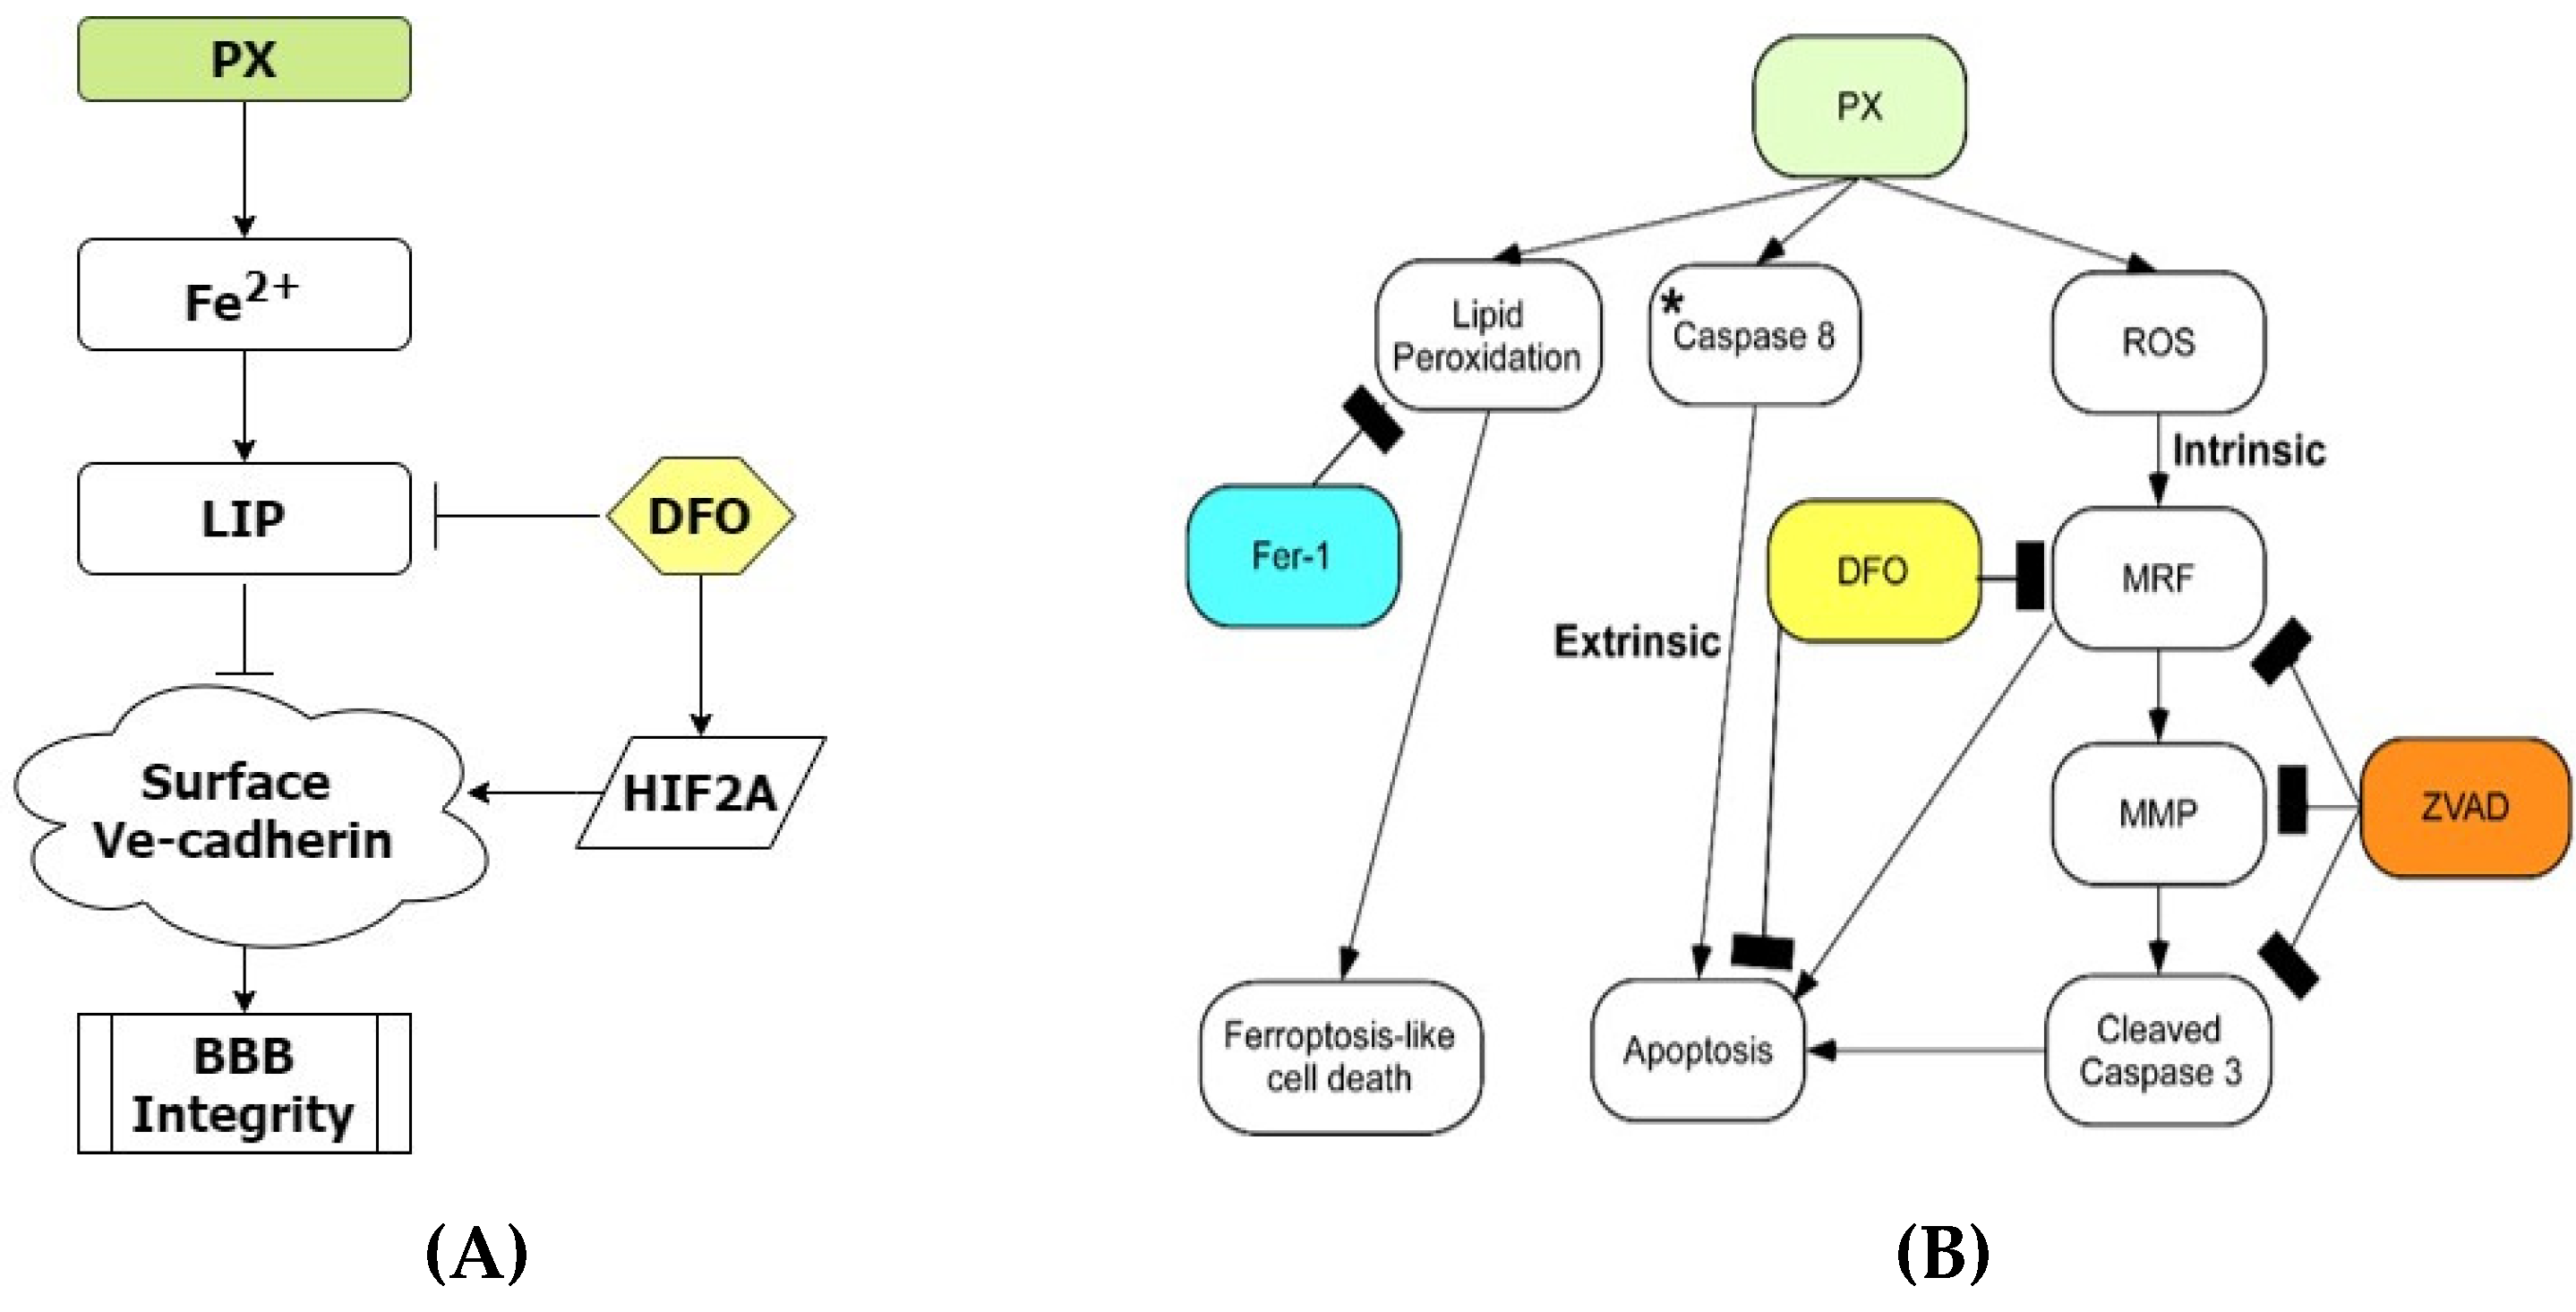
3.4. DFO Rescues BBB Integrity by Protecting Ve-Cadherin through Regulation of HIF2α
3.5. A New Chemical Entity, JP4-039, Rescues Barrier Functions
4. Discussion
5. Conclusions
Author Contributions
Funding
Institutional Review Board Statement
Informed Consent Statement
Data Availability Statement
Acknowledgments
Conflicts of Interest
References
- Zlokovic, B.V. The Blood-Brain Barrier in Health and Chronic Neurodegenerative Disorders. Neuron 2008, 57, 178–201. [Google Scholar] [CrossRef] [PubMed] [Green Version]
- Daneman, R. The blood-brain barrier in health and disease. Ann. Neurol. 2012, 72, 648–672. [Google Scholar] [CrossRef] [PubMed]
- Montagne, A.; Zhao, Z.; Zlokovic, B.V. Alzheimer’s disease: A matter of blood-brain barrier dysfunction? J. Exp. Med. 2017, 214, 3151–3169. [Google Scholar] [CrossRef] [PubMed]
- Brightman, M.W.; Reese, T.S. Junctions between intimately apposed cell membranes in the vertebrate brain. J. Cell Biol. 1969, 40, 648–677. [Google Scholar] [CrossRef]
- Reese, T.S.; Karnovsky, M.J. Fine structural localization of a blood-brain barrier to exogenous peroxidase. J. Cell Biol. 1967, 34, 207–217. [Google Scholar] [CrossRef] [Green Version]
- Zhao, Z.; Nelson, A.R.; Betsholtz, C.; Zlokovic, B.V. Establishment and Dysfunction of the Blood-Brain Barrier. Cell 2015, 163, 1064–1078. [Google Scholar] [CrossRef] [Green Version]
- Zlokovic, B.V. Neurovascular pathways to neurodegeneration in Alzheimer’s disease and other disorders. Nat. Rev. Neurosci. 2011, 12, 723–738. [Google Scholar] [CrossRef]
- Zlokovic, B.V. Neurovascular mechanisms of Alzheimer’s neurodegeneration. Trends Neurosci. 2005, 28, 202–208. [Google Scholar] [CrossRef]
- Brown, W.R.; Thore, C.R. Review: Cerebral microvascular pathology in ageing and neurodegeneration. Neuropathol. Appl. Neurobiol. 2011, 37, 56–74. [Google Scholar] [CrossRef] [Green Version]
- Zhong, Z.; Deane, R.; Ali, Z.; Parisi, M.; Shapovalov, Y.; O’Banion, M.K.; Stojanovic, K.; Sagare, A.; Boillee, S.; Cleveland, D.W.; et al. ALS-causing SOD1 mutants generate vascular changes prior to motor neuron degeneration. Nat. Neurosci. 2008, 11, 420–422. [Google Scholar] [CrossRef] [Green Version]
- Sweeney, M.D.; Sagare, A.P.; Zlokovic, B.V. Blood-brain barrier breakdown in Alzheimer disease and other neurodegenerative disorders. Nat. Rev. Neurol. 2018, 14, 133–150. [Google Scholar] [CrossRef] [PubMed]
- Dohgu, S.; Takata, F.; Matsumoto, J.; Kimura, I.; Yamauchi, A.; Kataoka, Y. Monomeric α-synuclein induces blood–brain barrier dysfunction through activated brain pericytes releasing inflammatory mediators in vitro. Microvasc. Res. 2019, 124, 61–66. [Google Scholar] [CrossRef]
- Conde, J.R.; Streit, W.J. Microglia in the aging brain. J. Neuropathol. Exp. Neurol. 2006, 65, 199–203. [Google Scholar] [CrossRef] [PubMed] [Green Version]
- Farrall, A.J.; Wardlaw, J.M. Blood-brain barrier: Ageing and microvascular disease—Systematic review and meta-analysis. Neurobiol. Aging 2009, 30, 337–352. [Google Scholar] [CrossRef] [PubMed]
- Ward, R.J.; Zucca, F.A.; Duyn, J.H.; Crichton, R.R.; Zecca, L. The role of iron in brain ageing and neurodegenerative disorders. Lancet Neurol. 2014, 13, 1045–1060. [Google Scholar] [CrossRef] [Green Version]
- Duyn, J.H. Study of brain anatomy with high-field MRI: Recent progress. Magn. Reson. Imaging 2010, 28, 1210–1215. [Google Scholar] [CrossRef] [Green Version]
- Hare, D.J.; Gerlach, M.; Riederer, P. Considerations for measuring iron in post-mortem tissue of Parkinson’s disease patients. J. Neural Transm. 2012, 119, 1515–1521. [Google Scholar] [CrossRef]
- Berg, D.; Hochstrasser, H. Iron metabolism in parkinsonian syndromes. Mov. Disord. 2006, 21, 1299–1310. [Google Scholar] [CrossRef]
- Wang, J.Y.; Zhuang, Q.Q.; Zhu, L.B.; Zhu, H.; Li, T.; Li, R.; Chen, S.F.; Huang, C.P.; Zhang, X.; Zhu, J.H. Meta-analysis of brain iron levels of Parkinson’s disease patients determined by postmortem and MRI measurements. Sci. Rep. 2016, 6, 36669. [Google Scholar] [CrossRef] [Green Version]
- Wang, L.; Sato, H.; Zhao, S.; Tooyama, I. Deposition of lactoferrin in fibrillar-type senile plaques in the brains of transgenic mouse models of Alzheimer’s disease. Neurosci. Lett. 2010, 481, 164–167. [Google Scholar] [CrossRef] [PubMed]
- Lane, D.J.R.; Ayton, S.; Bush, A.I. Iron and Alzheimer’s Disease: An Update on Emerging Mechanisms. J. Alzheimer’s Dis. 2018, 64, S379–S395. [Google Scholar] [CrossRef] [PubMed]
- Van Bergen, J.M.G.; Li, X.; Hua, J.; Schreiner, S.J.; Steininger, S.C.; Quevenco, F.C.; Wyss, M.; Gietl, A.F.; Treyer, V.; Leh, S.E.; et al. Colocalization of cerebral iron with Amyloid beta in Mild Cognitive Impairment. Sci. Rep. 2016, 6, 35514. [Google Scholar] [CrossRef] [PubMed] [Green Version]
- Berg, D.; Hochstrasser, H.; Schweitzer, K.J.; Riess, O. Disturbance of iron metabolism in Parkinson’s disease—Ultrasonography as a biomarker. Neurotox Res. 2006, 9, 1–13. [Google Scholar] [CrossRef]
- Ndayisaba, A.; Kaindlstorfer, C.; Wenning, G.K. Iron in neurodegeneration—Cause or consequence? Front. Neurosci. 2019, 13, 180. [Google Scholar] [CrossRef] [Green Version]
- Iturria-Medina, Y.; Sotero, R.C.; Toussaint, P.J.; Mateos-Pérez, J.M.; Evans, A.C.; Weiner, M.W.; Aisen, P.; Petersen, R.; Jack, C.R.; Jagust, W.; et al. Early role of vascular dysregulation on late-onset Alzheimer’s disease based on multifactorial data-driven analysis. Nat. Commun. 2016, 7, 1–14. [Google Scholar] [CrossRef] [PubMed]
- Malek, N.; Lawton, M.A.; Swallow, D.M.A.; Grosset, K.A.; Marrinan, S.L.; Bajaj, N.; Barker, R.A.; Burn, D.J.; Hardy, J.; Morris, H.R.; et al. Vascular disease and vascular risk factors in relation to motor features and cognition in early Parkinson’s disease. Mov. Disord. 2016, 31, 1518–1526. [Google Scholar] [CrossRef] [Green Version]
- Montagne, A.; Barnes, S.R.; Sweeney, M.D.; Halliday, M.R.; Sagare, A.P.; Zhao, Z.; Toga, A.W.; Jacobs, R.E.; Liu, C.Y.; Amezcua, L.; et al. Blood-Brain barrier breakdown in the aging human hippocampus. Neuron 2015, 85, 296–302. [Google Scholar] [CrossRef] [Green Version]
- Qian, Z.M.; Ke, Y. Brain iron transport. Biol. Rev. 2019, 94, 1672–1684. [Google Scholar] [CrossRef]
- Kim, G.H.; Kim, J.E.; Rhie, S.J.; Yoon, S. The Role of Oxidative Stress in Neurodegenerative Diseases. Exp. Neurobiol. 2015, 24, 325–340. [Google Scholar] [CrossRef]
- Singh, A.; Kukreti, R.; Saso, L.; Kukreti, S. Oxidative stress: A key modulator in neurodegenerative diseases. Molecules 2019, 24, 1583. [Google Scholar] [CrossRef] [Green Version]
- Li, J.; Wuliji, O.; Li, W.; Jiang, Z.G.; Ghanbari, H.A. Oxidative stress and neurodegenerative disorders. Int. J. Mol. Sci. 2013, 14, 24438–24475. [Google Scholar] [CrossRef] [Green Version]
- Dasuri, K.; Zhang, L.; Keller, J.N. Oxidative stress, neurodegeneration, and the balance of protein degradation and protein synthesis. Free Radic. Biol. Med. 2013, 62, 170–185. [Google Scholar] [CrossRef]
- Ray, P.D.; Huang, B.W.; Tsuji, Y. Reactive oxygen species (ROS) homeostasis and redox regulation in cellular signaling. Cell. Signal. 2012, 24, 981–990. [Google Scholar] [CrossRef] [Green Version]
- Gandhi, S.; Abramov, A.Y.; Singh, A.; Kukreti, R.; Saso, L.; Kukreti, S.; Dasuri, K.; Zhang, L.; Keller, J.N.; Akhter, M.S.; et al. Reactive oxygen species enhance the migration of monocytes across the blood-brain barrier in vitro. Front. Aging Neurosci. 2012, 24, 83–85. [Google Scholar] [CrossRef] [Green Version]
- Kety, S.S. The general metabolism of the brain in vivo. In Metabolism of the Nervous System; Elsevier: Amsterdam, The Netherlands, 1957; pp. 221–237. [Google Scholar]
- Wang, X.; Michaelis, E.K. Selective neuronal vulnerability to oxidative stress in the brain. Front. Aging Neurosci. 2010, 2, 12. [Google Scholar] [CrossRef]
- Sayre, L.M.; Perry, G.; Harris, P.L.R.; Liu, Y.; Schubert, K.A.; Smith, M.A. In situ oxidative catalysis by neurofibrillary tangles and senile plaques in Alzheimer’s disease: A central role for bound transition metals. J. Neurochem. 2000, 74, 270–279. [Google Scholar] [CrossRef]
- Winkler, E.A.; Nishida, Y.; Sagare, A.P.; Rege, S.V.; Bell, R.D.; Perlmutter, D.; Sengillo, J.D.; Hillman, S.; Kong, P.; Nelson, A.R.; et al. GLUT1 reductions exacerbate Alzheimer’s disease vasculo-neuronal dysfunction and degeneration. Nat. Neurosci. 2015, 18, 521–530. [Google Scholar] [CrossRef] [PubMed] [Green Version]
- Tarafdar, A.; Pula, G. The role of NADPH oxidases and oxidative stress in neurodegenerative disorders. Int. J. Mol. Sci. 2018, 19, 3824. [Google Scholar] [CrossRef] [Green Version]
- Aday, S.; Cecchelli, R.; Hallier-Vanuxeem, D.; Dehouck, M.P.; Ferreira, L. Stem Cell-Based Human Blood-Brain Barrier Models for Drug Discovery and Delivery. Trends Biotechnol. 2016, 34, 382–393. [Google Scholar] [CrossRef] [PubMed] [Green Version]
- Cecchelli, R.; Aday, S.; Sevin, E.; Almeida, C.; Culot, M.; Dehouck, L.; Coisne, C.; Engelhardt, B.; Dehouck, M.P.; Ferreira, L. A stable and reproducible human blood-brain barrier model derived from hematopoietic stem cells. PLoS ONE 2014, 9, e99733. [Google Scholar] [CrossRef] [PubMed] [Green Version]
- Cecchelli, R.; Berezowski, V.; Lundquist, S.; Culot, M.; Renftel, M.; Dehouck, M.P.; Fenart, L. Modelling of the blood—Brain barrier in drug discovery and development. Nat. Rev. Drug Discov. 2007, 6, 650–661. [Google Scholar] [CrossRef]
- Ravid, O.; Elhaik Goldman, S.; Macheto, D.; Bresler, Y.; De Oliveira, R.I.; Liraz-Zaltsman, S.; Gosselet, F.; Dehouck, L.; Beeri, M.S.; Cooper, I. Blood-brain barrier cellular responses toward organophosphates: Natural compensatory processes and exogenous interventions to rescue barrier properties. Front. Cell. Neurosci. 2018, 12, 359. [Google Scholar] [CrossRef] [PubMed] [Green Version]
- Israelov, H.; Ravid, O.; Atrakchi, D.; Rand, D.; Elhaik, S.; Bresler, Y.; Twitto-Greenberg, R.; Omesi, L.; Liraz-Zaltsman, S.; Gosselet, F.; et al. Caspase-1 has a critical role in blood-brain barrier injury and its inhibition contributes to multifaceted repair. J. Neuroinflamm. 2020, 17, 267. [Google Scholar] [CrossRef] [PubMed]
- Martinez, A.; Al-Ahmad, A.J. Effects of glyphosate and aminomethylphosphonic acid on an isogeneic model of the human blood-brain barrier. Toxicol. Lett. 2019, 304, 39–49. [Google Scholar] [CrossRef] [PubMed]
- Song, X.; Pope, C.; Murthy, R.; Shaikh, J.; Lal, B.; Bressler, J.P. Interactive effects of paraoxon and pyridostigmine on blood-brain barrier integrity and cholinergic toxicity. Toxicol. Sci. 2004, 78, 241–247. [Google Scholar] [CrossRef]
- Shah, H.K.; Sharma, T.; Banerjee, B.D. Organochlorine pesticides induce inflammation, ROS production, and DNA damage in human epithelial ovary cells: An in vitro study. Chemosphere 2020, 246, 125691. [Google Scholar] [CrossRef]
- Weis, G.C.C.; Assmann, C.E.; Cadoná, F.C.; Bonadiman, B.D.S.R.; de Oliveira Alves, A.; Machado, A.K.; Duarte, M.M.M.F.; da Cruz, I.B.M.; Costabeber, I.H. Immunomodulatory effect of mancozeb, chlorothalonil, and thiophanate methyl pesticides on macrophage cells. Ecotoxicol. Environ. Saf. 2019, 182, 109420. [Google Scholar] [CrossRef]
- Ghosh, R.; Siddharth, M.; Singh, N.; Kare, P.K.; Dev Banerjee, B.; Wadhwa, N.; Tripathi, A.K. Organochlorine pesticide-mediated induction of NADPH oxidase and nitric-oxide synthase in endothelial cell. J. Clin. Diagnostic. Res. 2017, 11, BC09–BC12. [Google Scholar] [CrossRef] [PubMed]
- Rao, R.K.; Basuroy, S.; Rao, V.U.; Karnaky, K.J.; Gupta, A. Tyrosine phosphorylation and dissociation of occludin-ZO-1 and E-cadherin-β-catenin complexes from the cytoskeleton by oxidative stress. Biochem. J. 2002, 368, 471–481. [Google Scholar] [CrossRef]
- Scheuermann, T.H.; Li, Q.; Ma, H.W.; Key, J.; Zhang, L.; Chen, R.; Garcia, J.A.; Naidoo, J.; Longgood, J.; Frantz, D.E.; et al. Allosteric inhibition of hypoxia inducible factor-2 with small molecules. Nat. Chem. Biol. 2013, 9, 271–276. [Google Scholar] [CrossRef]
- Wager, T.T.; Hou, X.; Verhoest, P.R.; Villalobos, A. Central Nervous System Multiparameter Optimization Desirability: Application in Drug Discovery. ACS Chem. Neurosci. 2016, 7, 767–775. [Google Scholar] [CrossRef] [Green Version]
- Skoda, E.M.; Sacher, J.R.; Kazancioglu, M.Z.; Saha, J.; Wipf, P. An uncharged oxetanyl sulfoxide as a covalent modifier for improving aqueous solubility. ACS Med. Chem. Lett. 2014, 5, 900–904. [Google Scholar] [CrossRef]
- Frantz, M.C.; Pierce, J.G.; Pierce, J.M.; Kangying, L.; Qingwei, W.; Johnson, M.; Wipf, P. Large-scale asymmetric synthesis of the bioprotective agent JP4-039 and analogs. Org. Lett. 2011, 13, 2318–2321. [Google Scholar] [CrossRef] [Green Version]
- Dehouck, M.-P.; Méresse, S.; Delorme, P.; Fruchart, J.-C.; Cecchelli, R. An Easier, Reproducible, and Mass-Production Method to Study the Blood–Brain Barrier In Vitro. J. Neurochem. 1990, 54, 1798–1801. [Google Scholar] [CrossRef]
- Pap, E.H.W.; Drummen, G.P.C.; Winter, V.J.; Kooij, T.W.A.; Rijken, P.; Wirtz, K.W.A.; Op Den Kamp, J.A.F.; Hage, W.J.; Post, J.A. Ratio-fluorescence microscopy of lipid oxidation in living cells using C11-BODIPY(58l/591). FEBS Lett. 1999, 453, 278–282. [Google Scholar] [CrossRef] [Green Version]
- Weston, S.A.; Parish, C.R. New fluorescent dyes for lymphocyte migration studies. Analysis by flow cytometry and fluorescence microscopy. J. Immunol. Methods 1990, 133, 87–97. [Google Scholar] [CrossRef]
- Weston, S.A.; Parish, C.R. Calcein: A novel marker for lymphocytes which enter lymph nodes. Cytometry 1992, 13, 739–749. [Google Scholar] [CrossRef] [PubMed]
- Breuer, W.; Epsztejn, S.; Cabantchik, Z.I. Iron acquired from transferrin by K562 cells is delivered into a cytoplasmic pool of chelatable iron(II). J. Biol. Chem. 1995, 270, 24209–24215. [Google Scholar] [CrossRef] [PubMed] [Green Version]
- Akhter, M.S.; Uddin, M.A.; Kubra, K.T.; Barabutis, N. P53-induced reduction of lipid peroxidation supports brain microvascular endothelium integrity. J. Pharmacol. Sci. 2019, 141, 83–85. [Google Scholar] [CrossRef]
- West, J.D.; Marnett, L.J. Endogenous reactive intermediates as modulators of cell signaling and cell death. Chem. Res. Toxicol. 2006, 19, 173–194. [Google Scholar] [CrossRef] [PubMed]
- Greenberg, M.E.; Li, X.M.; Gugiu, B.G.; Gu, X.; Qin, J.; Salomon, R.G.; Hazen, S.L. The lipid whisker model of the structure of oxidized cell membranes. J. Biol. Chem. 2008, 283, 2385–2396. [Google Scholar] [CrossRef] [PubMed] [Green Version]
- Dixon, S.J.; Lemberg, K.M.; Lamprecht, M.R.; Skouta, R.; Zaitsev, E.M.; Gleason, C.E.; Patel, D.N.; Bauer, A.J.; Cantley, A.M.; Yang, W.S.; et al. Ferroptosis: An iron-dependent form of nonapoptotic cell death. Cell 2012, 149, 1060–1072. [Google Scholar] [CrossRef] [PubMed] [Green Version]
- Yang, W.S.; Stockwell, B.R. Ferroptosis: Death by Lipid Peroxidation. Trends Cell Biol. 2016, 26, 165–176. [Google Scholar] [CrossRef] [PubMed] [Green Version]
- Yang, W.S.; Stockwell, B.R. Synthetic Lethal Screening Identifies Compounds Activating Iron-Dependent, Nonapoptotic Cell Death in Oncogenic-RAS-Harboring Cancer Cells. Chem. Biol 2008, 15, 234–245. [Google Scholar] [CrossRef] [PubMed] [Green Version]
- Fleury, C.; Mignotte, B.; Vayssière, J.L. Mitochondrial reactive oxygen species in cell death signaling. Biochimie 2002, 84, 131–141. [Google Scholar] [CrossRef]
- Kroemer, G.; Galluzzi, L.; Brenner, C. Mitochondrial membrane permeabilization in cell death. Physiol. Rev. 2007, 87, 99–163. [Google Scholar] [CrossRef]
- Bock, F.J.; Tait, S.W.G. Mitochondria as multifaceted regulators of cell death. Nat. Rev. Mol. Cell Biol. 2020, 21, 85–100. [Google Scholar] [CrossRef]
- Jomova, K.; Valko, M. Advances in metal-induced oxidative stress and human disease. Toxicology 2011, 283, 65–87. [Google Scholar] [CrossRef]
- Thomas, C.; Mackey, M.M.; Diaz, A.A.; Cox, D.P. Hydroxyl radical is produced via the Fenton reaction in submitochondrial particles under oxidative stress: Implications for diseases associated with iron accumulation. Redox Rep. 2009, 14, 102–108. [Google Scholar] [CrossRef]
- Gavard, J.; Gutkind, J.S. VEGF Controls endothelial-cell permeability promoting β-arrestin-dependent Endocytosis VE-cadherin. Nat. Cell Biol. 2006, 8, 1223–1234. [Google Scholar] [CrossRef]
- Gong, H.; Rehman, J.; Tang, H.; Wary, K.; Mittal, M.; Chatturvedi, P.; Zhao, Y.; Komorova, Y.A.; Vogel, S.M.; Malik, A.B. HIF2α signaling inhibits adherens junctional disruption in acute lung injury. J. Clin. Investig. 2015, 125, 652–664. [Google Scholar] [CrossRef] [PubMed] [Green Version]
- Le Bras, A.; Lionneton, F.; Mattot, V.; Lelièvre, E.; Caetano, B.; Spruyt, N.; Soncin, F. HIF-2α specifically activates the VE-cadherin promoter independently of hypoxia and in synergy with Ets-1 through two essential ETS-binding sites. Oncogene 2007, 26, 7480–7489. [Google Scholar] [CrossRef] [Green Version]
- Imai, T.; Iwata, S.; Hirayama, T.; Nagasawa, H.; Nakamura, S.; Shimazawa, M.; Hara, H. Intracellular Fe 2+ accumulation in endothelial cells and pericytes induces blood-brain barrier dysfunction in secondary brain injury after brain hemorrhage. Sci. Rep. 2019, 9, 6228. [Google Scholar] [CrossRef] [Green Version]
- Hentze, M.W.; Muckenthaler, M.U.; Andrews, N.C. Balancing acts: Molecular control of mammalian iron metabolism. Cell 2004, 117, 285–297. [Google Scholar] [CrossRef] [Green Version]
- Lawen, A.; Lane, D.J.R. Mammalian iron homeostasis in health and disease: Uptake, storage, transport, and molecular mechanisms of action. Antioxid. Redox Signal. 2013, 18, 2473–2507. [Google Scholar] [CrossRef]
- Krainz, T.; Gaschler, M.M.; Lim, C.; Sacher, J.R.; Stockwell, B.R.; Wipf, P. A mitochondrial-targeted nitroxide is a potent inhibitor of ferroptosis. ACS Cent. Sci. 2016, 2, 653–659. [Google Scholar] [CrossRef]
- Hayden, K.M.; Norton, M.C.; Darcey, D.; Østbye, T.; Zandi, P.P.; Breitner, J.C.S.; Welsh-Bohmer, K.A. Occupational exposure to pesticides increases the risk of incident AD: The Cache County Study. Neurology 2010, 74, 1524–1530. [Google Scholar] [CrossRef] [Green Version]
- Baldi, I.; Lebailly, P.; Mohammed-Brahim, B.; Letenneur, L.; Dartigues, J.F.; Brochard, P. Neurodegenerative diseases and exposure to pesticides in the elderly. Am. J. Epidemiol. 2003, 157, 409–414. [Google Scholar] [CrossRef] [Green Version]
- Brouwer, M.; Huss, A.; van der Mark, M.; Nijssen, P.C.G.; Mulleners, W.M.; Sas, A.M.G.; van Laar, T.; de Snoo, G.R.; Kromhout, H.; Vermeulen, R.C.H. Environmental exposure to pesticides and the risk of Parkinson’s disease in the Netherlands. Environ. Int. 2017, 107, 100–110. [Google Scholar] [CrossRef] [PubMed]
- Medehouenou, T.C.M.; Ayotte, P.; Carmichael, P.H.; Kröger, E.; Verreault, R.; Lindsay, J.; Dewailly, É.; Tyas, S.L.; Bureau, A.; Laurin, D. Exposure to polychlorinated biphenyls and organochlorine pesticides and risk of dementia, Alzheimer’s disease and cognitive decline in an older population: A prospective analysis from the Canadian Study of Health and Aging. Environ. Health. A Glob. Access. Sci. Source 2019, 18, 57. [Google Scholar] [CrossRef] [PubMed] [Green Version]
- Gupta, A.; Agarwal, R.; Shukla, G.S. Functional impairment of blood -brain barrier following pesticide exposure during early development in rats. Hum. Exp. Toxicol. 1999, 18, 174–179. [Google Scholar] [CrossRef]
- Kuriakose, M.; Younger, D.; Ravula, A.R.; Alay, E.; Rama Rao, K.V.; Chandra, N. Synergistic Role of Oxidative Stress and Blood-Brain Barrier Permeability as Injury Mechanisms in the Acute Pathophysiology of Blast-induced Neurotrauma. Sci. Rep. 2019, 9, 7717. [Google Scholar] [CrossRef] [Green Version]
- Lochhead, J.J.; Mccaffrey, G.; Sanchez-Covarrubias, L.; Finch, J.D.; Demarco, K.M.; Quigley, C.E.; Davis, T.P.; Ronaldson, P.T. Tempol modulates changes in xenobiotic permeability and occludin oligomeric assemblies at the blood-brain barrier during inflammatory pain. Am. J. Physiol. Heart Circ. Physiol. 2012, 302, H582–H593. [Google Scholar] [CrossRef] [PubMed] [Green Version]
- Fumoto, T.; Naraoka, M.; Katagai, T.; Li, Y.; Shimamura, N.; Ohkuma, H. The Role of Oxidative Stress in Microvascular Disturbances after Experimental Subarachnoid Hemorrhage. Transl. Stroke Res. 2019, 10, 684–694. [Google Scholar] [CrossRef] [PubMed]
- Syvänen, S.; Lindhe, Ö.; Palner, M.; Kornum, B.R.; Rahman, O.; Långström, B.; Knudsen, G.M.; Hammarlund-Udenaes, M. Species differences in blood-brain barrier transport of three positron emission tomography radioligands with emphasis on P-glycoprotein transport. Drug Metab. Dispos. 2009, 37, 635–643. [Google Scholar] [CrossRef] [PubMed] [Green Version]
- Shawahna, R.; Uchida, Y.; Declèves, X.; Ohtsuki, S.; Yousif, S.; Dauchy, S.; Jacob, A.; Chassoux, F.; Daumas-Duport, C.; Couraud, P.O.; et al. Transcriptomic and quantitative proteomic analysis of transporters and drug metabolizing enzymes in freshly isolated human brain microvessels. Mol. Pharm. 2011, 8, 1332–1341. [Google Scholar] [CrossRef] [PubMed]
- Hoshi, Y.; Uchida, Y.; Tachikawa, M.; Inoue, T.; Ohtsuki, S.; Terasaki, T. Quantitative atlas of blood-brain barrier transporters, receptors, and tight junction proteins in rats and common marmoset. J. Pharm. Sci. 2013, 102, 3343–3355. [Google Scholar] [CrossRef]
- Uchida, Y.; Ohtsuki, S.; Katsukura, Y.; Ikeda, C.; Suzuki, T.; Kamiie, J.; Terasaki, T. Quantitative targeted absolute proteomics of human blood-brain barrier transporters and receptors. J. Neurochem. 2011, 117, 333–345. [Google Scholar] [CrossRef] [PubMed]
- Mertsch, K.; Blasig, I.; Grune, T. 4-Hydroxynonenal impairs the permeability of an in vitro rat blood-brain barrier. Neurosci. Lett. 2001, 314, 135–138. [Google Scholar] [CrossRef]
- Krizbai, I.A.; Bauer, H.; Bresgen, N.; Eckl, P.M.; Farkas, A.; Szatmári, E.; Traweger, A.; Wejksza, K.; Bauer, H.C. Effect of oxidative stress on the junctional proteins of cultured cerebral endothelial cells. Cell. Mol. Neurobiol. 2005, 25, 129–139. [Google Scholar] [CrossRef]
- Ji, H.H.; Sang, W.H.; Seung, K.L. Free radicals as triggers of brain edema formation after stroke. Free Radic. Biol. Med. 2005, 39, 51–70. [Google Scholar]
- Kabu, S.; Jaffer, H.; Petro, M.; Dudzinski, D.; Stewart, D.; Courtney, A.; Courtney, M.; Labhasetwar, V. Blast-associated shock waves result in increased brain vascular leakage and elevated ROS levels in a rat model of traumatic brain injury. PLoS ONE 2015, 10, e127971. [Google Scholar] [CrossRef] [PubMed] [Green Version]
- Sochocka, M.; Koutsouraki, E.; Gasiorowski, K.; Leszek, J. Vascular Oxidative Stress and Mitochondrial Failure in the Pathobiology of Alzheimer’s Disease: A New Approach to Therapy. CNS Neurol. Disord.-Drug Targets 2013, 12, 870–881. [Google Scholar] [CrossRef] [PubMed]
- Xiao, M.; Zhong, H.; Xia, L.; Tao, Y.; Yin, H. Pathophysiology of mitochondrial lipid oxidation: Role of 4-hydroxynonenal (4-HNE) and other bioactive lipids in mitochondria. Free Radic. Biol. Med. 2017, 111, 316–327. [Google Scholar] [CrossRef]
- Alim, I.; Caulfield, J.T.; Chen, Y.; Swarup, V.; Geschwind, D.H.; Ivanova, E.; Seravalli, J.; Ai, Y.; Sansing, L.H.; Emma, E.J.; et al. Selenium Drives a Transcriptional Adaptive Program to Block Ferroptosis and Treat Stroke. Cell 2019, 177, 1262–1279.e25. [Google Scholar] [CrossRef] [Green Version]
- Zille, M.; Karuppagounder, S.S.; Chen, Y.; Gough, P.J.; Bertin, J.; Finger, J.; Milner, T.A.; Jonas, E.A.; Ratan, R.R. Neuronal Death after Hemorrhagic Stroke in Vitro and in Vivo Shares Features of Ferroptosis and Necroptosis. Stroke 2017, 48, 1033–1043. [Google Scholar] [CrossRef] [Green Version]
- Li, Q.; Han, X.; Lan, X.; Gao, Y.; Wan, J.; Durham, F.; Cheng, T.; Yang, J.; Wang, Z.; Jiang, C.; et al. Inhibition of neuronal ferroptosis protects hemorrhagic brain. JCI Insight 2017, 2, e90777. [Google Scholar] [CrossRef] [PubMed] [Green Version]
- Hong, S.H.; Lee, D.H.; Lee, Y.S.; Jo, M.J.; Jeong, Y.A.; Kwon, W.T.; Choudry, H.A.; Bartlett, D.L.; Lee, Y.J. Molecular crosstalk between ferroptosis and apoptosis: Emerging role of ER stress-induced p53-independent PUMA expression. Oncotarget 2017, 8, 115164–115178. [Google Scholar] [CrossRef] [Green Version]
- Green, D.R. The cell’s dilemma, or the story of cell death: An entertainment in three acts. FEBS J. 2016, 283, 2568–2576. [Google Scholar] [CrossRef] [Green Version]
- Hughes, M.A.; Powley, I.R.; Jukes-Jones, R.; Horn, S.; Feoktistova, M.; Fairall, L.; Schwabe, J.W.R.; Leverkus, M.; Cain, K.; MacFarlane, M. Co-operative and Hierarchical Binding of c-FLIP and Caspase-8: A Unified Model Defines How c-FLIP Isoforms Differentially Control Cell Fate. Mol. Cell 2016, 61, 834–849. [Google Scholar] [CrossRef] [Green Version]
- Gao, M.; Monian, P.; Pan, Q.; Zhang, W.; Xiang, J.; Jiang, X. Ferroptosis is an autophagic cell death process. Cell Res. 2016, 26, 1021–1032. [Google Scholar] [CrossRef] [Green Version]
- Gao, M.; Monian, P.; Quadri, N.; Ramasamy, R.; Jiang, X. Glutaminolysis and Transferrin Regulate Ferroptosis. Mol. Cell 2015, 59, 298–308. [Google Scholar] [CrossRef] [Green Version]
- Park, E.; Chung, S.W. ROS-mediated autophagy increases intracellular iron levels and ferroptosis by ferritin and transferrin receptor regulation. Cell Death Dis. 2019, 10, 822. [Google Scholar] [CrossRef] [Green Version]
- Won, S.M.; Lee, J.H.; Park, U.J.; Gwag, J.; Gwag, B.J.; Lee, Y.B. Iron mediates endothelial cell damage and blood-brain barrier opening in the hippocampus after transient forebrain ischemia in rats. Exp. Mol. Med. 2011, 43, 121–128. [Google Scholar] [CrossRef] [PubMed] [Green Version]
- Kühn, L.C. Iron regulatory proteins and their role in controlling iron metabolism. Metallomics 2015, 7, 232–243. [Google Scholar] [CrossRef] [PubMed]
- Colás-Algora, N.; García-Weber, D.; Cacho-Navas, C.; Barroso, S.; Caballero, A.; Ribas, C.; Correas, I.; Millán, J. Compensatory increase of VE-cadherin expression through ETS1 regulates endothelial barrier function in response to TNFα. Cell. Mol. Life Sci. 2020, 77, 2125–2140. [Google Scholar] [CrossRef] [PubMed]
- Natah, S.S.; Srinivasan, S.; Pittman, Q.; Zonghang, Z.; Dunn, J.F. Effects of acute hypoxia and hyperthermia on the permeability of the blood-brain barrier in adult rats. J. Appl. Physiol. 2009, 107, 1348–1356. [Google Scholar] [CrossRef] [PubMed] [Green Version]
- Huang, X.; Zhou, Y.; Zhao, T.; Han, X.; Qiao, M.; Ding, X.; Li, D.; Wu, L.; Wu, K.; Zhu, L.; et al. A method for establishing the high-altitude cerebral edema (HACE) model by acute hypobaric hypoxia in adult mice. J. Neurosci. Methods 2015, 245, 178–181. [Google Scholar] [CrossRef]
- Halder, S.K.; Kant, R.; Milner, R. Chronic mild hypoxia increases expression of laminins 111 and 411 and the laminin receptor α6β1 integrin at the blood-brain barrier. Brain Res. 2018, 1700, 78–85. [Google Scholar] [CrossRef]
- Shen, Y.; Gu, J.; Liu, Z.; Xu, C.; Qian, S.; Zhang, X.; Zhou, B.; Guan, Q.; Sun, Y.; Wang, Y.; et al. Inhibition of HIF-1α reduced blood brain barrier damage by regulating MMP-2 and VEGF during acute cerebral ischemia. Front. Cell. Neurosci. 2018, 12, 288. [Google Scholar] [CrossRef]
- Yeh, W.L.; Lu, D.Y.; Lin, C.J.; Liou, H.C.; Fu, W.M. Inhibition of hypoxia-induced increase of blood-brain barrier permeability by YC-1 through the antagonism of HIF-1α accumulation and VEGF expression. Mol. Pharmacol. 2007, 72, 440–449. [Google Scholar] [CrossRef]
- Koh, M.Y.; Powis, G. Passing the baton: The HIF switch. Trends Biochem. Sci. 2012, 37, 364–372. [Google Scholar] [CrossRef] [Green Version]
- Song, J.; Zhang, X.; Buscher, K.; Wang, Y.; Wang, H.; Di Russo, J.; Li, L.; Lütke-Enking, S.; Zarbock, A.; Stadtmann, A.; et al. Endothelial Basement Membrane Laminin 511 Contributes to Endothelial Junctional Tightness and Thereby Inhibits Leukocyte Transmigration. Cell Rep. 2017, 18, 1256–1269. [Google Scholar] [CrossRef] [Green Version]
- Stohs, S.J.; Bagchi, D. Oxidative mechanisms in the toxicity of metal ions. Free Radic. Biol. Med. 1995, 18, 321–336. [Google Scholar] [CrossRef] [Green Version]
- Winterbourn, C.C. The biological chemistry of hydrogen peroxide. In Methods in Enzymology; Academic Press Inc.: Cambridge, MA, USA, 2013; pp. 3–25. [Google Scholar]
- Lane, D.J.R.; Merlot, A.M.; Huang, M.L.H.; Bae, D.H.; Jansson, P.J.; Sahni, S.; Kalinowski, D.S.; Richardson, D.R. Cellular iron uptake, trafficking and metabolism: Key molecules and mechanisms and their roles in disease. Biochim. Biophys. Acta-Mol. Cell Res. 2015, 1853, 1130–1144. [Google Scholar] [CrossRef] [Green Version]
- Fink, M.P.; Macias, C.A.; Xiao, J.; Tyurina, Y.Y.; Jiang, J.; Belikova, N.; Delude, R.L.; Greenberger, J.S.; Kagan, V.E.; Wipf, P. Hemigramicidin-TEMPO conjugates: Novel mitochondria-targeted anti-oxidants. Biochem. Pharmacol. 2007, 74, 801–809. [Google Scholar] [CrossRef] [PubMed]
- Jiang, J.; Belikova, N.A.; Hoye, A.T.; Zhao, Q.; Epperly, M.W.; Greenberger, J.S.; Wipf, P.; Kagan, V.E. A Mitochondria-Targeted Nitroxide/Hemigramicidin S Conjugate Protects Mouse Embryonic Cells Against Gamma Irradiation. Int. J. Radiat. Oncol. Biol. Phys. 2008, 70, 816–825. [Google Scholar] [CrossRef] [PubMed] [Green Version]
- Wei, L.; Leibowitz, B.J.; Epperly, M.; Bi, C.; Li, A.; Steinman, J.; Wipf, P.; Li, S.; Zhang, L.; Greenberger, J.; et al. The GS-nitroxide JP4-039 improves intestinal barrier and stem cell recovery in irradiated mice. Sci. Rep. 2018, 8, 2–13. [Google Scholar] [CrossRef] [PubMed]
- WHO. WHO Model Formulary 2008; Stuart, M.C., Kouimtzi, M., Hill, S.R., Eds.; World Health Organization: Geneva, Switzerland, 2009. [Google Scholar]
- Belaidi, A.A.; Bush, A.I. Iron neurochemistry in Alzheimer’s disease and Parkinson’s disease: Targets for therapeutics. J. Neurochem. 2016, 139, 179–197. [Google Scholar] [CrossRef] [Green Version]
Publisher’s Note: MDPI stays neutral with regard to jurisdictional claims in published maps and institutional affiliations. |
© 2021 by the authors. Licensee MDPI, Basel, Switzerland. This article is an open access article distributed under the terms and conditions of the Creative Commons Attribution (CC BY) license (http://creativecommons.org/licenses/by/4.0/).
Share and Cite
Rand, D.; Ravid, O.; Atrakchi, D.; Israelov, H.; Bresler, Y.; Shemesh, C.; Omesi, L.; Liraz-Zaltsman, S.; Gosselet, F.; Maskrey, T.S.; et al. Endothelial Iron Homeostasis Regulates Blood-Brain Barrier Integrity via the HIF2α—Ve-Cadherin Pathway. Pharmaceutics 2021, 13, 311. https://doi.org/10.3390/pharmaceutics13030311
Rand D, Ravid O, Atrakchi D, Israelov H, Bresler Y, Shemesh C, Omesi L, Liraz-Zaltsman S, Gosselet F, Maskrey TS, et al. Endothelial Iron Homeostasis Regulates Blood-Brain Barrier Integrity via the HIF2α—Ve-Cadherin Pathway. Pharmaceutics. 2021; 13(3):311. https://doi.org/10.3390/pharmaceutics13030311
Chicago/Turabian StyleRand, Daniel, Orly Ravid, Dana Atrakchi, Hila Israelov, Yael Bresler, Chen Shemesh, Liora Omesi, Sigal Liraz-Zaltsman, Fabien Gosselet, Taber S. Maskrey, and et al. 2021. "Endothelial Iron Homeostasis Regulates Blood-Brain Barrier Integrity via the HIF2α—Ve-Cadherin Pathway" Pharmaceutics 13, no. 3: 311. https://doi.org/10.3390/pharmaceutics13030311
APA StyleRand, D., Ravid, O., Atrakchi, D., Israelov, H., Bresler, Y., Shemesh, C., Omesi, L., Liraz-Zaltsman, S., Gosselet, F., Maskrey, T. S., Schnaider Beeri, M., Wipf, P., & Cooper, I. (2021). Endothelial Iron Homeostasis Regulates Blood-Brain Barrier Integrity via the HIF2α—Ve-Cadherin Pathway. Pharmaceutics, 13(3), 311. https://doi.org/10.3390/pharmaceutics13030311