Abstract
The reverse pH gradient is a major feature associated with cancer cell reprogrammed metabolism. This phenotype is supported by increased activity of pH regulators like ATPases, carbonic anhydrases (CAs), monocarboxylate transporters (MCTs) and sodium–proton exchangers (NHEs) that induce an acidic tumor microenvironment, responsible for the cancer acid-resistant phenotype. In this work, we analyzed the expression of these pH regulators and explored their inhibition in breast cancer cells as a strategy to enhance the sensitivity to chemotherapy. Expression of the different pH regulators was evaluated by immunofluorescence and Western blot in two breast cancer cell lines (MDA-MB-231 and MCF-7) and by immunohistochemistry in human breast cancer tissues. Cell viability, migration and invasion were evaluated upon exposure to the pH regulator inhibitors (PRIs) concanamycin-A, cariporide, acetazolamide and cyano-4-hydroxycinnamate. Additionally, PRIs were combined with doxorubicin to analyze the effect of cell pH dynamic disruption on doxorubicin sensitivity. Both cancer cell lines expressed all pH regulators, except for MCT1 and CAXII, only expressed in MCF-7 cells. There was higher plasma membrane expression of the pH regulators in human breast cancer tissues than in normal breast epithelium. Additionally, pH regulator expression was significantly associated with different molecular subtypes of breast cancer. pH regulator inhibition decreased cancer cell aggressiveness, with a higher effect in MDA-MB-231. A synergistic inhibitory effect was observed when PRIs were combined with doxorubicin in the breast cancer cell line viability. Our results support proton dynamic disruption as a breast cancer antitumor strategy and the use of PRIs to boost the activity of conventional therapy.
1. Introduction
Breast cancer is the most common cancer in the female gender and, according to Globocan, about 2.1 million new cases of breast cancer were identified in 2018 in the world and over 627,000 women died from the disease (global health estimates, World Human Organization (WHO)) [1]. Breast cancer is characterized by distinct biological features and subdivided into different molecular subtypes [2,3]. One of the most aggressive subtypes is the basal-like, which belongs to the triple-negative breast cancer (TNBC) type, being negative for estrogen receptor (ER) (-), human epidermal growth factor receptor 2 (HER2) and progesterone receptor (PgR). TNBC has a small therapeutic window, with low rates of treatment success [4,5]. Unfortunately, few treatment options are available besides chemotherapy. The common regimens include anthracyclines, cyclophosphamide, and taxanes, with possible serious side-effects [6]. Therefore, new and more effective therapies are urgently needed. Different studies with novel therapies are ongoing such as hormonal and immunotherapy. Genetic therapy is also being studied as a new treatment modality for this type of breast cancer. Al-Mahmood et al. proposed that the codelivery of liposomes loaded with EGFR targeted siRNA and gefitinib, respectively, suppresses resistance of TNBCs to gefitinib, increasing the effectiveness of the treatment [7].
Highly proliferative cancer cells reprogram their metabolism, being mainly dependent on glycolytic metabolism instead of oxidative phosphorylation (OXPHOS) to produce ATP, even in aerobic conditions, being this finding called ‘‘aerobic glycolysis” or “Warburg effect” [8]. The hyper-glycolytic phenotype of cancer cells has, as a consequence, chronic acidification of the microenvironment due to the increase in proton efflux. Therefore, the tumor microenvironment presents an acidic pH between 6.5 and 7.1, in contrast to normal tissues, where the extracellular pH (pHe) is between 7.2 and 7.5 [9]. To avoid cell death due to intracellular acidification, cancer cells upregulate different families of pH regulators at the plasma membrane (PM) [10,11]. These proteins include the carbonic anhydrase (CA) family, specifically CAIX and CAXII, the sodium-hydrogen exchangers (NHEs), namely NHE1, the vacuolar-ATPase (V-ATPase) and monocarboxylate transporters (MCTs), MCT1 and MCT4 in particular [10,12]. This phenotype provides a competitive advantage to cancer cells since the low pHe generates a microenvironment favorable to tumor invasion and metastases, angiogenesis, suppression of anticancer immune response and resistance to chemo- and radiotherapy [10,13,14,15]. Some reports demonstrated the association between pH regulator expression and some breast cancer subtypes, such as V-ATPase and CAIX expression in breast basal-like cancer [16,17], and V-ATPase and NHE1 expression in HER2 positive and luminal breast cancers [18,19]. Further, expression of GLUT1, MCT1 and CD147 has been connected with high-grade tumors [20] and the expression of MCT4 with TNBC [21].
The interaction between tumor cells and the surrounding microenvironment motivated the exploitation of pH regulators as targets to improve anticancer therapy. Many compounds have been developed to inhibit the activity of the pH regulators mentioned above [12]. Non-amiloride compounds, such as cariporide, are specific and powerful NHE1 inhibitors [22,23]. The use of cariporide was reported to induce a reduction in cholangiocarcinoma [24] and human tongue squamous cell carcinoma [25] cell proliferation. Although it was well tolerated by humans in the context of cardiac disease, there are still no studies in the cancer field. Regarding CAs, namely CAXII, accumulating evidence recognizes that CA inhibition successfully decreases tumor growth in in vitro and in vivo models [26,27,28,29]. Supuran and coworkers demonstrated that the sulfonamide family of compounds impairs tumor growth and invasion in breast cancer models, being already in the clinical trial phase. A phase I clinical trial with LC-0111(NCT02215850), a small molecule inhibitor of CAIX, showed the compound as being safe and appropriate to start phase 2 [30].
Bafilomycin and concanamycin A (conc. A), which belong to the plecomacrolide class of antibiotics, decreased the invasion capacity of breast cancer cells [31] by specific inhibition of V-ATPase. However, there are only a few reports on the effect of these compounds on cancer cells. Concerning MCT inhibition, Morais-Santos et al. demonstrated that MCT inhibition, by siRNA or pharmacologic inhibition with cyano-4-hydroxycinnamate (CHC), lodinamine or quercetin, decreased breast cancer cell aggressiveness in vitro [32]. Furthermore, the MCT knockdown decreased in vivo tumor formation and growth [33]. The importance of MCT inhibition in cancer therapy also has been revealed in different types of cancer, both in in vitro and in vivo models [34], namely in colorectal [35] and cervix [36] cancers and glioma [37,38].
The acidic tumor microenvironment confers many advantages to cancer cells; therefore, blockade of proton export via the inhibition of pH regulators is a promising strategy in cancer therapy. Some pH regulator inhibitors (PRIs) were by now tested in different phases of clinical trials [39]. However, further efforts are needed to increase the number of studies aiming to clarify the efficacy and possible toxicity generated by some of these compounds in specific cancer models. Therefore, this study aimed to disrupt the pH regulatory armamentarium of breast cancer cells and understand how this can be used to improve current therapy.
2. Material and Methods
2.1. Breast Tumor Samples
Tissue microarrays (TMAs) were constructed with samples from 473 patients with invasive breast carcinomas retrieved from the histopathology files of three Departments of Pathology: University Hospital of the Federal University of Santa Catarina (UFSC, Florianópolis, Brazil), Hospital Divino Espírito Santo (Ponta Delgada, Portugal) and from a private Laboratory of Pathology (Veronese Patologia e Citologia Araçatuba, Brazil), being the samples evaluated for clinical and pathological features (Additional file Table S1). Tissue molecular characterization was performed as previously described [40]. This study was approved by the UFSC Ethics Committee for Human Research (CEPSH), by the Ethics Committee for Health from the Hospital do Divino Espírito Santo de Ponta Delgada E.P.E., and by the research review boards from the Veronese Patologia e Citologia Araçatuba Pathology Laboratory, according to the national regulative law and ethical guidelines, concerning the handling of biological specimens from tumor banks. The samples were exclusively accessible for research purposes in retrospective studies, in accordance with the international declaration of Helsinki.
2.2. Cell lines and Culture Conditions
The breast cancer cell lines MCF-7 (ER +) and MDA-MB-231 (ER −) [41] used in this work were obtained from American Type Culture Collection (USA) and were tested for mycoplasma contamination (quantitative PCR) just before the assays. Cells were cultured according to ATCC recommendations, in Roswell Park Memorial Institute medium 1640 (RPMI 1640), supplemented with 10% heat-inactivated fetal bovine serum (FBS), 1% penicillin–streptomycin solution, in a 37 °C humidified atmosphere with 5% CO2.
2.3. Drugs
Stock solutions of 40 mM doxorubicin (Sigma-Aldrich; Algés, Portugal) and of the PRIs, 30 mM concanamycin. A (Conc. A) (Biotechnology, Santa Cruz, Dallas, TX, USA), 1 mM α-cyano-4-hydroxycinnamate (CHC), 0.5 cariporide and 100 mM acetazolamide (AZ) (Sigma-Aldrich, Algés, Portugal) were dissolved in dimethyl sulfoxide (DMSO). The working solutions were prepared by dilution in a cell culture medium (complete RPMI). Controls with DMSO without drugs were used. All the solutions were filtered through a 0.2 µm filter before use.
2.4. Cell Survival Assays
Cell viability was assessed by the sulforhodamine B (SRB) assay (Sigma-Aldrich, Algés, Portugal). SRB is a bright purple dye with two sulfonic groups, soluble in water, which binds to the basic amino acid residues of cell proteins. The dye SRB can then be used as a quantitative indicator of cell protein content, which is proportional to the cell density. An alteration in cell number originates from a proportional change in the amount of dye incorporated, being associated with the degree of cytotoxicity of the compound under study [42].
Cells were plated into 96-well plates, at a density of 1.5 × 10⁴ cells/well, and treated 48 h with the chemotherapeutic drug doxorubicin and the different PRIs. In each assay, the compounds were tested in triplicate. Untreated cells were used as a control, with the vehicle employed to prepare the drug (DMSO) used at the same concentration of the assays. Wells without cells, but filled with the same volume of culture medium containing the different concentrations of compounds, were used as negative controls and tested in duplicate. After cell incubation at appropriate conditions in 96-well plates (100 μL/well), cells were fixed with 50% cold trichloroacetic acid (25 μL/well) added directly to the culture, for 1 h at 4 °C. TCA was then removed by rinsing the plates 5 times with distilled water. Cells were then air-dried and stained with 0.4% SRB solution (50 μL/well), during 30–60 min at 37 °C, and the plates were again rinsed 5 times with 1% acetic acid until the unincorporated dye was totally removed. The plates were dried overnight, and the incorporated SRB was solubilized in a 10 mM Tris base solution (100 μL/well). The absorbance was measured at OD540 nm, using a microplate reader.
IC50 values were estimated from the GraphPad software, using nonlinear regression of sigmoidal dose–response after logarithmic transformation.
2.5. Western Blotting
Breast cancer cell lines were incubated until reaching 80% confluence, homogenized and centrifuged. The supernatants were then collected, and total protein quantified (Pierce™ BCA protein assay kit). 25 µg of total protein from each cell line were separated by SDS–PAGE on 10% polyacrylamide gels and transferred onto nitrocellulose membranes using a 25 mM Tris-base/glycine buffer. Membranes were blocked with 5% milk in TBS/0.1% Tween for 1 h at room temperature and probed overnight at room temperature with primary antibodies at the appropriate dilution (see Table 1). After the incubation period, the membranes were washed and incubated with the adequate secondary antibodies coupled to horseradish peroxidase (anti-rabbit, A9169, Sigma; anti-mouse, PI-2000, Vector) for 1 h at room temperature. Protein quantification through band densitometry determination was performed after image acquiring, using ImageJ software (version 1.41, National Institutes of Health). α-tubulin was used as a loading control.

Table 1.
Details about primary antibodies and conditions used in Western blot and immunofluorescence.
2.6. Immunofluorescence
MDA-MB-231 and MCF-7 cells (3 × 10⁵ cells/well) were plated on glass coverslips, fixed with cold methanol, permeabilized with triton 0.1% diluted in PBS 1× and blocked with BSA (bovine serum albumin) 5%, 30 min at room temperature. Cells were then first incubated with the respective primary antibodies (Table 1) at room temperature overnight and then with the secondary antibody anti-rabbit-Alexa Fluor 488 (1:1000 dilution, A11008, Invitrogen™ Molecular Probes™) and anti-mouse-Alexa Fluor 488 (1:1000 dilution, A11001, Invitrogen™ Molecular Probes™), diluted in BSA 5%, for 1 h at room temperature. Finally, cells were mounted in Vectashield mounting media with 4′,6-diamidino-2-phenylindole (DAPI) and the photographs were captured with a fluorescence microscope (Zeiss Spinning Disc AxioObserver Z.1 SD microscope coupled to an AXIOCam MR3 Camera) and treated with ImageJ software (National Institute of Health, Bethesda, MD, USA).
2.7. Immunohistochemistry
Immunohistochemistry was performed as previously described [43]. The primary antibodies used were as follows: rabbit anti-V-ATPase (1:100, ab157458 Abcam) and rabbit anti-CAXII (1:200, ab195233, Abcam). IHC was performed with the Ultravision detection system anti-polyvalent, HRP (Lab Vision Corporation). After deparaffinization and rehydration, the slides were heated for 20 min at 98 °C with 10 mM citrate buffer (pH 6.0) for antigen retrieval. Endogenous peroxidase was inactivated, and the tissues incubated with the primary antibody for 2 h at room temperature. The immune reaction was visualized using the chromogen 3,3′-diaminobenzidine (DAB+ substrate system; Dako). Tissue sections were counterstained with Gill-2 hematoxylin. For negative controls, primary antibodies were replaced by a universal negative control antibody (N1699, Dako). Positive controls were normal colon tissue for CAXII and breast cancer tissue for V-ATPase. Immunoreaction was evaluated using a semiquantitative score system, considering the extension and intensity of staining, as previously described [43]. Some of the cases could not be evaluated for immunoreaction, due to missing TMA samples or to insufficient representation of the tumor.
2.8. Wound-Healing Assay
Cell migration was evaluated through the wound-healing assay. Breast cancer cells were inoculated in 6-well plates at a density of 1.0 × 10⁶ cells/well until reaching full confluence. In the confluent cells, the wounds were created manually with a yellow tip. Cells were gently washed with PBS and exposed to media without FBS with different drug concentrations. Untreated cells were used as control. The absence of FBS assures that cell migration is observed and not cell proliferation. At three different time points (0, 12 and 24 h) and for each wound, two sites were photographed at 100× magnification in an inverted microscope (Nikon Eclipse TE 2000-U, Amsterdam, Netherlands). The migration distances were determined with the MeVisLab platform, and the percentage of cell migration was calculated with the GraphPad Prism 4 software (USA).
2.9. Invasion Assay
Cell invasion was performed using 24-well BD Biocoat Matrigel invasion chambers, according to the manufacturer’s instructions (354,480, BD Biosciences) [44]. Matrigel invasion chamber was rehydrated, and the cells were there plated and incubated with the IC50 concentrations of the different PRI for a period of 24 h. The invading cells were fixed with methanol and stained with Gill hematoxylin. The number of invading cells was determined using the Image J software (version 1.41; National Institute of Health, USA) in the membranes photographed with an Olympus SZx16 stereomicroscope (16×). Invasion was calculated as the percentage of cell invasion normalized for the control condition.
2.10. Effect of the pH Regulator Inhibitors on Doxorubicin Cytotoxicity
Breast cancer cells were plated at a density of 1.5 × 10³ cells/well into 96-well plates. Cells were treated with the IC50 of each PRI (this value was chosen because it has been determined in previous assays that were the concentration that induced some positive effect when combined with doxorubicin) combined with different concentrations of doxorubicin (range between 0.001 and 100 µM) for 48 h. The effect of doxorubicin alone and PRI + doxorubicin on cell growth was evaluated by the SRB assay. The combined effect of the drugs was determined using the CalcuSyn software (Biosoft), which is based on the Chou–Talalay median-effect equation derived from the mass-action law principle. According to this principle, increasing drug concentration will increase its potency, giving a measurable dose–response and effect on cellular synergy, being suitable to assay drug–drug interaction. Each drug combination (doxorubicin and each PRI) was evaluated at different drug ratios (nonconstant ratios with a fixed PRI concentration (IC50) and variable doxorubicin concentrations), as described in the results, to identify the presence of synergy. Cell viability data were introduced into the program, as well as the concentration ratios, in order to determine the combination index (CI). The resulting CI determined by the software allows the quantitative determination of drug interactions, namely additive effect (CI = 1), synergism (CI < 1), and antagonism (CI > 1) in drug combinations [45].
2.11. Zymography Assay
To analyze metalloproteinase 2 and 9 (MMP-2 and MMP-9) activities, a zymography assay was performed using a 10% polyacrylamide gel containing 0.1% of gelatine as substrate. The media from the breast cancer cell lines exposed to different extracellular pH s and treated with PRI were collected and centrifuged before use. Briefly, 20 µg of protein was loaded in the stacking gel, and after electrophoresis, gels were washed with 2% Triton X-100 solution to remove the SDS remnants, incubated for 16 h at 37 °C in appropriate buffer with MMP substrate and stained with Coomassie brilliant blue solution for 30 min. The excess stain was removed by a solution of methanol and acetic acid. Gels were photographed, and the protease activity was estimated using ImageJ software (version 1.41, National Institutes of Health).
2.12. Statistical Analysis
The GraphPad Prism 5 software was used for statistical analysis, and the results presented as normalized means ± SD for n independent experiments. Significant differences between groups: * p < 0.05; ** p < 0.01; *** p < 0.001 compared to untreated cells (control). Ns: non-significant.
Concerning the immunohistochemistry results, statistical analysis was carried out using the SPSS statistics 17.0 software (SPSS Inc., New York, NY, USA). Pearson’s chi-squared (χ2) test and contingency tables were used to determine associations between groups.
3. Results
3.1. pH Regulators Are Strongly Expressed in Breast Cancer Cell Lines, but with a Distinct Expression Pattern
The expression of the different pH regulators (MCT1, MCT4, CAXII, V-ATPase and NHE1) was assessed in the breast cancer cell lines MCF-7 and MDA-MB-231 by Western blot. Expression was positive for all pH regulators in both cell lines, except for MCT1 and CAXII in MDA-MB-231 cells (MCT1 is silenced in these cells due to promoter methylation [46]) (Figure 1). The expression of V-ATPase (subunit A1), MCT4 and NHE1 was higher in MDA-MB-231 cells (Figure 1). Concerning cell localization, V-ATPase and NHE1 were found to be expressed at the plasma membrane (PM), whereas their expression in MCF-7 cells was mainly localized in the cytoplasm. Regarding lactate transporters, both MCT1 and MCT4 were expressed both at the PM and cytoplasm (MCT4 in both cell lines, MCT1 only in MCF-7 cells). Expression of CAXII was only detected in MCF-7 cells, and it was mainly present in cell contact-junctions (Additional file Figure S1).
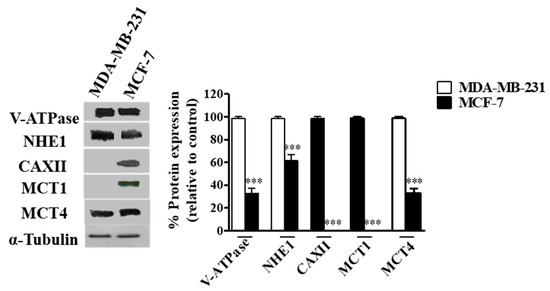
Figure 1.
Protein levels in breast cancer cells assessed by Western-Blot. A representative blot is shown. Results are expressed as mean ± SD of triplicates from three independent experiments. The cells with the highest expression of each pH regulator were used as reference and normalized to 100. *** p < 0.001 compared to reference cells.
3.2. V-ATPase Overexpression Associates Significantly with High-Grade Invasive Breast Carcinomas
In this study, we used 473 invasive breast carcinomas, and 48 normal breast tissues in TMAs previously classified for molecular subtypes [38] to characterize the expression of the pH regulators CAXII and V-ATPase.
The expression of the two pH regulators was observed both at the PM and cytoplasm. V-ATPase was more frequently found in the cytoplasm, with different immunoreactivity extension (Figure 2, Table 2). Most cases expressed V-ATPase in the cytoplasm (197/203, 97%), with 51/197 (25.9%) of cases positive for PM expression (Table 2). Regarding CAXII, 50% (98/196) of the cases were positive, and membrane expression was found in 98.0% (96/98) of the positive cases. PM expression of CAXII and V-ATPase was significantly higher in breast cancer samples in comparison to normal breast tissue (p = 0.001; p = 0.046, respectively) (Table 2). Specifically, normal breast tissue did not express CAXII, and only 4/44 (9.1%) cases were positive for V-ATPase at the PM. Representative IHC pictures for both pH regulators can be observed in Figure 2.
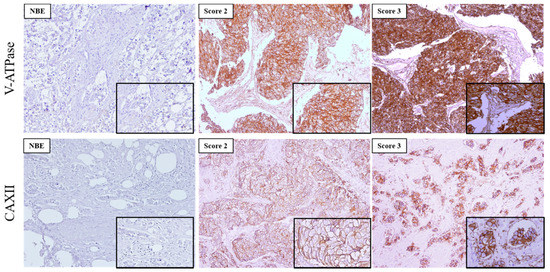
Figure 2.
Immunoexpression of V-ATPase and CAXII in primary invasive breast carcinomas and normal breast epithelium (NBE). Images are in 100× magnification, and the insets are in 200× magnification. The score for immunoreactive extension was score 2:5–50% and score 3: >50% of immunoreactive cells.
Table 2.
Frequency of V-ATPase and CAXII expression in breast carcinomas tissues compared with normal breast epithelium.
In order to study the relationship between V-ATPase and CAXII and MCT1 or MCT4 expressions in the tumor samples, we looked for association among the expression of these proteins (Table 3). Due to the role of these proteins, only plasma membrane expression was considered. Overall, no significant associations were found between V-ATPase and MCT1 or MCT4 expressions. Moreover, we did not find associations between CAXII and MCT1 or MCT4.
Table 3.
Association analysis of V-ATPase and CAXII with MCT1 and MCT4 expression in breast carcinoma samples.
The association between the expression of each of these proteins with breast cancer molecular characteristics and molecular subtypes (Additional file Table S2), as well as with available specific metabolic biomarkers (HIF1, GLUT1, CAIX and CD147) (Additional file Table S3), was evaluated. V-ATPase expression was differentially expressed in the molecular subtypes of breast cancer (p = 0.006), with higher expression in the luminal A subtype (Additional file Table S2). Additionally, we observed a significant positive association between V-ATPase and ER, PgR and HER2 (p = 0.001, p = 0.006 and p = 0.003, respectively) (Additional file Table S2). However, no significant association was observed between V-ATPase expression and classical breast cancer prognostic factors, namely lymph node (LN) invasion. In addition, no significant association with the metabolic biomarkers was found (Additional file Table S3). Regarding CAXII, we also observed a different expression pattern among the molecular subtypes (p = 0.010), but in this case, the highest expression was in the basal subtype (Additional file Table S2). It is important to note that 38.0% of cases positive for CAXII presented LN invasion (p = 0.010). Further, we found a correlation between CAXII and PgR expression (p = 0.010) (Additional file Table S2). Similar to V-ATPase, no association was found with the metabolic biomarkers. However, CAXII expression was associated with V-ATPase PM expression (p = 0.030) (Additional file Table S3).
3.3. Extracellular Acidity Decreases Sensitivity to Doxorubicin and Increases the Migratory and Invasive Abilities of Breast Cancer Cells
As previously described, the acidic pH in the extracellular space is responsible for aggressive tumor features, including drug resistance. In Figure 3, we show that both cell lines present different sensitivities to doxorubicin in media with different pH s (7.4 vs. 6.6). pH was controlled by buffering RPMI medium with 25 mM HEPES. The increase in the extracellular acidity (pH 6.6) decreased cancer cell sensitivity to doxorubicin (48 h), as can be seen by the lower IC50 values for the physiologic pHe of 7.4 (21.58 µM for MDA-MB-231 and 6.45 µM for MCF-7) compared to the acidic pHe of 6.6 (>100 µM for both cell lines).
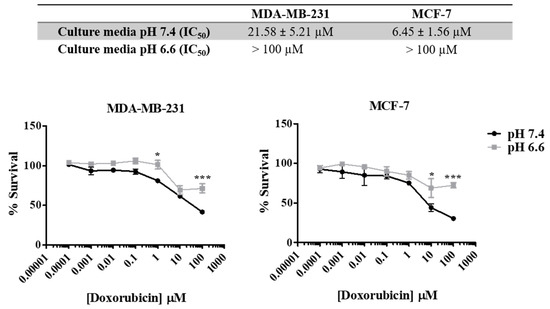
Figure 3.
Effect of doxorubicin on breast cancer cell survival at different extracellular pH values. IC50 values were determined after drug exposure using the SRB assay. Results are expressed as mean ± SD of triplicates from at least three independent experiments. Medium at pH 7.4 was used as control. * p < 0.05; *** p < 0.001 compared to pH 7.4 (control).
The effect of pHe on cell migration was studied by the wound-healing assay at both pH values, and the migration of tumor cells was registered at different time points (0, 12 and 24 h) (Figure 4). There was an increase in the migratory ability in both cell lines at pH 6.6, in comparison to pH 7.4. However, this difference in migration was more evident in MCF-7 than MDA-MB-231, probably because the latter cells already present a high ability to migrate in basal conditions (Figure 4A). Moreover, we evaluated the invasion ability of these cells in a low extracellular pH environment. The decrease of pHe also led to an increase of cell invasion in both cell lines, as can be seen by the number of cells that migrate through the Matrigel membrane. This difference was higher for MDA-MB-231 cells compared to MCF-7 cells (Figure 4B). Further, this effect is probably mediated by MMP9 and MMP2 since we observed higher activity of these MMPs at lower pHe in both cell lines. Accordingly, this effect was more evident in MDA-MB-231 (Additional file Figure S2).
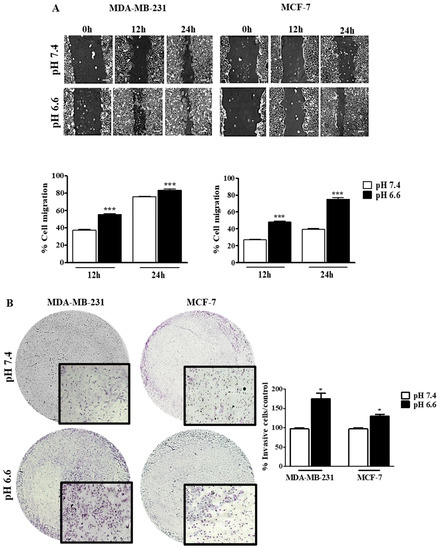
Figure 4.
Cell migration and invasion of breast cancer cell lines at different extracellular pH values. Cell migration (A) and cell invasion (B) were evaluated by the wound-healing and Matrigel assays, respectively. In the wound-healing assay, the scale bar corresponds to 100 μm. Results are expressed as mean ± SD of triplicates from three independent experiments. Medium at pH 7.4 was used as control. * p < 0.05; *** p < 0.001 compared to pH 7.4 control.
3.4. Disruption of pH Regulation Decreases the Aggressive Behavior of MDA-MB-231 Cells
Our results support the relevance of pH regulation in the aggressive features of cancer cells, and therefore the inhibition of the main players in this phenotype can be a useful strategy to decrease tumor aggressiveness. Thus, we inhibited the different pH regulators with specific compounds (pH regulators inhibitors—PRIs) in both cell lines. First, all PRIs were able to decrease cell survival in both cell lines. Conc. A and cariporide were the compounds that induced the highest cytotoxic effect, with lower IC50 values for both cell lines (Figure 5A). The effect of pH regulation disruption on cell migration and invasion was more evident in MDA-MB-231 cells (Figure 5B,C). At 24 h, CHC, cariporide and conc. A were able to decrease cell migration and invasion significantly through the Matrigel matrix in these cells. In contrast, MCF-7 cells demonstrated a lower migratory and invasive capacity after 24 h. Nevertheless, all the PRIs, except for CHC, decreased cell migration (Figure 5B), but only CHC and AZ were able to decrease MCF-7 cell invasion (Figure 5C). AZ compound was just assayed in MCF-7 cells, as CAXII was expressed only in this cell line. Further, the activity of MMPs, namely MMP-2, demonstrated by the gel digestion in the zymography assay, was lower in the presence of the PRIs, in MDA-MB-231 cells (Additional file Figure S3). In MCF-7 cells, all PRIs also inhibited MMP-2 activity in a significant way, except for cariporide. Regarding MMP-9, the zymography gel showed low activity in both cell lines. Nevertheless, the% of MMP digestion was significantly lower in both cells in the presence of the PRIs.
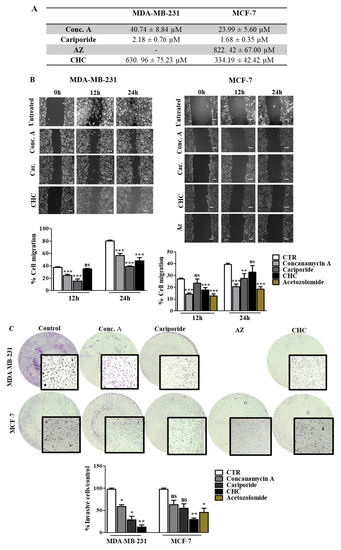
Figure 5.
Effect of pH regulator inhibitors (PRI) on breast cancer cell features. (A) IC50 (concentration of drug required for 50% of growth inhibition) values determined after PRI exposure, using the sulforhodamine B (SRB) assay. (B,C) Cell migration and invasion analysis were done after 24 h of treatment with IC50 values of PRI determined in (A). Representative images of the migration assay at 0, 12 and 24 h and of the invasion assay at 24 h, are presented. In the wound-healing assay, the scale bar (white bar) corresponds to 100 μm. Results are expressed as the mean + SD of at least 3 independent experiments, each in triplicate. Untreated cells were used as control. * p < 0.05; ** p < 0.01; *** p < 0.001 compared to untreated cells; ns—non-significant.
3.5. Treatment with pH Regulator Inhibitors Increased the Sensitivity of Breast Cancer Cell Lines to Doxorubicin
Here we aimed to evaluate the value of the combination of the PRIs with the conventional drug doxorubicin in breast cancer cells. Thus, we exposed both cell lines to different combinations of both drugs for 48 h and evaluated cell viability by the SRB assay (Figure 6). All the PRI compounds enhanced doxorubicin cytotoxicity, inducing a synergistic decrease in cell survival in both cell lines. This effect was more evident in MDA-MB-231 cells, as the initial IC50 value determined for doxorubicin alone was higher (IC50 = 5.5 µM) than MCF-7 cells (IC50 = 0.96 µM). The MCT inhibitor CHC was the compound that induced the highest effect in both cell lines when combined with doxorubicin. Simultaneous treatment with acetazolamide (AZ) was able to reduce cell MCF-7 viability. The CalcuSyn software (Biosoft) was used to analyze the power of these combinations (Table 4). Conc. A and cariporide led to a synergistic effect (CI < 1) with doxorubicin in both cell lines, but only when using IC50 or IC75 of both drugs. CHC and AZ presented a combination index lower than 1 for all drug ICs, indicating a synergistic effect. In summary, both cell lines became considerably more sensitive to doxorubicin when exposed to the combined treatment with PRIs.
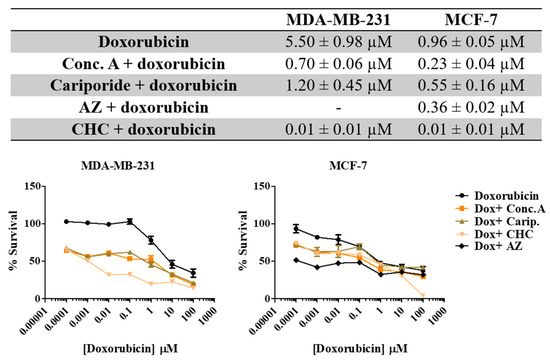
Figure 6.
Effect the combination of PRI with doxorubicin in breast cancer cell survival. IC50 values were determined after 48 h of exposure with the combined treatment with a range of doxorubicin concentrations (0.0001–100 µM) and the respective PRI IC50, using the SRB assay. Representative graphs show the dose–response curves of the combined treatment and doxorubicin treatment alone. Results are expressed as mean ± SD of triplicates from at least three independent experiments.
Table 4.
Combination index (CI) values of PRIs and doxorubicin. PRIs were used at the respective IC50 concentration and combined with the IC25, IC50 and IC75 of doxorubicin.
4. Discussion
Conventional antitumor treatments often present a low-term efficacy due to the development of multidrug resistance (MDR), the mechanism by which cancers develop resistance to multiple chemotherapeutic drugs [47]. Thus, it is important to explore new therapeutic strategies to enhance the efficacy of the available therapies. Although the influence of hypoxia and angiogenesis on tumor characteristics has been greatly explored in the last years, the role of other microenvironmental stresses is still an open field, namely the altered metabolism and the consequent acidity of the extracellular milieu.
Cancer cells commonly exhibit the “Warburg effect”, with increased glycolysis rates and lactic acid production. To prevent apoptosis by intracellular acidification, cancer cells upregulate different pH regulators at the PM, creating an acidic tumor microenvironment, also associated with chemoresistance [13]. Therefore, pH regulators, which play a key role in the reversion of the pH gradient, are interesting targets to potentiate the therapeutic efficacy of anticancer agents [48]. The main objective of this work was then to investigate the relationship between tumor extracellular acidification and the efficacy of conventional drugs in cancer cells by exploring the role of known pH regulators. Upregulation of glycolysis results in an increased production of lactic acid, leading to chronic acidification of the local environment (pH 6.5–7.1), which is fatal to the surrounding normal cells. To avoid apoptosis, cancer cells develop a self-defense strategy by upregulating the membrane pH regulators, keeping an intracellular pH (pHi) ranging from neutral to slightly alkaline (>7.2) [10].
The multiple families of pH regulators present in the PM of cancer cells are co-expressed and redundant. These include CAIX and CAXII (which hydrate extracellular CO2, an additional source of acidity), the anion exchanger (AE, exchanges Cl− by HCO3−, contributing to intracellular buffering) and the proton exporters NHE1, Vacuolar-ATPase (V-ATPase) and MCTs, in particular, MCT1 and MCT4 [49,50]. However, these transporters are not simultaneously upregulated in cancer cells. This is a defense mechanism developed by cancer cells to compensate for the inhibition of one transporter, in which they upregulate other(s) in order to maintain the abnormal cellular alkalinity [51].
First, we evaluated the expression of pH regulators in different breast cancer cell lines and associated this expression with the sensitivity of the cells to antitumor drugs. Different reports showed the importance of pH regulation in treatment resistance due to ion-trapping. Most chemotherapeutic drugs, including anthracyclines, anthraquinones and vinca alkaloids commonly used in chemotherapy regimens (mitoxantrone, doxorubicin, daunorubicin and vinblastine), are weak lipophilic bases with pKa values between 7.4 and 8.4. The ion-trapping model predicts that this kind of drug will concentrate in more acidic compartments, namely extracellular space and some cytoplasmic organelles like lysosomes, endosomes, the trans-Golgi network and secretory vesicles [47,52]. In acidic conditions, these drugs became charged (ionized form), being their transport across the PM inhibited, and their cytoplasmic accumulation decreased, leading to lower cytotoxicity [53]. Doxorubicin is widely used, alone or in combination with other drugs, in the treatment of several cancer types, including breast cancer [54]. MDA-MB-231 cells present a lower sensitivity to doxorubicin than MCF-7 cells (higher IC50 value). These results are in agreement with the literature, where it is described that doxorubicin is more effective in inducing apoptosis in MCF-7 than in MDA-MB-231 cells [55]. Both breast cancer cell lines presented positive expression of the pH regulators studied, namely V-ATPase, NHE1 and MCT4 at both cytoplasm and PM. However, only MCF-7 cells presented expression of both MCT1 and CAXII.
The involvement of these proteins, as well as the acidic tumor environment in the acquisition of resistance to therapies, has been extensively described [10,12]. Accordingly, our results showed that at lower pHe (medium buffered to pH 6.6), both cell lines presented increased IC50 values, more evident for MCF-7 that became less sensitive to treatment. Many common drugs used in chemotherapy are weak bases, namely anthracyclines like doxorubicin, which become protonated at low pHe, as the one often present in the tumor microenvironment or in intracellular vesicles [56]. Besides the decrease in sensitivity to doxorubicin at low pHe, it is important to highlight that the IC50 values for doxorubicin in media buffered with HEPES without NaHCO3 were different from the IC50 values of media buffered with NaHCO3. Therefore, the HEPES solution and absence of NaHCO3 seems to influence cell behavior, as we observed an increase of IC50 values in medium buffered at pH 7.4 compared with a normal medium at the same pH. To the best of our knowledge, there is no report about this issue.
Besides increased resistance to treatment, the low pHe in cancer is associated with many other malignant features. Some reports described the role of the acid tumor microenvironment in the metastization steps [57,58]. In addition, recent evidence showed the importance of the reverse pH gradient in tumor cell migration, controlled by pH regulators. The assembly of integrin filaments that drives membrane protrusion in migrating cells increases with a high intracellular pH and low extracellular pH [59]. It is also reported that V-ATPase and NHE1 colocalize with the actin cytoskeleton at the leading edge of migrating cells, indicating their involvement in cell migration [60,61,62]. Further, the optimal activity of MMPs and other proteolytic enzymes that degrade the extracellular matrix and support the dissemination of tumor cells occurs at low pHe [57,63]. We observed that lower pHe did not only increase the migratory capacity of MDA-MB-231 cells but also the invasion ability, probably due to the upregulation of MMP activity. Several MMPs have been shown to drive cell invasion through the basement membrane, such as MMP-2 and MMP-9, and their inhibition decreases the number of metastasis in in vivo models [64]. Our results showed that the acidic pHe increased MMP activity, namely MMP-9 in MDA-MB-231 cells.
The higher proliferation in acidic conditions can be due to a higher expression/activity of pH regulators. For this reason, we inhibited the activity of pH regulators using specific inhibitors in in vitro assays. Both cell lines were sensitive to all the compounds used and Conc. A cariporide CHC and AZ induced a reduction in cell viability to the same extent. Furthermore, inhibition of the pH regulators decreased the aggressive characteristics in the most aggressive cell line MDA-MB-231, namely by decreasing the migratory and invasive abilities. The acidic tumor microenvironment can also indirectly drive extracellular matrix proteolysis, as referred to above. Therefore, the stronger inhibition of these features in this cell line could be correlated with a reversion of abnormal pHe in cancer cells and the consequent lower activity of MMPs, namely MMP-2. In fact, we observed an increase in cancer cell pHe in the presence of these compounds, comparing to untreated cells, being this effect more evident in MDA-MB-231 cells (Additional file Table S4). In addition, it is described in the literature that inhibition of these pH regulators induce proton accumulation in the cell. This results in a decrease of pHi and increase of pHe, triggering an apoptotic cascade and a decrease in migration, invasion and drug resistance, thus reducing cancer aggressiveness (39).
pH regulator inhibitors can be used not only as primary cytotoxic agents but also to sensitize cancer cells to conventional chemotherapeutic agents. Our results demonstrated that all the compounds were able to improve doxorubicin’s toxic effects, with CHC and conc. A inducing a more evident effect (lower IC50 values for doxorubicin) in both cell lines (Figure 6). Similar results in the same field have already been reported, demonstrating the importance of pH manipulation in cancer therapy. Treatment with CHC led to sensitization to radiotherapy [36], induced tumor cell death and decreased tumor invasion in in vivo models [38]. In addition, Miranda-Gonçalves and coworkers demonstrated that MCT inhibition potentiates the cytotoxic effect of temozolomide in glioma cells [43]. Another report studied the influence of acidic vesicles in tumor cell conventional therapy resistance [65]. This resistance was disrupted by the V-ATPase inhibitor bafilomycin A, inducing an alkalinization of these compartments and drug activity by abolishing vesicle drug sequestration. Amith et al. also showed that NHE1 knockout sensitized MDA-MB-231 cells to paclitaxel [66]. Regarding conc. A or cariporide, to the best of our knowledge, their efficacy was not yet reported in combination with other drugs, as it was demonstrated here.
We also analyzed the expression of the pH regulators V-ATPase and CAXII in human breast cancer tissues due to their importance in cancer and to clarify the involvement of these pH regulators in breast cancer tissues. The results of the expression frequencies of MCTs were already published [20] and will be discussed here. We found overexpression of these two pH regulators in cancer tissues, namely at the cytoplasm for V-ATPase and PM for CAXII. The presence of V-ATPases in some types of cancer was associated with shorter overall survival and high-grade tumors, such as glioblastomas [67]. Concerning our results, no significant association was observed between V-ATPase and more aggressive features in breast cancer tissues, such as LN invasion. The role of CAXII in tumor aggressiveness is controversial. The expression of this protein is reported in human malignancies such as colorectal [68], cervical [69], renal [70] and other cancers [71,72]. However, despite its role in tumor reverse pH gradient, some studies associated CAXII expression with good prognostic factors in invasive breast cancer [73]. In contrast, other studies report its involvement with a poor prognosis in some types of cancers, such as oral cell carcinomas and glioma [74,75]. In this study, we observed in the immunohistochemistry assays an association with the most aggressive cancer subtype, triple-negative/basal subtype. Furthermore, almost 40% of cases present LN invasion. The lack of CAXII expression in MDA-MB-231 in in vitro assays is not in concordance with these results; however, this is most likely related to the singularity of this cell line.
Previous studies also demonstrated concomitant expression of some pH regulators, namely MCTs and CAIX, in the same series of TMAs used in this work [20], as well as in glioma tissues [37]. Another in vitro study showed simultaneous expression of V-ATPase and CAIX in breast cancer cell lines, but only in conditions of low oxygen levels [76]. Importantly, we evaluated for the first time the expression of these pH regulators, V-ATPase and CAXII, in human breast cancer tissues and investigated the association between them. We observed a close association between V-ATPase and CAXII expression, being these pH regulators co-expressed in the same clinical samples at the PM. Therefore, more than one pH regulator can be expressed at the same time, and a combined inhibition should be explored in future studies.
Concerning V-ATPase, we observed a cytoplasmic expression in clinical cases, but also PM expression in in vitro results. The clinical relevance of this aspect may represent an additional contribution to chemoresistance. The accumulation of acidic vesicles in the cytoplasm (e.g., lysosomes), acidified by proteins such as V-ATPase, may enhance drug sequestration and subsequent drug efflux through vesicular transport through the cell membrane and drug release to the extracellular space [77].
On the whole, our data support that different pH regulators expressed by cancer cells can be explored in the future as predictive biomarkers in breast cancer treatment. Further, disruption of proton dynamics in cancer cells can lead to the accumulation of intracellular protons to lethal levels and potentiate the effect of conventional therapeutic drugs, overcoming drug resistance.
Supplementary Materials
The following are available online at www.mdpi.com/xxx/s1..
Author Contributions
D.T.-V. participated in the conception, design and writing of the manuscript, acquisition, analysis and interpretation of data, as well as development of methodology; B.S. and F.S. participated in the analysis and interpretation of data related to breast cancer clinical samples; O.Q. and F.B. participated in the conception of the study, data interpretation, revision of the manuscript and work supervision. All authors have read and agreed to the published version of the manuscript.
Funding
This research was funded by National funds, through the Foundation for Science and Technology (FCT)—project UIDB/50026/2020 and UIDP/50026/2020; and by the projects NORTE-01-0145-FEDER-000013 and NORTE-01-0145-FEDER-000023, supported by Norte Portugal Regional Operational Programme (NORTE 2020), under the PORTUGAL 2020 Partnership Agreement, through the European Regional Development Fund (ERDF). This work was also supported by an internal CESPU project MetabRes_CESPU_2017. DT-V received a fellowship from FCT (ref. SFRH/BD/103025/2014).
Institutional Review Board Statement
The study was conducted according to the guidelines of the Declaration of Helsinki, and approved by the UFSC Ethics Committee for Human Research (CEPSH), by the Ethics Committee for Health from the Hospital do Divino Espírito Santo de Ponta Delgada E.P.E., and by the research review boards from the Veronese Patologia e Citologia Araçatuba Pathology Laboratory, according to the national regulative law and ethical guidelines, concerning the handling of biological specimens from tumor banks.
Informed Consent Statement
Informed consent was obtained from all subjects involved in the study.
Conflicts of Interest
The authors declare no conflict of interest.
Abbreviations
| AZ | Acetazolamide |
| CA | Carbonic anhydrase |
| Conc. A | Concanamycin A |
| CHC | α-cyano-4-hydroxycinnamate |
| ER | Estrogen receptor |
| GLUT1 | glucose transporter 1 |
| HER2 | Human epidermal growth factor receptor 2 |
| LN | lymph node |
| MCT | Monocarboxylate transporter |
| MMP | Metalloproteinase |
| NHE1 | Sodium–hydrogen exchanger 1 |
| PgR | Progesterone receptor |
| pHe | Extracellular pH |
| PM | Plasma membrane |
| PRIs | pH regulator inhibitors |
| TMAs | Tissue microarrays |
| TNBC | Triple negative breast cancer |
| V-ATPase | Vacuolar ATPase |
References
- International Agency for Research on Cancer. Latest Global Cancer Data: Cancer Burden Rises to 18.1 Million New Cases and 9.6 Million Cancer Deaths in 2018. 2018. IARC Press Release No. 263. Available online: https://www.iarc.who.int/featured-news/latest-global-cancer-data-cancer-burden-rises-to-18-1-million-new-cases-and-9-6-million-cancer-deaths-in-2018/ (accessed on 3 December 2020).
- Spitale, A.; Mazzola, P.; Soldini, D.; Mazzucchelli, L.; Bordoni, A. Breast cancer classification according to immunohistochemical markers: Clinicopathologic features and short-term survival analysis in a population-based study from the South of Switzerland. Ann. Oncol. 2008, 20, 628–635. [Google Scholar] [CrossRef]
- Dai, X.; Li, T.; Bai, Z.; Yang, Y.; Liu, X.; Zhan, J.; Shi, B. Breast cancer intrinsic subtype classification, clinical use and future trends. Am. J. Cancer Res. 2015, 5, 2929–2943. [Google Scholar]
- Carey, L.A. Directed therapy of subtypes of triple-negative breast cancer. Oncologist 2011, 16 (Suppl. 1), 71–78. [Google Scholar] [CrossRef] [PubMed]
- Rakha, E.A.; Reis-Filho, J.S. Basal-like breast carcinoma: From expression profiling to routine practice. Arch. Pathol. Lab. Med. 2009, 133, 860–868. [Google Scholar]
- Jerusalem, G.; Collignon, J.; Schroeder, H.; Lousberg, L. Triple-negative breast cancer: Treatment challenges and solutions. Breast Cancer Targets Ther. 2016, 8, 93–107. [Google Scholar] [CrossRef] [PubMed]
- Al-Mahmood, S.; Sapiezynski, J.; Garbuzenko, O.B.; Minko, T. Metastatic and triple-negative breast cancer: Challenges and treatment options. Drug Deliv. Transl. Res. 2018, 8, 1483–1507. [Google Scholar] [CrossRef] [PubMed]
- Warburg, O. On the Origin of Cancer Cells. Science 1956, 123, 309–314. [Google Scholar] [CrossRef] [PubMed]
- Matuszcak, C.; Lindner, K.; Haier, J.; Hummel, R. Proton pump inhibitors as chemosensitizer: New indication for a well-known medication. Cancer Cell Microenviron. 2015, 2, e667. [Google Scholar]
- Webb, B.A.; Chimenti, M.S.; Jacobson, M.P.; Barber, D.L. Dysregulated pH: A perfect storm for cancer progression. Nat. Rev. Cancer 2011, 11, 671–677. [Google Scholar] [CrossRef]
- Neri, D.; Supuran, C.T. Interfering with pH regulation in tumours as a therapeutic strategy. Nat. Rev. Drug Discov. 2011, 10, 767–777. [Google Scholar] [CrossRef] [PubMed]
- Asgharzadeh, M.R.; Barar, J.; Pourseif, M.M.; Eskandani, M.; Niya, M.J.; Mashayekhi, M.R.; Omidi, Y. Molecular machineries of pH dysregulation in tumor microenvironment: Potential targets for cancer therapy. BioImpacts 2017, 7, 115–133. [Google Scholar] [CrossRef] [PubMed]
- Izumi, H.; Torigoe, T.; Ishiguchi, H.; Uramoto, H.; Yoshida, Y.; Tanabe, M.; Ise, T.; Murakami, T.; Yoshida, T.; Nomoto, M.; et al. Cellular pH regulators: Potentially promising molecular targets for cancer chemotherapy. Cancer Treat. Rev. 2003, 29, 541–549. [Google Scholar] [CrossRef]
- Gillies, R.J.; Raghunand, N.; Garcia-Martin, M.L.; Gatenby, R.A. pH imaging—A review of pH measurement methods and applications in cancers. IEEE Eng. Med. Biol. Mag. 2004, 23, 57–64. [Google Scholar] [CrossRef] [PubMed]
- Yuan, J.; Narayanan, L.; Rockwell, S.; Glazer, P.M. Diminished DNA repair and elevated mutagenesis in mammalian cells exposed to hypoxia and low pH. Cancer Res. 2000, 60, 4372–4376. [Google Scholar] [PubMed]
- Pamarthy, S.; Jaiswal, M.K.; Kulshreshtha, A.; Katara, G.K.; Gilman-Sachs, A.; Beaman, K.D. The Vacuolar ATPase a2-subunit regulates Notch signaling in triple-negative breast cancer cells. Oncotarget 2015, 6, 34206–34220. [Google Scholar] [CrossRef]
- Ward, C.; Meehan, J.; Mullen, P.; Supuran, C.; Dixon, J.M.; Thomas, J.S.; Winum, J.Y.; Lambin, P.; Dubois, L. Evaluation of carbonic anhydrase IX as a therapeutic target for inhibition of breast cancer invasion and me-tastasis using a series of in vitro breast cancer models. Oncotarget 2015, 6, 24856–24870. [Google Scholar] [CrossRef] [PubMed]
- von Schwarzenberg, K.; Lajtos, T.; Simon, L.; Müller, R.; Vereb, G.; Vollmar, A.M. V-ATPase inhibition overcomes trastuzumab resistance in breast cancer. Mol. Oncol. 2014, 8, 9–19. [Google Scholar] [CrossRef]
- Amith, S.R.; Vincent, K.M.; Wilkinson, J.M.; Postovit, L.M.; Fliegel, L. Defining the Na+/H+ exchanger NHE1 interactome in triple-negative breast cancer cells. Cell. Signal. 2017, 29, 69–77. [Google Scholar] [CrossRef]
- Sousa, B.; Ribeiro, A.S.; Nobre, A.R.; Lopes, N.; Martins, D.; Pinheiro, C.; Vieira, A.F.; Albergaria, A.; Gerhard, R.; Schmitt, F.; et al. The basal epithelial marker P-cadherin associates with breast cancer cell populations harboring a glycolytic and acid-resistant phenotype. BMC Cancer 2014, 14, 1–13. [Google Scholar] [CrossRef]
- Doyen, J.; Trastour, C.; Ettore, F.; Peyrottes, I.; Toussant, N.; Gal, J.; Ilc, K.; Roux, D.; Parks, S.; Ferrero, J.; et al. Expression of the hypoxia-inducible monocarboxylate transporter MCT4 is increased in triple negative breast cancer and correlates independently with clinical outcome. Biochem. Biophys. Res. Commun. 2014, 451, 54–61. [Google Scholar] [CrossRef]
- Jin, W.; Li, Q.; Wang, J.; Chang, G.; Lin, Y.; Li, H.; Wang, L.; Gao, W.; Pang, T. Na+/H+exchanger 1 inhibition contributes to K562 leukaemic cell differentiation. Cell Biol. Int. 2012, 36, 739–745. [Google Scholar] [CrossRef]
- Di Sario, A.; Bendia, E.; Omenetti, A.; De Minicis, S.; Marzioni, M.; Kleemann, H.; Candelaresi, C.; Saccomanno, S.; Alpini, G.; Benedetti, A. Selective inhibition of ion transport mechanisms regulating intracellular pH reduces proliferation and induces apoptosis in cholangiocarcinoma cells. Dig. Liver Dis. 2007, 39, 60–69. [Google Scholar] [CrossRef]
- Harguindey, S.; Arranz, J.L.; Orozco, J.P.; Rauch, C.; Fais, S.; Cardone, R.A.; Reshkin, S.J. Cariporide and other new and powerful NHE1 inhibitors as potentially selective anticancer drugs—An integral molecular/biochemical/metabolic/clinical approach after one hundred years of cancer research. J. Transl. Med. 2013, 11, 282. [Google Scholar] [CrossRef]
- Lv, C.; Yang, X.; Yu, B.; Ma, Q.; Liu, B.; Liu, Y. Blocking the Na+/H+ exchanger 1 with cariporide (HOE642) reduces the hypoxia-induced invasion of human tongue squamous cell carcinoma. Int. J. Oral Maxillofac. Surg. 2012, 41, 1206–1210. [Google Scholar] [CrossRef]
- Chiche, J.; Ilc, K.; Laferrière, J.; Trottier, E.; Dayan, F.; Mazure, N.M.; Brahimi-Horn, M.C.; Pouysségur, J. Hypoxia-Inducible Carbonic Anhydrase IX and XII Promote Tumor Cell Growth by Counteracting Acidosis through the Regulation of the Intracellular pH. Cancer Res. 2009, 69, 358–368. [Google Scholar] [CrossRef] [PubMed]
- Gondi, G.; Mysliwietz, J.; Hulikova, A.; Jen, J.P.; Swietach, P.; Kremmer, E.; Zeidler, R. Antitumor Efficacy of a Monoclonal Antibody That Inhibits the Activity of Cancer-Associated Carbonic Anhydrase XII. Cancer Res. 2013, 73, 6494–6503. [Google Scholar] [CrossRef] [PubMed]
- Boyd, N.H.; Walker, K.; Fried, J.; Hackney, J.R.; McDonald, P.C.; Benavides, G.A.; Spina, R.; Audia, A.; Scott, S.E.; Libby, C.J.; et al. Addition of carbonic anhydrase 9 inhibitor SLC-0111 to temozolomide treatment delays glioblastoma growth in vivo. JCI Insight 2017, 2. [Google Scholar] [CrossRef]
- Koyuncu, I.; Gonel, A.; Durgun, M.; Koçyiğit, A.; Yuksekdag, O.; Supuran, C. Assessment of the antiproliferative and apoptotic roles of sulfonamide carbonic anhydrase IX inhibitors in HeLa cancer cell line. J. Enzym. Inhib. Med. Chem. 2018, 34, 75–86. [Google Scholar] [CrossRef]
- Supuran, C.T. Carbonic Anhydrase Inhibition and the Management of Hypoxic Tumors. Metabolites 2017, 7, 48. [Google Scholar] [CrossRef]
- Hinton, A.; Sennoune, S.R.; Bond, S.; Fang, M.; Reuveni, M.; Sahagian, G.G.; Jay, D.; Martinez-Zaguilan, R.; Forgac, M. Function of a Subunit Isoforms of the V-ATPase in pH Homeostasis and in Vitro Invasion of MDA-MB231 Human Breast Cancer Cells. J. Biol. Chem. 2009, 284, 16400–16408. [Google Scholar] [CrossRef] [PubMed]
- Morais-Santos, F.; Miranda-Gonçalves, V.; Pinheiro, S.; Vieira, A.F.; Paredes, J.; Schmitt, F.; Baltazar, F.; Pinheiro, C. Differential sensitivities to lactate transport inhibitors of breast cancer cell lines. Endocr. Relat. Cancer 2013, 21, 27–38. [Google Scholar] [CrossRef]
- Morais-Santos, F.; Granja, S.; Miranda-Gonçalves, V.; Moreira, A.H.; Queiros, S.; Vilaca, J.L.; Schmitt, F.; Longatto-Filho, A.; Paredes, J.; Baltazar, F.; et al. Targeting lactate transport suppresses in vivo breast tumour growth. Oncotarget 2015, 6, 19177–19189. [Google Scholar] [CrossRef]
- Enerson, B.E.; Drewes, L.R. Molecular Features, Regulation, and Function of Monocarboxylate Transporters: Implications for Drug Delivery. J. Pharm. Sci. 2003, 92, 1531–1544. [Google Scholar] [CrossRef]
- Kumar, A.; Kant, S.; Singh, S.M. Targeting monocarboxylate transporter by α-cyano-4-hydroxycinnamate modulates apoptosis and cisplatin resistance of Colo205 cells: Implication of altered cell survival regulation. Apoptosis 2013, 18, 1574–1585. [Google Scholar] [CrossRef]
- Sonveaux, P.; Végran, F.; Schroeder, T.; Wergin, M.C.; Verrax, J.; Rabbani, Z.N.; De Saedeleer, C.J.; Kennedy, K.M.; Diepart, C.; Jordan, B.F.; et al. Targeting lactate-fueled respiration selectively kills hypoxic tumor cells in mice. J. Clin. Investig. 2008, 118, 3930–3942. [Google Scholar] [CrossRef] [PubMed]
- Miranda-Gonçalves, V.; Granja, S.; Martinho, O.; Honavar, M.; Pojo, M.; Costa, B.M.; Pires, M.M.; Pinheiro, C.; Cordeiro, M.; Bebiano, G.; et al. Hypoxia-mediated upregulation of MCT1 expression supports the glycolytic phenotype of glioblastomas. Oncotarget 2016, 7, 46335–46353. [Google Scholar] [CrossRef] [PubMed]
- Colen, C.B.; Shen, Y.; Ghoddoussi, F.; Yu, P.; Francis, T.B.; Koch, B.J.; Monterey, M.D.; Galloway, M.P.; Sloan, A.E.; Mathupala, S.P. Metabolic Targeting of Lactate Efflux by Malignant Glioma Inhibits Invasiveness and Induces Necrosis: An In Vivo Study. Neoplasia 2011, 13, 620–632. [Google Scholar] [CrossRef] [PubMed]
- Granja, S.; Tavares-Valente, D.; Queirós, O.; Baltazar, F. Value of pH regulators in the diagnosis, prognosis and treatment of cancer. Semin. Cancer Biol. 2017, 43, 17–34. [Google Scholar] [CrossRef]
- Sousa, B.; Paredes, J.; Milanezi, F.; Lopes, N.; Martins, D.; Dufloth, R.; Vieira, D.; Albergaria, A.; Veronese, L.; Carneiro, V.; et al. P-cadherin, vimentin and CK14 for identification of basal-like phenotype in breast carcinomas: An im-munohistochemical study. Histol. Histopathol. 2010, 25, 963–974. [Google Scholar] [PubMed]
- Pelicano, H.; Zhang, W.; Liu, J.; Hammoudi, N.; Dai, J.; Xu, R.-H.; Pusztai, L.; Huang, P. Mitochondrial dysfunction in some triple-negative breast cancer cell lines: Role of mTOR pathway and therapeutic potential. Breast Cancer Res. 2014, 16, 1–16. [Google Scholar] [CrossRef]
- Voigt, W. Sulforhodamine B Assay and Chemosensitivity. Chemosensitivity 2005, 110, 039–048. [Google Scholar] [CrossRef]
- Miranda-Gonçalves, V.; Honavar, M.; Pinheiro, C.; Martinho, O.; Pires, M.M.; Pinheiro, C.; Cordeiro, M.; Bebiano, G.; Costa, P.; Palmeirim, I.; et al. Monocarboxylate transporters (MCTs) in gliomas: Expression and exploitation as therapeutic targets. Neuro-Oncology 2012, 15, 172–188. [Google Scholar] [CrossRef] [PubMed]
- Tavares-Valente, D.; Granja, S.; Baltazar, F.; Queirós, O. Bioenergetic modulators hamper cancer cell viability and enhance response to chemotherapy. J. Cell. Mol. Med. 2018, 22, 3782–3794. [Google Scholar] [CrossRef]
- Chou, T.-C. Drug Combination Studies and Their Synergy Quantification Using the Chou-Talalay Method. Cancer Res. 2010, 70, 440–446. [Google Scholar] [CrossRef] [PubMed]
- Hussien, R.; Brooks, G.A. Mitochondrial and plasma membrane lactate transporter and lactate dehydrogenase isoform expression in breast cancer cell lines. Physiol. Genom. 2011, 43, 255–264. [Google Scholar] [CrossRef]
- Gottesman, M.M. Mechanisms of Cancer Drug Resistance. Annu. Rev. Med. 2002, 53, 615–627. [Google Scholar] [CrossRef]
- Spugnini, E.P.; Baldi, A.; Buglioni, S.; Carocci, F.; de Bazzichini, G.M.; Betti, G.; Pantaleo, I.; Menicagli, F.; Citro, G.; Fais, S. Lansoprazole as a rescue agent in chemoresistant tumors: A phase I/II study in companion animals with spontaneously occurring tumors. J. Transl. Med. 2011, 9, 221. [Google Scholar] [CrossRef] [PubMed]
- Dhup, S.; Dadhich, R.K.; Porporato, P.E.; Sonveaux, P. Multiple Biological Activities of Lactic Acid in Cancer: Influences on Tumor Growth, Angiogenesis and Metastasis. Curr. Pharm. Des. 2012, 18, 1319–1330. [Google Scholar] [CrossRef] [PubMed]
- Swietach, P.; Vaughan-Jones, R.D.; Harris, A.L. Regulation of tumor pH and the role of carbonic anhydrase 9. Cancer Metastasis Rev. 2007, 26, 299–310. [Google Scholar] [CrossRef] [PubMed]
- Harguindey, S.; Arranz, J.L.; Wahl, M.L.; Orive, G.; Reshkin, S.J. Proton transport inhibitors as potentially selective anticancer drugs. Anticancer. Res. 2009, 29, 2127–2136. [Google Scholar]
- Larsen, A.K.; Escargueil, A.E.; Skladanowski, A. Resistance mechanisms associated with altered intracellular distribution of anticancer agents. Pharmacol. Ther. 2000, 85, 217–229. [Google Scholar] [CrossRef]
- Raghunand, N.; Gillies, R.J. pH and drug resistance in tumors. Drug Resist. Updat. 2000, 3, 39–47. [Google Scholar] [CrossRef]
- Choi, S.U.; Kim, N.Y.; Choi, E.J.; Kim, K.H.; Lee, C.O. Establishment of doxorubicin-resistant subline derived from HCT15 human colorectal cancer cells. Arch. Pharmacal Res. 1996, 19, 342–347. [Google Scholar] [CrossRef]
- Ciucci, A.; Gianferretti, P.; Piva, R.; Guyot, T.; Snape, T.J.; Roberts, S.M.; Santoro, M.G. Induction of apoptosis in estrogen receptor-negative breast cancer cells by natural and synthetic cyclopen-tenones: Role of the IkappaB kinase/nuclear factor-kappaB pathway. Mol. Pharmacol. 2006, 70, 1812–1821. [Google Scholar] [CrossRef] [PubMed]
- Raghunand, N.; Mahoney, B.P.; Gillies, R.J. Tumor acidity, ion trapping and chemotherapeutics. II. pH-dependent partition coefficients predict importance of ion trapping on pharmacokinetics of weakly basic chemotherapeutic agents. Biochem. Pharmacol. 2003, 66, 1219–1229. [Google Scholar] [CrossRef]
- Gatenby, R.A.; Gawlinski, E.T.; Gmitro, A.F.; Kaylor, B.; Gillies, R.J. Acid-Mediated Tumor Invasion: A Multidisciplinary Study. Cancer Res. 2006, 66, 5216–5223. [Google Scholar] [CrossRef] [PubMed]
- Smallbone, K.; Gavaghan, D.J.; Gatenby, R.A.; Maini, P.K. The role of acidity in solid tumour growth and invasion. J. Theor. Biol. 2005, 235, 476–484. [Google Scholar] [CrossRef] [PubMed]
- Paradise, R.K.; Lauffenburger, D.A.; Van Vliet, K.J. Acidic extracellular pH promotes activation of integrin αvβ3. PLoS ONE 2011, 6, e15746. [Google Scholar] [CrossRef] [PubMed]
- Nishisho, T.; Hata, K.; Nakanishi, M.; Morita, Y.; Sun-Wada, G.-H.; Wada, Y.; Yasui, N.; Yoneda, T. The a3 Isoform Vacuolar Type H+-ATPase Promotes Distant Metastasis in the Mouse B16 Melanoma Cells. Mol. Cancer Res. 2011, 9, 845–855. [Google Scholar] [CrossRef]
- Rojas, J.D.; Sennoune, S.R.; Maiti, D.; Bakunts, K.; Reuveni, M.; Sanka, S.C.; Martinez, G.M.; Seftor, E.A.; Meininger, C.J.; Wu, G.; et al. Vacuolar-type H+-ATPases at the plasma membrane regulate pH and cell migration in microvascular en-dothelial cells. Am. J. Physiol. Heart Circ. Physiol. 2006, 291, H1147–H1157. [Google Scholar] [CrossRef]
- Stock, C.; Gassner, B.; Hauck, C.R.; Arnold, H.; Mally, S.; Eble, J.A.; Dieterich, P.; Schwab, A. Migration of human melanoma cells depends on extracellular pH and Na+/H+exchange. J. Physiol. 2005, 567, 225–238. [Google Scholar] [CrossRef]
- Gocheva, V.; Joyce, J.A. Cysteine cathepsins and the cutting edge of cancer invasion. Cell Cycle 2007, 6, 60–64. [Google Scholar] [CrossRef] [PubMed]
- Cathcart, J.; Pulkoski-Gross, A.; Cao, J. Targeting matrix metalloproteinases in cancer: Bringing new life to old ideas. Genes Dis. 2015, 2, 26–34. [Google Scholar] [CrossRef]
- Zhitomirsky, B.; Assaraf, Y.G. The role of cytoplasmic-to-lysosomal pH gradient in hydrophobic weak base drug sequestration in lysosomes. Cancer Cell Microenviron. 2015, 2, e807. [Google Scholar]
- Amith, S.R.; Wilkinson, J.M.; Baksh, S.; Fliegel, L. The Na+/H+ exchanger (NHE1) as a novel co-adjuvant target in paclitaxel therapy of triple-negative breast cancer cells. Oncotarget 2014, 6, 1262–1275. [Google Scholar] [CrossRef]
- Di Cristofori, A.; Ferrero, S.; Bertolini, I.; Gaudioso, G.; Russo, M.V.; Berno, V.; Vanini, M.; Locatelli, M.; Zavanone, M.; Rampini, P.; et al. The vacuolar H+ ATPase is a novel therapeutic target for glioblastoma. Oncotarget 2015, 6, 17514–17531. [Google Scholar] [CrossRef]
- Kivelä, A.; Parkkila, S.; Saarnio, J.; Karttunen, T.J.; Kivelä, J.; Parkkila, A.-K.; Waheed, A.; Sly, W.S.; Grubb, J.H.; Shah, G.; et al. Expression of a Novel Transmembrane Carbonic Anhydrase Isozyme XII in Normal Human Gut and Colorectal Tumors. Am. J. Pathol. 2000, 156, 577–584. [Google Scholar] [CrossRef]
- Yoo, C.W.; Nam, B.H.; Kim, J.Y.; Shin, H.J.; Lim, H.; Lee, S.; Lee, S.K.; Lim, M.C.; Song, Y.J. Carbonic anhydrase XII expression is associated with histologic grade of cervical cancer and superior ra-diotherapy outcome. Radiat. Oncol. 2010, 5, 101. [Google Scholar] [CrossRef]
- Parkkila, S.; Parkkila, A.-K.; Saarnio, J.; Kivelä, J.; Karttunen, T.J.; Kaunisto, K.; Waheed, A.; Sly, W.S.; Türeci, Ö.; Virtanen, I.; et al. Expression of the Membrane-associated Carbonic Anhydrase Isozyme XII in the Human Kidney and Renal Tumors. J. Histochem. Cytochem. 2000, 48, 1601–1608. [Google Scholar] [CrossRef]
- Ilie, M.I.; Hofman, V.; Ortholan, C.; El Ammadi, R.; Bonnetaud, C.; Havet, K.; Vénissac, N.; Mouroux, J.; Mazure, N.M.; Pouyssegur, J.; et al. Overexpression of carbonic anhydrase XII in tissues from resectable non-small cell lung cancers is a biomarker of good prognosis. Int. J. Cancer 2010, 128, 1614–1623. [Google Scholar] [CrossRef]
- Kivelä, A.J.; Parkkila, S.; Saarnio, J.; Karttunen, T.J.; Kivelä, J.; Parkkila, A.-K.; Pastoreková, S.; Pastorek, J.; Waheed, A.; Sly, W.S.; et al. Expression of transmembrane carbonic anhydrase isoenzymes IX and XII in normal human pancreas and pancreatic tumours. Histochem. Cell Biol. 2000, 114, 197–204. [Google Scholar] [CrossRef]
- Watson, P.H.; Chia, S.K.; Wykoff, C.C.; Han, C.; Leek, R.D.; Sly, W.S.; Gatter, K.C.; Ratcliffe, P.; Harris, A.L. Carbonic anhydrase XII is a marker of good prognosis in invasive breast carcinoma. Br. J. Cancer 2003, 88, 1065–1070. [Google Scholar] [CrossRef] [PubMed]
- Chien, M.-H.; Ying, T.-H.; Hsieh, Y.-H.; Lin, C.-H.; Shih, C.-H.; Wei, L.-H.; Yang, S.-F. Tumor-associated carbonic anhydrase XII is linked to the growth of primary oral squamous cell carcinoma and its poor prognosis. Oral Oncol. 2012, 48, 417–423. [Google Scholar] [CrossRef] [PubMed]
- Haapasalo, J.; Hilvo, M.; Nordfors, K.; Haapasalo, H.; Parkkila, S.; Hyrskyluoto, A.; Rantala, I.; Waheed, A.; Sly, W.S.; Pastorekova, S.; et al. Identification of an alternatively spliced isoform of carbonic anhydrase XII in diffusely infiltrating as-trocytic gliomas. Neuro Oncol. 2008, 10, 131–138. [Google Scholar] [CrossRef]
- Meehan, J.; Ward, C.; Turnbull, A.; Bukowski-Wills, J.; Finch, A.J.; Jarman, E.J.; Xintaropoulou, C.; Martinez-Perez, C.; Gray, M.; Pearson, M.; et al. Inhibition of pH regulation as a therapeutic strategy in hypoxic human breast cancer cells. Oncotarget 2017, 8, 42857–42875. [Google Scholar] [CrossRef]
- Cairns, R.; Papandreou, I.; Denko, N. Overcoming Physiologic Barriers to Cancer Treatment by Molecularly Targeting the Tumor Microenvironment. Mol. Cancer Res. 2006, 4, 61–70. [Google Scholar] [CrossRef] [PubMed]


Publisher’s Note: MDPI stays neutral with regard to jurisdictional claims in published maps and institutional affiliations. |
© 2021 by the authors. Licensee MDPI, Basel, Switzerland. This article is an open access article distributed under the terms and conditions of the Creative Commons Attribution (CC BY) license (http://creativecommons.org/licenses/by/4.0/).