
Kidney and Liver Tissue Tacrolimus Concentrations in Adult Transplant Recipients—The Influence of the Whole Blood and Tissue Concentrations on Efficiency of Treatment during Immunosuppressive Therapy

 , ,
, ,
Abstract
:1. Introduction
2. Materials and Methods
2.1. Patients, Population and Immunosuppression Protocol
2.2. Chemicals and Reagents
2.3. Calibration Standards and Quality Control Samples
2.4. TAC Extraction from Kidney and Liver Tissue Samples
2.5. LC-MS/MS System and Conditions
2.6. Method Validation
2.6.1. Matrix Effect
2.6.2. Autosampler Stability
2.6.3. Short-Term Stability
2.6.4. Working Solution Stability
2.7. Data Analysis
3. Results
3.1. Assay Validation
3.2. Clinical Data
4. Discussion
Author Contributions
Funding
Institutional Review Board Statement
Informed Consent Statement
Acknowledgments
Conflicts of Interest
References
- Kahan, B.D.; Keown, P.; Levy, G.A.; Johnston, A. Therapeutic Drug Monitoring of immunosuppressant drugs in clinical practice. Clin. Ther. 2002, 24, 330–350. [Google Scholar] [CrossRef]
- Ghareeb, M.; Akhiaghi, F. Alternative matrices for therapeutic drug monitoring of immunosuppressive agents using LC-MS/MS. Bioanalysis 2015, 7, 1037–1058. [Google Scholar] [CrossRef] [PubMed] [Green Version]
- Brunet, M.; van Gelder, T.; Åsberg, A.; Haufroid, V.; Hesselink, D.A.; Langman, L.; Lemaitre, F.; Marquet, P.; Seger, C.; Shipkova, M.; et al. Therapeutic Drug Monitoring of Tacrolimus-Personalized Therapy: Second Consensus Report. Ther. Drug Monit. 2019, 41, 261–307. [Google Scholar] [CrossRef]
- Campagne, O.; Mager, D.E.; Tornatore, K.H. Population Pharmacokinetics of Tacrolimus in Transplant Recipients: What did we learn about sources of interindividual variabilites? J. Clin. Pharmacol. 2019, 59, 309–325. [Google Scholar] [CrossRef] [PubMed]
- Capron, A.; Lerut, J.; Verbaandert, C.; Mathys, J.; Cicacalleri, O.; Vanbinst, R.; Roggen, F.; De Reyck, C.; Lemaire, J.; Wallemacq, P. Validation of a Liquid Chromatography-mass Spectrometric Assay for tacrolimus in Liver Biopsies after Hepatic Transplantation: Correlation with Histopatologic Staging of Rejection. Ther. Drug Monit. 2007, 29, 340–348. [Google Scholar] [CrossRef]
- Capron, A.; Musuamba, F.; Latinne, D.; Mourad, M.; Lerut, J.; Haufroid, V.; Wallemacq, P. Validation of a Liquid Chromatography-Mass Spectrometric Assay for Tacrolimus in Peripheral Blood Mononuclear Cells. Ther. Drug Monit. 2009, 31, 178–186. [Google Scholar] [CrossRef]
- Noll, B.D.; Coller, J.K.; Somogyi, A.A.; Morris, R.G.; Russ, G.R.; Hesselink, D.A.; van Gelder, T.; Sallustio, B.C. Measurement of Cyclosporine A in Rat Tissues and Human Kidney Transplant Biopsies-A Method Suitable for Small (<1 mg) Samples. Ther. Drug Monit. 2011, 33, 688–693. [Google Scholar] [CrossRef]
- Noll, B.D.; Coller, J.K.; Somogyi, A.A.; Morris, R.G.; Russ, G.R.; Hesselink, D.A.; Van Gelder, T.; Sallustio, B.C. LC-MS/MS quantification of tacrolimus concentrations in small samples of kidney and liver tissue. In Therapeutic Drug Monitoring; Lippincott Williams & Wilkins: Philadelphia, PA, USA, 2011; Volume 33, p. 226. [Google Scholar]
- Sandborn, W.J.; Lawson, G.M.; Cody, T.J.; Porayko, M.K.; Hay, J.E.; Gores, G.J.; Steers, J.L.; Krom, R.A.; Wiesner, R.H. Early Cellular Rejection after Orthotopic Liver Transplantation Correlates with Low Concentrations of FK506 in Hepatic Tissue. Hepatology 1995, 21, 70–76. [Google Scholar]
- Noll, B.D.; Coller, J.K.; Somogyi, A.A.; Morris, R.G.; Russ, G.R.; Hesselink, D.A.; van Gelder, T.; Sallustio, B.C. Validation of an LC-MS/MS Method to Measure Tacrolimus in Rat Kidney and Liver Tissue and Its Application to Human Kidney Biopsies. Ther. Drug Monit. 2013, 35, 617–623. [Google Scholar] [CrossRef]
- Bodnar-Broniarczyk, M.; Pawinski, T.; Kunicki, P.K. Isotope-labeled versus analog internal standard in LC-MS/MS method for tacrolimus determination in human whole blood samples—A compensation of matrix effects. J. Chromatogr. B 2019, 1104, 220–227. [Google Scholar] [CrossRef]
- Md Dom, Z.I.; Noll, B.D.; Coller, J.K.; Somogyi, A.; Russ, G.R.; Hesselink, D.A.; van Gelder, T.; Sallustio, B. Validation of an LC-MS/MS method for the quantification of mycophenolic acid in human kidney transplant biopsies. J. Chromatogr. B 2014, 945–946, 171–177. [Google Scholar] [CrossRef]
- European Medicines Agency. Guideline on Bioanalytical Method Validation; EMEA/CHMP/EWP/192217/2009 Rev. 1 Corr.*; EMA: London, UK, 2011; Available online: http://ema.europa.eu (accessed on 21 July 2011).
- US Food and Drug Administration. Q2(R1) Validation of Analytical Procedures: Text and Methodology Guidance for Industry. 2021. Available online: https://www.fda.gov/regulatory-information/search-fda-guidance-documents/q2r1-validation-analytical-procedures-text-and-methodology-guidance-industry (accessed on 16 September 2021).
- Pensi, D.; De Nicolo, A.; Pinon, M.; Calvo, P.L.; Nonnato, A.; Brunati, A.; Di Perri, G.; D′Avolio, A. An UPLC-MS/MS method coupled with automated on-line SPE for quantification of tacrolimus in peripheral blood mononuclear cells. J. Pharm. Biomed. Anal. 2015, 107, 512–517. [Google Scholar] [CrossRef]
- Lemaitre, F.; Antignac, M.; Fernandez, C. Monitoring of tacrolimus concentrations in peripheral blood mononuclear cells: Application to cardiac transplant recipients. Clin. Biochem. 2013, 46, 1538–1541. [Google Scholar] [CrossRef]
- Capron, A.; Lerut, J.; Latinne, D.; Rahier, J.; Haufroid, V.; Wallemacq, P. Correlation of tacrolimus levels in peripheral blood mononuclear cells with histological staging of rejection after liver transplantation: Preliminary results of a prospective study. Transpl. Int. 2012, 25, 41–47. [Google Scholar] [CrossRef] [PubMed]
- Lemaitre, F.; Antignac, M.; Verdier, M.C.; Bellisant, F.; Fernandez, C. Opportunity to monitor immunosuppressive drugs in peripheral blood mononuclear cells: Where are we and where are we going? Pharmacol. Res. 2013, 74, 109–112. [Google Scholar] [CrossRef] [PubMed]
- Capron, A.; Haufroid, V.; Wallemacq, P. Intra-cellular immunosuppressive drugs monitoring: A step forward towards better therapeutic efficacy after organ transplantation? Pharmacol. Res. 2016, 111, 610–618. [Google Scholar] [CrossRef]
- Bahmany, S.; de Wit, L.E.A.; Hesselink, D.A.; van Gelder, T. Highly sensitive and rapid determination of tacrolimus in peripheral blood mononuclear cells by liquid chromatography tandem mass spectrometry. Biomed. Chromatogr. 2018, e4416. [Google Scholar] [CrossRef]
- Klaasen, R.A.; Bergan, S.; Bremer, S.; Daleq, L.; Andersen, A.M.; Midtvedt, K.; Skauby, M.H.; Vethe, N.T. A longitudinal study of tacrolimus in lymphocytes during the first year after kidney transplantation. Ther. Drug Monit. 2018, 40, 558–566. [Google Scholar] [CrossRef]
- Han, S.S.; Yang, S.H.; Kim, M.C.; Cho, J.-Y.; Min, S., II; Lee, J.P.; Kim, D.K.; Ha, J.; Kim, Y.S. Monitoring the intracellular tacrolimus concentration in kidney transplant recipients with stable graft function. PLoS ONE 2016, 11, e0153491. [Google Scholar] [CrossRef]
- Sallustio, B.C. LC-MS/MS for immunosuppressant therapeutic drug monitoring. Bioanalysis 2010, 2, 1141–1153. [Google Scholar] [CrossRef] [PubMed]
- Taylor, P.J.; Tai, C.H.; Franklin, M.E.; Pillans, P.I. The current role of liquid chromatography-tandem mass spectrometry in therapeutic drug monitoring of immunosuppressant and antiretroviral drugs. Clin. Biochem. 2011, 44, 14–20. [Google Scholar] [CrossRef]
- Avataneo, V.; D′Avolio, A.; Cusato, J.; Cantu, M.; De Nicolo, A. LC-MS application for therapeutic drug monitoring in alternative matrices. J. Pharm. Biomed. Anal. 2019, 166, 40–51. [Google Scholar] [CrossRef]
- Tuzimski, T.; Petruczynik, A. Review of Chromatographic Methods Coupled with Modern Detection Techniques Applied in the Therapeutic Drugs Monitoring (TDM). Molecules 2020, 25, 4026. [Google Scholar] [CrossRef] [PubMed]
- Sallustio, B.C.; Noll, B.D.; Hu, R.; Barratt, D.T.; Tuke, J.; Coller, J.K.; Russ, G.R.; Somogyi, A.A. Tacrolimus dose, blood concentrations and acute nephrotoxicity, but not CYP3A5/ABCB1 genetics, are associated with allograft tacrolimus concentrations in renal transplant recipients. Br. J. Clin. Pharmacol. 2021. online ahead of print. [Google Scholar] [CrossRef]
- Krogstad, V.; Vethe, N.T.; Robertsen, I.; Hasvold, G.; Ose, A.D.; Hermann, M.; Andersen, A.M.; Chan, J.; Skauby, M.; Svensson, M.H.S.; et al. Determination of tacrolimus concentration and protein expression of P-glycoprotein in single human renal core biopsies. Ther. Drug Monit. 2018, 40, 292–300. [Google Scholar] [CrossRef]
- Tron, C.; Rayar, M.; Petitcollin, A.; Beaurepaire, J.-M.; Cusumano, C.; Verdier, M.-C.; Houssel-Debry, P.; Camus, C.; Boudjema, K.; Bellisant, E.; et al. A high-performance liquid chromatography tandem mass spectrometry for the quantification of tacrolimus in human bile in liver transplant recipients. J. Chromatogr. A 2016, 1475, 55–63. [Google Scholar] [CrossRef] [PubMed]


| (A) | ||||||
| Concentration | Intra-Assay (n = 6) | Inter-Assay (n = 12) | Extraction Efficiency (%) | |||
| Declared (pg/mg) | Calculated * (pg/mg) | Precision CV (%) | Accuracy (%) | Precision CV (%) | Accuracy (%) | |
| Kidney tissue | ||||||
| Low QC 20 | 21.32 ± 1.09 | 6.7 | 102.4 | 9.3 | 111.5 | 75.3 |
| Medium QC 150 | 158.70 ± 7.4 | 5.8 | 99.1 | 6.5 | 102.9 | 80.7 |
| High QC 250 | 260.25 ± 12.5 | 4.1 | 96.5 | 7.1 | 105.4 | 88.4 |
| TAC13C,D2 200 | 204.21 ± 4.72 | 2.1 | 97.8 | 2.5 | 102.4 | 95.1 |
| Liver tissue | ||||||
| Low QC 20 | 20.86 ± 0.98 | 4.3 | 103.8 | 8.2 | 93.4 | 71.6 |
| Medium QC 150 | 160.05 ± 11.5 | 6.7 | 105.1 | 9.7 | 107.9 | 81.1 |
| High QC 250 | 260.55 ± 10.4 | 4.2 | 97.9 | 10.5 | 104.8 | 90.3 |
| TAC13C,D2 200 | 203.84 ± 4.02 | 1.9 | 98.5 | 9.8 | 99.8 | 96.9 |
| LLOQ 10 | 10.32 ± 0.28 | 3.2 | 106.1 | 8.4 | 103.2 | 82.4 |
| (B) | ||||||
| Type of Tissue | TAC Peak Area | TAC13C,D2 Peak Area | TAC/TAC13C,D2 Ratio | |||
| CV (%) | Bias (%) | CV (%) | Bias (%) | CV (%) | Bias (%) | |
| Kidney | 7.4 | 11.2 (10 pg/mg) 9.8 (400 pg/mg) | 6.3 | 7.8 | 1.8 | 2.4 |
| TAC13C,D2 400 pg/mg | 5.2 | |||||
| Liver | 9.8 | 13.4 (10 pg/mg) | 7.1 | 10.5 | 3.2 | 5.6 |
| TAC13C,D2 200 pg/mg | 7.5 | |||||
| Patient Characteristics | Graft: Liver (n = 50) | Graft: Kidney (n = 50) |
|---|---|---|
| Age (years) | 46.2 ± 13.5 | 46.3 ± 14.0 |
| Gender (M/F) | 33/17 | 40/10 |
| ALT (IU/L) | 81.3 ± 100.6 | 20.4 ± 16.6 |
| AST (IU/L) | 65.2 ± 71.9 | 19.5 ± 14.0 |
| GGTP (IU/L) | 118.4 ± 76.6 | 52.3 ± 19.1 |
| GFR (mL/min/m2) | 83.1 ± 25.7 | 44.7 ± 16.2 |
| Creatinine (mg/dL) | 1.01 ± 0.37 | 1.77 ± 0.61 |
| Albumin (g/dL) | 4.36 ± 0.49 | 4.21 ± 0.55 |
| Hemoglobin (g/dL) | 13.57 ± 1.78 | 12.1 ± 3.22 |
| Hematocrit (%) | 40.07 ± 4.68 | 42.2 ± 3.54 |
| Bilirubine total (mg/dL) | 1.22 ± 0.86 | 0.52 ± 0.28 |
| Cold ischaemia time (h) | 10.1 (4.3–12.7) | 12.2 (5.7–22.5) |
| Acute rejection (%) | 10 | 15 |
| Time of allograft biopsy | 30 to 180 days posttransplant | 7 to 180 days posttransplant |
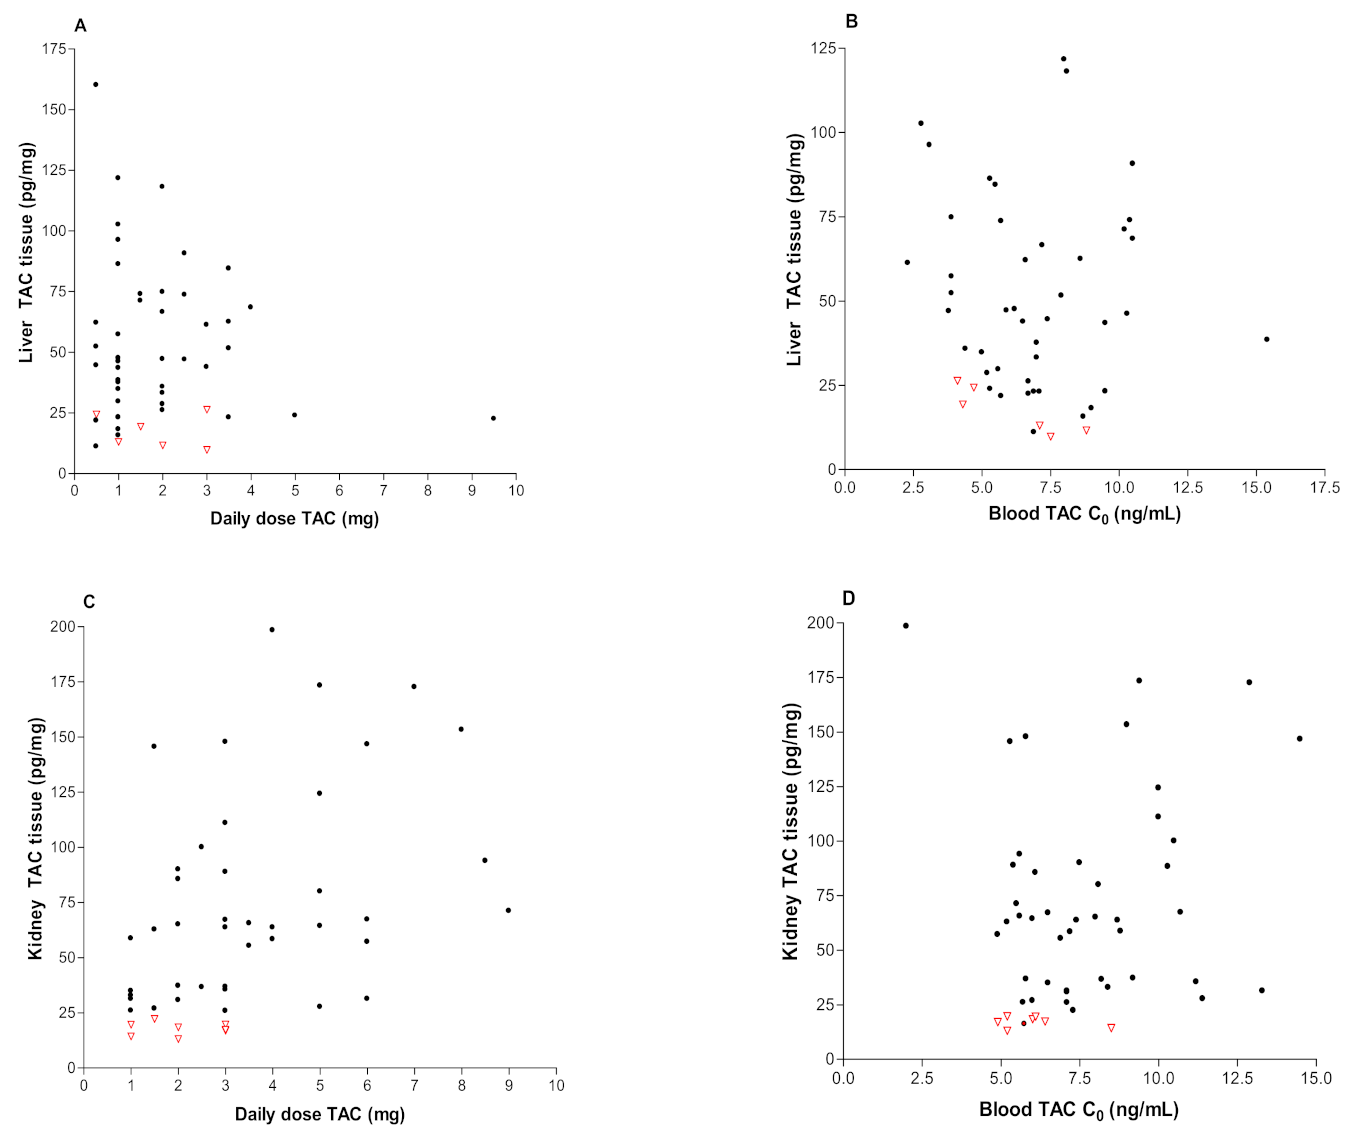
| Daily dose (mg) | 1.9 ± 1.5 | 3.6 ± 2.4 |
| Tissue (pg/mg) | 49.9 ± 32.1 | 65.2 ± 50.0 |
| Whole blood (ng/mL) | 7.2 ± 3.2 | 7.5 ± 2.6 |
Publisher’s Note: MDPI stays neutral with regard to jurisdictional claims in published maps and institutional affiliations. |
© 2021 by the authors. Licensee MDPI, Basel, Switzerland. This article is an open access article distributed under the terms and conditions of the Creative Commons Attribution (CC BY) license (https://creativecommons.org/licenses/by/4.0/).
Share and Cite
Bodnar-Broniarczyk, M.; Durlik, M.; Bączkowska, T.; Czerwińska, K.; Marszałek, R.; Pawiński, T. Kidney and Liver Tissue Tacrolimus Concentrations in Adult Transplant Recipients—The Influence of the Whole Blood and Tissue Concentrations on Efficiency of Treatment during Immunosuppressive Therapy. Pharmaceutics 2021, 13, 1576. https://doi.org/10.3390/pharmaceutics13101576
Bodnar-Broniarczyk M, Durlik M, Bączkowska T, Czerwińska K, Marszałek R, Pawiński T. Kidney and Liver Tissue Tacrolimus Concentrations in Adult Transplant Recipients—The Influence of the Whole Blood and Tissue Concentrations on Efficiency of Treatment during Immunosuppressive Therapy. Pharmaceutics. 2021; 13(10):1576. https://doi.org/10.3390/pharmaceutics13101576
Chicago/Turabian StyleBodnar-Broniarczyk, Magdalena, Magdalena Durlik, Teresa Bączkowska, Katarzyna Czerwińska, Ryszard Marszałek, and Tomasz Pawiński. 2021. "Kidney and Liver Tissue Tacrolimus Concentrations in Adult Transplant Recipients—The Influence of the Whole Blood and Tissue Concentrations on Efficiency of Treatment during Immunosuppressive Therapy" Pharmaceutics 13, no. 10: 1576. https://doi.org/10.3390/pharmaceutics13101576
APA StyleBodnar-Broniarczyk, M., Durlik, M., Bączkowska, T., Czerwińska, K., Marszałek, R., & Pawiński, T. (2021). Kidney and Liver Tissue Tacrolimus Concentrations in Adult Transplant Recipients—The Influence of the Whole Blood and Tissue Concentrations on Efficiency of Treatment during Immunosuppressive Therapy. Pharmaceutics, 13(10), 1576. https://doi.org/10.3390/pharmaceutics13101576