A New Nano-Platform of Erythromycin Combined with Ag Nano-Particle ZnO Nano-Structure against Methicillin-Resistant Staphylococcus aureus


Abstract
1. Introduction
2. Materials and Methods
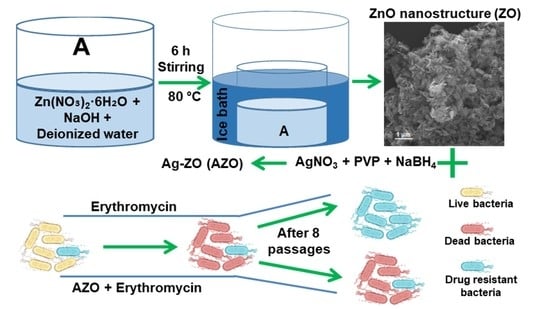
2.1. Synthesis of ZnO (ZO) Nano-Structure
2.2. Synthesis of Ag-ZO (AZO)
2.3. Preparation of Ag-ZO-Erythromycin (AZE)
2.4. Characterization
2.4.1. Material Properties
2.4.2. Preparation of Bacterial Cells
2.4.3. Agar Well Diffusion Assay
2.4.4. Minimum Inhibitory Concentration (MIC) of Antibacterial Activity
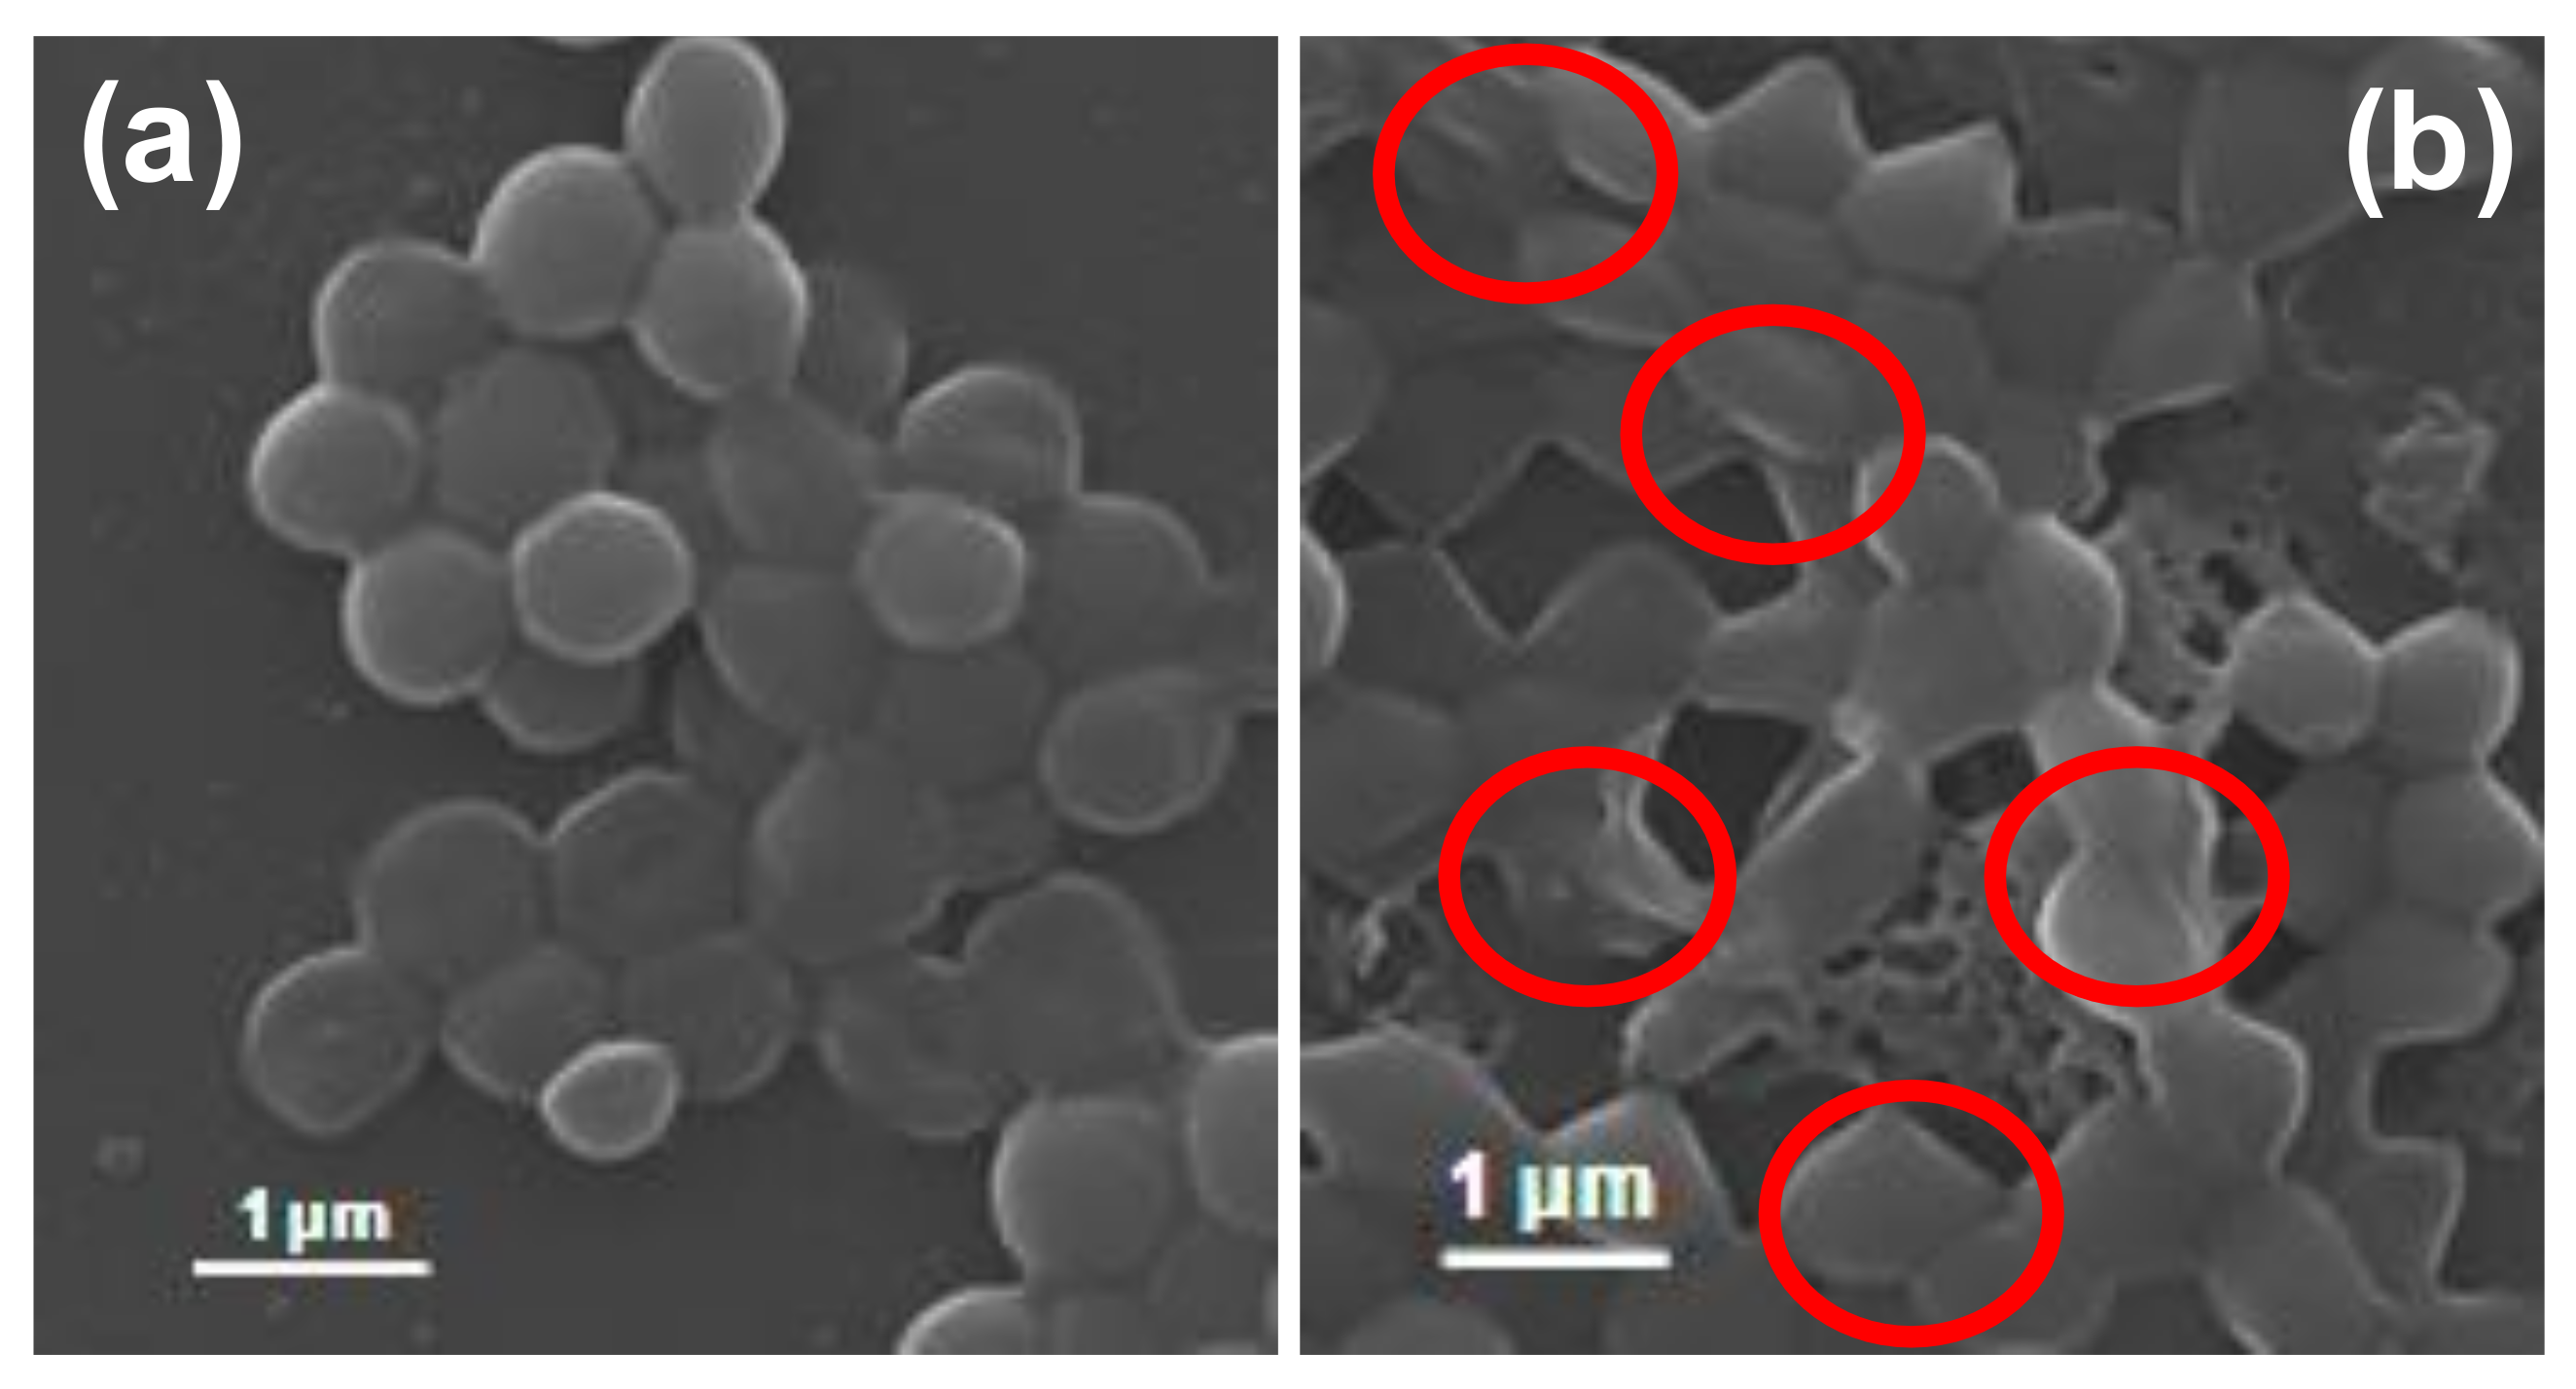
2.4.5. Morphological Characterization of Bacteria
2.4.6. Drug Resistance Study
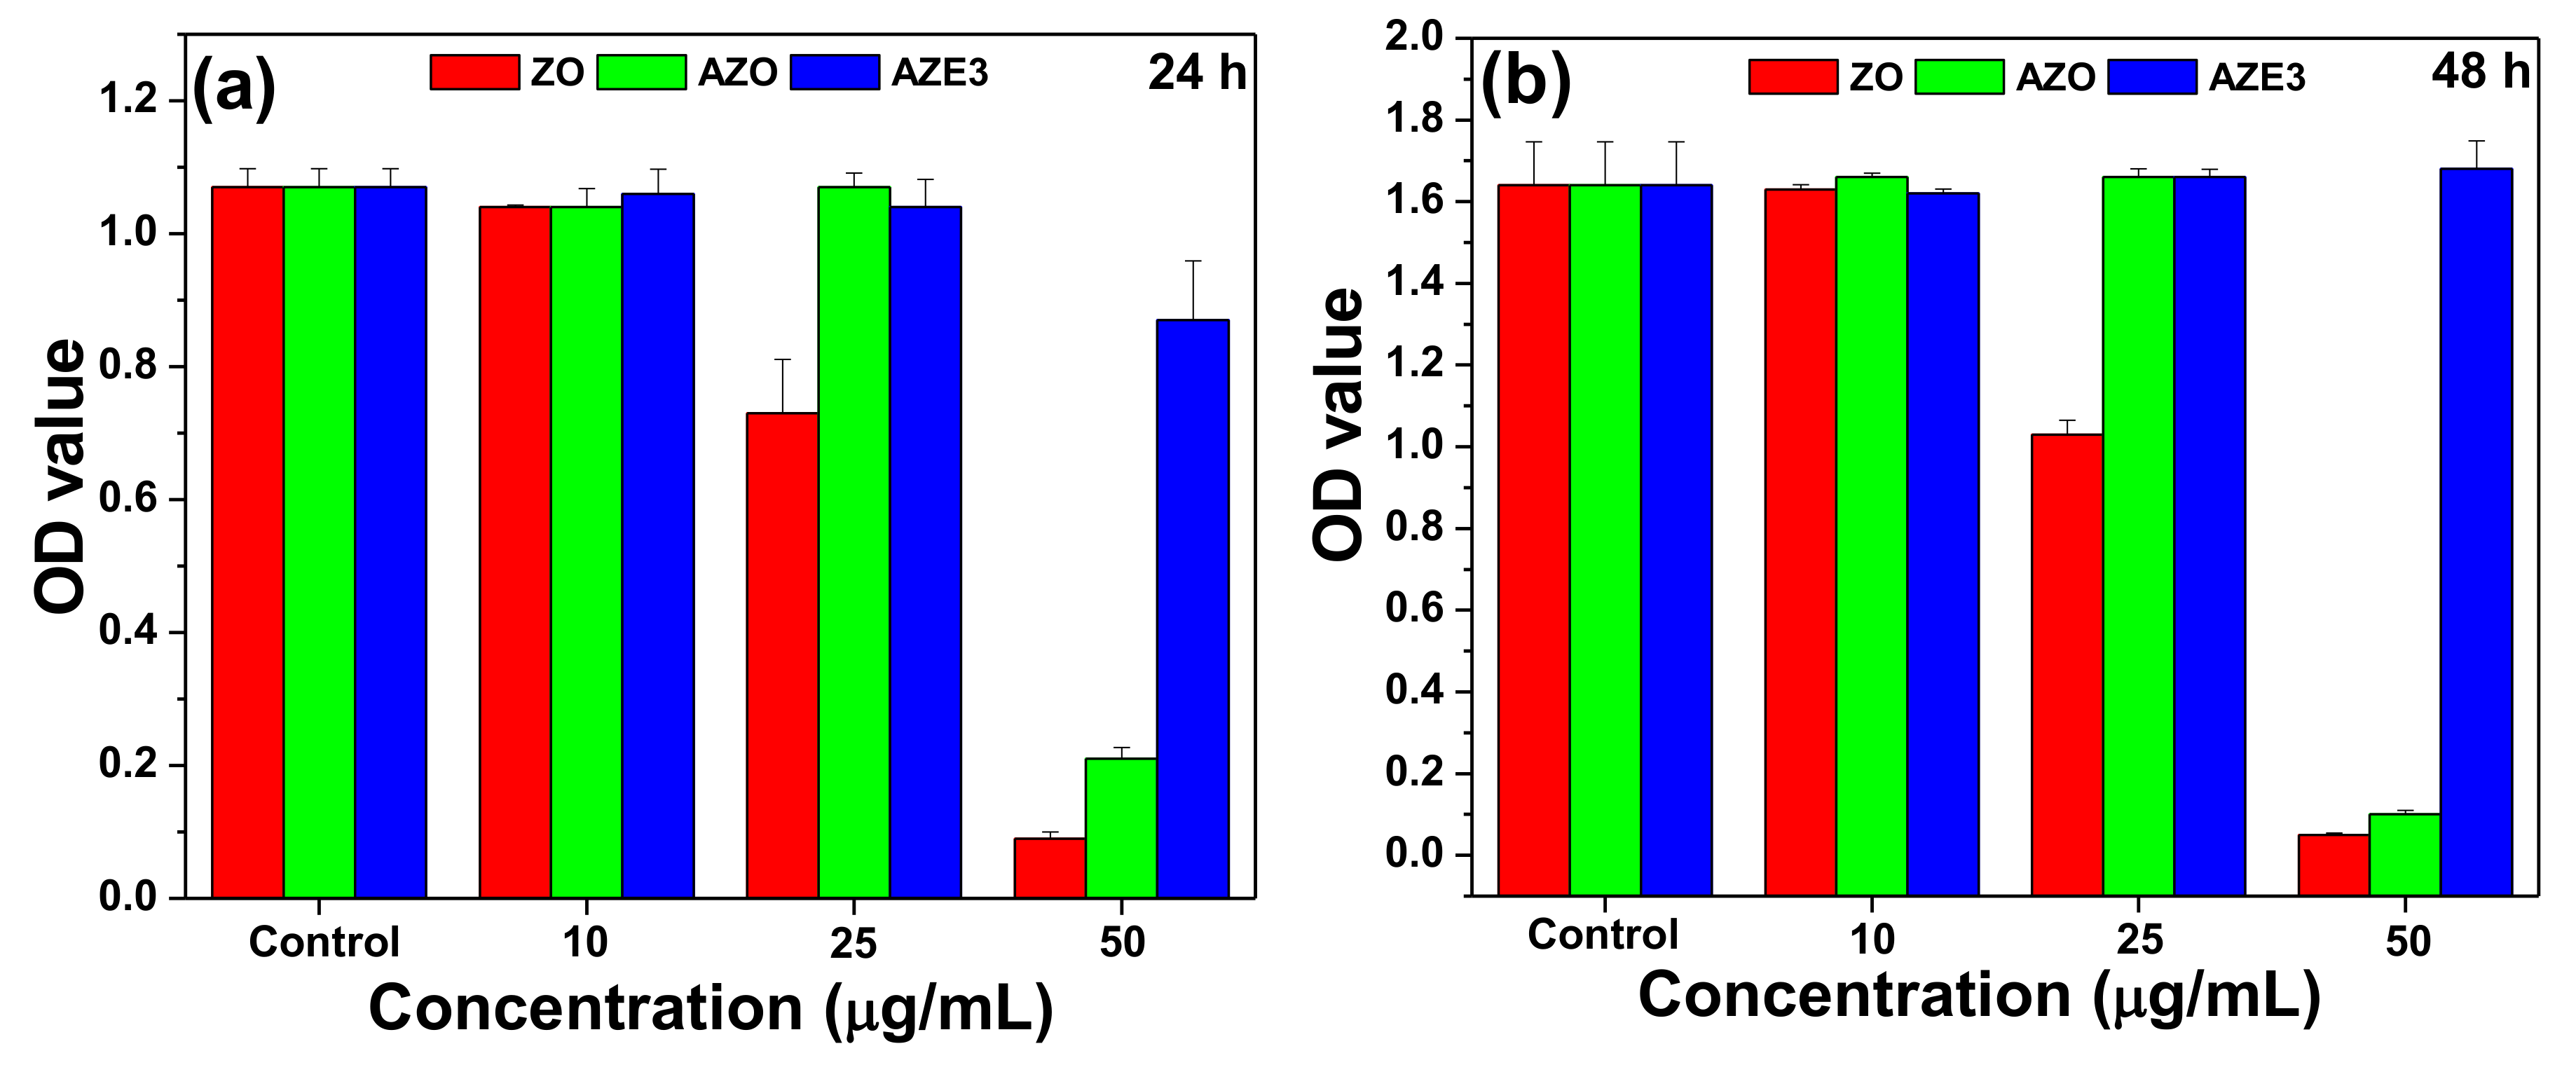
2.4.7. Cell Viability Study (Water Soluble Tetrazolium Salt, WST Assay)
3. Results and Discussion
3.1. Material Properties
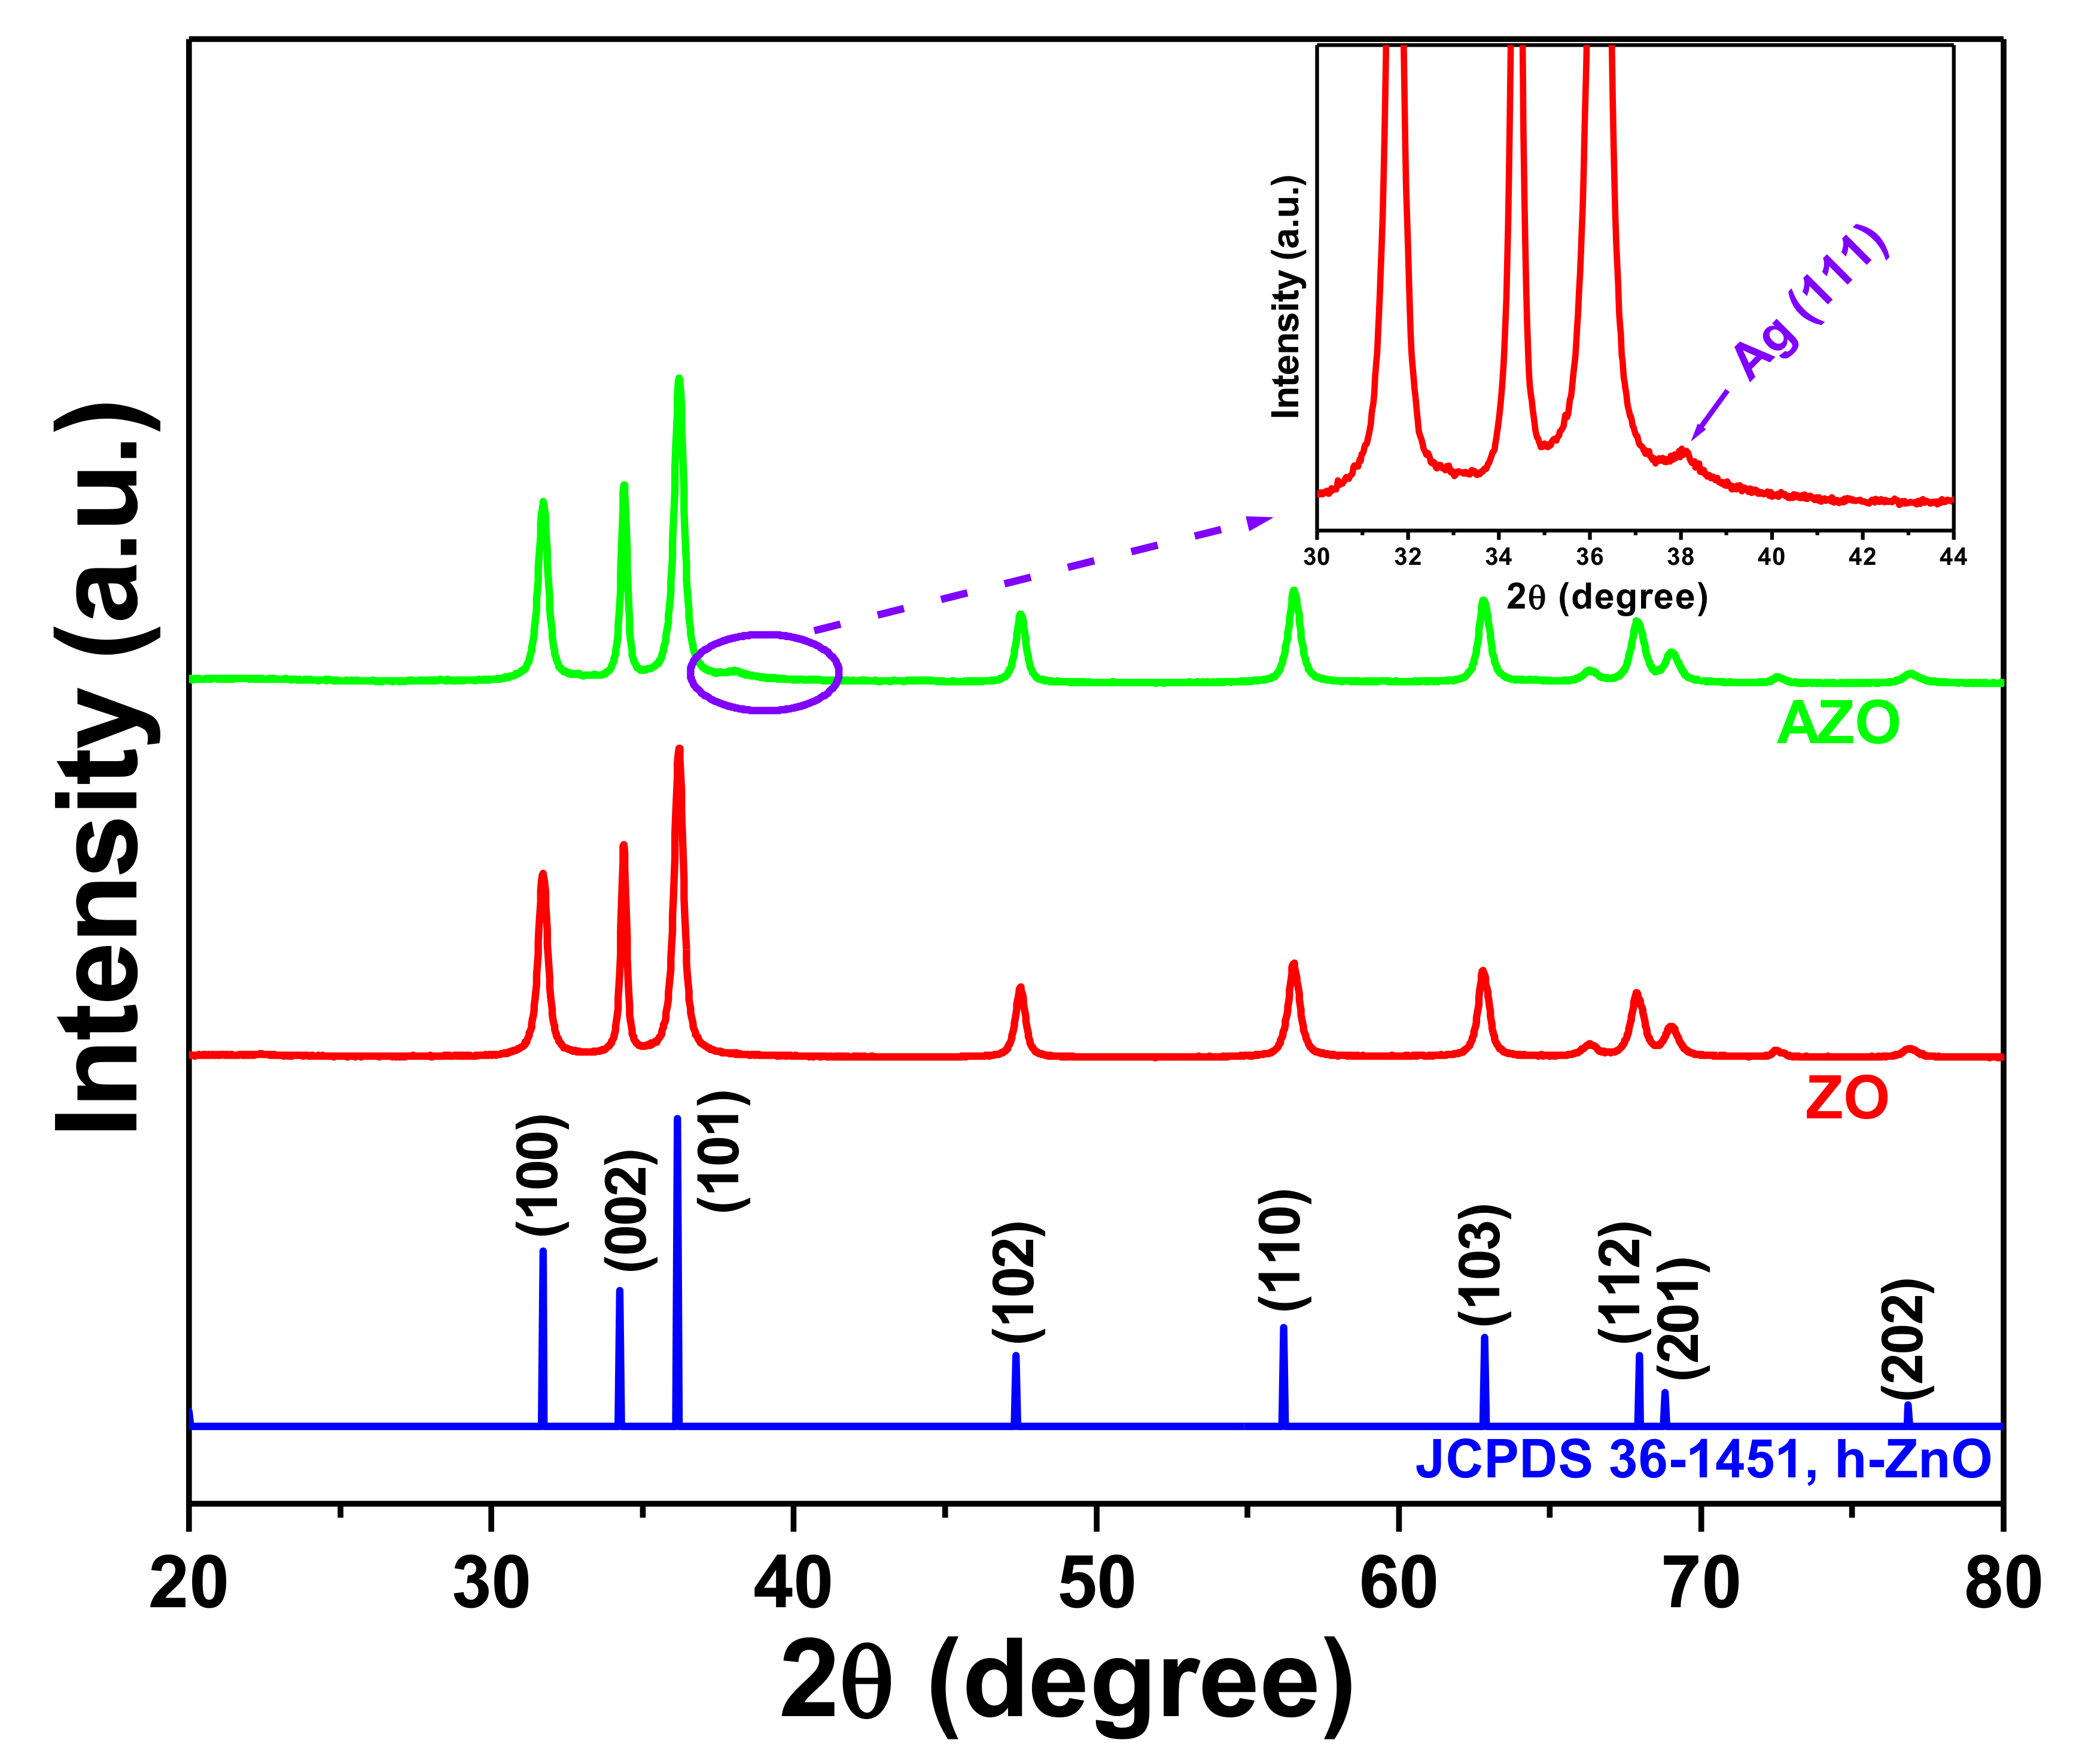
3.1.1. X-ray Diffraction (XRD) Study
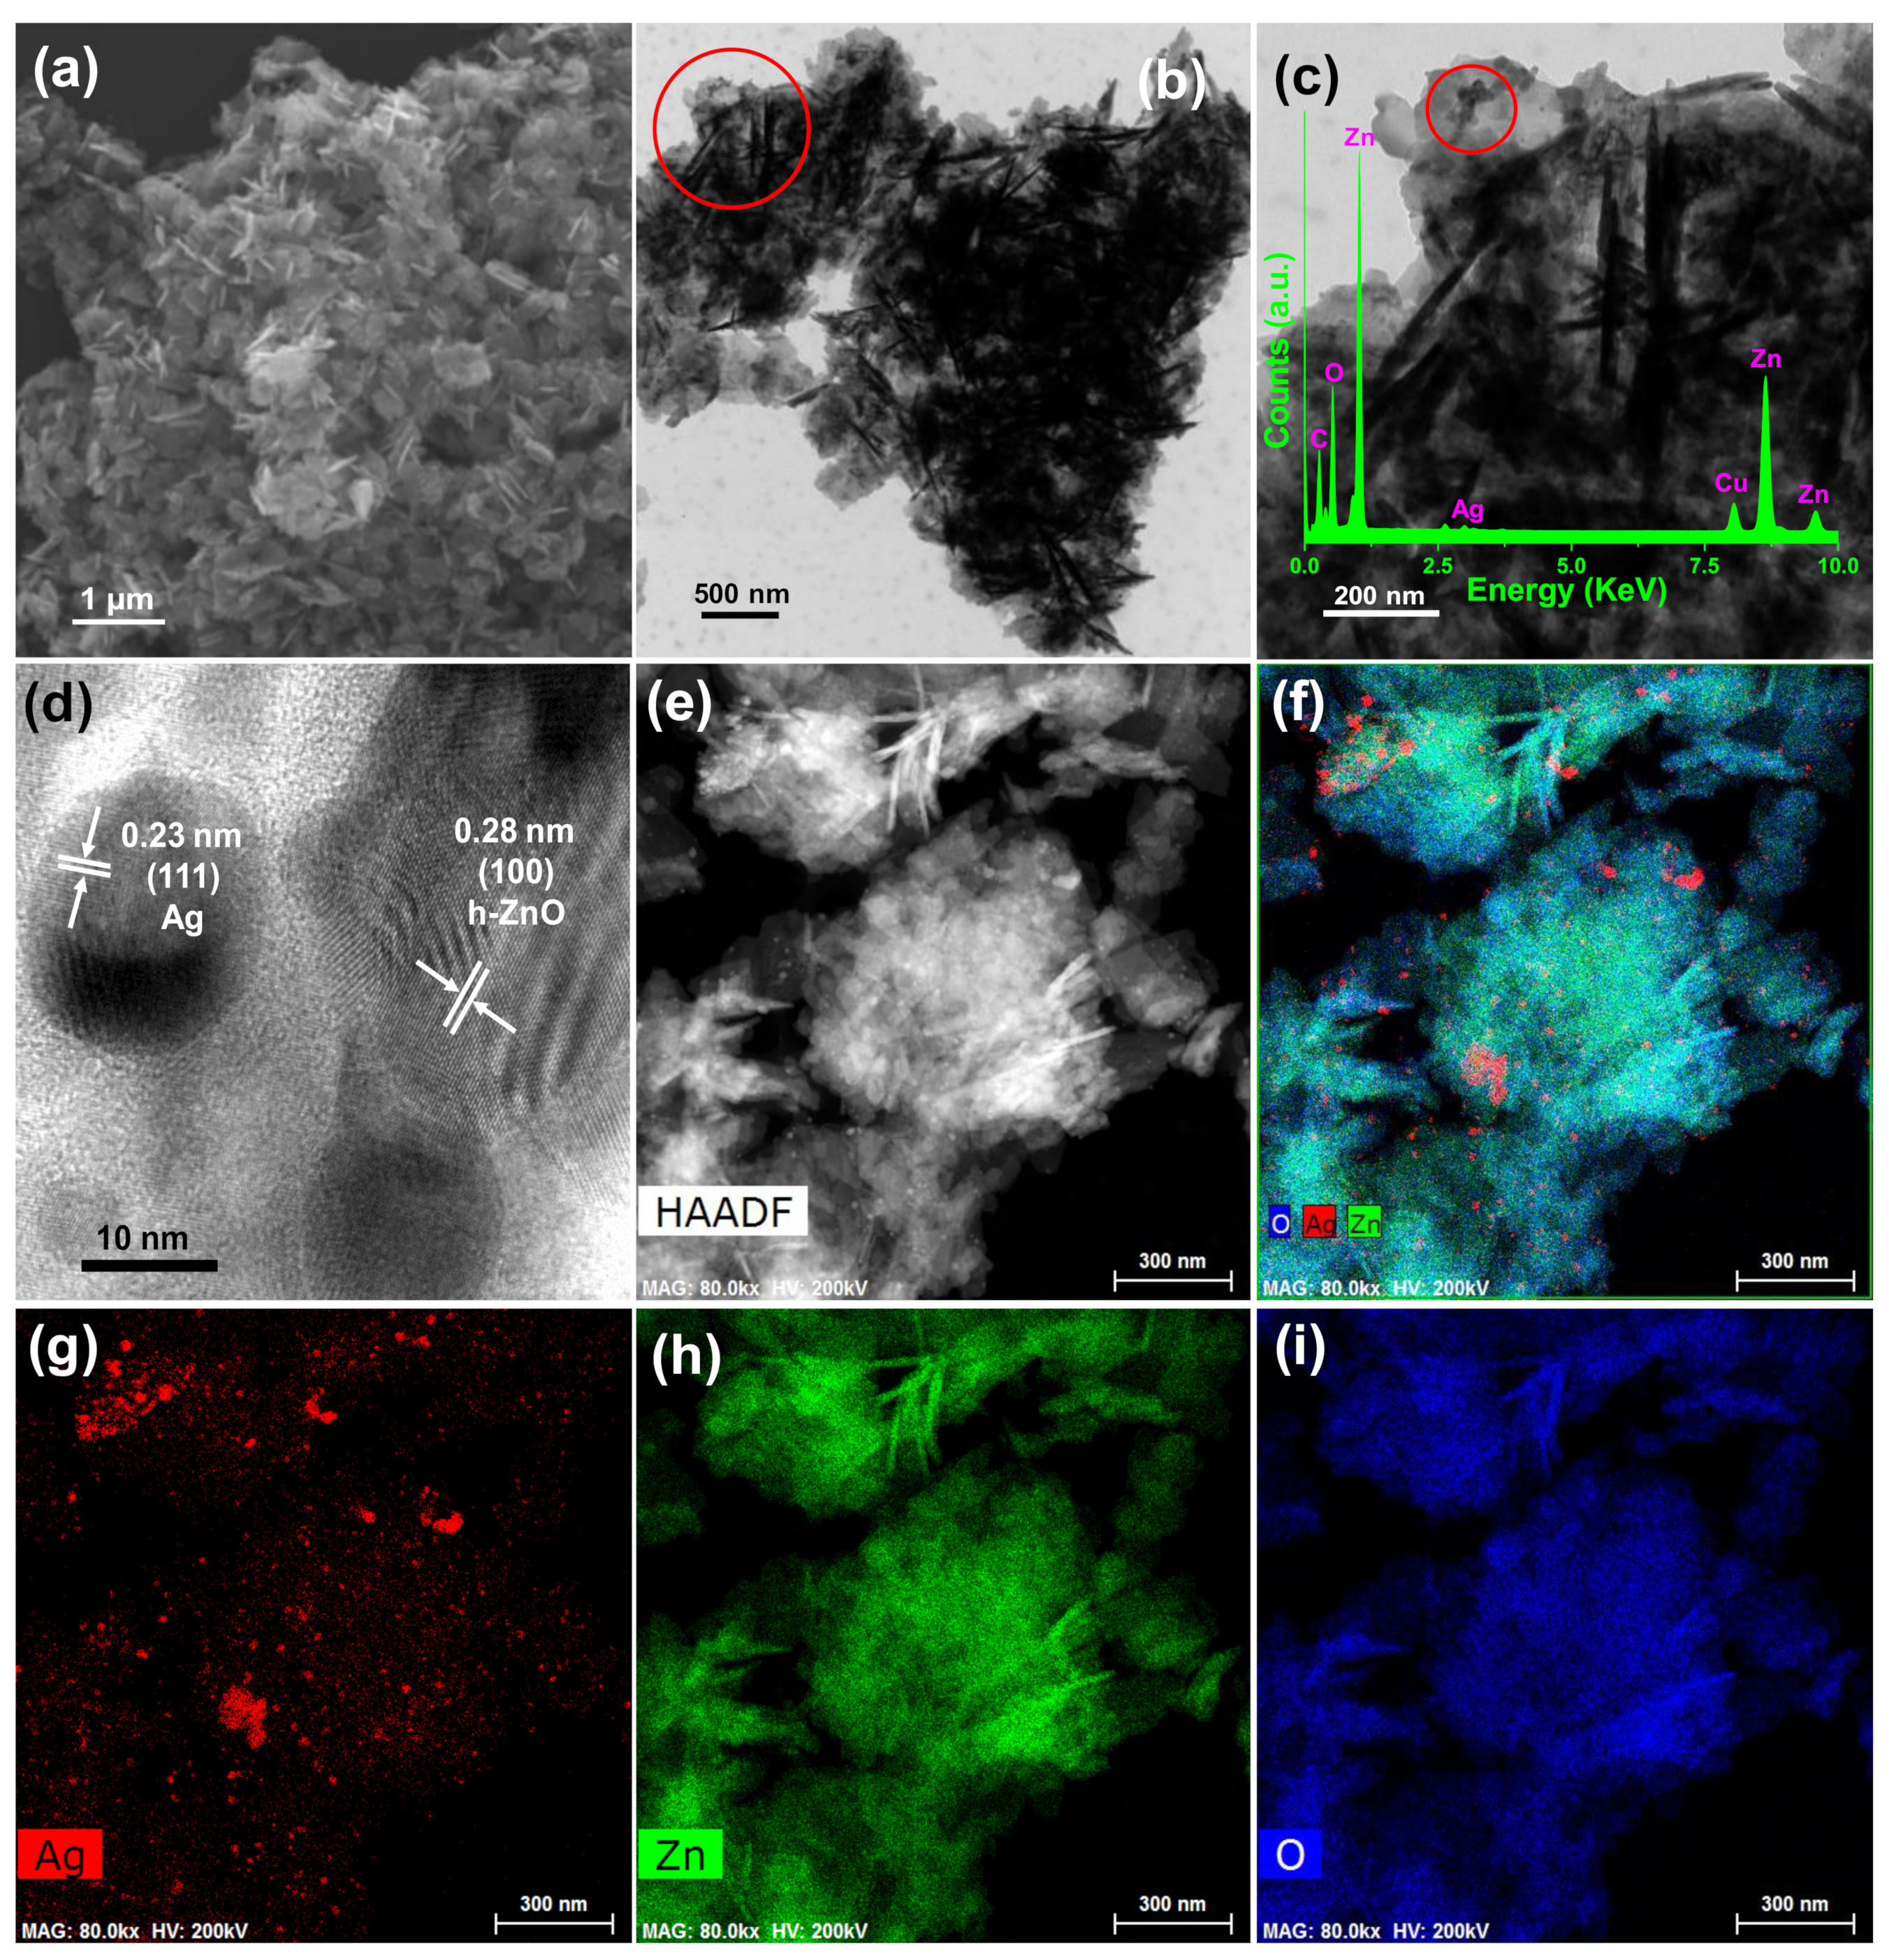
3.1.2. Morphology and Microstructure Study
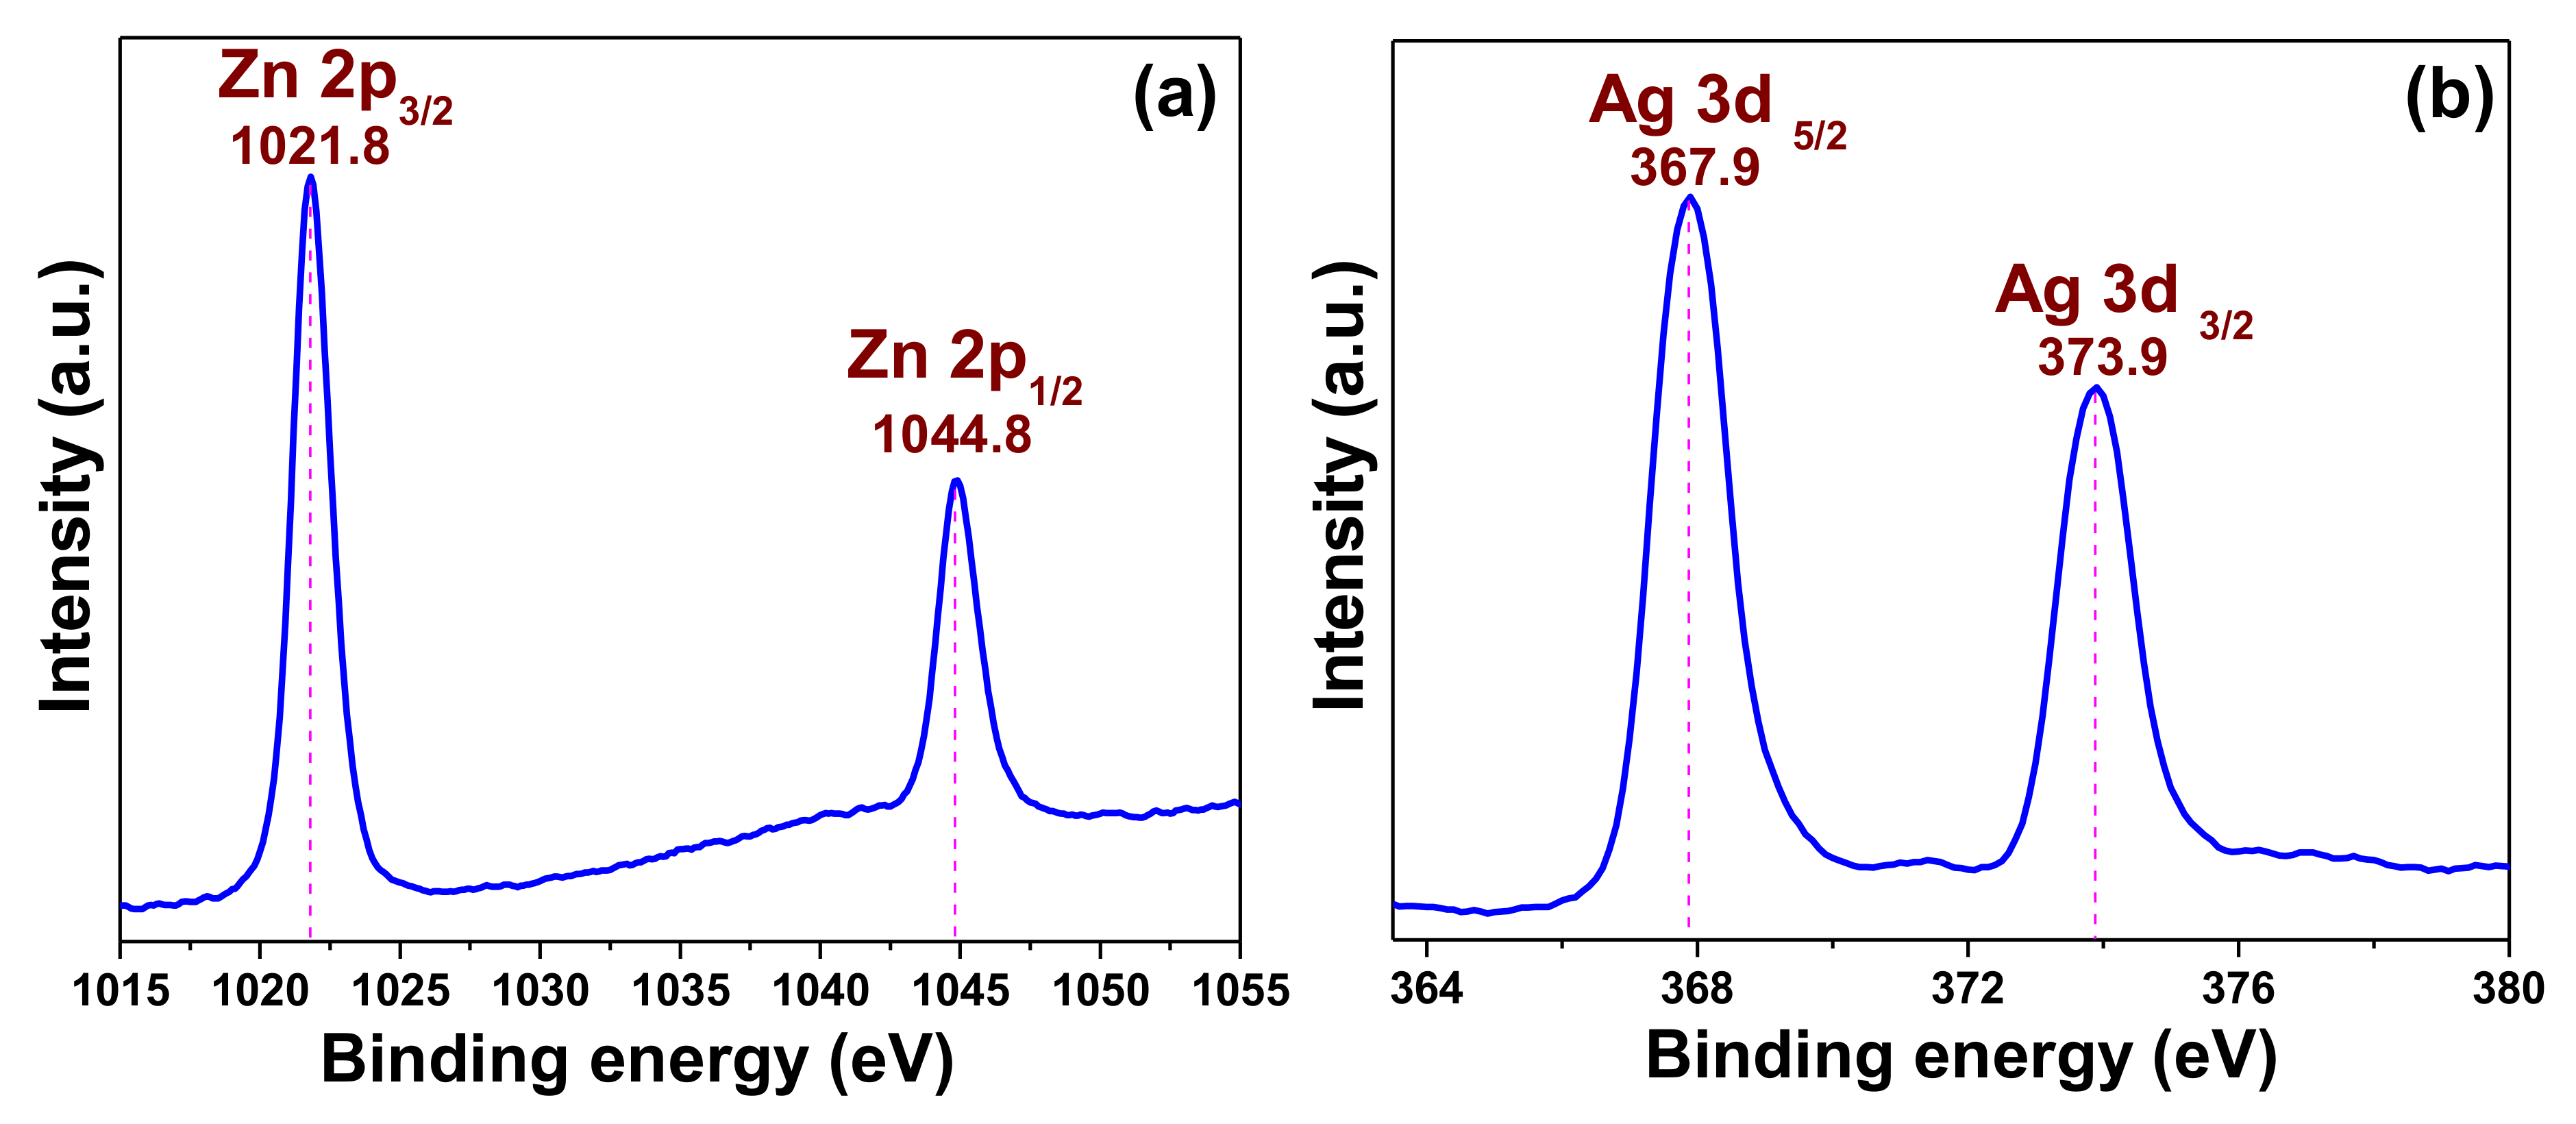
3.1.3. X-ray Photoelectron Spectroscopy (XPS) Results
3.2. Antibacterial Activity
3.2.1. Zone of Inhibition (ZOI)
3.2.2. MIC
3.2.3. Morphological Characterization of Bacteria
3.2.4. Drug Resistance Study
3.3. In Vitro Cytotoxicity
4. Conclusions
Author Contributions
Funding
Conflicts of Interest
References
- Naskar, A.; Kim, K.-S. Nanomaterials as delivery vehicles and components of new strategies to combat bacterial infections: Advantages and limitations. Microorganisms 2019, 7, 356. [Google Scholar] [CrossRef] [PubMed]
- Ramos, A.P.; Cruz, M.A.E.; Tovani, C.B.; Ciancaglini, P. Biomedical applications of nanotechnology. Biophys. Rev. 2017, 9, 79–89. [Google Scholar] [CrossRef] [PubMed]
- Wang, L.; Hu, C.; Shao, L. The antimicrobial activity of nanoparticles: Present situation and prospects for the future. Int. J. Nanomed. 2017, 12, 1227–1249. [Google Scholar] [CrossRef] [PubMed]
- Deng, H.; McShan, D.; Zhang, Y.; Sinha, S.S.; Arslan, Z.; Ray, P.C.; Yu, H. Mechanistic study of the synergistic antibacterial activity of combined silver nanoparticles and common antibiotics. Environ. Sci. Technol. 2016, 50, 8840–8848. [Google Scholar] [CrossRef] [PubMed]
- Gold, K.; Slay, B.; Knackstedt, M.; Gaharwar, A.K. Antimicrobial activity of metal and metal-oxide based nanoparticles. Adv. Therap. 2018, 1, 1700033. [Google Scholar] [CrossRef]
- Naskar, A.; Lee, S.; Kim, K.-S. Antibacterial potential of Ni-doped zinc oxide nanostructure: Comparatively more effective against Gram-negative bacteria including multi-drug resistant strains. RSC Adv. 2020, 10, 1232–1242. [Google Scholar] [CrossRef]
- Naskar, A.; Lee, S.; Kim, K.-S. Easy one-pot low-temperature synthesized Ag-ZnO nanoparticles and their activity against clinical isolates of methicillin-resistant Staphylococcus Aureus. Front. Bioeng. Biotechnol. 2020, 8, 216. [Google Scholar] [CrossRef] [PubMed]
- FDA Food and Drugs. Chapter 1: Food and Drug Administration Department of Health and Human Services. Subchapter B: Food for Human Consumption. Part 182: Substances Generally Recognized as Safe. Available online: https://www.accessdata.fda.gov/scripts/cdrh/cfdocs/cfcfr/CFRSearch.cfm?fr=182.8991 (accessed on 1 July 2020).
- Lee, N.Y.; Ko, W.C.; Hsueh, P.R. Nanoparticles in the treatment of infections caused by multidrug-resistant organisms. Front. Pharmacol. 2019, 10, 1153. [Google Scholar] [CrossRef] [PubMed]
- Ouay, B.L.; Stellacci, F. Antibacterial activity of silver nanoparticles: A surface science insight. Nano Today 2015, 10, 339–354. [Google Scholar] [CrossRef]
- Burdușel, A.C.; Gherasim, O.; Grumezescu, A.M.; Mogoantă, L.; Ficai, A.; Andronescu, E. Biomedical applications of silver nanoparticles: An up-to-date overview. Nanomaterials 2018, 8, 681. [Google Scholar] [CrossRef] [PubMed]
- Jijie, R.; Barras, A.; Teodorescu, F.; Boukherroub, R.; Szunerits, S. Advancements on the molecular design of nanoantibiotics: Current level of development and future challenges. Mol. Syst. Des. Eng. 2017, 2, 349–369. [Google Scholar] [CrossRef]
- Ghasemi, F.; Jalal, R. Antimicrobial action of zinc oxide nanoparticles in combination with ciprofloxacin and ceftazidime against multidrug-resistant Acinetobacter baumannii. J. Glob. Antimicrob. Resist. 2016, 6, 118–122. [Google Scholar] [CrossRef]
- WHO Model List of Essential Medicines. Available online: https://apps.who.int/iris/bitstream/handle/10665/273826/EML-20-eng.pdf?ua=1 (accessed on 1 July 2020).
- Kohanski, M.A.; Dwyer, D.J.; Collins, J.J. How antibiotics kill bacteria: From targets to networks. Nat. Rev. Microbiol. 2010, 8, 423–435. [Google Scholar] [CrossRef]
- Foster, T.J. Antibiotic resistance in Staphylococcus aureus. Current status and future prospects. FEMS Microbiol. Rev. 2017, 41, 430–449. [Google Scholar] [CrossRef] [PubMed]
- Levin, T.P.; Suh, B.; Axelrod, P.; Truant, A.L.; Fekete, T. Potential clindamycin resistance in clindamycin-susceptible, erythromycin-resistant Staphylococcus aureus: Report of a clinical failure. Antimicrob. Agents Chemother. 2005, 49, 1222–1224. [Google Scholar] [CrossRef] [PubMed]
- Naskar, A.; Bera, S.; Bhattacharya, R.; Saha, P.; Roy, S.S.; Sen, T.; Jana, S. Synthesis, characterization and antibacterial activity of Ag incorporated ZnO–graphene nanocomposites. RSC Adv. 2016, 6, 88751–88761. [Google Scholar] [CrossRef]
- Shin, J.; Magar, K.B.S.; Lee, J.; Kim, K.-S.; Lee, Y.R. Design, synthesis, and discovery of novel oxindoles bearing 3-heterocycles as species-specific and combinatorial agents in eradicating Staphylococcus species. Sci. Rep. 2019, 9, 8012. [Google Scholar] [CrossRef] [PubMed]
- Naskar, A.; Khan, H.; Sarkar, R.; Kumar, S.; Halder, D.; Jana, S. Anti-biofilm activity and food packaging application of room temperature solution process based polyethylene glycol capped Ag-ZnO-graphene nanocomposite. Mater. Sci. Eng. C 2018, 91, 743–753. [Google Scholar] [CrossRef] [PubMed]
- Dilova, T.; Atanasova, G.; Dikovska, A.O.; Nedyalkov, N.N. The effect of light irradiation on the gas-sensing properties of nanocomposites based on ZnO and Ag nanoparticles. Appl. Surf. Sci. 2020, 505, 144625. [Google Scholar] [CrossRef]
- Yeh, P.J.; Hegreness, M.J.; Aiden, A.P.; Kishony, R. Drug interactions and the evolution of antibiotic resistance. Nat. Rev. Microbiol. 2009, 7, 460–466. [Google Scholar] [CrossRef] [PubMed]


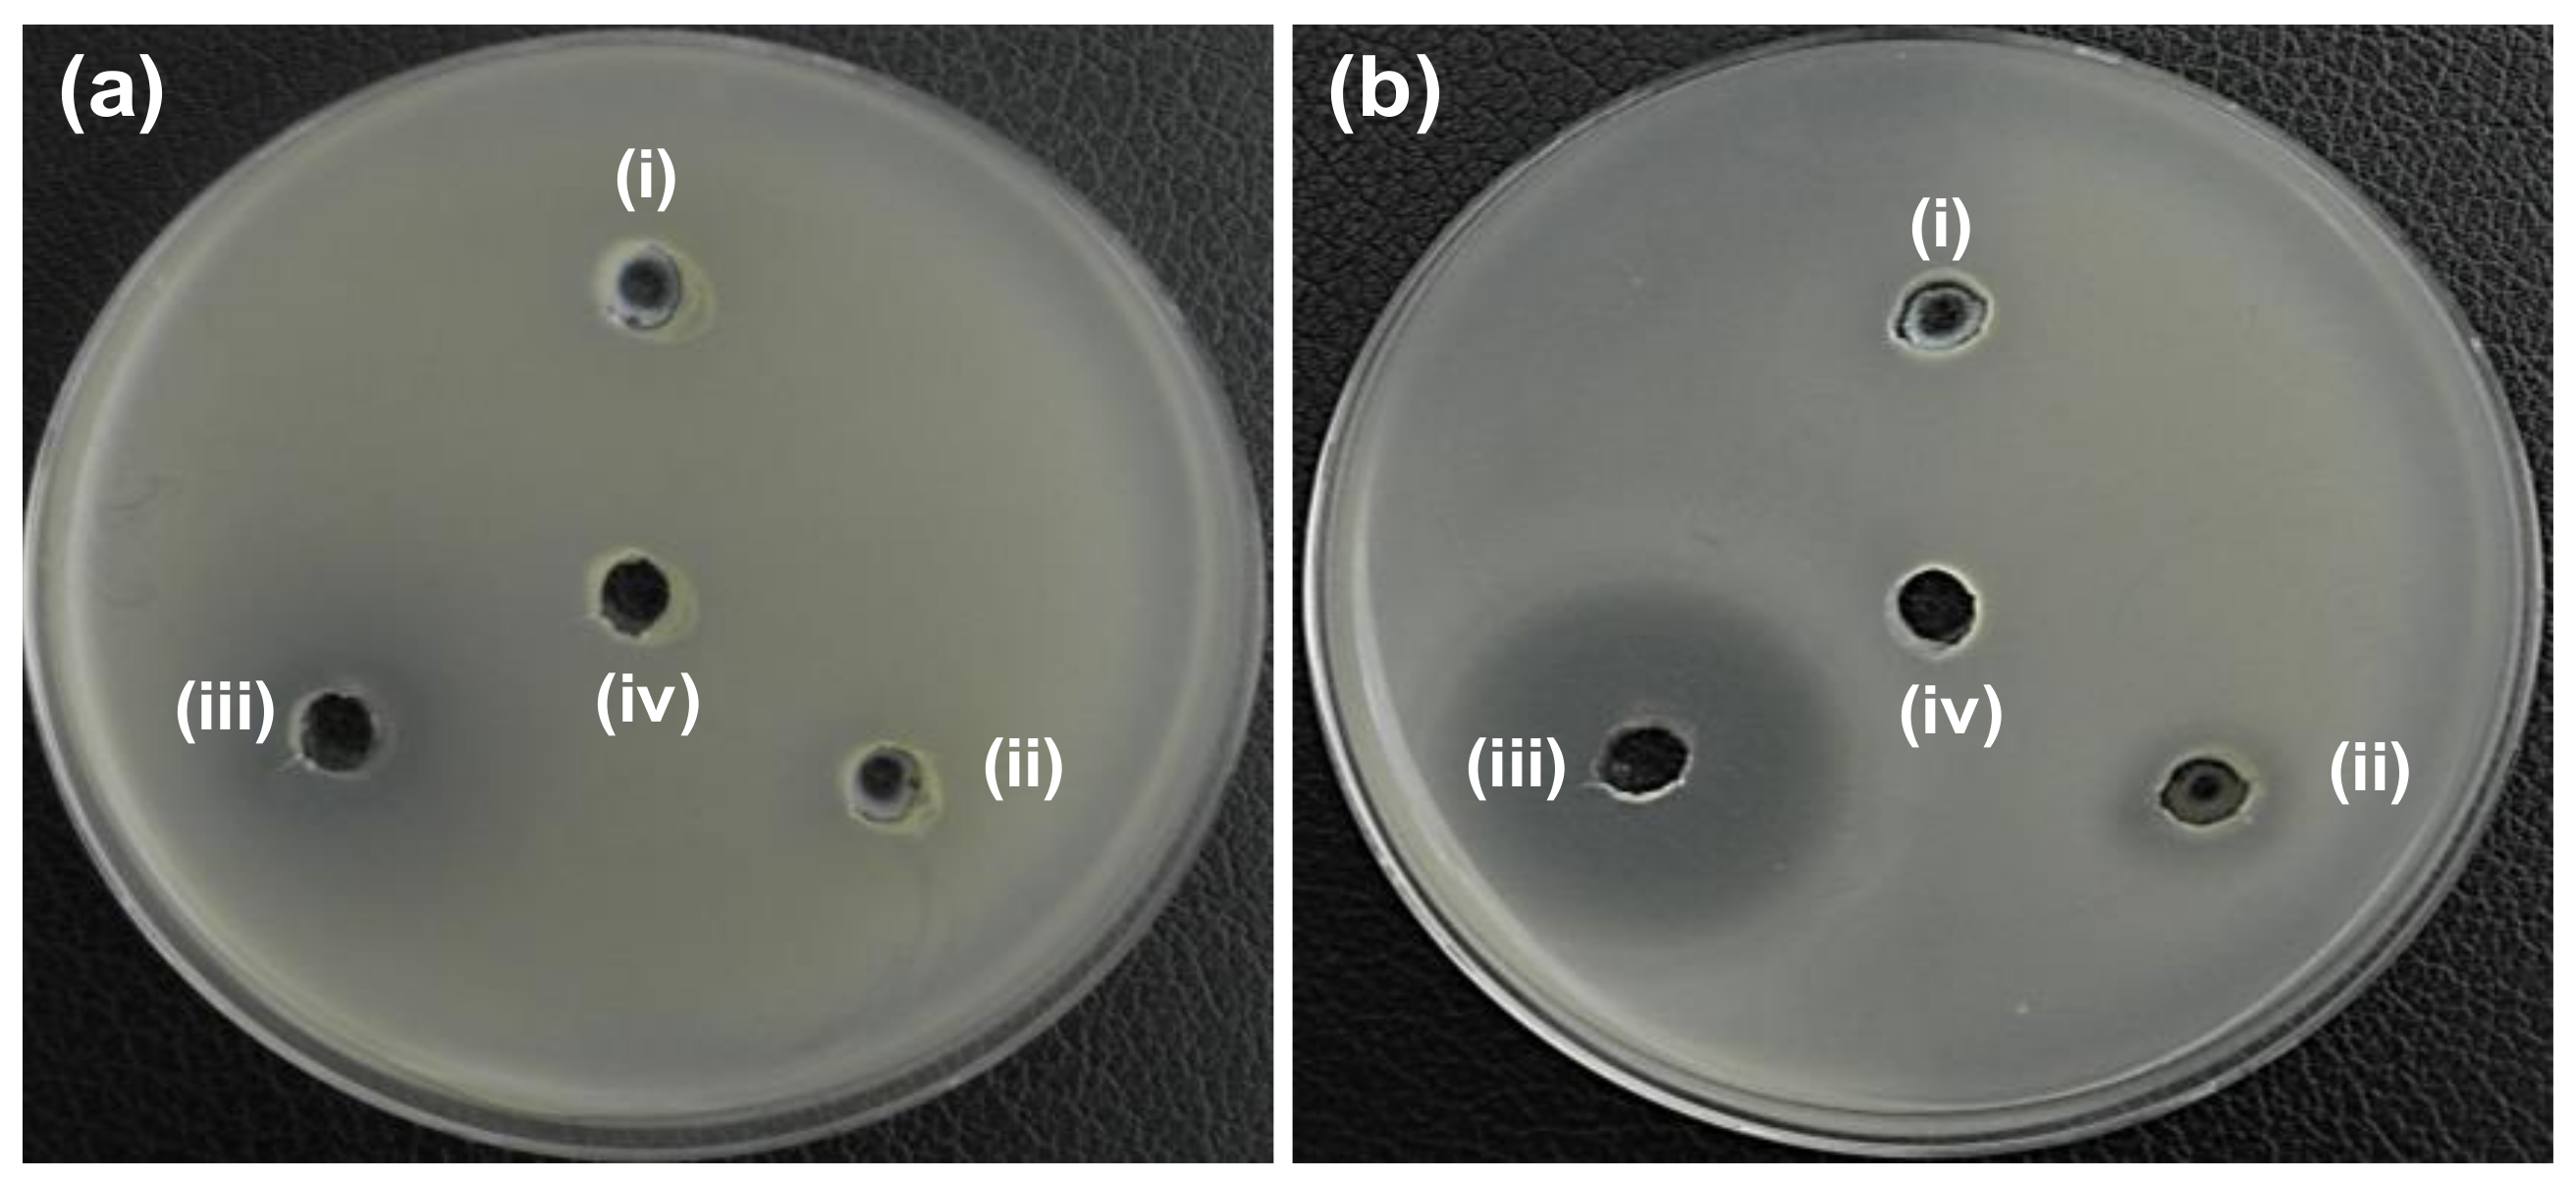
| Bacteria Cells | Zone of Inhibition (mm) | |||
|---|---|---|---|---|
| (i) ZO | (ii) AZO | (iv) Ery | (v) DW | |
| (a) E. coli ATCC25922 | N.D. | N.D. | 17 | N.D. |
| (b) S. aureus ATCC25923 | N.D. | 14 | 30 | N.D. |
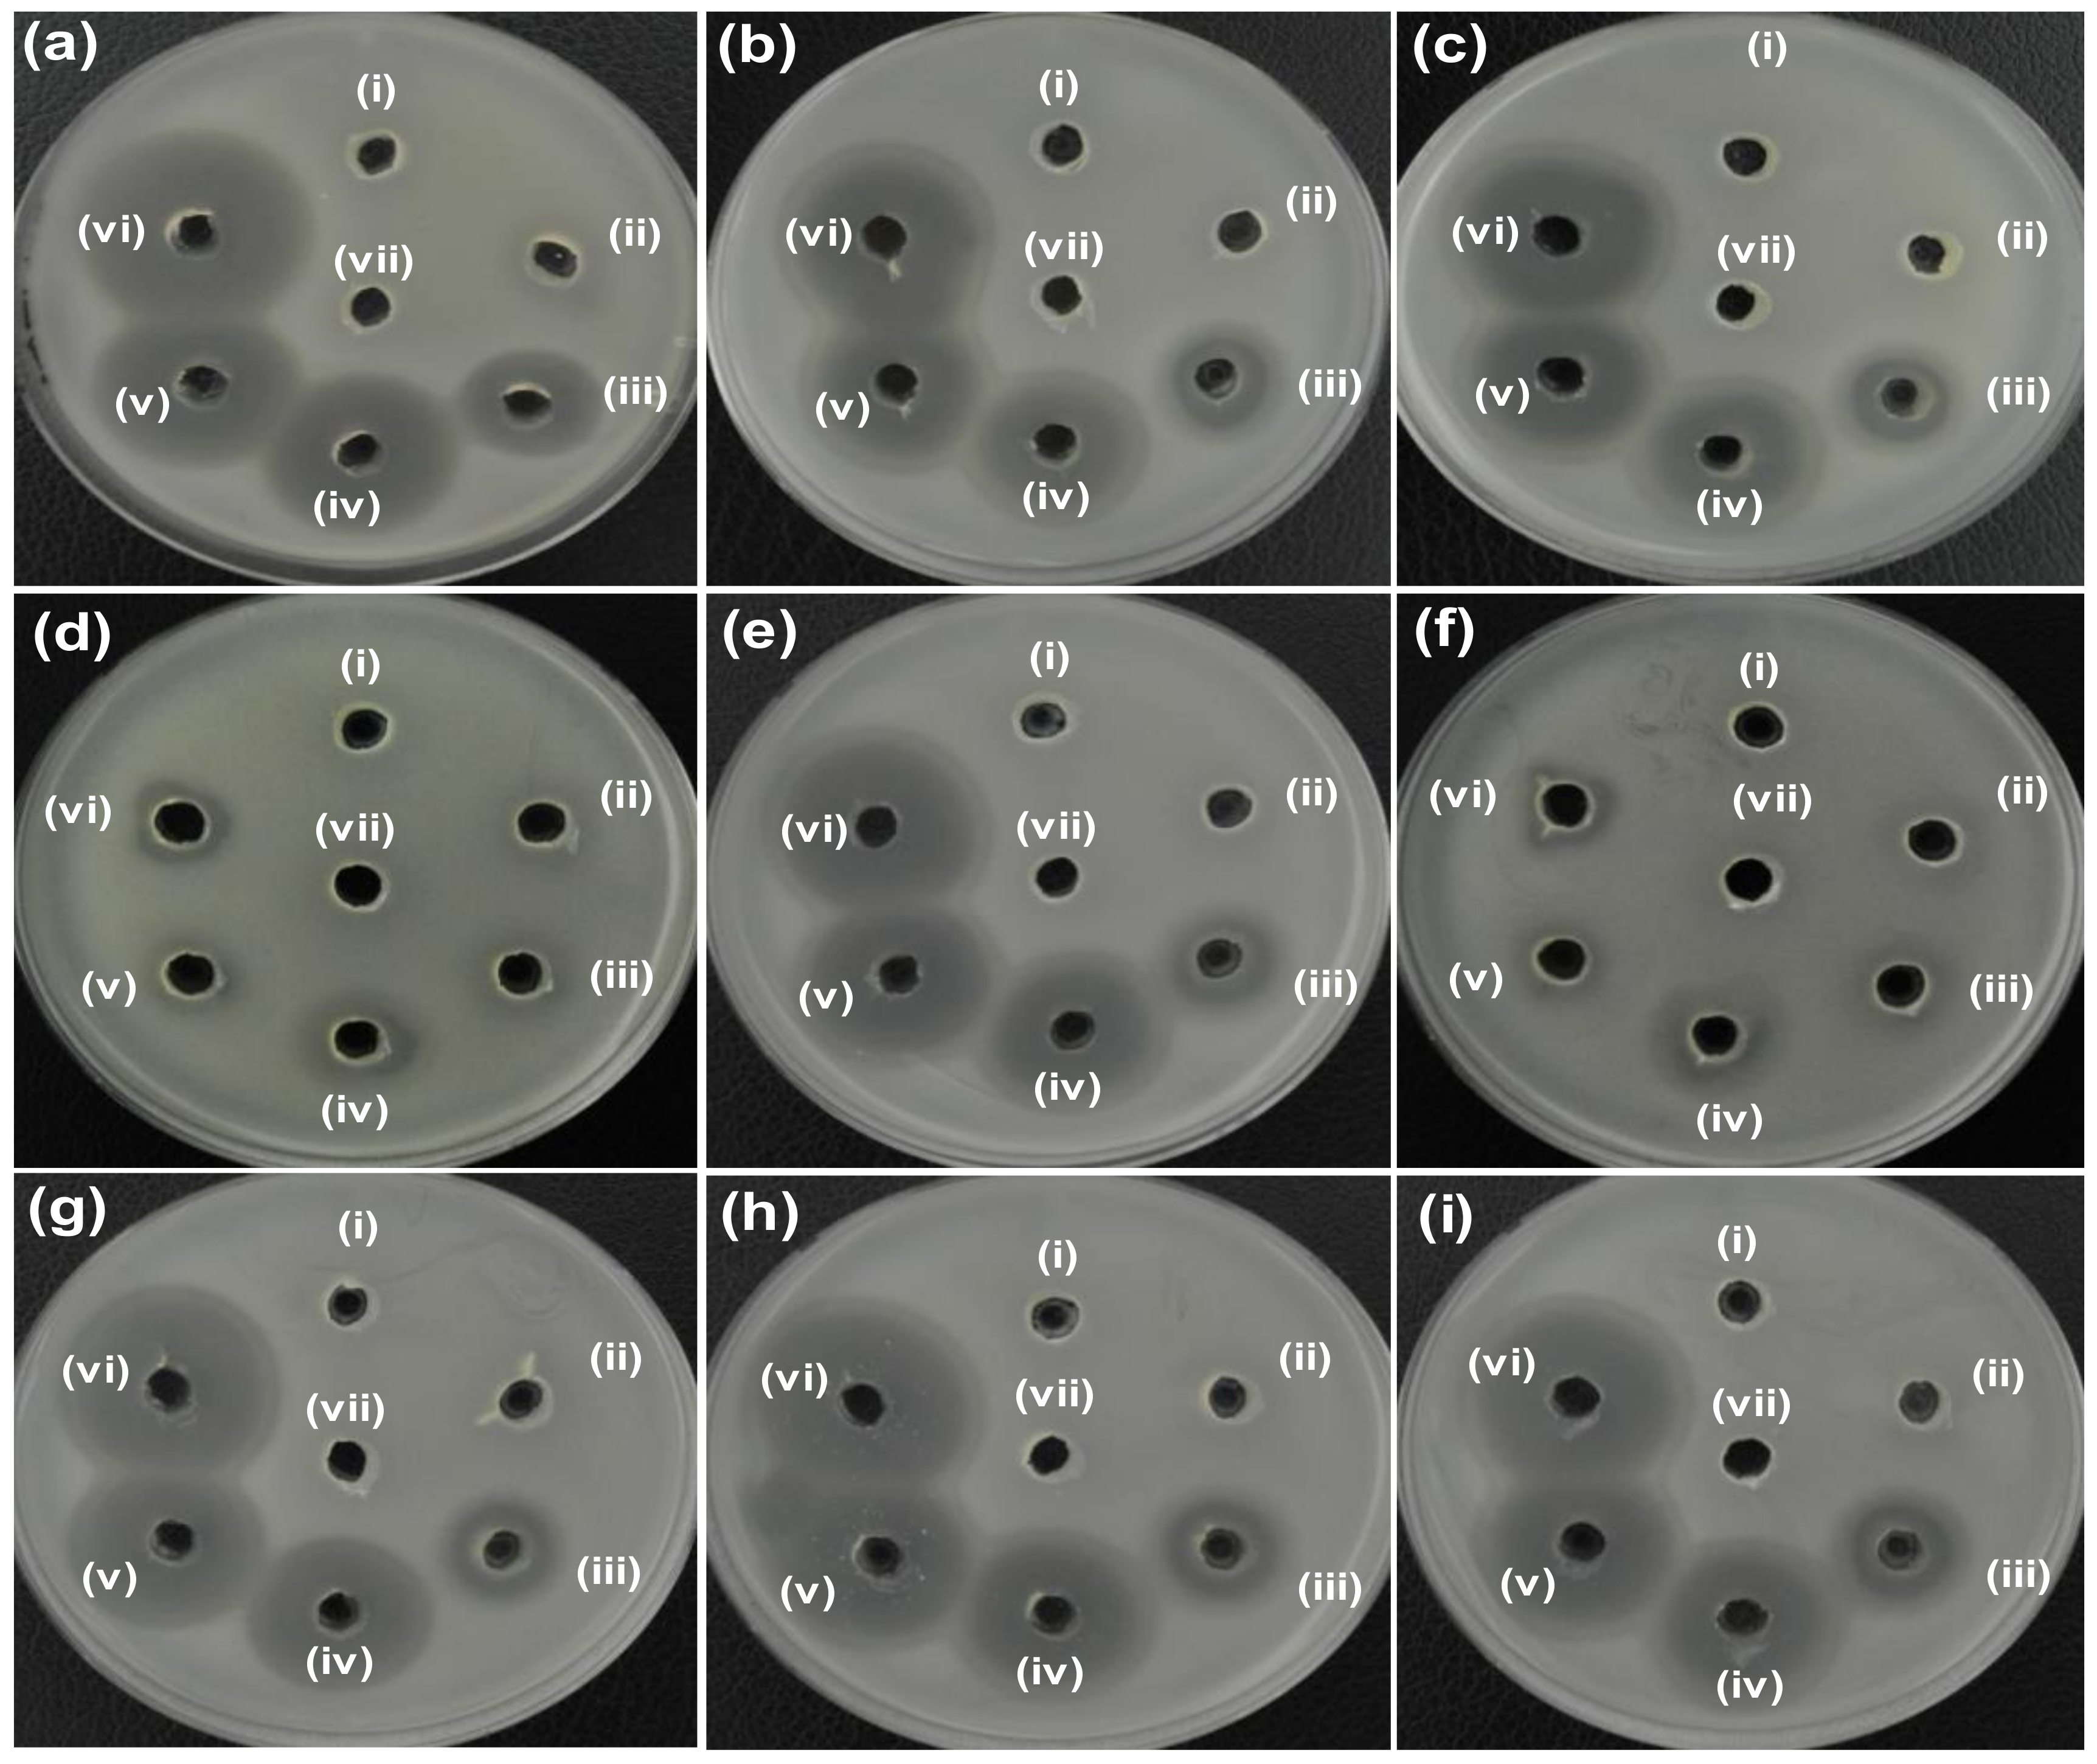
| Bacteria Cells | Zone of Inhibition (mm) | ||||||
|---|---|---|---|---|---|---|---|
| (i) ZO | (ii) AZO | (iii) AZE1 | (iv) AZE2 | (v) AZE3 | (vi) Ery | (vii) DW | |
| (a) S. aureus ATCC25923 | N.D. | 12 | 20 | 28 | 28 | 32 | N.D. |
| (b) MRSA1 | N.D. | N.D. | 21 | 26 | 28 | 30 | N.D. |
| (c) MRSA2 | N.D. | N.D. | 20 | 27 | 27 | 30 | N.D. |
| (d) MRSA3 | N.D. | N.D. | N.D. | 19 | 12 | 13 | N.D. |
| (e) MRSA4 | N.D. | N.D. | 19 | 27 | 28 | 31 | N.D. |
| (f) MRSA5 | N.D. | N.D. | N.D. | 18 | 13 | 11 | N.D. |
| (g) MRSA6 | N.D. | N.D. | 15 | 25 | 26 | 29 | N.D. |
| (h) MRSA7 | N.D. | N.D. | 19 | 27 | 27 | 30 | N.D. |
| (i) MRSA8 | N.D. | N.D. | 14 | 28 | 29 | 32 | N.D. |
| Bacterial Cells | Minimum Inhibitory Concentration (µg/mL) | ||
|---|---|---|---|
| ZO | AZO | AZE3 | |
| (a) S. aureus ATCC25923 | 200 | 100 | 1.56 |
| (b) MRSA1 | >200 | 200 | 6.25 |
| (c) MRSA2 | >200 | >200 | 6.25 |
| (d) MRSA3 | >200 | >200 | >200 |
| (e) MRSA4 | >200 | >200 | 6.25 |
| (f) MRSA5 | >200 | >200 | >200 |
| (g) MRSA6 | >200 | >200 | 12.5 |
| (h) MRSA7 | >200 | >200 | 6.25 |
| (i) MRSA8 | >200 | >200 | 6.25 |
© 2020 by the authors. Licensee MDPI, Basel, Switzerland. This article is an open access article distributed under the terms and conditions of the Creative Commons Attribution (CC BY) license (http://creativecommons.org/licenses/by/4.0/).
Share and Cite
Naskar, A.; Lee, S.; Lee, Y.; Kim, S.; Kim, K.-s. A New Nano-Platform of Erythromycin Combined with Ag Nano-Particle ZnO Nano-Structure against Methicillin-Resistant Staphylococcus aureus. Pharmaceutics 2020, 12, 841. https://doi.org/10.3390/pharmaceutics12090841
Naskar A, Lee S, Lee Y, Kim S, Kim K-s. A New Nano-Platform of Erythromycin Combined with Ag Nano-Particle ZnO Nano-Structure against Methicillin-Resistant Staphylococcus aureus. Pharmaceutics. 2020; 12(9):841. https://doi.org/10.3390/pharmaceutics12090841
Chicago/Turabian StyleNaskar, Atanu, Sohee Lee, Yunhee Lee, Semi Kim, and Kwang-sun Kim. 2020. "A New Nano-Platform of Erythromycin Combined with Ag Nano-Particle ZnO Nano-Structure against Methicillin-Resistant Staphylococcus aureus" Pharmaceutics 12, no. 9: 841. https://doi.org/10.3390/pharmaceutics12090841
APA StyleNaskar, A., Lee, S., Lee, Y., Kim, S., & Kim, K.-s. (2020). A New Nano-Platform of Erythromycin Combined with Ag Nano-Particle ZnO Nano-Structure against Methicillin-Resistant Staphylococcus aureus. Pharmaceutics, 12(9), 841. https://doi.org/10.3390/pharmaceutics12090841