Optimization and Evaluation of Poly(lactide-co-glycolide) Nanoparticles for Enhanced Cellular Uptake and Efficacy of Paclitaxel in the Treatment of Head and Neck Cancer

 ,
,  ,
,  , and
, and
Abstract
1. Introduction
2. Materials and Methods
2.1. Materials
2.2. QbD Approach for Optimization of PTX-PLGA-NPs
2.3. Preparation of PTX-PLGA-NPs
2.4. Physico-Chemical Characterization of PTX-PLGA-NPs
2.4.1. Determination of PS, PDI, and ZP
2.4.2. Determination of EE%
2.5. Transmission and Scanning Electron Microscopy
2.6. Fourier Transform Infrared Spectroscopy (FT-IR)
2.7. In Vitro Release Studies
2.8. Short-Term Stability Study
2.9. Cell Culture
2.10. Cytotoxicity and IC50 Studies
2.11. Cellular Uptake Studies
2.12. Statistical Analysis
3. Results and Discussion
3.1. Design of Experiments and Preparation of PTX-PLGA-NPs
3.1.1. Determination of PS, PDI and ZP
3.1.2. Determination of EE%
3.2. Design Space and Model Verification
3.3. TEM and SEM Analysis
3.4. FT-IR Analysis
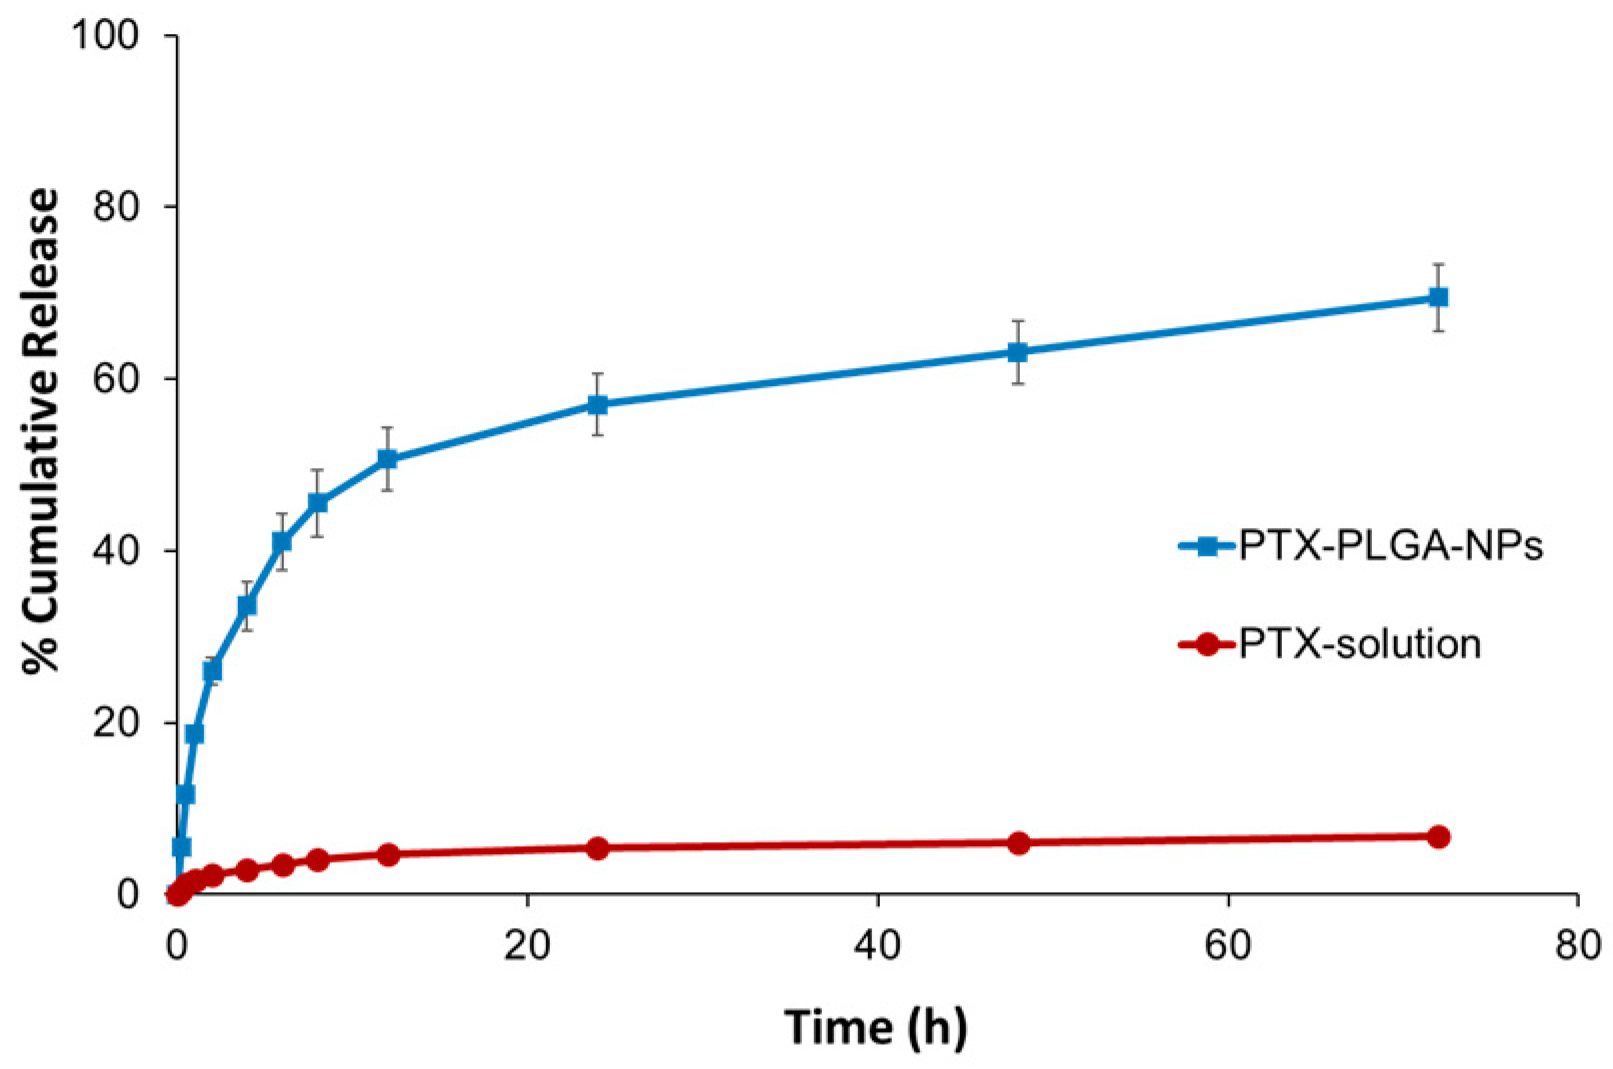
3.5. In Vitro Release Studies
3.6. Short-Term Stability Study
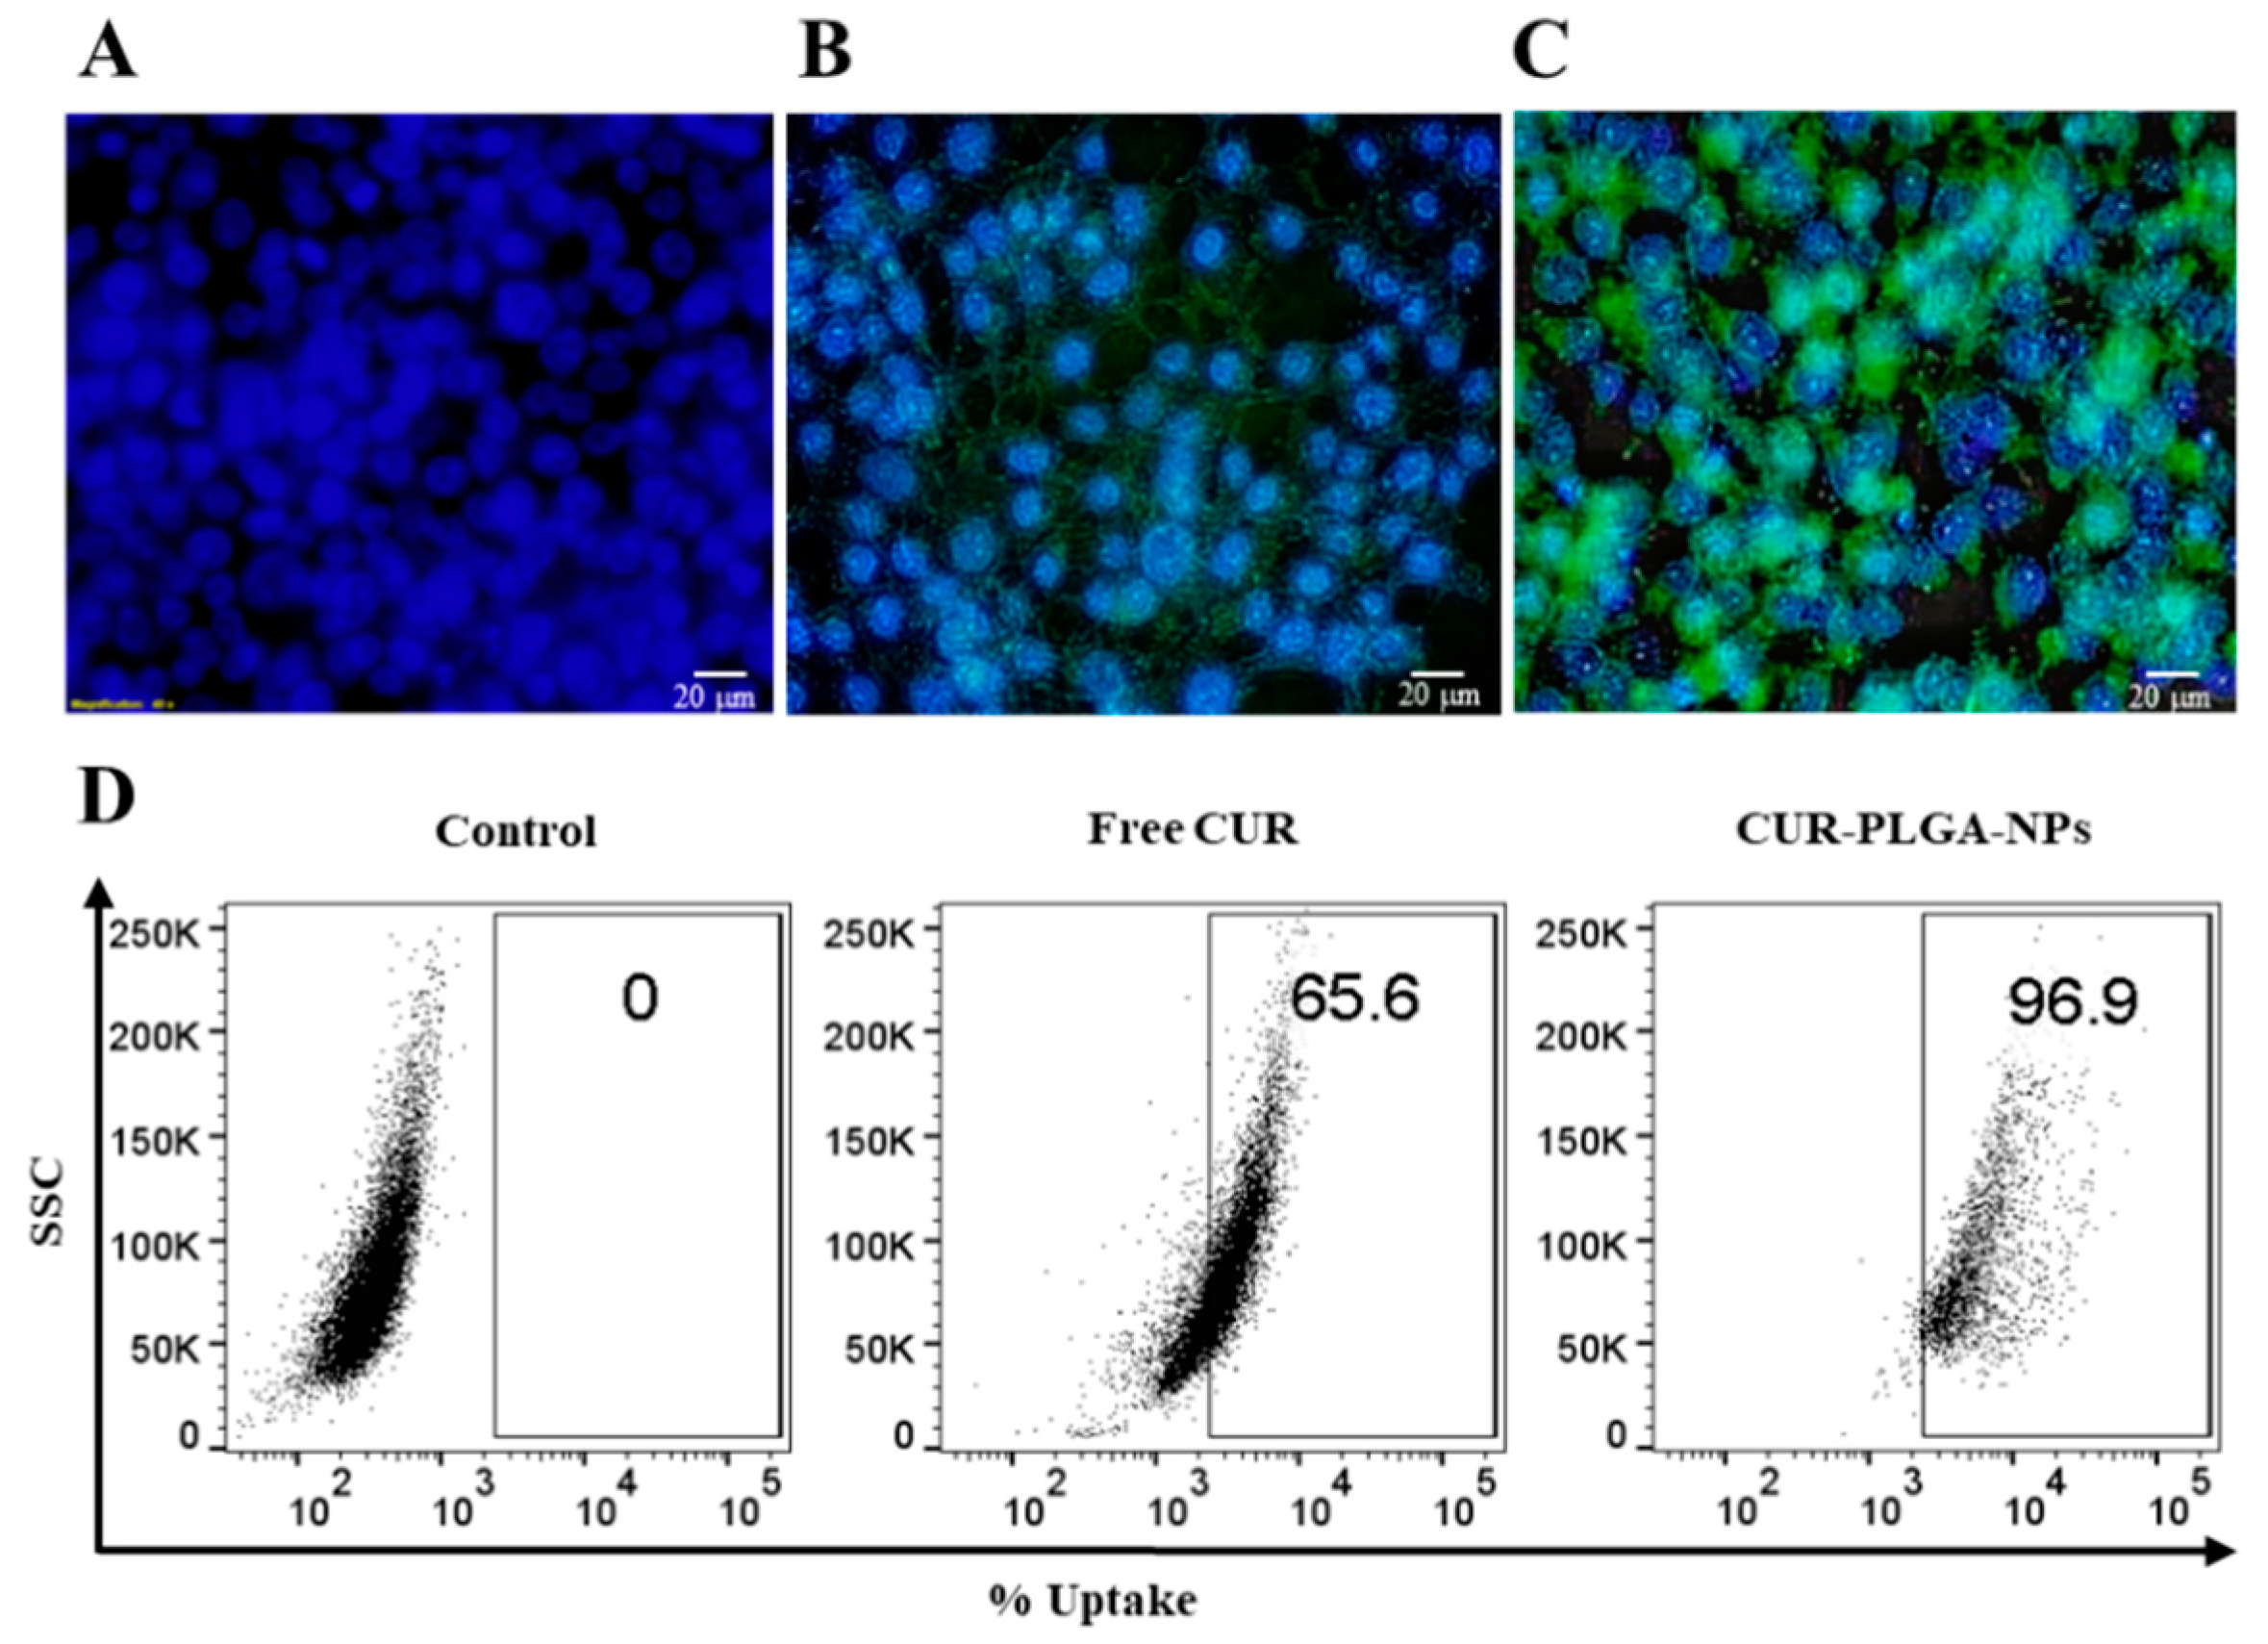
3.7. In Vitro Cytotoxicity and Cellular Uptake Studies
4. Conclusions
Author Contributions
Funding
Acknowledgments
Conflicts of Interest
References
- Smirnova, T.; Adomako, A.; Locker, J.; Van Rooijen, N.; Prystowsky, M.B.; Segall, J.E. In vivo invasion of head and neck squamous cell carcinoma cells does not require macrophages. Am. J. Pathol. 2011, 178, 2857–2865. [Google Scholar] [CrossRef] [PubMed]
- Birkeland, A.C.; Swiecicki, P.L.; Brenner, J.C.; Shuman, A.G. A review of drugs in development for the personalized treatment of head and neck squamous cell carcinoma. Expert Rev. Precis. Med. Drug Dev. 2016, 1, 379–385. [Google Scholar] [CrossRef] [PubMed]
- Li, J.; Gong, C.; Feng, X.; Zhou, X.; Xu, X.; Xie, L.; Wang, R.; Zhang, D.; Wang, H.; Deng, P.; et al. Biodegradable thermosensitive hydrogel for SAHA and DDP delivery: Therapeutic effects on oral squamous cell carcinoma xenografts. PLoS ONE 2012, 7, e33860. [Google Scholar] [CrossRef] [PubMed]
- Du, Y.; Peyser, N.D.; Grandis, J.R. Integration of molecular targeted therapy with radiation in head and neck cancer. Pharmacol. Ther. 2014, 142, 88–98. [Google Scholar] [CrossRef] [PubMed]
- Guigay, J.; Fayette, J.; Mesia, R.; Lafond, C.; Saada-Bouzid, E.; Geoffrois, L.; Martin, L.; Cupissol, D.; Capitain, O.; Castanie, H.; et al. TPExtreme randomized trial: TPEx versus Extreme regimen in 1st line recurrent/metastatic head and neck squamous cell carcinoma (R/M HNSCC). J. Clin. Oncol. 2019, 37, 6002. [Google Scholar] [CrossRef]
- Xavier-Jr, F.H.; Gueutin, C.; Chacun, H.; Vauthier, C.; Egito, E.S.T. Mucoadhesive paclitaxel-loaded chitosan-poly (isobutyl cyanoacrylate) core-shell nanocapsules containing copaiba oil designed for oral drug delivery. J. Drug Deliv. Sci. Technol. 2019, 53, 101194. [Google Scholar] [CrossRef]
- Khalifa, A.M.; Elsheikh, M.A.; Khalifa, A.M.; Elnaggar, Y.S.R. Current strategies for different paclitaxel-loaded Nano-delivery Systems towards therapeutic applications for ovarian carcinoma: A review article. J. Control. Release 2019, 311–312, 125–137. [Google Scholar] [CrossRef] [PubMed]
- Makadia, H.K.; Siegel, S.J. Poly Lactic-co-Glycolic Acid (PLGA) as biodegradable controlled drug delivery carrier. Polymers 2011, 3, 1377–1397. [Google Scholar] [CrossRef] [PubMed]
- Montagner, I.M.; Banzato, A.; Zuccolotto, G.; Renier, D.; Campisi, M.; Bassi, P.F.; Zanovello, P.; Rosato, A. Paclitaxel-hyaluronan hydrosoluble bioconjugate: Mechanism of action in human bladder cancer cell lines. Urol. Oncol. Semin. Orig. Investig. 2013, 31, 1261–1269. [Google Scholar] [CrossRef] [PubMed]
- Calleja, P.; Espuelas, S.; Corrales, L.; Pio, R.; Irache, J.M. Pharmacokinetics and antitumor efficacy of paclitaxel-cyclodextrin complexes loaded in mucus-penetrating nanoparticles for oral administration. Nanomedicine 2014, 9, 2109–2121. [Google Scholar] [CrossRef] [PubMed]
- Gupta, U.; Sharma, S.; Khan, I.; Gothwal, A.; Sharma, A.K.; Singh, Y.; Chourasia, M.K.; Kumar, V. Enhanced apoptotic and anticancer potential of paclitaxel loaded biodegradable nanoparticles based on chitosan. Int. J. Biol. Macromol. 2017, 98, 810–819. [Google Scholar] [CrossRef] [PubMed]
- Rivkin, I.; Cohen, K.; Koffler, J.; Melikhov, D.; Peer, D.; Margalit, R. Paclitaxel-clusters coated with hyaluronan as selective tumor-targeted nanovectors. Biomaterials 2010, 31, 7106–7114. [Google Scholar] [CrossRef] [PubMed]
- Meng, Z.; Lv, Q.; Lu, J.; Yao, H.; Lv, X.; Jiang, F.; Lu, A.; Zhang, G. Prodrug strategies for paclitaxel. Int. J. Mol. Sci. 2016, 17, 796. [Google Scholar] [CrossRef] [PubMed]
- Sofias, A.M.; Dunne, M.; Storm, G.; Allen, C. The battle of “nano” paclitaxel. Adv. Drug Deliv. Rev. 2017, 122, 20–30. [Google Scholar] [CrossRef] [PubMed]
- Xu, Y.; Asghar, S.; Li, H.; Chen, M.; Su, Z.; Xu, Y.; Ping, Q.; Xiao, Y. Preparation of a paclitaxel-loaded cationic nanoemulsome and its biodistribution via direct intratumoral injection. Colloids Surfaces B Biointerfaces 2016, 142, 81–88. [Google Scholar] [CrossRef] [PubMed]
- Aluri, S.; Janib, S.M.; Mackay, J.A. Environmentally responsive peptides as anticancer drug carriers. Adv. Drug Deliv. Rev. 2009, 61, 940–952. [Google Scholar] [CrossRef] [PubMed]
- Shikanov, A.; Shikanov, S.; Vaisman, B.; Golenser, J.; Domb, A.J. Paclitaxel tumor biodistribution and efficacy after intratumoral injection of a biodegradable extended release implant. Int. J. Pharm. 2008, 358, 114–120. [Google Scholar] [CrossRef] [PubMed]
- Han, X.; Meng, X.; Wu, Z.; Wu, Z.; Qi, X. Dynamic imine bond cross-linked self-healing thermosensitive hydrogels for sustained anticancer therapy via intratumoral injection. Mater. Sci. Eng. C 2018, 93, 1064–1072. [Google Scholar] [CrossRef] [PubMed]
- Calderó, G.; Fornaguera, C.; Zadoina, L.; Dols-Perez, A.; Solans, C. Design of parenteral MNP-loaded PLGA nanoparticles by a low-energy emulsification approach as theragnostic platforms for intravenous or intratumoral administration. Colloids Surf. B 2017, 160, 535–542. [Google Scholar] [CrossRef] [PubMed]
- Wang, Q.; Li, C.; Ren, T.; Chen, S.; Ye, X.; Guo, H.; He, H.; Zhang, Y.; Yin, T.; Liang, X.J.; et al. Poly(vinyl methyl ether/maleic anhydride)-Doped PEG-PLA Nanoparticles for Oral Paclitaxel Delivery to Improve Bioadhesive Efficiency. Mol. Pharm. 2017, 14, 3598–3608. [Google Scholar] [CrossRef] [PubMed]
- Ahmed, M.; Lukyanov, A.N.; Torchilin, V.; Tournier, H.; Schneider, A.N.; Goldberg, S.N. Combined Radiofrequency Ablation and Adjuvant Liposomal Chemotherapy: Effect of Chemotherapeutic Agent, Nanoparticle Size, and Circulation Time. J. Vasc. Interv. Radiol. 2005, 16, 1365–1371. [Google Scholar] [CrossRef] [PubMed]
- Cho, E.J.; Holback, H.; Liu, K.C.; Abouelmagd, S.A.; Park, J.; Yeo, Y. Nanoparticle characterization: State of the art, challenges, and emerging technologies. Mol. Pharm. 2013, 10, 2093–2110. [Google Scholar] [CrossRef] [PubMed]
- Jin, C.; Bai, L.; Wu, H.; Song, W.; Guo, G.; Dou, K. Cytotoxicity of paclitaxel incorporated in plga nanoparticles on hypoxic human tumor cells. Pharm. Res. 2009, 26, 1776–1784. [Google Scholar] [CrossRef] [PubMed]
- Orunoğlu, M.; Kaffashi, A.; Pehlivan, S.B.; Şahin, S.; Söylemezoğlu, F.; Karlı-Oğuz, K.; Mut, M. Effects of curcumin-loaded PLGA nanoparticles on the RG2 rat glioma model. Mater. Sci. Eng. C 2017, 78, 32–38. [Google Scholar] [CrossRef] [PubMed]
- Danhier, F.; Ansorena, E.; Silva, J.M.; Coco, R.; Le Breton, A.; Préat, V. PLGA-based nanoparticles: An overview of biomedical applications. J. Control. Release 2012, 161, 505–522. [Google Scholar] [CrossRef] [PubMed]
- Ding, D.; Zhu, Q. Recent advances of PLGA micro/nanoparticles for the delivery of biomacromolecular therapeutics. Mater. Sci. Eng. C 2018, 92, 1041–1060. [Google Scholar] [CrossRef] [PubMed]
- Graves, R.A.; Pamujula, S.; Moiseyev, R.; Freeman, T.; Bostanian, L.A.; Mandal, T.K. Effect of different ratios of high and low molecular weight PLGA blend on the characteristics of pentamidine microcapsules. Int. J. Pharm. 2004, 270, 251–262. [Google Scholar] [CrossRef] [PubMed]
- Ansari, M.; Moradi, S.; Shahlaei, M. A molecular dynamics simulation study on the mechanism of loading of gemcitabine and camptothecin in poly lactic-co-glycolic acid as a nano drug delivery system. J. Mol. Liq. 2018, 269, 110–118. [Google Scholar] [CrossRef]
- Tóth, T.; Kiss, É. A method for the prediction of drug content of poly(lactic-co-glycolic)acid drug carrier nanoparticles obtained by nanoprecipitation. J. Drug Deliv. Sci. Technol. 2019, 50, 42–47. [Google Scholar] [CrossRef]
- Anderson, J.M.; Shive, M.S. Biodegradation and biocompatibility of PLA and PLGA microspheres. Adv. Drug Deliv. Rev. 2012, 64, 72–82. [Google Scholar] [CrossRef]
- Si, S.; Li, H.; Han, X. Sustained release olmesartan medoxomil loaded PLGA nanoparticles with improved oral bioavailability to treat hypertension. J. Drug Deliv. Sci. Technol. 2020, 55, 101422. [Google Scholar] [CrossRef]
- Almeida, K.B.; Ramos, A.S.; Nunes, J.B.B.; Silva, B.O.; Ferraz, E.R.A.; Fernandes, A.S.; Felzenszwalb, I.; Amaral, A.C.F.; Roullin, V.G.; Falcão, D.Q. PLGA nanoparticles optimized by Box-Behnken for efficient encapsulation of therapeutic Cymbopogon citratus essential oil. Colloids Surfaces B Biointerfaces 2019, 181, 935–942. [Google Scholar] [CrossRef] [PubMed]
- Tefas, L.R.; Tomuţă, I.; Achim, M.; Vlase, L. Development and optimization of quercetin-loaded plga nanoparticles by experimental design. Clujul Med. 2015, 88, 214–223. [Google Scholar] [CrossRef] [PubMed]
- Escalona-Rayo, O.; Fuentes-Vázquez, P.; Jardon-Xicotencatl, S.; García-Tovar, C.G.; Mendoza-Elvira, S.; Quintanar-Guerrero, D. Rapamycin-loaded polysorbate 80-coated PLGA nanoparticles: Optimization of formulation variables and in vitro anti-glioma assessment. J. Drug Deliv. Sci. Technol. 2019, 52, 488–499. [Google Scholar] [CrossRef]
- Fonseca, C.; Simões, S.; Gaspar, R. Paclitaxel-loaded PLGA nanoparticles: Preparation, physicochemical characterization and in vitro anti-tumoral activity. J. Control. Release 2002, 83, 273–286. [Google Scholar] [CrossRef]
- Mu, L.; Feng, S.S. A novel controlled release formulation for the anticancer drug paclitaxel (Taxol®): PLGA nanoparticles containing vitamin E TPGS. J. Control. Release 2003, 86, 33–48. [Google Scholar] [CrossRef]
- Abdelbary, G.; Haider, M. In vitro characterization and growth inhibition effect of nanostructured lipid carriers for controlled delivery of methotrexate. Pharm. Dev. Technol. 2013, 18, 1159–1168. [Google Scholar] [CrossRef] [PubMed]
- Oliveira, R.R.; Carrião, M.S.; Pacheco, M.T.; Branquinho, L.C.; de Souza, A.L.R.; Bakuzis, A.F.; Lima, E.M. Triggered release of paclitaxel from magnetic solid lipid nanoparticles by magnetic hyperthermia. Mater. Sci. Eng. C 2018, 92, 547–553. [Google Scholar] [CrossRef] [PubMed]
- Yallapu, M.M.; Gupta, B.K.; Jaggi, M.; Chauhan, S.C. Fabrication of curcumin encapsulated PLGA nanoparticles for improved therapeutic effects in metastatic cancer cells. J. Colloid Interface Sci. 2010, 351, 19–29. [Google Scholar] [CrossRef] [PubMed]
- Ahmed, I.S.; El Hosary, R.; Hassan, M.A.; Haider, M.; Abd-Rabo, M.M. Efficacy and Safety Profiles of Oral Atorvastatin-Loaded Nanoparticles: Effect of Size Modulation on Biodistribution. Mol. Pharm. 2018, 15, 247–255. [Google Scholar] [CrossRef] [PubMed]
- Ahmed, I.S.; El-Hosary, R.; Shalaby, S.; Abd-Rabo, M.M.; Elkhateeb, D.G.; Nour, S. PD-PK evaluation of freeze-dried atorvastatin calcium-loaded poly-ε-caprolactone nanoparticles. Int. J. Pharm. 2016, 504, 70–79. [Google Scholar] [CrossRef] [PubMed]
- Ahmed, I.S.; Rashed, H.M.; Fayez, H.; Farouk, F.; Shamma, R.N. Nanoparticle-mediated dual targeting: An approach for enhanced baicalin delivery to the liver. Pharmaceutics 2020, 12, 107. [Google Scholar] [CrossRef] [PubMed]
- Haider, M.; Hassan, M.A.; Ahmed, I.S.; Shamma, R. Thermogelling Platform for Baicalin Delivery for Versatile Biomedical Applications. Mol. Pharm. 2018, 15, 3478–3488. [Google Scholar] [CrossRef] [PubMed]
- Martínez Rivas, C.J.; Tarhini, M.; Badri, W.; Miladi, K.; Greige-Gerges, H.; Nazari, Q.A.; Galindo Rodríguez, S.A.; Román, R.Á.; Fessi, H.; Elaissari, A. Nanoprecipitation process: From encapsulation to drug delivery. Int. J. Pharm. 2017, 532, 66–81. [Google Scholar] [CrossRef] [PubMed]
- Dinarvand, R.; Sepehri, N.; Manoochehri, S.; Rouhani, H.; Atyabi, F. Polylactide-co-glycolide nanoparticles for controlled delivery of anticancer agents. Int. J. Nanomed. 2011, 6, 877–895. [Google Scholar] [CrossRef] [PubMed]
- Shang, L.; Nienhaus, K.; Nienhaus, G.U. Engineered nanoparticles interacting with cells: Size matters. J. Nanobiotechnol. 2014, 12, 1–11. [Google Scholar] [CrossRef] [PubMed]
- Bahari, L.A.S.; Hamishehkar, H. The impact of variables on particle size of solid lipid nanoparticles and nanostructured lipid carriers; A comparative literature review. Adv. Pharm. Bull. 2016, 6, 143–151. [Google Scholar] [CrossRef] [PubMed]
- Saez, A.; Guzmán, M.; Molpeceres, J.; Aberturas, M.R. Freeze-drying of polycaprolactone and poly(D,L-lactic-glycolic) nanoparticles induce minor particle size changes affecting the oral pharmacokinetics of loaded drugs. Eur. J. Pharm. Biopharm. 2000, 50, 379–387. [Google Scholar] [CrossRef]
- He, C.; Yin, L.; Tang, C.; Yin, C. Size-dependent absorption mechanism of polymeric nanoparticles for oral delivery of protein drugs. Biomaterials 2012, 33, 8569–8578. [Google Scholar] [CrossRef] [PubMed]
- Huang, W.; Zhang, C. Tuning the Size of Poly(lactic-co-glycolic Acid) (PLGA) Nanoparticles Fabricated by Nanoprecipitation. Biotechnol. J. 2018, 13. [Google Scholar] [CrossRef] [PubMed]
- Mora-Huertas, C.E.; Fessi, H.; Elaissari, A. Influence of process and formulation parameters on the formation of submicron particles by solvent displacement and emulsification-diffusion methods: Critical comparison. Adv. Colloid Interface Sci. 2011, 163, 90–122. [Google Scholar] [CrossRef] [PubMed]
- Chorny, M.; Fishbein, I.; Danenberg, H.D.; Golomb, G. Lipophilic drug loaded nanospheres prepared by nanoprecipitation: Effect of formulation variables on size, drug recovery and release kinetics. J. Control. Release 2002, 83, 389–400. [Google Scholar] [CrossRef]
- Menon, J.U.; Kona, S.; Wadajkar, A.S.; Desai, F.; Vadla, A.; Nguyen, K.T. Effects of surfactants on the properties of PLGA nanoparticles. J. Biomed. Mater. Res. Part A 2012, 100, 1998–2005. [Google Scholar] [CrossRef] [PubMed]
- Pelikh, O.; Stahr, P.L.; Huang, J.; Gerst, M.; Scholz, P.; Dietrich, H.; Geisel, N.; Keck, C.M. Nanocrystals for improved dermal drug delivery. Eur. J. Pharm. Biopharm. 2018, 128, 170–178. [Google Scholar] [CrossRef] [PubMed]
- Danaei, M.; Dehghankhold, M.; Ataei, S.; Hasanzadeh Davarani, F.; Javanmard, R.; Dokhani, A.; Khorasani, S.; Mozafari, M.R. Impact of particle size and polydispersity index on the clinical applications of lipidic nanocarrier systems. Pharmaceutics 2018, 10, 57. [Google Scholar] [CrossRef] [PubMed]
- Gaumet, M.; Vargas, A.; Gurny, R.; Delie, F. Nanoparticles for drug delivery: The need for precision in reporting particle size parameters. Eur. J. Pharm. Biopharm. 2008, 69, 1–9. [Google Scholar] [CrossRef] [PubMed]
- Shekhawat, P.; Pokharkar, V. Risk assessment and QbD based optimization of an Eprosartan mesylate nanosuspension: In-vitro characterization, PAMPA and in-vivo assessment. Int. J. Pharm. 2019, 567, 118415. [Google Scholar] [CrossRef] [PubMed]
- Huo, S.; Ma, H.; Huang, K.; Liu, J.; Wei, T.; Jin, S.; Zhang, J.; He, S.; Liang, X.J. Superior penetration and retention behavior of 50 nm gold nanoparticles in tumors. Cancer Res. 2013, 73, 319–330. [Google Scholar] [CrossRef] [PubMed]
- Asai, D.; Xu, D.; Liu, W.; Quiroz, F.G.; Callahan, D.J.; Zalutsky, M.R.; Craig, S.L.; Chilkoti, A. Protein polymer hydrogels by in situ, rapid and reversible self-gelation. Biomaterials 2012, 33, 5451–5458. [Google Scholar] [CrossRef] [PubMed]
- Wu, I.Y.; Bala, S.; Škalko-Basnet, N.; di Cagno, M.P. Interpreting non-linear drug diffusion data: Utilizing Korsmeyer-Peppas model to study drug release from liposomes. Eur. J. Pharm. Sci. 2019, 138, 105026. [Google Scholar] [CrossRef] [PubMed]
- Termsarasab, U.; Cho, H.-J.; Kim, D.H.; Chong, S.; Chung, S.-J.; Shim, C.-K.; Moon, H.T.; Kim, D.-D. Chitosan oligosaccharide–arachidic acid-based nanoparticles for anti-cancer drug delivery. Int. J. Pharm. 2013, 441, 373–380. [Google Scholar] [CrossRef] [PubMed]
- Xu, C.Z.; Shi, R.J.; Chen, D.; Sun, Y.Y.; Wu, Q.W.; Wang, T.; Wang, P.H. Potential biomarkers for paclitaxel sensitivity in hypopharynx cancer cell. Int. J. Clin. Exp. Pathol. 2013, 6, 2745–2756. [Google Scholar] [PubMed]
- Dreher, M.R.; Liu, W.; Michelich, C.R.; Dewhirst, M.W.; Yuan, F.; Chilkoti, A. Tumor vascular permeability, accumulation, and penetration of macromolecular drug carriers. J. Natl. Cancer Inst. 2006, 98, 335–344. [Google Scholar] [CrossRef] [PubMed]


| Numerical Factors | Applied Levels | ||||
|---|---|---|---|---|---|
| Low (−1) | High (+1) | ||||
| X1 | Amount of PLGA (mg) | 10 | 50 | ||
| X2 | Kol concentration (g/100 mL) | 0.5 | 1 | ||
| Categorical Factor | Applied Levels | ||||
| X3 | Mw of PLGA (kD) | 7–17 | 24–38 | 38–54 | |
| Responses | Optimization Goal | ||||
| Y1 | Particle size (PS) (nm) | <60 nm | |||
| Y2 | Polydispersity index (PDI) | Minimize | |||
| Y3 | Zeta potential (ZP) (mV) | Maximize | |||
| Y4 | Encapsulation efficiency (EE) (%) | Maximize | |||
| Formulation | X1 | X2 | X3 | Y1: PS (nm) | Y2: PDI | Y3: ZP (mV) | Y4: EE (%) |
|---|---|---|---|---|---|---|---|
| F1 | 50 | 1 | 38 | 329.4 ± 2.9 | 0.239 ± 0.048 | −13.5 ± 2.1 | 84.9 ± 3.6 |
| F2 | 50 | 1 | 38 | 335.8 ± 3.1 | 0.222 ± 0.015 | −14.4 ± 2.6 | 80.4 ± 4.7 |
| F3 | 29.2 | 0.8 | 7 | 118.7 ± 1.7 | 0.139 ± 0.014 | −11.8 ± 2.2 | 65.4 ± 3.9 |
| F4 | 10 | 1 | 24 | 72.5 ± 0.4 | 0.163 ± 0.011 | −13.5 ± 1.8 | 62.3 ± 5.1 |
| F5 | 10 | 0.8 | 24 | 61.8 ± 0.7 | 0.181 ± 0.016 | −16.0 ± 3.9 | 66.6 ± 2.8 |
| F6 | 15 | 0.5 | 7 | 58.9 ± 0.4 | 0.122 ± 0.011 | −12.5 ± 2.1 | 70.0 ± 4.1 |
| F7 | 50 | 0.5 | 38 | 278.1 ± 2.1 | 0.179 ± 0.015 | −13.5 ± 1.4 | 84.1 ± 3.8 |
| F8 | 20 | 0.8 | 38 | 79.4 ± 0.9 | 0.171 ± 0.013 | −9.9 ± 1.6 | 75.8 ± 2.2 |
| F9 | 50 | 0.8 | 7 | 130.0 ± 1.4 | 0.092 ± 0.008 | −12.1 ± 1.7 | 66.8 ± 3.5 |
| F10 | 46.3 | 0.9 | 24 | 184.2 ± 1.9 | 0.106 ± 0.009 | −13.8 ± 2.1 | 57.3 ± 2.6 |
| F11 | 50 | 0.5 | 24 | 193.7 ± 1.5 | 0.163 ± 0.012 | −16.0 ± 2.3 | 75.3 ± 5.5 |
| F12 | 10 | 1 | 38 | 62.7 ± 0.7 | 0.199 ± 0.014 | −12.2 ± 1.4 | 84.7 ± 5.3 |
| F13 | 26.8 | 1 | 7 | 97.3 ± 1.0 | 0.111 ± 0.011 | −13.0 ± 2.9 | 72.8 ± 3.7 |
| F14 | 33.2 | 0.5 | 7 | 113.2 ± 1.1 | 0.121 ± 0.017 | −12.7 ± 1.6 | 59.4 ± 2.7 |
| F15 | 50 | 0.8 | 7 | 115.3 ± 1.1 | 0.121 ± 0.012 | −13.9 ± 2.9 | 61.1 ± 4.3 |
| F16 | 10 | 0.5 | 38 | 51.1 ± 0.8 | 0.256 ± 0.019 | −10.7 ± 1.9 | 95.0 ± 4.6 |
| F17 | 10 | 0.5 | 24 | 66.2 ± 1.3 | 0.144 ± 0.016 | −15.9 ± 2.3 | 70.9 ± 3.4 |
| F18 | 26.8 | 1 | 7 | 116.4 ± 1.9 | 0.075 ± 0.015 | −13.6 ± 2.1 | 70.1 ± 2.9 |
| F19 | 30 | 0.8 | 24 | 121.9 ± 2.1 | 0.098 ± 0.008 | −14.1 ± 1.9 | 81.2 ± 4.4 |
| F20 | 50 | 0.5 | 24 | 186.8 ± 1.6 | 0.135 ± 0.018 | −15.3 ± 2.4 | 69.8 ± 3.9 |
| F21 | 10 | 0.7 | 7 | 42.3 ± 0.6 | 0.148 ± 0.016 | −14.1 ± 1.3 | 73.5 ± 4.1 |
| F22 | 50 | 0.5 | 38 | 269.4 ± 2.8 | 0.183 ± 0.020 | −14.9 ± 1.1 | 65.3 ± 2.8 |
| Response | R2 | Adjusted R2 | Predicted R2 | Adequate Precision | Significant Terms |
|---|---|---|---|---|---|
| PS (nm) | 0.9801 | 0.9651 | 0.9151 | 25.859 | X1 (p < 0.0001) X2 (p = 0.024) X3 (p < 0.0001) X1X3 (p < 0.0001) |
| PDI | 0.7036 | 0.6339 | 0.5160 | 8.222 | X3 (p < 0.0001) |
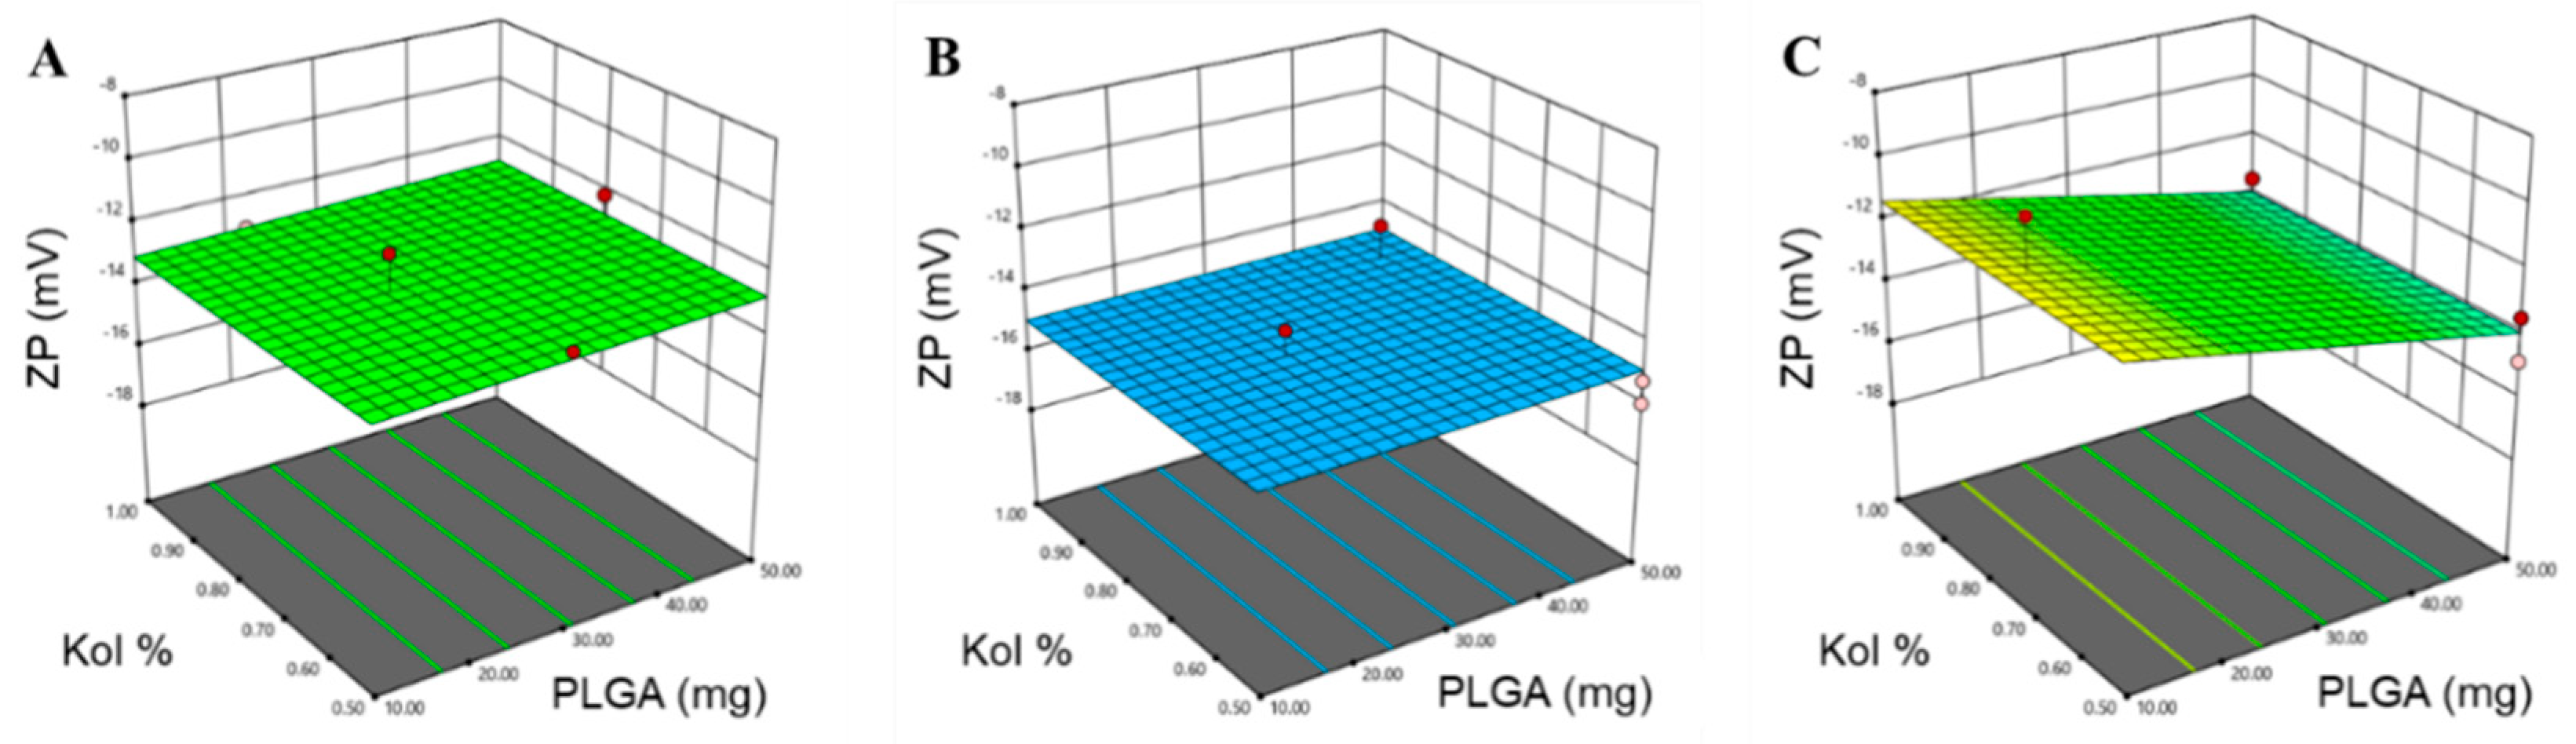
| ZP (mV) | 0.6623 | 0.5568 | 0.3101 | 7.4293 | X3 (p = 0.0016) X1X3 (p = 0.0298) |
| EE (%) | 0.4416 | 0.3828 | 0.2453 | 5.0564 | X3 (p = 0.0039) |
| Variables | Values | Response | Predicted Values | Observed Values |
|---|---|---|---|---|
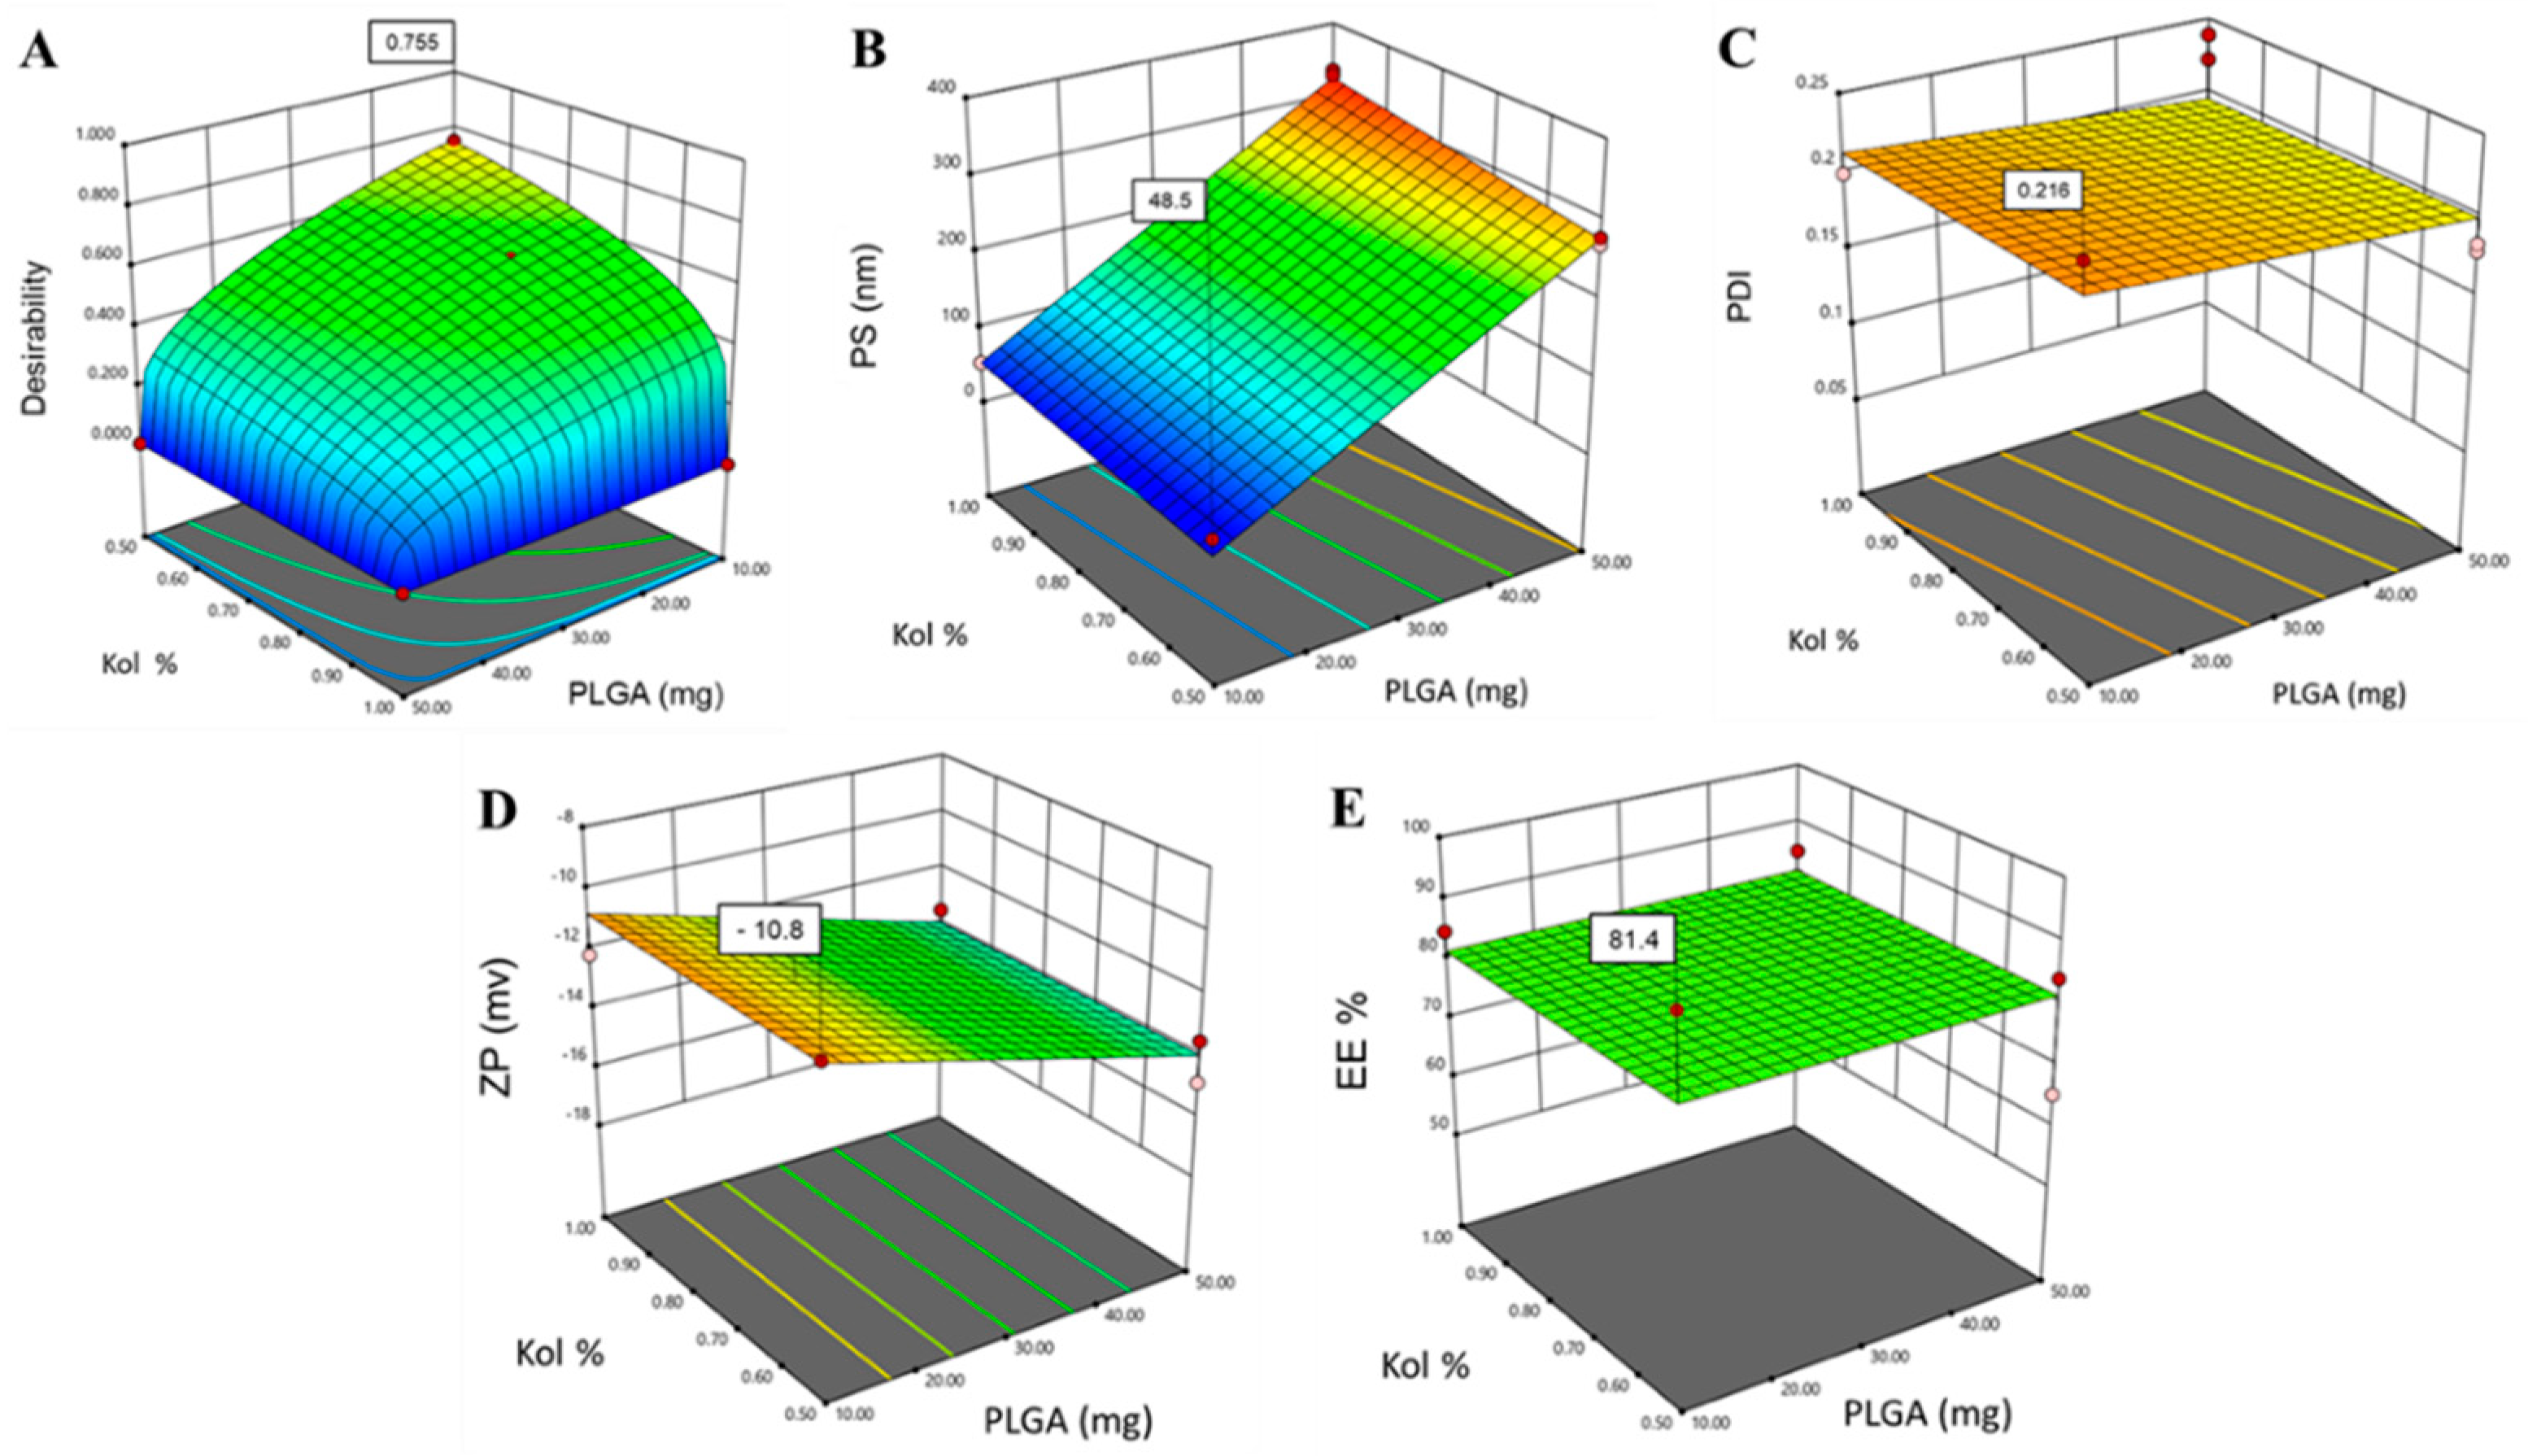
| X1 | 10 mg | Y1 (PS) | 48.5 nm | 53.1 nm |
| X2 | 0.5% (w/v) | Y2 (PDI) | 0.22 | 0.22 |
| X3 | 38–54 kD | Y3 (ZP) | −10.8 mV | −10.1 mV |
| Y4 (EE%) | 81.4% | 92.2% |
| Release Kinetic Model | Equation | k | Unit | n | R2 |
|---|---|---|---|---|---|
| Zero Order | Ct = Co − kt | 2.2156 | %/h | - | 0.713 |
| First Order | ln Ct = ln Co − kt | 0.0343 | h−1 | - | 0.801 |
| Korsmeyer–Peppas | Mt/M∞ = ktn | 15.495 | h−n | 0.4936 | 0.941 |
| Hixson–Crowell | 3√W0 = 3√Wi + kHC t | 0.0457 | (%)1/3/h | - | 0.772 |
| Higuchi | Q = kt0.5 | 12.57 | (%)/h0.5 | - | 0.933 |
| Formulation | Storage Conditions | PS (nm) | PDI | ZP (mV) | EE (%) |
|---|---|---|---|---|---|
| PTX-PLGA-NPs | Fresh | 51.7 ± 1.7 | 0.207 ± 0.024 | −11.6 ± 1.6 | 93.9 ± 3.7 |
| 25 °C | 322.2 * ± 23.8 | 0.608 * ± 0.118 | −8.1 * ± 2.7 | 95.1 ± 4.7 | |
| 4 °C | 54.3 ± 3.4 | 0.249 ± 0.040 | −11.2 ± 1.6 | 91.2 ± 3.3 |
© 2020 by the authors. Licensee MDPI, Basel, Switzerland. This article is an open access article distributed under the terms and conditions of the Creative Commons Attribution (CC BY) license (http://creativecommons.org/licenses/by/4.0/).
Share and Cite
Haider, M.; Elsherbeny, A.; Jagal, J.; Hubatová-Vacková, A.; Saad Ahmed, I. Optimization and Evaluation of Poly(lactide-co-glycolide) Nanoparticles for Enhanced Cellular Uptake and Efficacy of Paclitaxel in the Treatment of Head and Neck Cancer. Pharmaceutics 2020, 12, 828. https://doi.org/10.3390/pharmaceutics12090828
Haider M, Elsherbeny A, Jagal J, Hubatová-Vacková A, Saad Ahmed I. Optimization and Evaluation of Poly(lactide-co-glycolide) Nanoparticles for Enhanced Cellular Uptake and Efficacy of Paclitaxel in the Treatment of Head and Neck Cancer. Pharmaceutics. 2020; 12(9):828. https://doi.org/10.3390/pharmaceutics12090828
Chicago/Turabian StyleHaider, Mohamed, Amr Elsherbeny, Jayalakshmi Jagal, Anna Hubatová-Vacková, and Iman Saad Ahmed. 2020. "Optimization and Evaluation of Poly(lactide-co-glycolide) Nanoparticles for Enhanced Cellular Uptake and Efficacy of Paclitaxel in the Treatment of Head and Neck Cancer" Pharmaceutics 12, no. 9: 828. https://doi.org/10.3390/pharmaceutics12090828
APA StyleHaider, M., Elsherbeny, A., Jagal, J., Hubatová-Vacková, A., & Saad Ahmed, I. (2020). Optimization and Evaluation of Poly(lactide-co-glycolide) Nanoparticles for Enhanced Cellular Uptake and Efficacy of Paclitaxel in the Treatment of Head and Neck Cancer. Pharmaceutics, 12(9), 828. https://doi.org/10.3390/pharmaceutics12090828