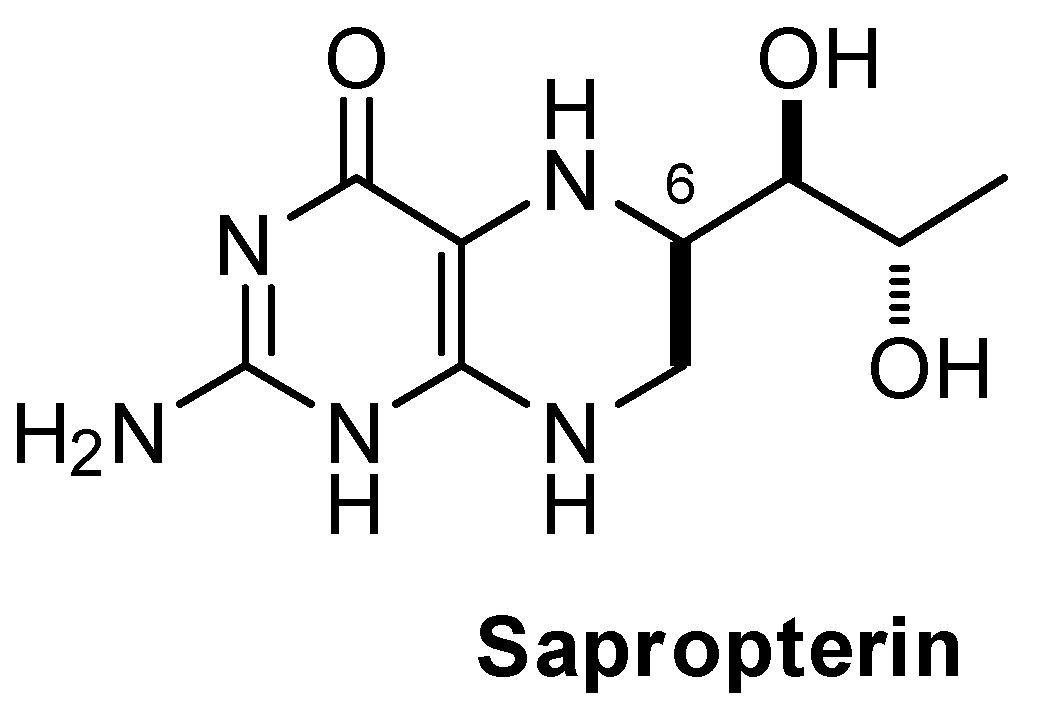
HPLC-Based Analysis of Impurities in Sapropterin Branded and Generic Tablets


 and
and 
Abstract
:
1. Introduction
2. Materials and Methods
2.1. Material
2.2. Methods
2.2.1. HPLC
2.2.2. Mass Spectrometry
3. Results
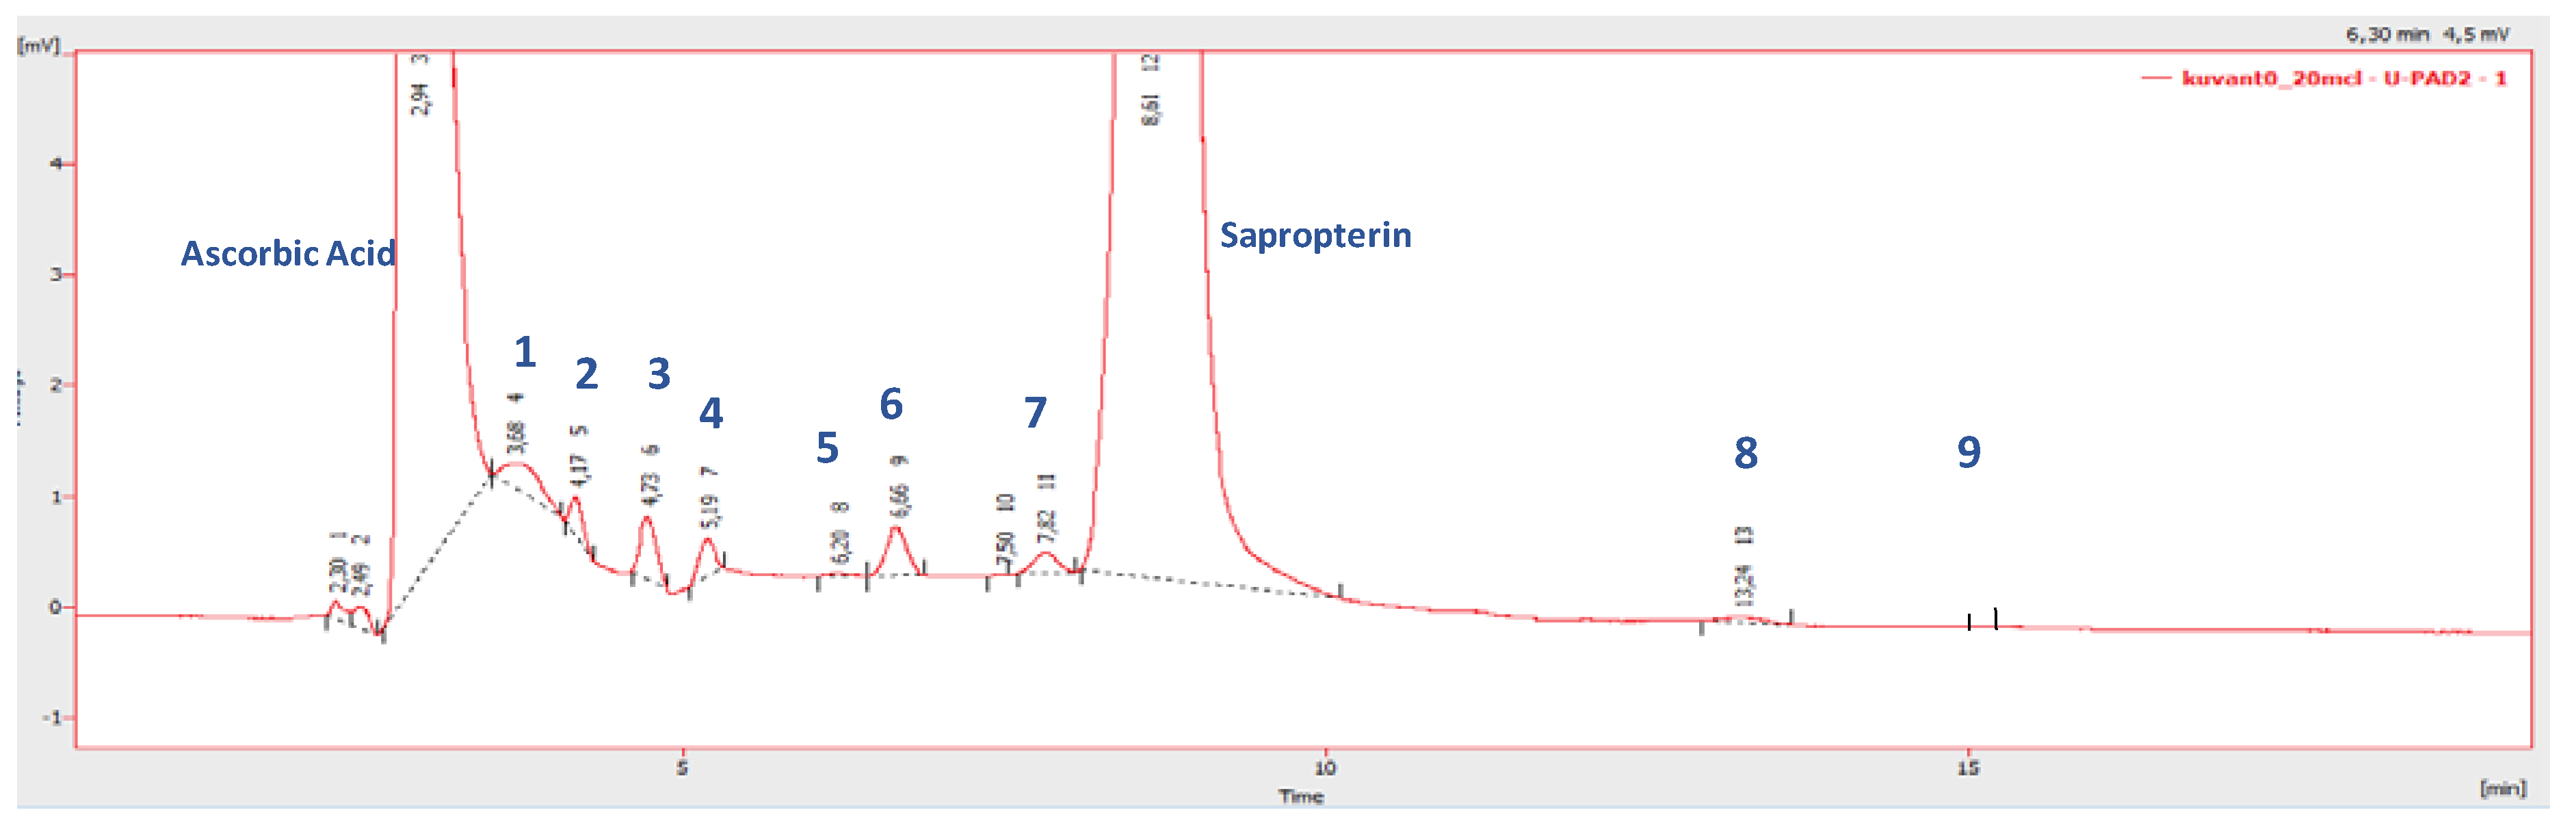
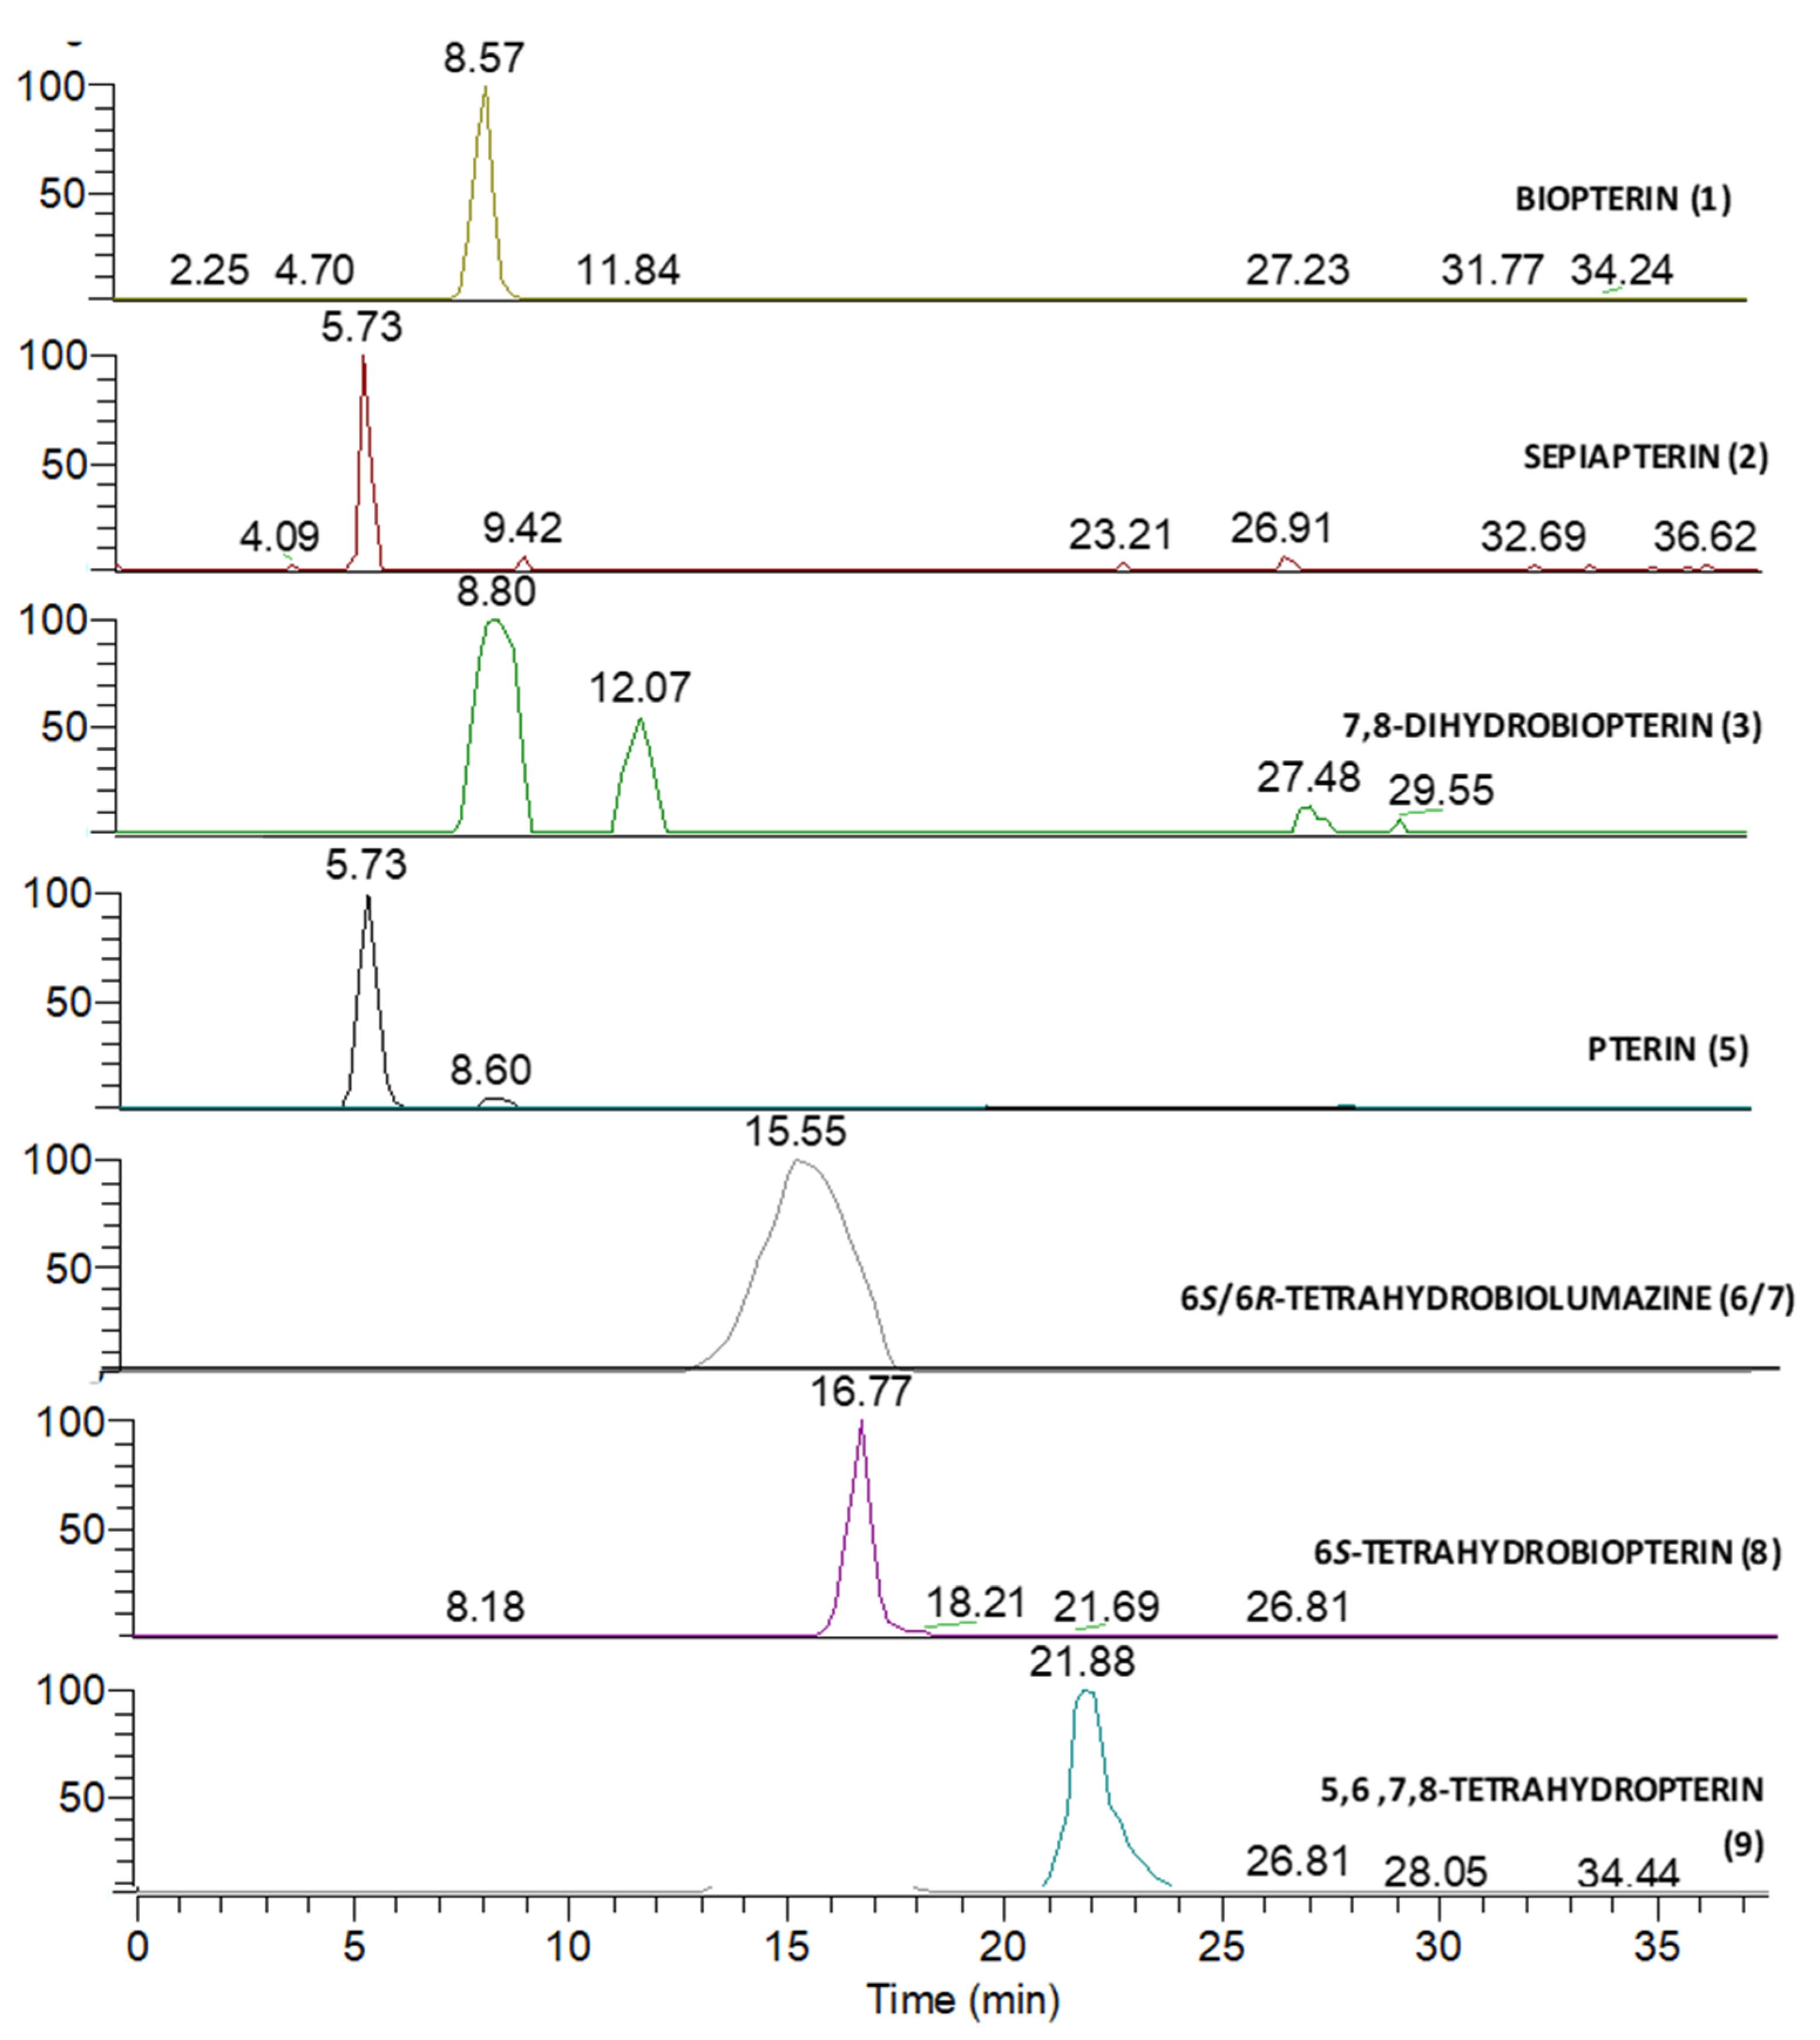
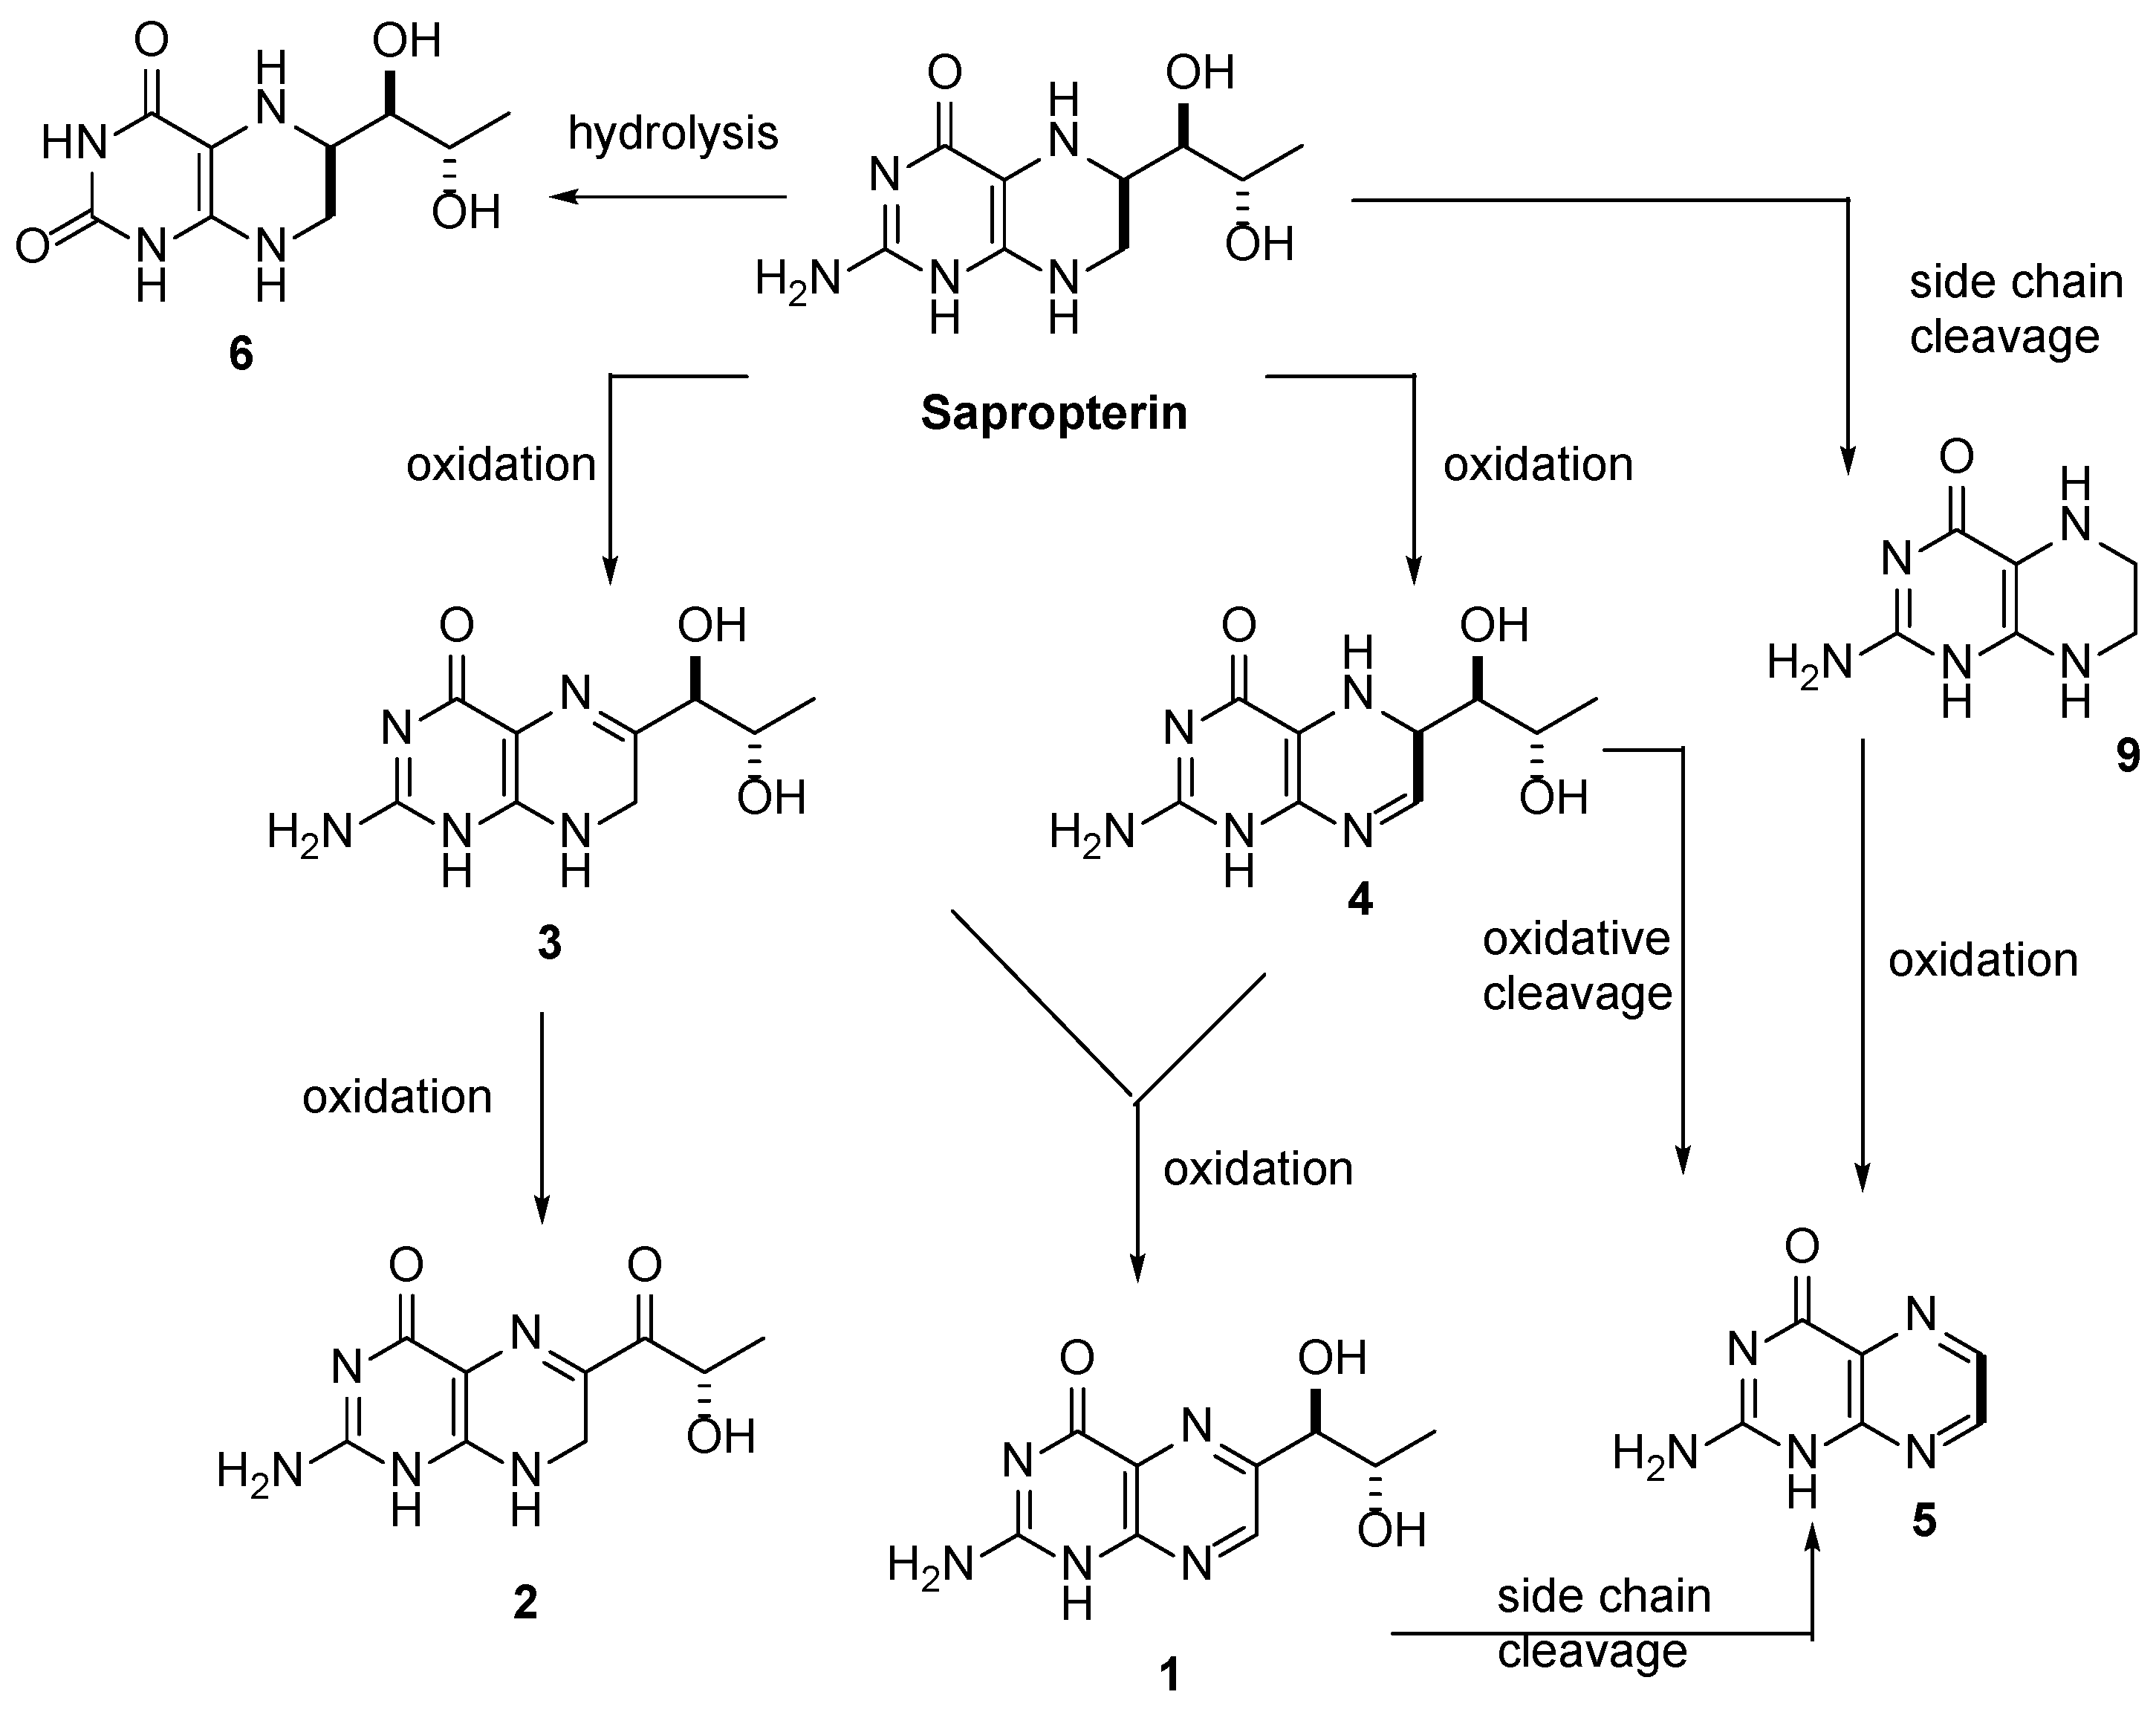
3.1. Individual Impurity Identification
3.2. Mass Spectrometry Analysis
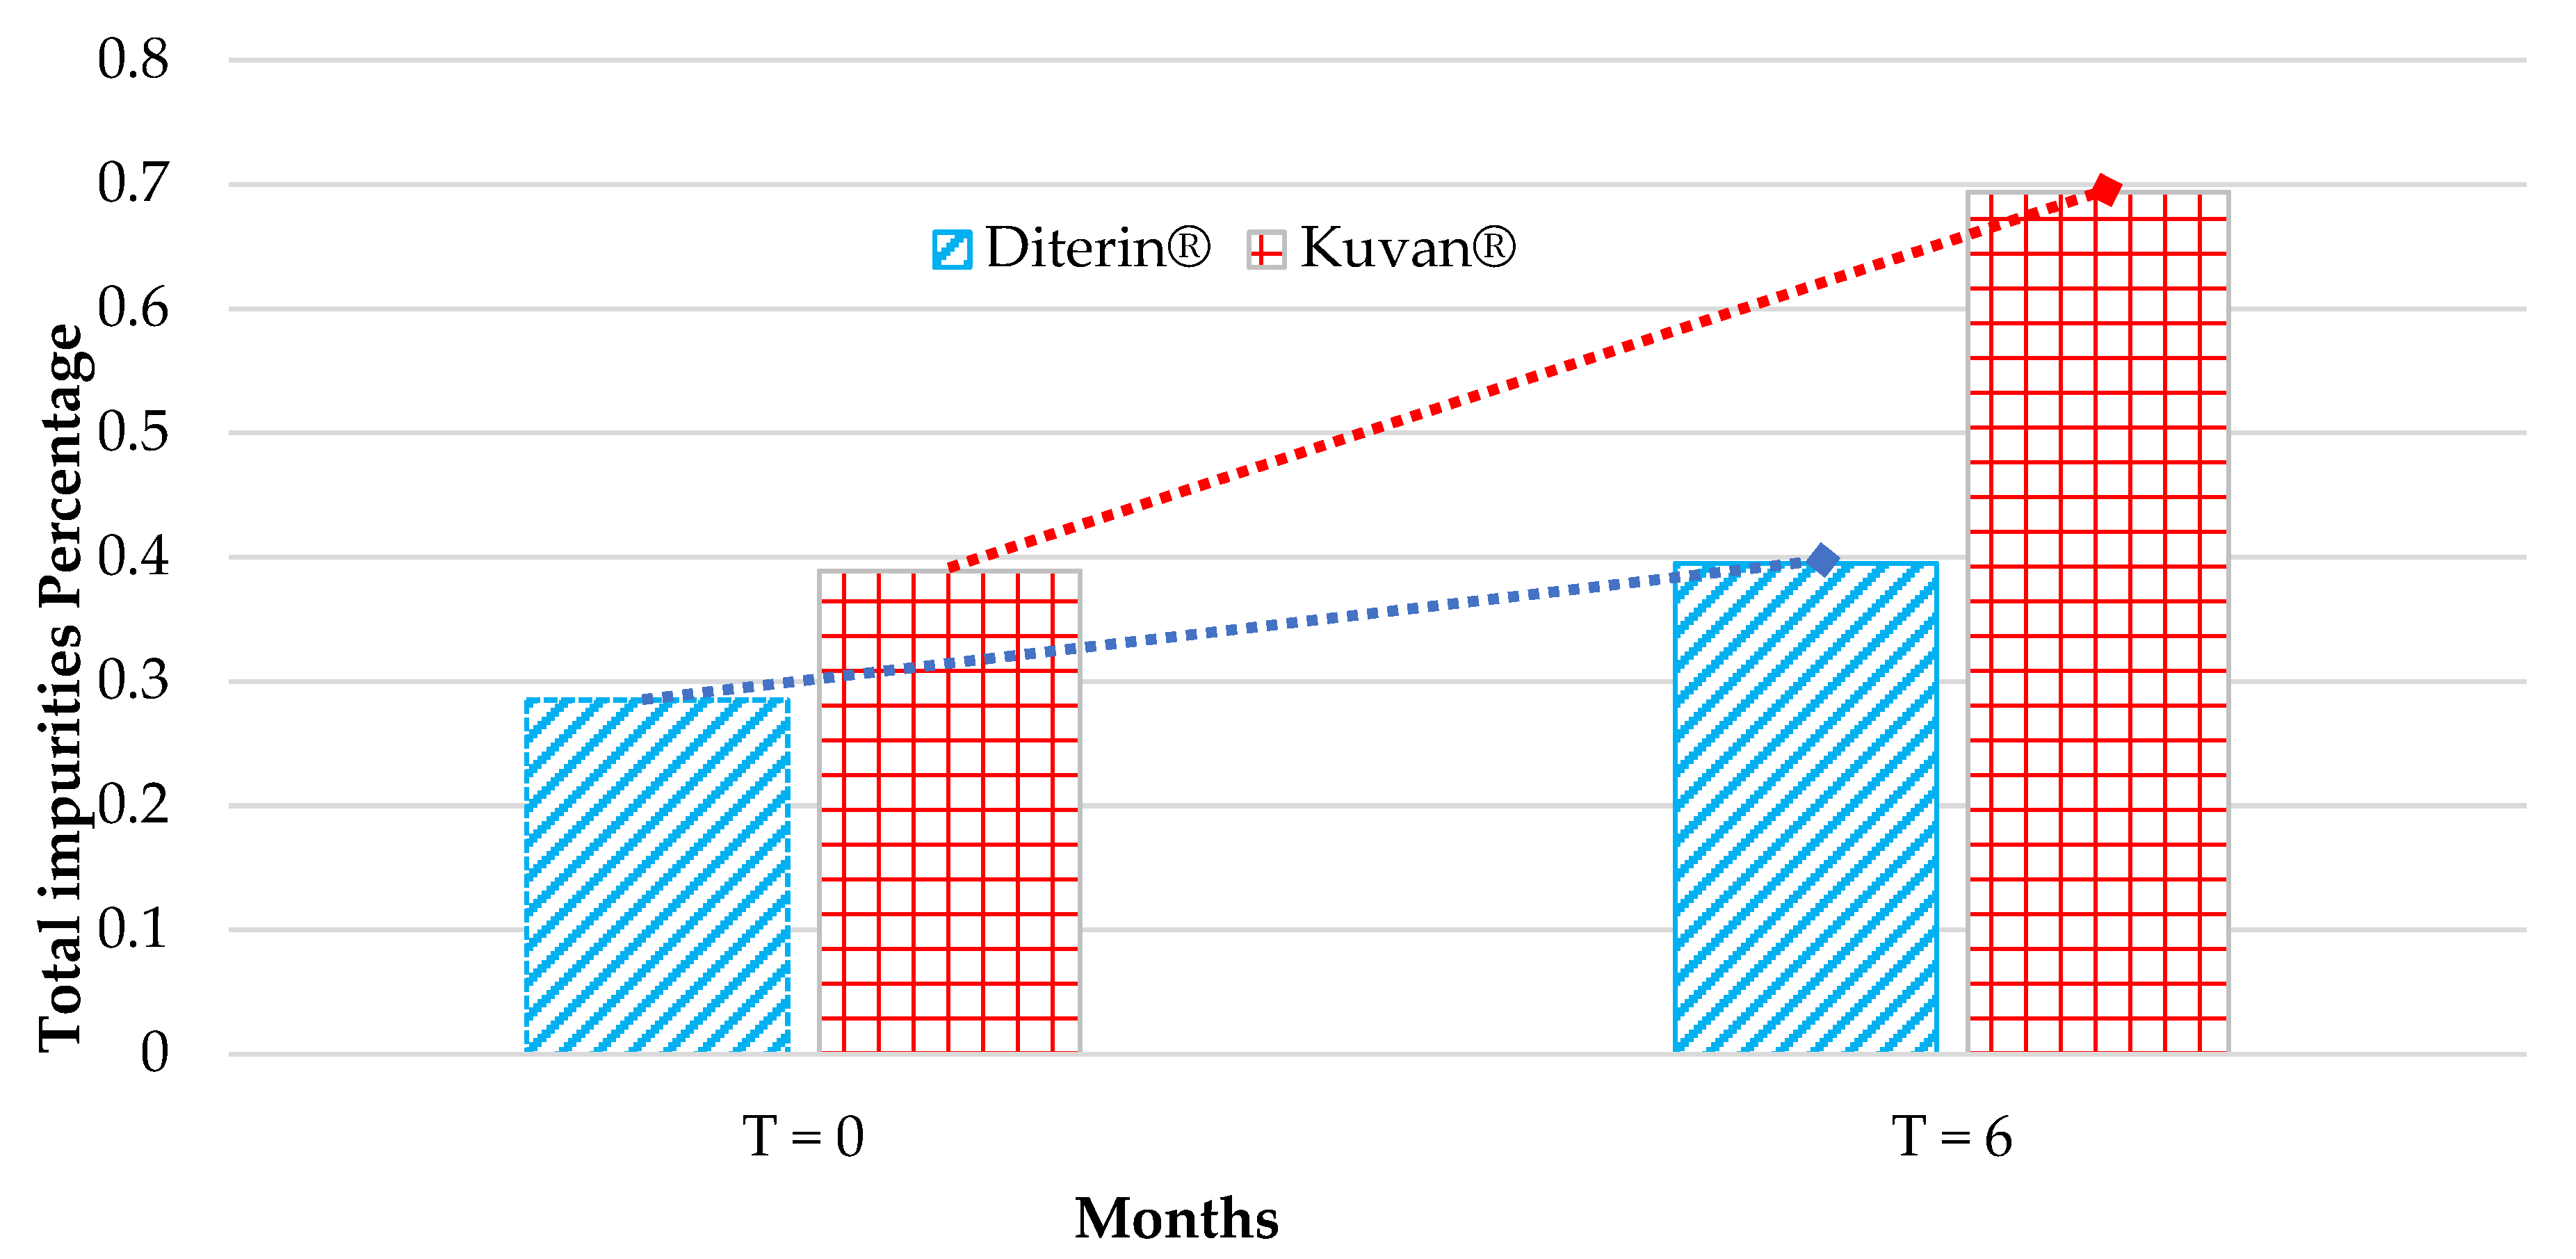
3.3. Comparative Analysis of Kuvan® and Diterin® Tablets
4. Discussion
5. Conclusions
Supplementary Materials
Author Contributions
Funding
Conflicts of Interest
References
- Muntau, A.; Röschinger, W.; Habich, M.; Demmelmair, H.; Hoffmann, B.; Sommerhoff, C.; Roscher, A. Tetrahydrobiopterin as an alternative treatment for mild phenylketonuria. N. Engl. J. Med. 2002, 347, 2122–2132. [Google Scholar] [CrossRef]
- Ogier de Baulny, H.; Abadie, V.; Feillet, F.; de Parscau, L. Management of phenylketonuria and hyperphenylalaninemia. J. Nutr. 2007, 242, 1561S–1563S. [Google Scholar] [CrossRef] [Green Version]
- Kuvan® Smpc, EMA Website. Available online: https://www.ema.europa.eu/en/documents/product-information/Kuvan®-epar-product-information.en.pdf (accessed on 1 February 2020).
- Mitchell, J.J.; Trakadis, Y.J.; Scriver, C.R. Phenylalanine hydroxylase deficiency. Genet. Med. 2011, 13, 697–707. [Google Scholar] [CrossRef] [PubMed]
- Vial, J.; Cohen, M.; Sassiat, P.; Thiébaut, D. Pharmaceutical quality of docetaxel generics versus originator drug product: A comparative analysis. Curr. Med. Res. Opin. 2008, 24, 2019–2033. [Google Scholar] [CrossRef] [PubMed]
- U.S. Food & Drug; News & Events/FDA Newsroom/Press Announcements; Gottlieb, S.; Woodcock, J. Available online: https://www.fda.gov/news-events/press-announcements/statement-fda-commissioner-scott-gottlieb-md-and-director-fdas-center-drug-evaluation-and-research-0 (accessed on 16 July 2019).
- Hyland, K. Estimation of tetrahydro, dihydro and fully oxidised pterins by high-performance liquid chromatography using sequential electrochemical and fluorometric detection. J. Chromatogr. B 1985, 343, 35–41. [Google Scholar] [CrossRef]
- Biondi, R.; Ambrosio, G.; De Pascali, F.; Tritto, I.; Capodicasa, E.; Druhan, L.J.; Hemann, C.; Zweier, J.L. HPLC analysis of tetrahydrobiopterin and its pteridine derivatives using sequential electrochemical and fluorimetric detection: Application to tetrahydrobiopterin autoxidation and chemical oxidation. Arch. Biochem. Biphys. 2012, 520, 7–16. [Google Scholar] [CrossRef] [PubMed] [Green Version]
- Kappel, M.; Mengel, R.; Pfeiderer, W. Pteridines, LXXV. Synthesis and properties of biopterin and biopterin analogs. Liebigs Ann. Chem. 1984, 1815–1825. [Google Scholar] [CrossRef]
- Armarego, W.L.F.; Waring, P.; Paal, B. Pterins. VIII. The absolute configuration at C 6 of natural 2-Amino-6-[(1’R, 2’S)-1’, 2’-dihydroxypropyl]-5, 6, 7, 8-tetrahydropteridin-4 (3H)-one (L-erythro-5, 6, 7, 8-tetrahydrobiopterin). Aust. J. Chem. 1982, 35, 785–793. [Google Scholar] [CrossRef]
- Schmidt, H.; Tegederand, I.; Geisslinger, G. Determination of neopterin and biopterin by liquid chromatography coupled to tandem mass spectrometry (LC-MS/MS) in rat and human plasma, cell extracts and tissue homogenates. Available online: https://protocolexchange.researchsquare.com/article/nprot-86/v1 (accessed on 1 February 2020). [CrossRef]
- Zhao, Y.; Cao, J.; Chen, Y.S.; Zhu, Y.; Patrick, C.; Chien, B.; Cheng, A.; Foehr, E.D. Detection of tetrahydrobiopterin by LC-MS/MS in plasma from multiple species. Bioanalysis 2009, 1, 895–903. [Google Scholar] [CrossRef] [PubMed]
- Fismen, L.; Eide, T.; Djurhuus, R.; Svardal, A.M. Simultaneous quantification of tetrahydrobiopterin, dihydrobiopterin, and biopterin by liquid chromatography coupled electrospray tandem mass spectrometry. Anal. Biochem. 2012, 430, 163–170. [Google Scholar] [CrossRef] [PubMed]
- Davis, M.D.M.; Kaufman, S.; Milstien, S. The auto-oxidation of tetrahydrobiopterin. Eur. J. Biochem. 1988, 173, 345–351. [Google Scholar] [CrossRef] [PubMed]

| Peak Number | Name | Chemical Structure | Standard RT (min) | Sample RT (min) |
|---|---|---|---|---|
| 1 | Biopterin |  | 3.65 | 3.68 |
| 2 | Sepiapterin | 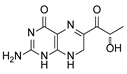 | 4.16 | 4.17 |
| 3 | 7,8-dihydrobiopterin | 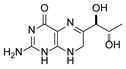 | 4.74 | 4.73 |
| 4 | 5,6-dihydrobiopterin | 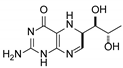 | 5.20 | 5.19 |
| 5 | Pterin |  | 6.21 | 6.20 |
| 6 | 6R-tetrahydrobiolumazine |  | 6.63 | 6.66 |
| 7 | 6S-tetrahydrobiolumazine |  | 7.77 | 7.82 |
| 8 | 6S-tetrahydrobiopterin | 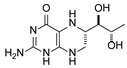 | 13.22 | 13.24 |
| 9 | 5,6,7,8-tetrahydropterin |  | 14.99 | 15.01 |
| Peak Number | Kuvan® T = 0 | Diterin® T = 0 | Kuvan® T = 6 | Diterin® T = 6 |
|---|---|---|---|---|
| 1 | 0.058 ± 0.008 | 0.031 ± 0.002 | 0.027 ± 0.002 | 0.030 ± 0.003 |
| 2 | 0.035 ± 0.006 | 0.037 ± 0.003 | 0.221 ± 0.012 | 0.169 ± 0.007 |
| 3 | 0.091 ± 0.004 | 0.101 ± 0.008 | 0.037 ± 0.004 | 0.031 ± 0.004 |
| 4 | 0.051 ± 0.002 | 0.032 ± 0.003 | 0.176 ± 0.009 | 0.050 ± 0.005 |
| 5 | 0.004 ± 0.001 | 0.003 ± 0.000 | 0.019 ± 0.002 | 0.004 ± 0.004 |
| 6 | 0.090 ± 0.007 | 0.011 ± 0.001 | 0.135 ± 0.009 | 0.010 ± 0.001 |
| 7 | 0.042 ± 0.001 | 0.009 ± 0.001 | 0.045 ± 0.003 | 0.006 ± 0.001 |
| 8 | 0.018 ± 0.001 | Not detectable | 0.026 ± 0.003 | 0.015 ± 0.003 |
| 9 | Not detectable | 0.061 ± 0.004 | 0.008 ± 0.001 | 0.080 ± 0.006 |
| Total | 0.389 ± 0.0046 | 0.285 ± 0.0039 | 0.694 ± 0.0066 | 0.395 ± 0.011 |
© 2020 by the authors. Licensee MDPI, Basel, Switzerland. This article is an open access article distributed under the terms and conditions of the Creative Commons Attribution (CC BY) license (http://creativecommons.org/licenses/by/4.0/).
Share and Cite
Scudellaro, E.; Tartaglione, L.; Varriale, F.; Dell’Aversano, C.; Taglialatela-Scafati, O. HPLC-Based Analysis of Impurities in Sapropterin Branded and Generic Tablets. Pharmaceutics 2020, 12, 323. https://doi.org/10.3390/pharmaceutics12040323
Scudellaro E, Tartaglione L, Varriale F, Dell’Aversano C, Taglialatela-Scafati O. HPLC-Based Analysis of Impurities in Sapropterin Branded and Generic Tablets. Pharmaceutics. 2020; 12(4):323. https://doi.org/10.3390/pharmaceutics12040323
Chicago/Turabian StyleScudellaro, Emanuela, Luciana Tartaglione, Fabio Varriale, Carmela Dell’Aversano, and Orazio Taglialatela-Scafati. 2020. "HPLC-Based Analysis of Impurities in Sapropterin Branded and Generic Tablets" Pharmaceutics 12, no. 4: 323. https://doi.org/10.3390/pharmaceutics12040323
APA StyleScudellaro, E., Tartaglione, L., Varriale, F., Dell’Aversano, C., & Taglialatela-Scafati, O. (2020). HPLC-Based Analysis of Impurities in Sapropterin Branded and Generic Tablets. Pharmaceutics, 12(4), 323. https://doi.org/10.3390/pharmaceutics12040323