Detection of Viral Nucleic Acid in Specimens Spotted on Commercial Filter Papers: A Review and Meta-Analysis
 , , , ,
  and
and
Abstract
1. Introduction
2. Methods
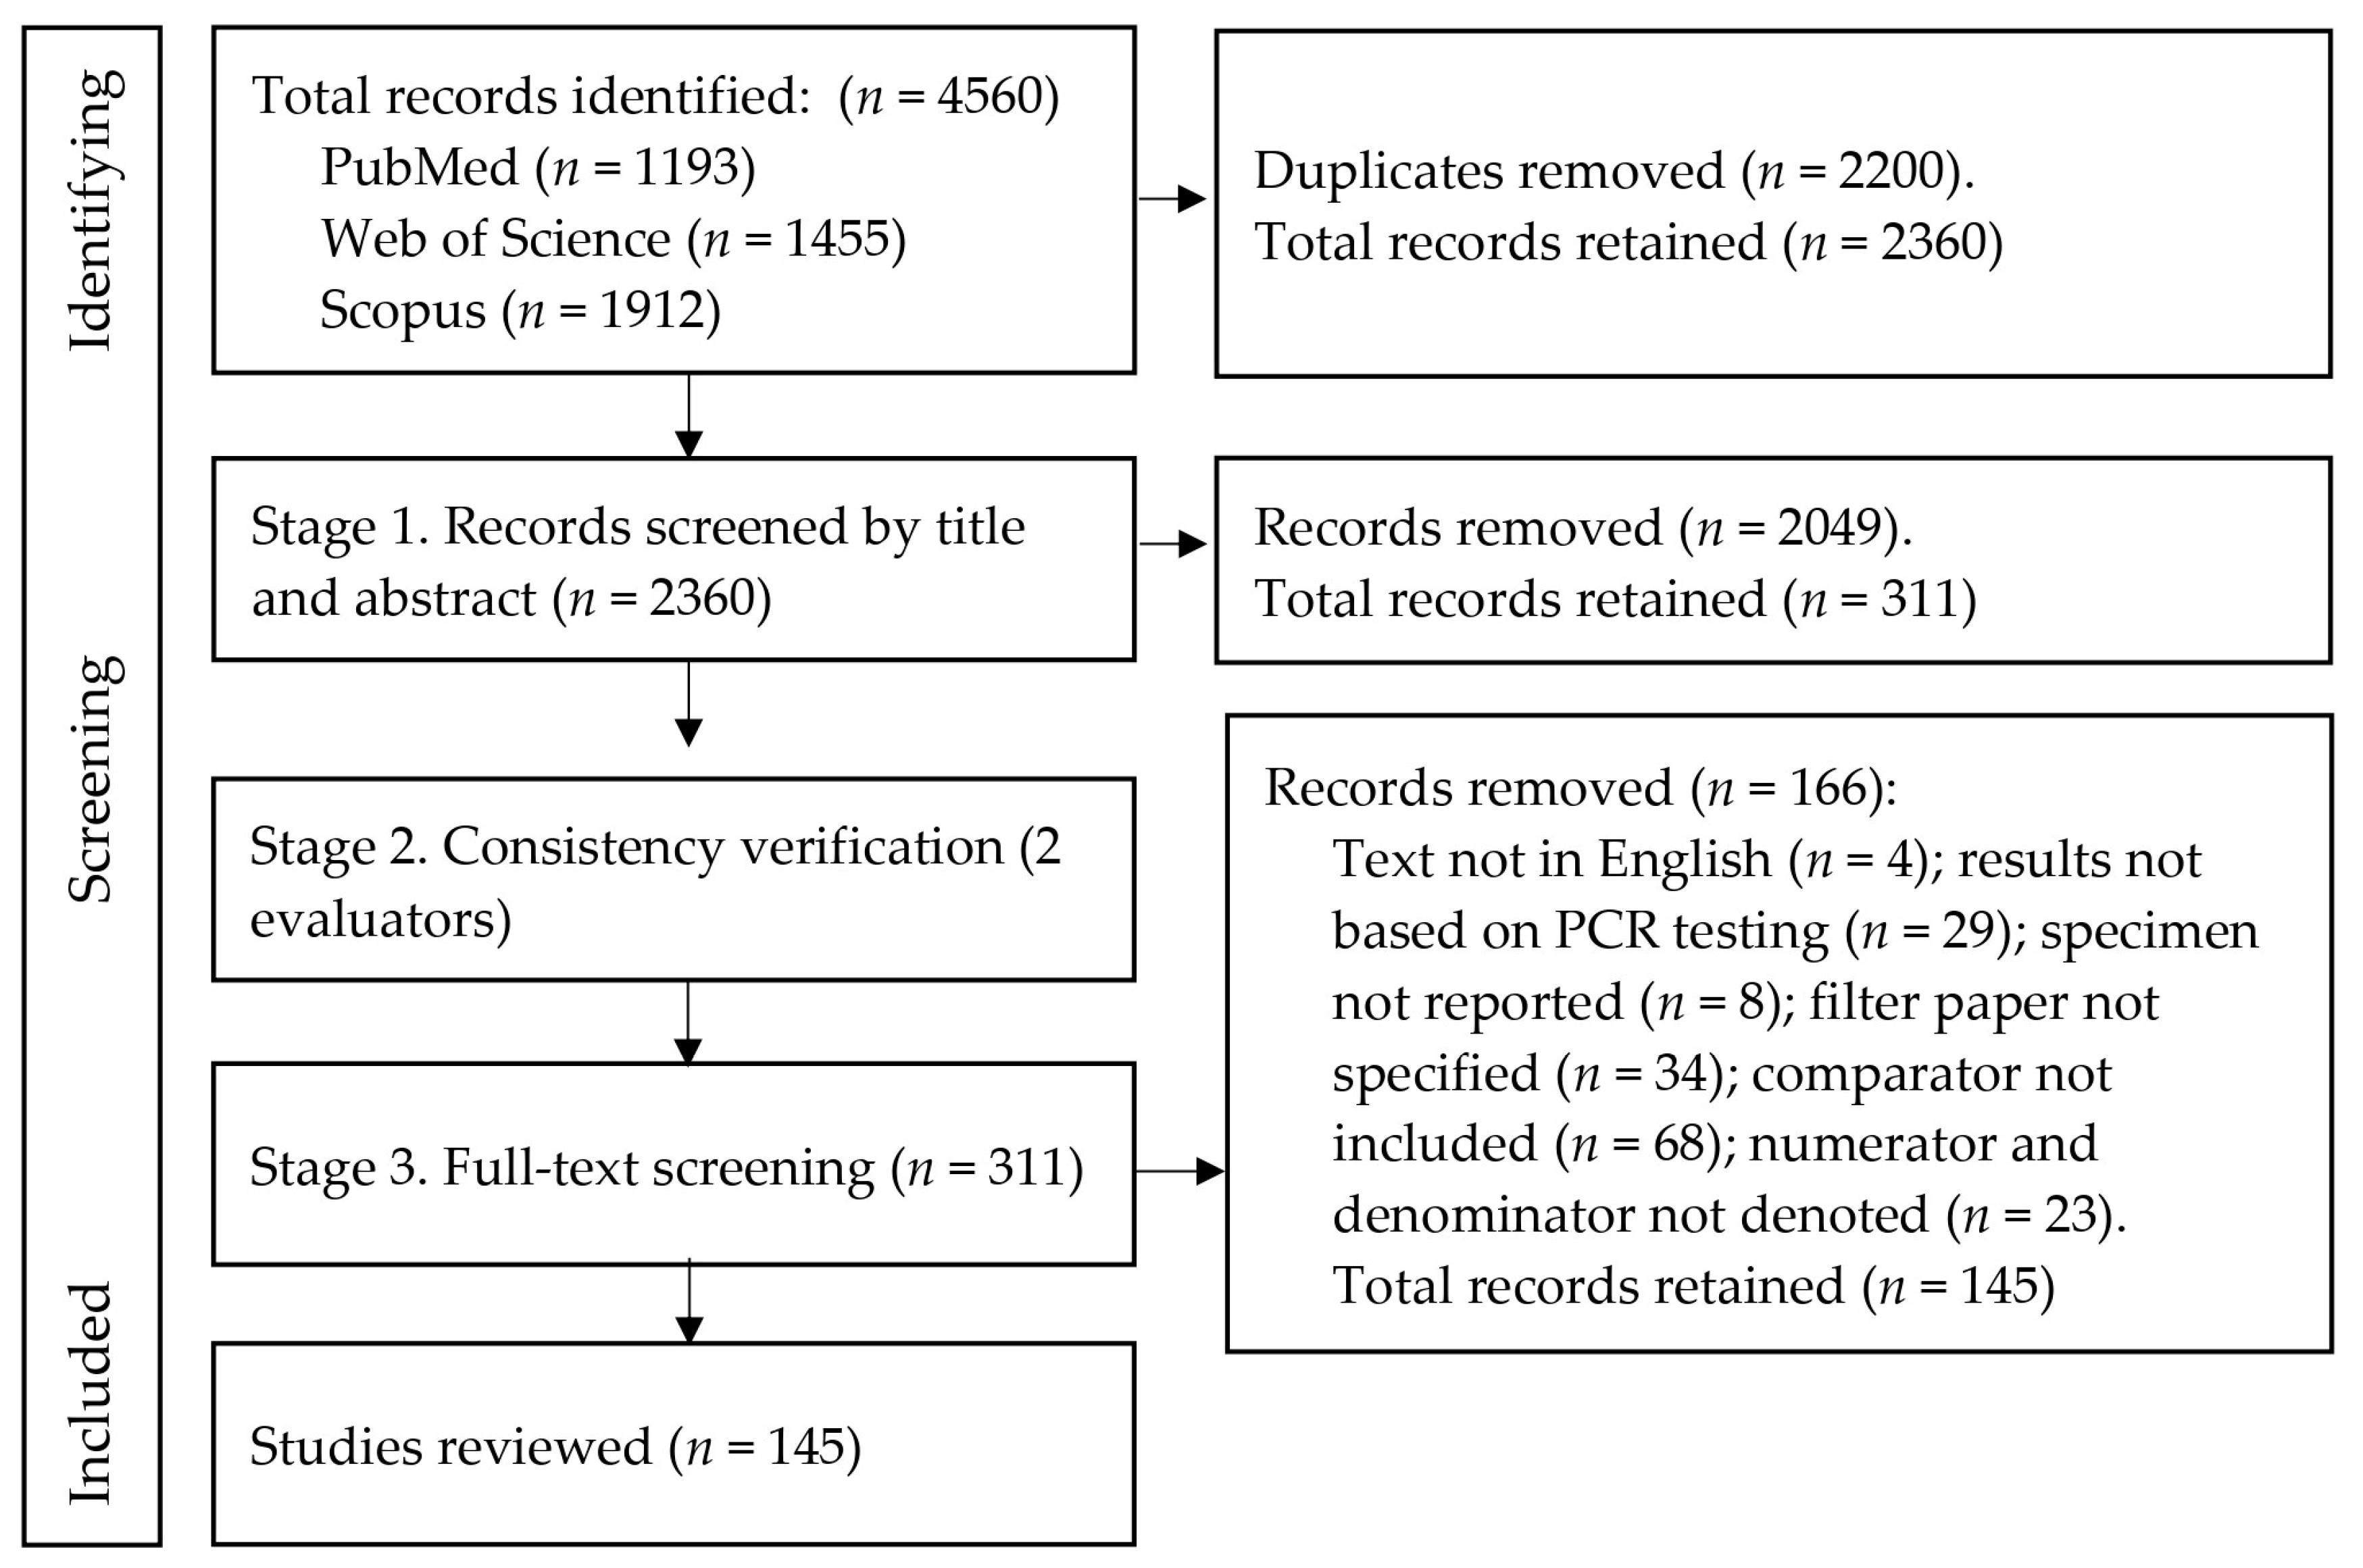
2.1. Study Overview
2.2. Search Methodology
2.3. Inclusion Criteria
2.4. Data Collected for Analysis

2.5. Meta Analyses

| Sampling Design | Infection Status of Sampling Unit(s) | Types of Comparisons (Numerator, Denominator) | Examples |
|---|---|---|---|
| A. Samples collected from sampling unit(s) at one point in time, i.e., observations are independent. | a. Unknown | 1. Numerator based on testing filter paper inoculated with a defined specimen from a defined sampling unit. Denominator (total expected positive) is based on directly testing the same biological specimen from the same sampling unit(s). | Numerator—dried blood spots from individual persons tested for HIV. Denominator—whole blood collected from the same individual and tested for HIV [22]. |
| 2. Numerator based on testing filter paper inoculated with a defined specimen from a defined sampling unit. Denominator (total expected positive) based on directly testing a different specimen from the same sampling unit(s). | Numerator—dried oral mucosal brush spots from individual humans tested for HPV. Denominator—tumor biopsy samples collected from the same individual [23]. | ||
| b. Known | 3. Numerator based on testing filter paper inoculated with a defined specimen. Denominator (total expected positive) implicit in the experimental design. | Numerator—dried oral mucosa swab spots tested for FMDV from individual inoculated cattle. Denominator implicit in experimental design, i.e., number of inoculated animals [24]. | |
| B. Samples collected from sampling unit(s) repeatedly over time, i.e., observations are correlated | c. Unknown | 4. Same as 1 (above) | Numerator—dried blood spots from individual pigs tested for PRRSV. Denominator—whole blood collected from pigs periodically (28 days) and tested for PRRSV [25]. |
| d. Known | 5. Same as 3 (above) | Numerator—dried brain homogenate spots tested for West Nile virus from individual inoculated mice and tested periodically for 90 days [26]. Denominator implicit in experimental design, i.e., number of inoculated mice. |
3. Results
4. Discussion
Author Contributions
Funding
Institutional Review Board Statement
Informed Consent Statement
Data Availability Statement
Conflicts of Interest
Abbreviations
| AIV | Avian influenza virus |
| AMPV | Avian metapneumovirus |
| ASFV | African swine fever virus |
| AstV-1 | Astrovirus 1 |
| BCV | Bovine coronavirus |
| BFV | Barmah forest virus |
| BHV-1 | Bovine herpesvirus 1 |
| BLV | Bovine leukemia virus |
| BRSV | Bovine respiratory syncytial virus |
| BVDV | Bovine viral diarrhea virus |
| CHIKV | Chikungunya virus |
| CMV | Cytomegalovirus |
| DBS | Dried blood spots |
| DENV | Dengue virus |
| DHBV | Duck hepatitis B virus |
| DMV | Dolphin Morbillivirus |
| EBV | Epstein–Barr virus |
| FAdV | Fowl adenovirus |
| FMDV | Foot-and-mouth disease virus |
| FTA | Flinders Technology Associates |
| HAdV-2 | Human adenovirus 2 |
| HAV: | Hepatitis A virus |
| HBV | Hepatitis B virus |
| HCV | Hepatitis C virus |
| HEV | Hepatitis E virus |
| HIV | Human immunodeficiency virus |
| HPV | Human papillomavirus |
| IAV | Influenza A virus |
| IBDV | Infectious bursal disease virus |
| IBV | Infectious bronchitis disease virus |
| IHHNV | Infectious hypodermal and hematopoietic necrosis virus |
| MDV | Marek’s disease virus |
| MeV | Measles virus |
| MHV | Mouse hepatitis virus |
| MNV | Murine norovirus |
| NA | Nucleic acid |
| NDV | Newcastle disease virus |
| NNV | Nervous necrosis virus |
| NoV | Norovirus |
| PCR | Polymerase chain reaction |
| PICO | Population, intervention, comparison, and outcome. |
| PPRV | Peste des petits ruminants virus |
| PRISMA | Preferred reporting items for systematic reviews and meta-analysis |
| PRRSV | Porcine reproductive and respiratory syndrome virus |
| PUUV | Puumala hantavirus |
| RABV | Rabies virus |
| RHDV2 | Rabbit Hemorrhagic disease virus 2 |
| RRV | Ross river virus |
| RV | Rotavirus |
| SARS-CoV-2 | Severe acute respiratory syndrome coronavirus 2 |
| SIV | Simian immunodeficiency virus |
| SPF | Specific pathogen free |
| TBEV | Tick-borne encephalitis virus |
| TMEV | Theiler’s murine encephalomyelitis virus |
| USUV | Usutu virus |
| VEEV | Venezuelan equine encephalitis virus |
| WNV | West Nile virus |
| YFV | Yellow fever virus |
| ZIKV | Zika virus |
Appendix A
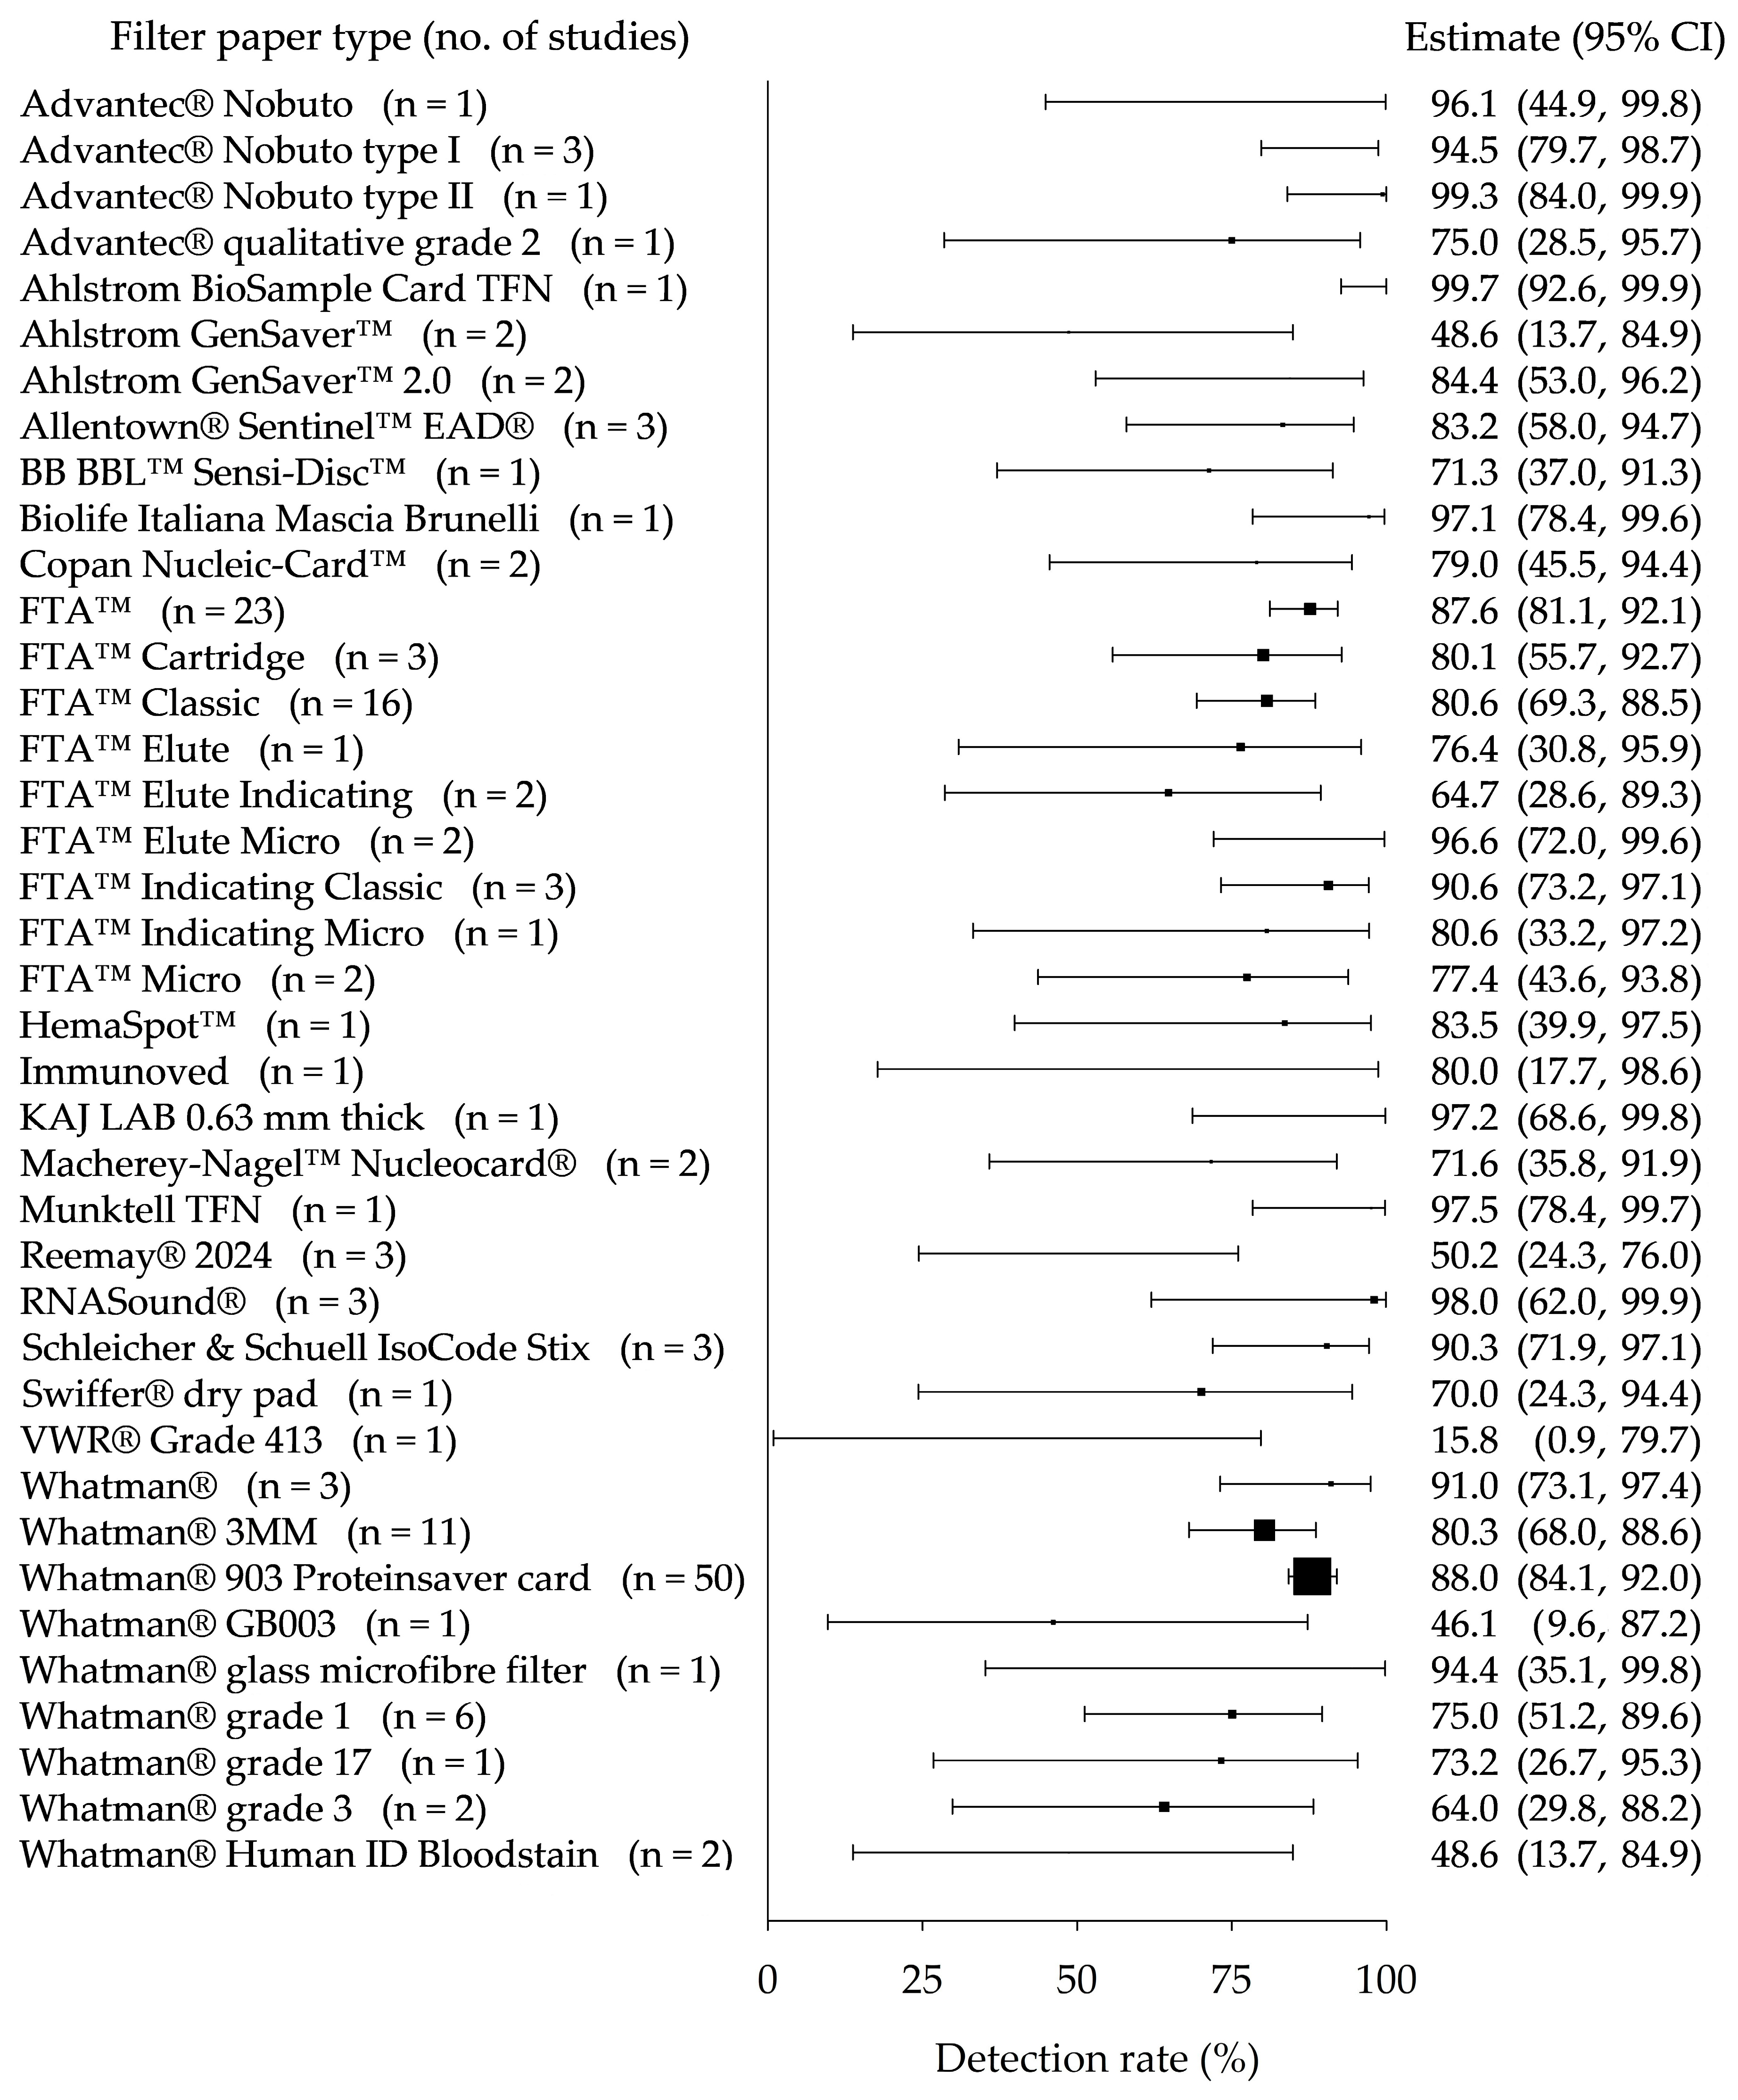
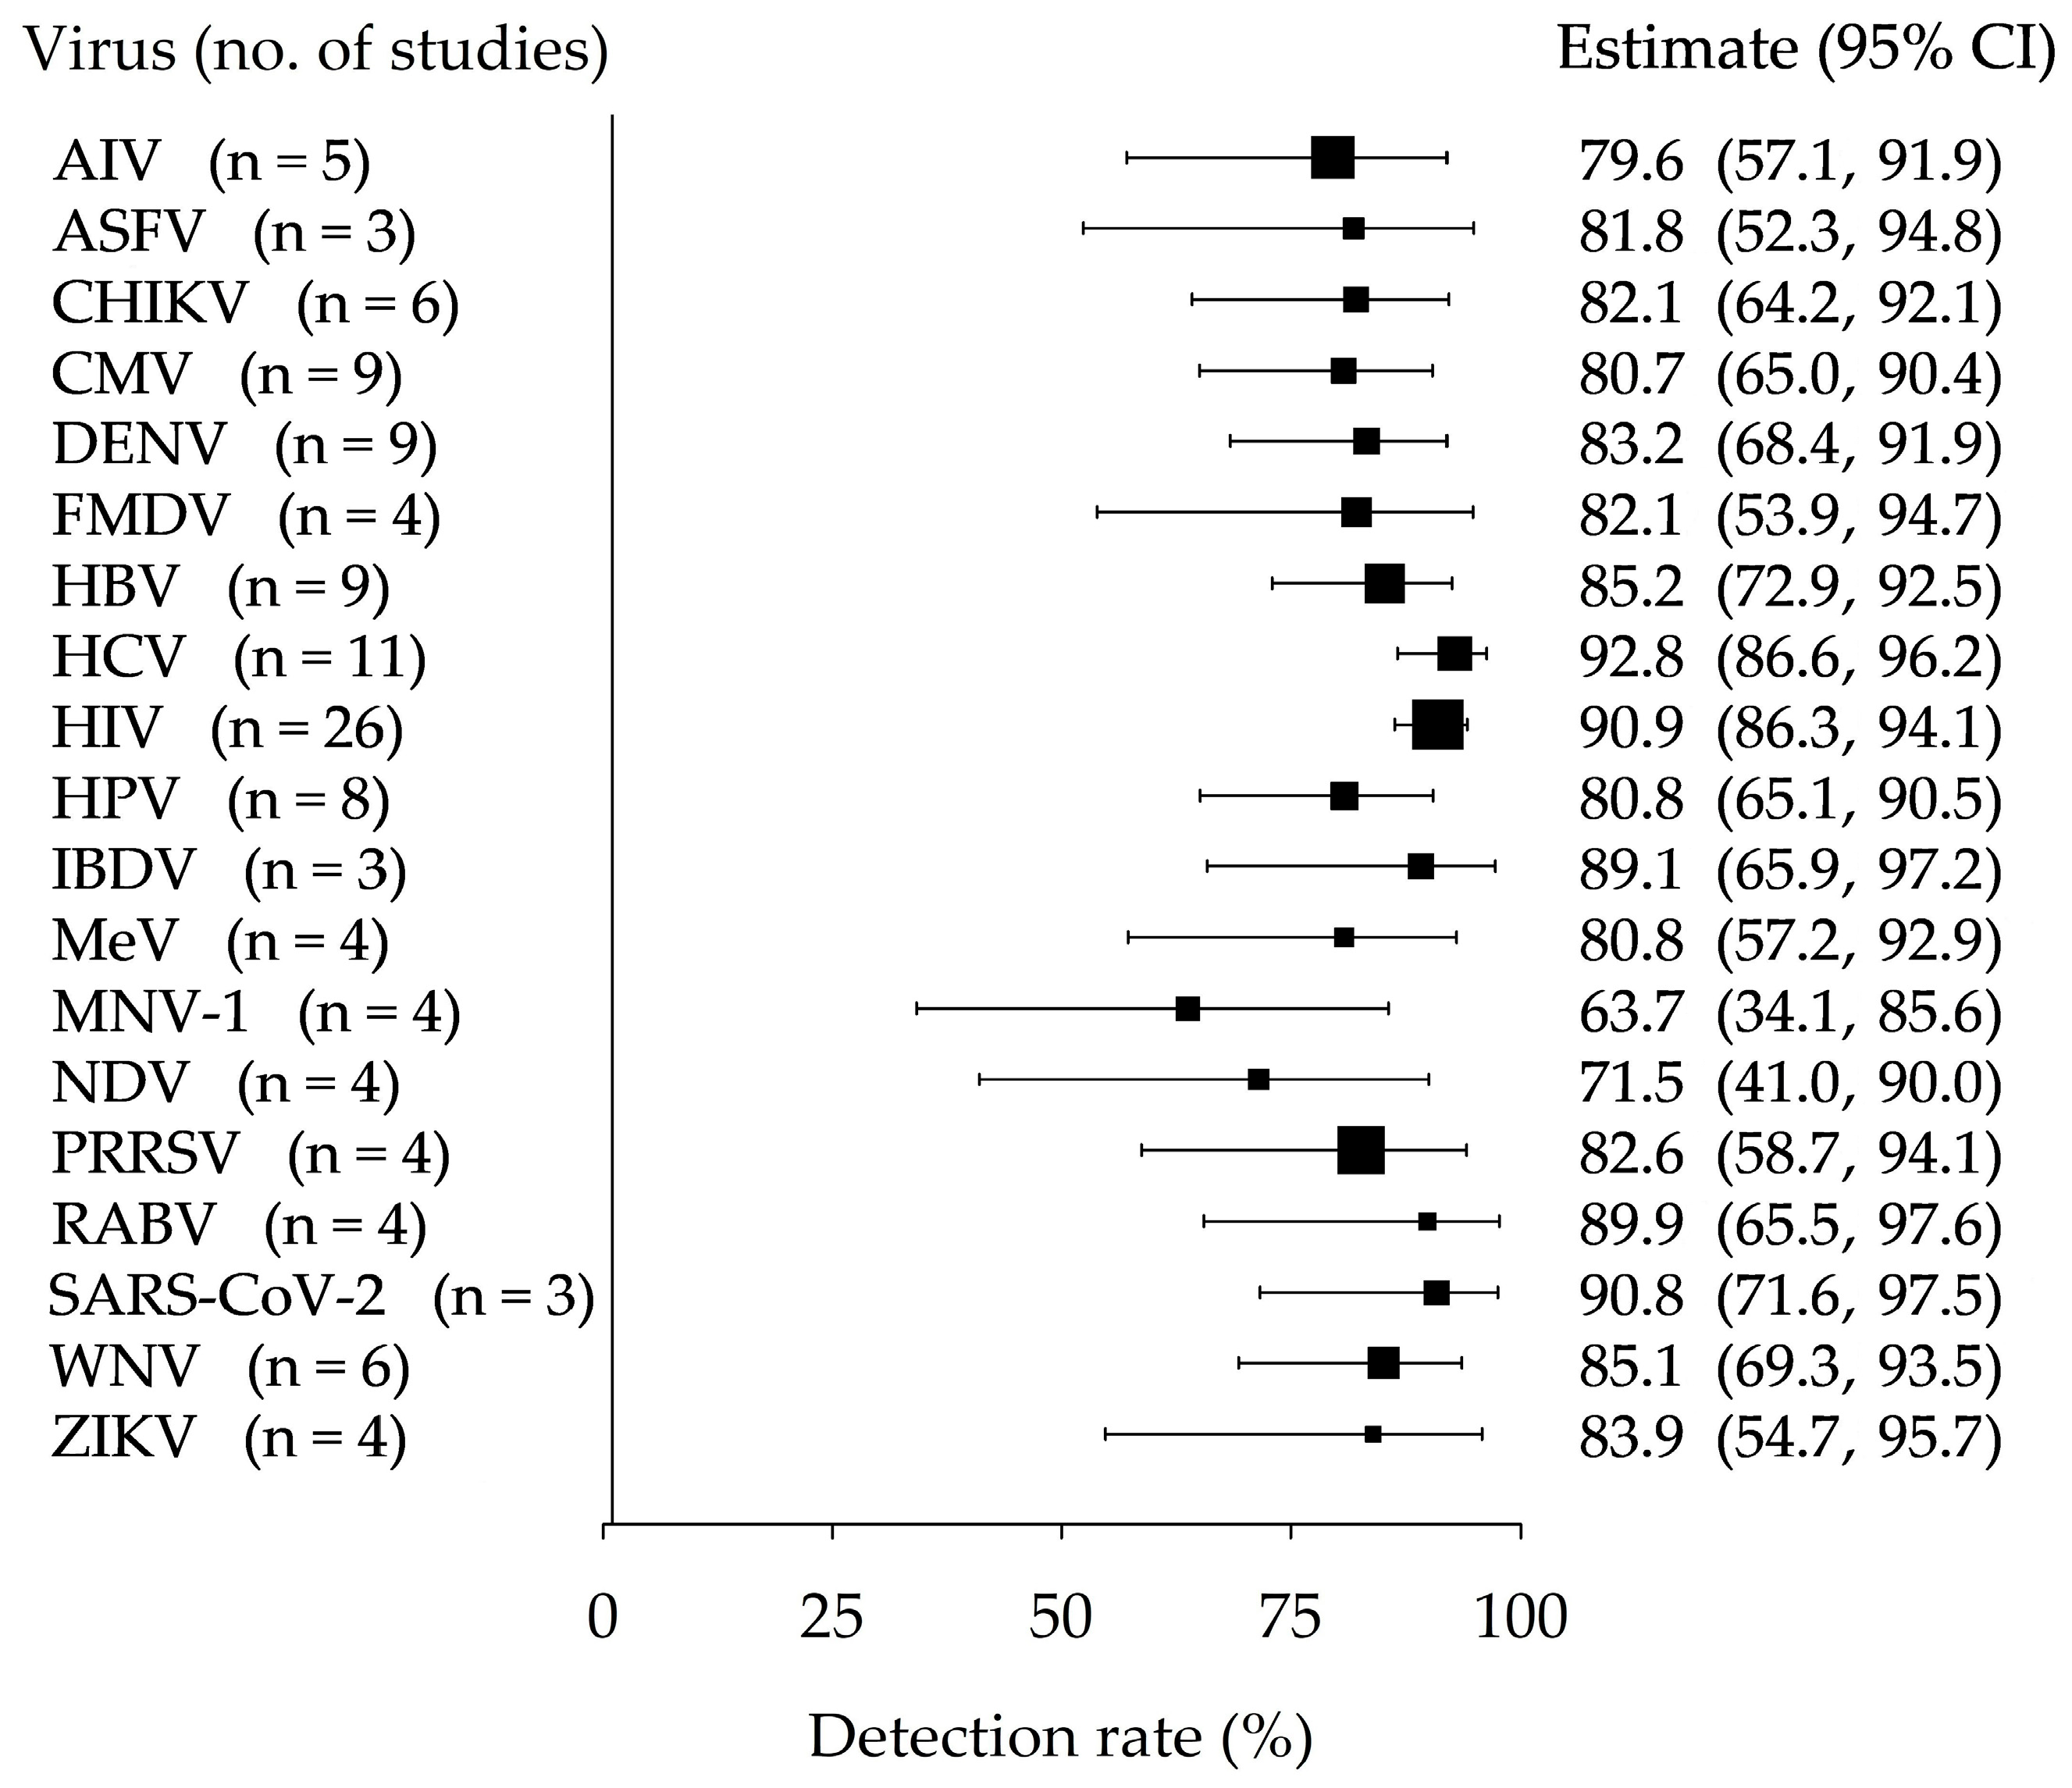
| Virus | Year | Filter Paper | Specimen | Comparison Type | Detection Rate (%) (Pos/Denominator) | Reference |
|---|---|---|---|---|---|---|
| AIV | 2011 | FTA™ | Allantoic fluid | 2 | 80.0 (12/15) | [38] |
| 2012 | FTA™ | Cloacal swab | 1 | 87.0 (20/23) | [46] | |
| 2012 | FTA™ | Oropharyngeal swab | 1 | 100.0 (5/5) | [46] | |
| 2016 | FTA™ Classic | Allantoic fluid | 4 | 83.3 (5/6) | [65] | |
| 2021 | Swiffer® dry pad | Virus culture | 5 | 70.2 (59/84) | [94] | |
| 2022 | FTA™ Classic | Allantoic fluid | 4 | 75.0 (6/8) | [72] | |
| AMPV | 2014 | FTA™ | Virus culture | 4 | 66.7 (4/6) | [39] |
| ASFV | 2007 | Whatman® 3MM | Whole blood | 1 | 88.9 (8/9) | [103] |
| 2013 | FTA™ Classic | 3 | 100.0 (10/10) | [75] | ||
| 2014 | Whatman® 3MM | 1 | 65.2 (45/69) | [104] | ||
| 2021 | FTA™ Classic | 5 | 100.0 (4/4) | [33] | ||
| 2021 | FTA™ Indicating | 5 | 100.0 (4/4) | [33] | ||
| 2021 | Ahlstrom GenSaver™ | 5 | 100.0 (4/4) | [33] | ||
| 2021 | Ahlstrom GenSaver™ 2.0 | 5 | 100.0 (4/4) | [33] | ||
| 2021 | Whatman® Human ID Bloodstain | 5 | 100.0 (4/4) | [33] | ||
| 2021 | Copan Nucleic-Card™ | 5 | 100.0 (4/4) | [33] | ||
| 2021 | Macherey-Nagel™ Nucleocard® | 5 | 100.0 (4/4) | [33] | ||
| AstV-1 | 2022 | Allentown® Sentinel™ EAD® | Soiled bedding | 2 | 100.0 (4/4) | [11] |
| BCV | 2014 | FTA™ Indicating | Nasal swab | 3 | 100.0 (30/30) | [80] |
| BFV | 2017 | FTA™ | Mosquitoes | 5 | 100.0 (4/4) | [45] |
| BHV-1 | 2014 | FTA™ Indicating | Nasal swab | 3 | 92.7 (29/30) | [80] |
| 2018 | FTA™ | Semen | 1 | 93.2 (234/251) | [57] | |
| BLV | 2014 | Immunoved | Whole blood | 1 | 80.0 (4/5) | [86] |
| 2020 | Advantec® Nobuto type I | Whole blood | 3 | 97.0 (64/66) | [28] | |
| BRSV | 2014 | FTA™ Indicating | Nasal swab | 3 | 100.0 (30/30) | [80] |
| BVDV | 2001 | Whatman® grade 1 | Whole blood | 1 | 100.0 (8/8) | [157] |
| 2014 | FTA™ Indicating | Nasal swab | 3 | 100.0 (30/30) | [80] | |
| CHIKV | 2010 | FTA™ | Mosquito saliva | 3 | 70.0 (21/30) | [44] |
| 2013 | Whatman® 3MM | Whole blood | 1 | 93.2 (68/73) | [96] | |
| 2015 | Whatman® 3MM | Serum | 1 | 92.7 (38/41) | [102] | |
| 2020 | Whatman® 903 Proteinsaver card | Serum | 1 | 100.0 (3/3) | [126] | |
| 2022 | Whatman® 903 Proteinsaver card | Whole blood | 1 | 100.0 (2/2) | [115] | |
| 2025 | FTA™ | Mosquito saliva | 3 | 100.0 (66/66) | [41] | |
| CMV | 2008 | Whatman® 903 Proteinsaver card | Whole blood | 1 | 81.8 (45/55) | [144] |
| 2010 | Whatman® 903 Proteinsaver card | 2 | 34.4 (11/32) | [114] | ||
| 2013 | Whatman® 3MM | 3 | 94.3 (33/35) | [101] | ||
| 2013 | FTA™ Elute | 1 | 76.4 (81/106) | [76] | ||
| 2015 | Whatman® 903 Proteinsaver card | 3 | 100.0 (19/19) | [120] | ||
| 2019 | Whatman® 903 Proteinsaver card | 3 | 56.3 (58/103) | [148] | ||
| 2020 | Whatman® 903 Proteinsaver card | Saliva | 1 | 100.0 (42/42) | [134] | |
| 2025 | Whatman® 903 Proteinsaver card | Whole blood | 1 | 77.8 (49/63) | [143] | |
| DENV | 2005 | Advantec® Nobuto type I | Whole blood | 1 | 93.0 (40/43) | [30] |
| 2016 | Whatman® 903 Proteinsaver card | 1 | 88.6 (31/35) | [107] | ||
| 2016 | Whatman® 903 Proteinsaver card | 1 | 72.9 (35/48) | [149] | ||
| 2017 | FTA™ | Mosquitoes | 5 | 100.0 (4/4) | [45] | |
| 2017 | FTA™ Classic | Mosquito saliva | 3 | 66.7 (20/30) | [68] | |
| 2020 | Whatman® 903 Proteinsaver card | Serum | 1 | 100.0 (4/4) | [126] | |
| 2020 | FTA™ Micro | Serum | 1 | 77.8 (14/18) | [83] | |
| 2022 | Whatman® 903 Proteinsaver card | Whole blood | 1 | 100.0 (4/4) | [115] | |
| 2023 | FTA™ | Fly abdomen | 3 | 87.5 (21/24) | [58] | |
| DHBV | 2002 | Whatman® grade 1 | Serum | 1 | 100.0 (22/22) | [158] |
| DMV | 2023 | FTA™ Classic | Tissue (brain, kidney, liver, lung, lymph nodes, spleen, tonsils) | 1 | 47.4 (9/19) | [74] |
| EBV | 2024 | Whatman® 903 Proteinsaver card | Whole blood | 1 | 38.8 (19/49) | [135] |
| 2026 | FTA™ Classic | Whole blood | 1 | 57.1 (12/21) | [73] | |
| FAdV | 2007 | FTA™ Indicating Classic | Liver impression | 5 | 100.0 (6/6) | [81] |
| FMDV | 2008 | FTA™ Classic | Oral mucosa swab | 1 | 88.9 (24/27) | [69] |
| 2013 | FTA™ | Oral mucosa swab | 3 | 100.0 (15/15) | [49] | |
| 2014 | FTA™ Classic | Tissue impression smear | 3 | 100.0 (8/8) | [67] | |
| 2022 | Ahlstrom GenSaver™ | Virus culture | 3 | 0.0 (0/7) | [24] | |
| 2022 | Ahlstrom GenSaver™ 2.0 | 3 | 71.4 (5/7) | [24] | ||
| 2022 | FTA™ Classic | 3 | 71.4 (5/7) | [24] | ||
| 2022 | Whatman® Human ID Bloodstain | 3 | 0.0 (0/7) | [24] | ||
| 2022 | Copan Nucleic-Card™ | 3 | 71.4 (5/7) | [24] | ||
| 2022 | Macherey-Nagel™ Nucleocard® | 3 | 42.9 (3/7) | [24] | ||
| 2022 | Whatman® grade 1 | 3 | 0.0 (0/7) | [24] | ||
| 2022 | VWR® Grade 413 | 3 | 0.0 (0/7) | [24] | ||
| HAdV-2 | 2019 | Whatman® 3MM | Virus culture | 5 | 100.0 (4/4) | [99] |
| HAV | 2009 | FTA™ | Serum | 1 | 92.3 (24/26) | [42] |
| 2019 | Whatman® 3MM | Virus culture | 5 | 100.0 (2/2) | [99] | |
| HBV | 1992 | Whatman® 3MM | Whole blood | 1 | 71.7 (43/60) | [100] |
| 2004 | Whatman® 903 Proteinsaver card | 1 | 87.8 (72/82) | [119] | ||
| 2013 | Whatman® 903 Proteinsaver card | 1 | 93.0 (93/100) | [139] | ||
| 2016 | Whatman® 903 Proteinsaver card | 1 | 88.5 (23/26) | [145] | ||
| 2017 | FTA™ Classic | Oral fluid | 1 | 100.0 (16/16) | [71] | |
| 2022 | Whatman® 903 Proteinsaver card | Whole blood | 1 | 93.7 (59/63) | [113] | |
| 2022 | Whatman® 903 Proteinsaver card | 1 | 48.4 (31/64) | [132] | ||
| 2022 | Whatman® 903 Proteinsaver card | 1 | 95.3 (81/85) | [117] | ||
| 2024 | HemaSpot™ | 1 | 83.6 (56/67) | [85] | ||
| HCV | 1998 | Whatman® glass microfibre filter | Serum | 1 | 100.0 (8/8) | [155] |
| 2012 | Whatman® 903 Proteinsaver card | Whole blood | 1 | 100.0 (38/38) | [140] | |
| 2012 | Whatman® 903 Proteinsaver card | 1 | 100.0 (57/57) | [112] | ||
| 2013 | Whatman® 903 Proteinsaver card | 1 | 100.0 (100/100) | [139] | ||
| 2014 | Whatman® 903 Proteinsaver card | 1 | 92.3 (48/52) | [146] | ||
| 2014 | Whatman® 903 Proteinsaver card | 3 | 90.0 (18/20) | [111] | ||
| 2016 | Whatman® 903 Proteinsaver card | 1 | 79.5 (35/44) | [124] | ||
| 2018 | Whatman® grade 1 | 1 | 55.6 (5/9) | [156] | ||
| 2018 | Whatman® 903 Proteinsaver card | 1 | 100.0 (42/42) | [142] | ||
| 2018 | Munktell TFN | 1 | 97.5 (79/81) | [88] | ||
| 2021 | Whatman® 903 Proteinsaver card | 1 | 89.3 (92/103) | [122] | ||
| 2022 | FTA™ Classic | Plasma | 5 | 68.2 (15/22) | [62] | |
| HEV | 2009 | Whatman® | Whole blood | 1 | 83.8 (31/37) | [92] |
| 2009 | Schleicher & Schuell IsoCode Stix | Whole blood | 1 | 95.1 (39/41) | [92] | |
| HIV | 1991 | Whatman® 903 Proteinsaver card | Whole blood | 3 | 95.7 (66/69) | [116] |
| 1992 | Whatman® 903 Proteinsaver card | 3 | 100.0 (13/13) | [152] | ||
| 1994 | Whatman® 903 Proteinsaver card | 1 | 94.4 (17/18) | [131] | ||
| 2005 | Schleicher and Schuell IsoCode Stix | 1 | 84.0 (42/50) | [93] | ||
| 2005 | Whatman® | 1 | 94.0 (47/50) | [93] | ||
| 2005 | Whatman® 903 Proteinsaver card | 1 | 85.7 (36/42) | [22] | ||
| 2007 | Whatman® grade 3 | 3 | 78.9 (30/38) | [162] | ||
| 2007 | Whatman® 903 Proteinsaver card | 1 | 86.7 (26/30) | [108] | ||
| 2007 | Whatman® 903 Proteinsaver card | 1 | 92.1 (35/38) | [125] | ||
| 2008 | Schleicher & Schuell IsoCode Stix | 1 | 94.7 (18/19) | [91] | ||
| 2009 | Whatman® 903 Proteinsaver card | 1 | 100.0 (56/56) | [121] | ||
| 2009 | Whatman® 903 Proteinsaver card | 3 | 83.7 (36/43) | [138] | ||
| 2010 | FTA™ Elute Micro | 1 | 100.0 (8/8) | [77] | ||
| 2010 | Whatman® 903 Proteinsaver card | 1 | 100.0 (12/12) | [128] | ||
| 2010 | Whatman® 903 Proteinsaver card | 1 | 92.6 (327/353) | [147] | ||
| 2010 | Whatman® 903 Proteinsaver card | 1 | 88.2 (97/110) | [109] | ||
| 2010 | Whatman® 903 Proteinsaver card | 3 | 98.3 (59/60) | [130] | ||
| 2011 | Whatman® 903 Proteinsaver card | 3 | 85.6 (231/270) | [118] | ||
| 2011 | Whatman® 903 Proteinsaver card | 1 | 88.2 (75/85) | [136] | ||
| 2012 | Whatman® 903 Proteinsaver card | 1 | 100.0 (412/412) | [133] | ||
| 2013 | Whatman® 903 Proteinsaver card | 1 | 61.9 (122/197) | [127] | ||
| 2014 | Whatman® 903 Proteinsaver card | 3 | 96.7 (260/269) | [129] | ||
| 2017 | Whatman® 903 Proteinsaver card | 1 | 77.0 (114/148) | [123] | ||
| 2017 | Whatman® 903 Proteinsaver card | 1 | 99.0 (198/200) | [153] | ||
| 2020 | Whatman® 903 Proteinsaver card | 3 | 46.9 (67/143) | [137] | ||
| 2021 | Whatman® 903 Proteinsaver card | 1 | 84.4 (27/32) | [122] | ||
| 2023 | Ahlstrom BioSample Card TFN | 1 | 100.0 (185/185) | [32] | ||
| HPV | 2008 | Whatman® 3MM | Cervicovaginal brush | 1 | 39.1 (36/92) | [97] |
| 2009 | FTA™ Elute Micro | 1 | 100.0 (24/24) | [78] | ||
| 2010 | Whatman® 3MM | 2 | 91.7 (55/60) | [105] | ||
| 2011 | FTA™ Cartridge | 2 | 75.6 (34/45) | [61] | ||
| 2013 | FTA™ Cartridge | 2 | 89.8 (123/137) | [60] | ||
| 2015 | Biolife Italiana Mascia Brunelli | Urine | 1 | 97.3 (109/112) | [37] | |
| 2015 | FTA™ Cartridge | Cervicovaginal brush | 2 | 70.7 (70/99) | [59] | |
| 2021 | FTA™ Indicating Elute | Oral mucosa swab | 2 | 50.0 (30/60) | [23] | |
| IAV | 2021 | FTA™ Classic | Whole blood | 5 | 100.0 (4/4) | [33] |
| 2021 | FTA™ Indicating | 5 | 100.0 (4/4) | [33] | ||
| 2021 | Ahlstrom GenSaver™ | 5 | 75.0 (3/4) | [33] | ||
| 2021 | Ahlstrom GenSaver™ 2.0 | 5 | 100.0 (4/4) | [33] | ||
| 2021 | Whatman® Human ID Bloodstain | 5 | 75.0 (3/4) | [33] | ||
| 2021 | Copan Nucleic-Card™ | 5 | 75.0 (3/4) | [33] | ||
| 2021 | Macherey-Nagel™ Nucleocard® | 5 | 100.0 (4/4) | [33] | ||
| IBDV | 2006 | FTA™ | Bursal tissue impression | 1 | 85.7 (6/7) | [55] |
| IBV | 2005 | FTA™ | Allantoic fluid | 5 | 100.0 (60/60) | [50] |
| 2006 | FTA™ | Bursal tissue impression | 1 | 88.0 (22/25) | [51] | |
| IHHNV | 2025 | FTA™ | Prawn gill tissue | 5 | 100.0 (112/112) | [47] |
| MDV | 2009 | FTA™ | Feather pulp | 1 | 96.2 (50/52) | [40] |
| 2009 | FTA™ | Whole blood | 1 | 96.7 (42/43) | [40] | |
| 2009 | FTA™ | Tumor | 1 | 100.0 (14/14) | [40] | |
| MeV | 2001 | Whatman® grade 3 | Whole blood | 3 | 47.8 (43/90) | [161] |
| 2005 | Whatman® 903 Proteinsaver card | Oral fluid | 1 | 81.1 (26/32) | [2] | |
| 2012 | Whatman® 903 Proteinsaver card | 3 | 100.0 (27/27) | [141] | ||
| 2019 | FTA™ Indicating | 1 | 87.8 (165/188) | [79] | ||
| MHV | 2021 | Allentown® Sentinel™ EAD® | Rodent bedding | 2 | 50.0 (1/2) | [35] |
| 2021 | Reemay® 2024 | Rodent bedding | 2 | 0.0 (0/2) | [35] | |
| MNV | 2020 | Allentown® Sentinel™ EAD® | Exhaust air dust | 2 | 98.1 (53/54) | [34] |
| 2021 | Allentown® Sentinel™ EAD® | Rodent bedding | 2 | 83.3 (10/12) | [35] | |
| 2021 | Reemay® 2024 | 2 | 50.0 (6/12) | [35] | ||
| 2021 | Reemay® 2024 | 2 | 70.0 (7/10) | [90] | ||
| 2023 | Reemay® 2024 | 2 | 15.9 (10/63) | [89] | ||
| NDV | 2006 | Whatman® grade 1 | Allantoic fluid | 4 | 100.0 (7/7) | [159] |
| 2006 | FTA™ | 4 | 80.0 (4/5) | [53] | ||
| 2010 | FTA™ | 4 | 60.0 (3/5) | [52] | ||
| 2022 | FTA™ Classic | 4 | 66.7 (4/6) | [72] | ||
| NNV | 2016 | Whatman® 903 Proteinsaver card | Larval homogenate | 1 | 100.0 (1/1) | [70] |
| 2016 | Whatman® 903 Proteinsaver card | Virus culture | 1 | 100.0 (1/1) | [70] | |
| 2016 | Whatman® 903 Proteinsaver card | Milt | 1 | 100.0 (1/1) | [70] | |
| 2016 | Whatman® 903 Proteinsaver card | Spiked seaweed | 1 | 100.0 (1/1) | [70] | |
| NoV | 2019 | Whatman® 3MM | Stool | 5 | 100.0 (12/12) | [99] |
| 2021 | FTA™ Micro | Stool | 2 | 77.2 (61/79) | [84] | |
| PPRV | 2014 | Whatman® 3MM | Whole blood | 2 | 66.7 (12/18) | [98] |
| PRRSV | 1998 | Whatman® grade 1 | Serum | 2 | 88.9 (128/144) | [25] |
| 2007 | FTA™ | Whole blood | 2 | 100.0 (6/6) | [9] | |
| 2012 | FTA™ | Serum | 1 | 88.9 (40/45) | [48] | |
| 2012 | FTA™ | Lung | 1 | 100.0 (11/11) | [48] | |
| 2019 | FTA™ | Whole blood | 5 | 66.7 (30/45) | [43] | |
| PUUV | 2011 | Advantec® Nobuto | Whole blood | 1 | 100.0 (12/12) | [27] |
| RABV | 2003 | Whatman® 903 Proteinsaver card | Brain tissue | 5 | 100.0 (50/50) | [150] |
| 2007 | FTA™ | Virus culture | 4 | 100.0 (4/4) | [54] | |
| 2020 | Whatman® 903 Proteinsaver card | Brain tissue | 1 | 96.7 (58/60) | [3] | |
| 2022 | FTA™ Classic | Brain tissue | 3 | 80.0 (16/20) | [63] | |
| RHDV2 | 2022 | Advantec® Nobuto type II | Whole blood | 2 | 100.0 (77/77) | [31] |
| RRV | 2010 | FTA™ | Mosquito saliva | 3 | 90.0 (27/30) | [44] |
| RV | 2004 | Whatman® grade 17 | Stool | 3 | 78.8 (63/80) | [160] |
| 2015 | FTA™ | 5 | 82.5 (38/40) | [36] | ||
| 2015 | BD BBL™ Sensi-Disc™ | 5 | 82.5 (33/40) | [36] | ||
| SARS-CoV-2 | 2022 | FTA™ Classic | Nasopharyngeal swab | 3 | 96.8 (122/126) | [66] |
| 2022 | KAJ LAB 0.63 mm thick | Oropharyngeal swab | 1 | 97.2 (35/36) | [87] | |
| 2024 | Whatman® 3MM | Saliva | 1 | 74.1 (2121/286) | [106] | |
| SIV | 2009 | Whatman® 903 Proteinsaver card | Whole blood | 5 | 90.7 (68/75) | [151] |
| TBEV | 2023 | Advantec® Nobuto I | Whole blood | 1 | 100.0 (4/4) | [29] |
| TMEV | 2021 | Allentown® Sentinel™ EAD® | Soiled bedding | 2 | 72.7 (8/11) | [35] |
| 2021 | Reemay® 2024 | Soiled bedding | 2 | 45.5 (5/11) | [35] | |
| USUV | 2022 | Whatman® 903 Proteinsaver card | Whole blood | 2 | 53.2 (25/47) | [110] |
| VEEV | 2005 | Advantec® qualitative grade 2 | Brain homogenate | 5 | 100.0 (10/10) | [26] |
| WNV | 2005 | Advantec® qualitative grade 2 | Brain homogenate | 5 | 100.0 (10/10) | [26] |
| 2010 | FTA™ | Mosquito saliva | 3 | 83.3 (25/30) | [44] | |
| 2016 | FTA™ Micro | Oropharyngeal swab | 1 | 80.6 (25/31) | [82] | |
| 2016 | RNASound® | Oral swab | 1 | 100.0 (24/24) | [82] | |
| 2019 | FTA™ | Mosquito excreta | 3 | 100.0 (36/36) | [56] | |
| 2021 | FTA™ Classic | Mosquito saliva | 2 | 100.0 (2/2) | [64] | |
| 2024 | Whatman® GB003 | Mosquito saliva | 3 | 46.2 (12/26) | [154] | |
| YFV | 2005 | Advantec® qualitative grade 2 | Brain homogenate | 5 | 100.0 (10/10) | [26] |
| ZIKV | 2017 | FTA™ | Mosquitoes | 5 | 100.0 (4/4) | [45] |
| 2018 | Whatman® | Mosquito saliva | 2 | 100.0 (9/9) | [95] | |
| 2020 | Whatman® 903 Proteinsaver card | Serum | 1 | 100.0 (2/2) | [126] | |
| 2022 | Whatman® 903 Proteinsaver card | Whole blood | 1 | 100.0 (2/2) | [115] |
References
- Barua, D.; Gomez, C.Z. Blotting-paper strips for transportation of cholera stools. Bull. World Health Organ. 1967, 37, 798. [Google Scholar]
- Chibo, D.; Riddell, M.A.; Catton, M.G.; Birch, C.J. Applicability of oral fluid collected onto filter paper for detection and genetic characterization of measles virus strains. J. Clin. Microbiol. 2005, 43, 3145–3149. [Google Scholar] [CrossRef]
- Rasolonjatovo, F.S.; Guis, H.; Rajeev, M.; Dacheux, L.; Arivony Nomenjanahary, L.; Razafitrimo, G.; Rafisandrantantsoa, J.T.; Cêtre-Sossah, C.; Heraud, J.-M.; Andriamandimby, S.F. Enabling animal rabies diagnostic in low-access areas: Sensitivity and specificity of a molecular diagnostic test from cerebral tissue dried on filter paper. PLoS Negl. Trop. Dis. 2020, 14, e0008116. [Google Scholar] [CrossRef]
- Stringer, O.W.; Bossé, J.T.; Lacouture, S.; Gottschalk, M.; Fodor, L.; Angen, Ø.; Velazquez, E.; Penny, P.; Lei, L.; Langford, P.R.; et al. Rapid detection ang typing of Actinobacillus pleuropneuomoniae serovars directly from clinical samples: Combining FTA® card technology with multiplex PCR. Front. Vet. Sci. 2021, 8, 728660. [Google Scholar] [CrossRef]
- Wollants, E.; Maes, P.; Thoelen, I.; Vanneste, F.; Rahman, M.; Van Ranst, M. Evaluation of a norovirus sampling method using sodium dodecyl sulfate/EDTA-pretreated chromatography paper strips. J. Virol. Methods 2004, 122, 45–48. [Google Scholar] [CrossRef] [PubMed]
- Guthrie, R.; Susi, A. A simple phenylalanine method for detecting phenylketonuria in large populations of newborn infants. Pediatrics 1963, 32, 338–343. [Google Scholar] [CrossRef]
- Wolff, H.L. The filter paper method for shipping blood samples for serological examination. Am. J. Clin. Pathol. 1958, 30, 306–308. [Google Scholar]
- Bevins, S.; Pappert, R.; Young, J.; Schmit, B.; Kohler, D.; Baeten, L. Effect of storage time and storage conditions on antibody detection in blood samples collected on filter paper. J. Wildl. Dis. 2016, 52, 478–483. [Google Scholar] [CrossRef] [PubMed]
- Inoue, R.; Tsukahara, T.; Sunaba, C.; Itoh, M.; Ushida, K. Simple and rapid detection of the porcine reproductive and respiratory syndrome virus from pig whole blood using filter paper. J. Virol. Methods 2007, 141, 102–106. [Google Scholar] [CrossRef]
- Masciotra, S.; Khamadi, S.; Bilé, E.; Puren, A.; Fonjungo, P.; Nguyen, S.; Girma, M.; Downing, R.; Ramos, A.; Subbarao, S.; et al. Evaluation of blood collection filter papers for HIV-1 DNA PCR. J. Clin. Virol. 2012, 55, 101–106. [Google Scholar] [CrossRef]
- Winn, C.B.; Rogers, R.N.; Keenan, R.A.; Gerwin, P.M.; Matthews, K.A.; Ramirez, J.A.; Bennett, T.E.; Perkins, C.L.; Henderson, K.S. Using filter media and soiled bedding in disposable individually ventilated cages as a refinement to specific pathogen-free mouse health monitoring programs. J. Am. Assoc. Lab. Anim. Sci. 2022, 61, 361–369. [Google Scholar] [CrossRef]
- Tang, R.; Li, M.; Yan, X.; Xie, M.; Liu, L.N.; Li, Z.; Xu, F. Comparison of paper-based nucleic acid extraction materials for point-of-care testing applications. Cellulose 2022, 29, 2479–2495. [Google Scholar] [CrossRef]
- Zou, Y.; Mason, M.G.; Wang, Y.; Wee, E.; Turni, C.; Blackall, P.J.; Trau, M.; Botella, J.R. Nucleic acid purification from plants, animals, and microbes under 30 seconds. PLoS Biol. 2017, 15, e2003916. [Google Scholar] [CrossRef]
- Wolfgramm, E.D.V.; Carvalho, F.M.; Aguiar, R.C.A.; Sartori, M.P.D.N.; Hirschfeld-Campolongo, G.C.R.; Tsutsumida, W.T.; Louro, L.D. Simplified buccal DNA extraction with FTA Elute Cards. Forensic Sci. Int. Genet. 2009, 3, 125–127. [Google Scholar] [CrossRef] [PubMed]
- Armenta-Leyva, B.; Munguía-Ramírez, B.; Kuennen, B.; Giménez-Lirola, L.G.; Zimmerman, J.J. Comparative detection rates of viral PCR targets across filter paper types: A rapid review and meta-analysis. OSF 2025. [Google Scholar] [CrossRef]
- Sayers, E.W.; Beck, J.; Bolton, E.E.; Brister, J.R.; Chan, J.; Comeau, D.C.; Connor, R.; DiCuccio, M.; Farrell, C.M.; Feldgarden, M.; et al. Database resources of the National Center for Biotechnology Information. Nucleic Acids Res. 2024, 52, D33–D34. [Google Scholar] [CrossRef]
- Ouzzani, M.; Hammady, H.; Fedorowicz, Z.; Elmagarmid, A. Rayyan—A Web and Mobile App for Systematic Reviews. Syst. Rev. 2016, 5, 210. [Google Scholar] [CrossRef]
- Van der Mierden, S.; Tsaioun, K.; Bleich, A.; Leenaars, C.H. Software tools for literature screening in systematic reviews in biomedical research. Altex 2019, 36, 508–517. [Google Scholar] [CrossRef]
- Page, M.J.; McKenzie, J.E.; Bossuyt, P.M.; Boutron, I.; Hoffmann, T.C.; Mulrow, C.D.; Shamseer, L.; Tetzlaff, J.M.; Akl, E.A.; Brennan, S.E.; et al. The PRISMA 2020 statement: An updated guideline for reporting systematic reviews. BMJ 2021, 372, n71. [Google Scholar] [CrossRef]
- RStudio Team. RStudio: Integrated Development Environment for R; RStudio: Boston, MA, USA, 2020; Available online: http://www.rstudio.com (accessed on 18 April 2026).
- Viechtbauer, W. Conducting Meta-Analyses in R with the metafor Package. J. Stat. Softw. 2010, 36, 1–48. [Google Scholar] [CrossRef]
- Li, C.-C.; Seidel, K.D.; Coombs, R.W.; Frenkel, L.M. Detection and quantification of human immunodeficiency virus type 1 p24 antigen in dried whole blood and plasma on filter paper stored under various conditions. J. Clin. Microbiol. 2005, 43, 3901–3905. [Google Scholar] [CrossRef] [PubMed][Green Version]
- Stark, C.R.; Gustavsson, I.; Horal, P.; Kotopouli, M.; Gyllensten, U.; Hirsch, J.-M. Brush samples of oral lesions to FTA elute card for high-risk human papilloma virus diagnosis. Anticancer Res. 2021, 41, 269–277. [Google Scholar] [CrossRef]
- Keck, H.; Eschbaumer, M.; Beer, M.; Hoffmann, B. Comparison of biosafety and diagnostic utility of biosample collection cards. Viruses 2022, 14, 2392. [Google Scholar] [CrossRef] [PubMed]
- Spagnuolo-Weaver, M.; Walker, I.W.; McNeilly, F.; Calvert, V.; Graham, D.; Burns, K.; Adair, B.M.; Allan, G.M. The reverse transcription polymerase reaction for the diagnosis of porcine reproductive and respiratory syndrome: Comparison with virus isolation and serology. Vet. Microbiol. 1998, 62, 207–215. [Google Scholar] [CrossRef]
- Guzman, H.; Ding, X.; Xiao, S.-Y.; Tesh, R.B. Duration of infectivity and RNA of Venezuelan equine encephalitis, West Nile, and yellow fever viruses dried on filter paper and maintained at room temperature. Am. J. Trop. Med. Hyg. 2005, 72, 474–477. [Google Scholar] [CrossRef] [PubMed]
- Näslund, J.; Kerner, A.; Drobni, P.; Bucht, G.; Evander, M.; Ahlm, C. Detection of Puumala and Rift Valley Fever virus by quantitative RT-PCR and virus viability tests in samples of blood dried and stored on filter paper. J. Virol. Methods 2011, 178, 186–190. [Google Scholar] [CrossRef]
- El Daous, H.; Mitoma, S.; Elhanafy, E.; Thi Nguyen, H.; Thi Mai, N.; Hara, A.; Duangtathip, K.; Takezaki, Y.; Kaneko, C.; Norimine, J.; et al. Establishment of a novel diagnostic test for bovine leukaemia virus infection using direct filter PCR. Transbound. Emerg. Dis. 2020, 67, 1671–1676. [Google Scholar] [CrossRef]
- Pascoe, E.L.; de Vries, A.; Esser, H.J.; Koenraadt, C.J.M.; Sprong, H. Detection of tick-borne encephalitis virus in ear tissue and dried blood spots from naturally infected wild rodents. Parasit. Vectors 2023, 16, 103. [Google Scholar] [CrossRef]
- Prado, I.; Rosario, D.; Bernardo, L.; Alvarez, M.; Rodríguez, R.; Vázquez, S.; Guzmán, M.G. PCR detection of dengue virus using dried whole blood spotted on filter paper. J. Virol. Methods 2005, 125, 75–81. [Google Scholar] [CrossRef]
- Jennings-Gaines, J.E.; Luukkonen, K.L.; Robbins, K.M.; Edwards, W.H.; Vogt, N.A.; Vogt, A.A.; Allen, S.E. Utilizing blood filter paper and ear punch samples for the detection of rabbit hemorrhagic disease virus 2 by RT-rtPCR. J. Vet. Diagn. Investig. 2022, 34, 835–841. [Google Scholar] [CrossRef]
- Kiyaga, C.; Makoha, C.; Nkugwa, I.; Okiira, C.; Okwir, R.; Gebreab, S.Z.; Suarez, P.R.V.; Labrot, B.; Durán, A.C. The plasma separation card as a novel solution for enhancing central laboratory capability for HIV-1 viral load monitoring in limited-access settings. PLoS Glob. Public Health 2023, 3, e0002099. [Google Scholar] [CrossRef] [PubMed]
- Elnagar, A.; Harder, T.C.; Blome, S.; Beer, M.; Hoffmann, B. Optimizing release of nucleic acids of African swine fever virus and influenza A virus from FTA cards. Int. J. Mol. Sci. 2021, 22, 12915. [Google Scholar] [CrossRef]
- Mailhiot, D.; Ostdiek, A.M.; Luchins, K.R.; Bowers, C.J.; Theriault, B.R.; Langan, G.P. Comparing mouse health monitoring between soiled-bedding sentinel and exhaust air dust surveillance programs. J. Am. Assoc. Lab. Anim. Sci. 2020, 59, 58–66. [Google Scholar] [CrossRef]
- O’Connell, K.A.; Tigyi, G.J.; Livingston, R.S.; Johnson, D.L.; Hamilton, D.J. Evaluation of in-cage filter paper as a replacement for sentinel mice in the detection of murine pathogens. J. Am. Assoc. Lab. Anim. Sci. 2021, 60, 160–167. [Google Scholar] [CrossRef]
- Tam, K.I.; Esona, M.D.; Williams, A.; Ndze, V.N.; Boula, A.; Bowen, M.D. Evaluation of BB™ Sensi-Discs™ and FTA® cards as sampling devices for detection of rotavirus in stool samples. J. Virol. Methods 2015, 222, 41–46. [Google Scholar] [CrossRef][Green Version]
- Frati, E.R.; Martinelli, M.; Fasoli, E.; Colzani, D.; Bianchi, S.; Binda, S.; Olivani, P.; Tanzi, E. HPV testing from dried urine spots as a tool for cervical cancer screening in low-income countries. Biomed. Res. Int. 2015, 2015, 283036. [Google Scholar] [CrossRef]
- Abdelwhab, E.M.; Lüschow, D.; Harder, T.C.; Hafez, H.M. The use of FTA® filter papers for diagnosis of avian influenza virus. J. Virol. Methods. 2011, 174, 120–122. [Google Scholar] [CrossRef]
- Awad, F.; Baylis, M.; Jones, R.C.; Ganapathy, K. Evaluation of Flinders Technology Associates cards for storage and molecular detection of avian metapneumoviruses. Avian Pathol. 2014, 43, 125–129. [Google Scholar] [CrossRef] [PubMed][Green Version]
- Cortes, A.L.; Montiel, E.R.; Gimeno, I.M. Validation of Marek’s disease diagnosis and monitoring of Marek’s disease vaccines from samples collected in FTA® cards. Avian Dis. 2009, 53, 510–516. [Google Scholar] [CrossRef] [PubMed]
- da Silva, L.M.I.; Krokovsky, L.; Matos, R.C.; Wallau, G.L.; Paiva, M.H.S. Development of a new trapping system with potential implementation as a tool for mosquito-borne arbovirus surveillance. Insects 2025, 16, 637. [Google Scholar] [CrossRef]
- Desbois, D.; Roque-Afonso, A.-M.; Lebraud, P.; Dussaix, E. Use of dried serum spots for serological and molecular detection of hepatitis A virus. J. Clin. Microbiol. 2009, 47, 1536–1542. [Google Scholar] [CrossRef]
- Fan, J.; Gerber, P.F.; Cubas Atienzar, A.; Eppink, L.; Wang, C.; Opriessnig, T. Porcine reproductive and respiratory syndrome virus RNA detection in different matrices under typical storage conditions in the UK. Vet. Rec. 2019, 185, 21. [Google Scholar] [CrossRef]
- Hall-Mendelin, S.; Ritchie, S.A.; Johansen, C.A.; Zborowski, P.; Cortis, G.; Dandridge, S.; Hall, R.A.; van den Hurk, A.F. Exploiting mosquito sugar feeding to detect mosquito-borne pathogens. Proc. Natl. Acad. Sci. USA 2010, 107, 11255. [Google Scholar] [CrossRef]
- Hall-Mendelin, S.; Hewitson, G.R.; Genge, D.; Burtonclay, P.J.; De Jong, A.J.; Pyke, A.T.; van den Hurk, A.F. FTA cards facilitate storage, shipment, and detection of arboviruses in infected aedes aegypti collected in adult mosquito traps. Am. J. Trop. Med. Hyg. 2017, 96, 1241–1243. [Google Scholar] [CrossRef]
- Keeler, S.P.; Ferro, P.J.; Brown, J.D.; Fang, X.; El-Attrache, J.; Poulson, R.; Jackwood, M.W.; Stallknecht, D.E. Use of FTA® sampling cards for molecular detection of avian influenza virus in wild birds. Avian Dis. 2012, 56, 200–207. [Google Scholar] [CrossRef]
- Lian, X.-Y.; Wang, X.-H.; Li, C.; Zhang, Q.-L.; Lu, R.-X.; Gou, Z.-Y.; Xu, H.; Wang, M.-F.; Jia, P.; Yang, B. Evaluation of the flinders technology associates cards for storage and molecular detection of Infectious hypodermal and hematopoietic necrosis virus (IHHNV) DNA. J. Virol. Methods 2025, 338, 115209. [Google Scholar] [CrossRef]
- Linhares, D.C.L.; Rovira, A.; Torremorell, M. Evaluation of flinders technology associates cards for collection and transport of samples for detection of porcine reproductive and respiratory syndrome virus by reverse transcription polymerase chain reaction. J. Vet. Diagn. Investig. 2012, 24, 328–332. [Google Scholar] [CrossRef]
- Madhanmohan, M.; Nagendrakumar, S.B.; Manikumar, K.; Yuvaraj, S.; Parida, S.; Srinivasan, V.A. Development and evaluation of a real-time reverse transcription-loop-mediated isothermal amplification assay for rapid serotyping of foot-and-mouth disease virus. J. Virol. Methods 2013, 187, 195–202. [Google Scholar] [CrossRef]
- Moscoso, H.; Raybon, E.O.; Thayer, S.G.; Hofacre, C.L. Molecular detection and serotyping of infectious bronchitis virus from FTA® filter paper. Avian Dis. 2005, 49, 24–29. [Google Scholar] [CrossRef]
- Moscoso, H.; Alvarado, I.; Hofacre, C.L. Molecular analysis of infectious bursal disease virus from bursal tissues collected on FTA® filter paper. Avian Dis. 2006, 50, 391–396. [Google Scholar] [CrossRef] [PubMed]
- Narayanan, M.S.; Parthiban, M.; Sathiya, P.; Kumanan, K. Molecular detection of Newcastle disease virus using flinders tehnology associates-PCR. Vet. Arh. 2010, 80, 51–60. [Google Scholar]
- Perozo, F.; Villegas, P.; Estevez, C.; Alvarado, I.; Purvis, L.B. Use of FTA® filter paper for the molecular detection of Newcastle disease virus. Avian Pathol. 2006, 35, 93–98. [Google Scholar] [CrossRef] [PubMed]
- Picard-Meyer, E.; Barrat, J.; Cliquet, F. Use of filter paper (FTA®) technology for sampling, recovery and molecular characterisation of rabies viruses. J. Virol. Methods 2007, 140, 174–182. [Google Scholar] [CrossRef]
- Purvis, L.B.; Villegas, P.; Perozo, F. Evaluation of FTA paper and phenol for storage, extraction and molecular characterization of infectious bursal disease virus. J. Virol. Methods 2006, 138, 66–69. [Google Scholar] [CrossRef] [PubMed]
- Ramírez, A.L.; Hall-Mendelin, S.; Hewitson, G.R.; McMahon, J.L.; Staunton, K.M.; Ritchie, S.A.; van den Hurk, A.F. Stability of West Nile Virus (Flaviviridae: Flavivirus) RNA in mosquito excreta. J. Med. Entomol. 2019, 56, 1135–1138. [Google Scholar] [CrossRef]
- Sarangi, L.N.; Naveena, T.; Rana, S.K.; Surendra, K.S.N.L.; Reddy, R.V.C.; Bajibabu, P.; Ponnanna, N.M.; Sharma, G.K.; Srinivasan, V.A. Evaluation of a specialized filter-paper matrix for transportation of extended bovine semen to screen for bovine herpesvirus-1 by real-time PCR. J. Virol. Methods 2018, 257, 1–6. [Google Scholar] [CrossRef]
- Valente, A.; Jiolle, D.; Ravel, S.; Porciani, A.; Vial, L.; Michaud, V.; Kwiatek, O.; Pedarrieu, A.; Misse, D.; Ferraris, P.; et al. Flying syringes for emerging enzootic virus screening: Proof of concept for the development of noninvasive xenosurveillance tools based on Tsetse flies. Transbound. Emerg. Dis. 2023, 2023, 9145289. [Google Scholar] [CrossRef] [PubMed]
- Catarino, R.; Vassilakos, P.; Bilancioni, A.; Vanden, E.M.; Meyer-Hamme, U.; Menoud, P.-A.; Guerry, F.; Petignat, P. Randomized comparison of two vaginal self-sampling methods for human papillomavirus detection: Dry swab versus FTA cartridge. PLoS ONE 2015, 10, e0143644. [Google Scholar] [CrossRef]
- Geraets, D.T.; van Baars, R.; Alonso, I.; Ordi, J.; Torné, A.; Melchers, W.J.G.; Meijer, C.J.L.M.; Quint, W.G.V. Clinical evaluation of high-risk HPV detection on self-samples using the indicating FTA-elute solid-carrier cartridge. J. Clin. Virol. 2013, 57, 125–129. [Google Scholar] [CrossRef]
- Gustavsson, I.; Sanner, K.; Lindell, M.; Strand, A.; Olovsson, M.; Wikström, I.; Wilander, E.; Gyllensten, U. Type-specific detection of high-risk human papillomavirus (HPV) in self-sampled cervicovaginal cells applied to FTA elute cartridge. J. Clin. Virol. 2011, 51, 251–254. [Google Scholar] [CrossRef]
- Arca-Lafuente, S.; Casanueva-Benítez, C.; Crespo-Bermejo, C.; Lara-Aguilar, V.; Martín-Carbonero, L.; de Los Santos, I.; Madrid, R.; Briz, V. 903 Protein Saver cards: The best alternative for dried blood spot storage at room temperature for HCV RNA. Sci. Rep. 2022, 12, 10124. [Google Scholar] [CrossRef]
- Cappelari, B.E.; Godinho, F.M.S.; da Silva, A.G.; Belaguarda, A.A.; Balz, K.; da Rosa, J.C.A.; Ferreira, J.C.; Bertagnolli, A.C.; Roehe, P.M.; Batista, H.B.C.R.; et al. Laboratory validation of confirmatory tests for rabies diagnosis: Approaches to reduce animal use and facilitate sample collection. Transbound. Emerg. Dis. 2022, 69, 3449–3456. [Google Scholar] [CrossRef]
- Fynmore, N.; Lühken, R.; Maisch, H.; Risch, T.; Merz, S.; Kliemke, K.; Ziegler, U.; Schmidt-Chanasit, J.; Becker, N. Rapid assessment of West Nile virus circulation in a German zoo based on honey-baited FTA cards in combination with box gravid traps. Parasites Vectors 2021, 14, 449. [Google Scholar] [CrossRef]
- Jóźwiak, M.; Wyrostek, K.; Domanska-Blicharz, K.; Olszewska-Tomczyk, M.; Smietanka, K.; Minta, Z. Application of FTA® cards for detection and storage of avian influenza virus. J. Vet. Res. 2016, 60, 1–6. [Google Scholar] [CrossRef][Green Version]
- Kanta, P.; Chhikara, K.; Mohan, L.; Ghosh, A.; Goyal, K.; Singh, M.P. Alternate approach in storing and shipment of SARS-CoV-2 RNA samples with the use of FTA cards. Curr. Microbiol. 2022, 79, 396. [Google Scholar] [CrossRef]
- Madhanmohan, M.; Yuvaraj, S.; Manikumar, K.; Kumar, R.; Nagendrakumar, S.B.; Rana, S.K.; Srinivasan, V.A. Evaluation of the flinders technology associates cards for storage and temperature challenges in field conditions for foot-and-mouth disease virus surveillance. Transbound. Emerg. Dis. 2016, 63, 675–680. [Google Scholar] [CrossRef]
- Melanson, V.R.; Jochim, R.; Yarnell, M.; Ferlez, K.B.; Shashikumar, S.; Richardson, J.H. Improving vector-borne pathogen surveillance: A laboratory-based study exploring the potential to detect dengue virus and malaria parasites in mosquito saliva. J. Vector Borne Dis. 2017, 54, 301–310. [Google Scholar] [CrossRef]
- Muthukrishnan, M.; Singanallur, N.B.; Ralla, K.; Villuppanoor, S.A. Evaluation of FTA cards as a laboratory and field sampling device for the detection of foot-and-mouth disease virus and serotyping by RT-PCR and real-time RT-PCR. J. Virol. Methods 2008, 151, 311–316. [Google Scholar] [CrossRef]
- Navaneeth, K.A.; Bhuvaneswari, T.; Ezhil Praveena, P.; Jithendran, K.P. Paper-based archiving of biological samples from fish for detecting betanodavirus. Arch. Virol. 2016, 161, 2019–2024. [Google Scholar] [CrossRef]
- Portilho, M.M.; Mendonça, A.; Marques, V.A.; Nabuco, L.C.; Villela-Nogueira, C.A.; Ivantes, C.; Lewis-Ximenez, L.L.; Lampe, E.; Villar, L.M. Comparison of oral fluid collection methods for the molecular detection of hepatitis B virus. Oral. Dis. 2017, 23, 1072–1079. [Google Scholar] [CrossRef]
- Rattanamas, K.; Taesuji, M.; Kulthonggate, U.; Jantafong, T.; Mamom, T.; Ruenphet, S. Sensitivity of RNA viral nucleic acid-based detection of avian influenza virus, Newcastle disease virus, and African horse sickness virus on flinders technology associates card using conventional reverse-transcription polymerase chain reaction. Vet. World 2022, 15, 2754–2759. [Google Scholar] [CrossRef]
- Sakamoto, K.; Yanagisawa, R.; Shigeto, S.; Nakazawa, Y. Detection of Epstein-Barr virus genome copies by polymerase chain reaction using dried blood spot samples. Clin. Chim. Acta. 2026, 580, 120701. [Google Scholar] [CrossRef]
- Si, H.; Tucciarone, C.M.; Cecchinato, M.; Legnardi, M.; Mazzariol, S.; Centelleghe, C. Comparison between sampling techniques for virological molecular analyses: Dolphin morbillivirus and herpesvirus detection from FTA® card and frozen tissue. Viruses 2023, 15, 2422. [Google Scholar] [CrossRef]
- Uttenthal, Å.; Braae, U.C.; Ngowi, H.A.; Rasmussen, T.B.; Nielsen, J.; Johansen, M.V. ASFV in Tanzania: Asymptomatic pigs harbor virus of molecular similarity to Georgia 2007. Vet. Microbiol. 2013, 165, 173–176. [Google Scholar] [CrossRef]
- Limaye, A.P.; Santo Hayes, T.K.; Huang, M.-L.; Magaret, A.; Boeckh, M.; Jerome, K.R. Quantitation of cytomegalovirus DNA load in dried blood spots correlates well with plasma viral load. J. Clin. Microbiol. 2013, 51, 2360–2364. [Google Scholar] [CrossRef]
- de Gasperis, M.R.; Caione, M.D.; Concato, C.; Fiscarelli, E.; Di Pietro, N.; Salotti, V.; Putignani, L.; Menichella, D.; Callea, F. Quantitative recovery of proviral HIV-1 DNA from leukocytes by the dried buffy coat spot method for real-time PCR determination. J. Virol. Methods. 2010, 170, 121–127. [Google Scholar] [CrossRef]
- Gustavsson, I.; Lindell, M.; Wilander, E.; Strand, A.; Gyllensten, U. Use of FTA card for dry collection, transportation and storage of cervical cell specimen to detect high-risk HPV. J. Clin. Virol. 2009, 46, 112–116. [Google Scholar] [CrossRef]
- Bankamp, B.; Sein, C.; Simbu, E.P.; Anderson, R.; Abernathy, E.; Chen, M.-H.; Tamfum, J.-J.M.; Wannemuehler, K.A.; Waku-Kouomou, D.; Lopareva, E.N.; et al. Use of FTA cards to transport throat swabs and oral fluid samples for molecular detection and genotyping of measles and rubella viruses. J. Clin. Microbiol. 2019, 57, e00048-19. [Google Scholar] [CrossRef]
- Liang, X.; Chigerwe, M.; Hietala, S.K.; Crossley, B.M. Evaluation of fast technology analysis (FTA) cards as an improved method for specimen collection and shipment targeting viruses associated with bovine respiratory disease complex. J. Virol. Methods. 2014, 202, 69–72. [Google Scholar] [CrossRef]
- Moscoso, H.; Bruzual, J.J.; Sellers, H.; Hofacre, C.L. FTA® liver impressions as DNA template for detecting and genotyping fowl adenovirus. Avian Dis. 2007, 51, 118–121. [Google Scholar] [CrossRef]
- Foss, L.; Reisen, W.K.; Fang, Y.; Kramer, V.; Padgett, K. Evaluation of nucleic acid preservation cards for West Nile virus testing in dead birds. PLoS ONE 2016, 11, e0157555. [Google Scholar] [CrossRef][Green Version]
- Curren, E.J.; Tufa, A.J.; Hancock, W.T.; Biggerstaff, B.J.; Vaifanua-Leo, J.S.; Montalbo, C.A.; Sharp, T.M.; Fischer, M.; Hills, S.L.; Gould, C.V. Reverse transcription-polymerase chain reaction resting on filter paper-dried serum for laboratory-based dengue surveillance-american samoa, 2018. Am. J. Trop. Med. Hyg. 2020, 102, 622–624. [Google Scholar] [CrossRef]
- Schotte, U.; Hoffmann, T.; Schwarz, N.G.; Rojak, S.; Lusingu, J.; Minja, D.; Kaseka, J.; Mbwana, J.; Gesase, S.; May, J.; et al. Study of enteric pathogens among children in the tropics and effects of prolonged storage of stool samples. Lett. Appl. Microbiol. 2021, 72, 774–782. [Google Scholar] [CrossRef]
- Ko, K.; Lokteva, L.M.; Akuffo, G.A.; Phyo, Z.; Chhoung, C.; Bunthen, E.; Ouoba, S.; Sugiyama, A.; Akita, T.; Rattana, K.; et al. A comparative study of extraction free detection of HBV DNA using sodium dodecyl sulfate, N-lauroylsarcosine sodium salt, and sodium dodecyl benzene sulfonate. Sci. Rep. 2024, 14, 25442. [Google Scholar] [CrossRef]
- Samsonova, J.V.; Chadina, A.S.; Osipov, A.P.; Kondakov, S.E.; Makarova, T.E.; Komarov, A.B. Detection of bovine leukemia virus by the polymerase chain reaction in dried blood spots using a membrane system of a new format. Mosc. Univ. Chem. Bull. 2014, 69, 282–285. [Google Scholar] [CrossRef]
- Dos Santos Carneiro, M.; Volpato, F.C.Z.; Wink, P.L.; Pereira, D.C.; Giordani, L.; Barth, A.L. Evaluation of filter paper to transport oro/nasopharyngeal samples to detect SARS-CoV-2 by RT-qPCR. J. Virol. Methods. 2022, 308, 114587. [Google Scholar] [CrossRef]
- Mahajan, S.; Choudhary, M.C.; Kumar, G.; Gupta, E. Evaluation of dried blood spot as an alternative sample collection method for hepatitis C virus RNA quantitation and genotyping using a commercial system. Virusdisease 2018, 29, 141–146. [Google Scholar] [CrossRef]
- Eichner, M.; Smith, J.M. Assessing methods for replacement of soiled bedding sentinels in cage-level exhaust IVC racks. J. Am. Assoc. Lab. Anim. Sci. 2023, 62, 409–415. [Google Scholar] [CrossRef]
- Hanson, W.H.; Taylor, K.; Taylor, D.K. PCR testing of media placed in soiled bedding as a method for mouse colony health surveillance. J. Am. Assoc. Lab. Anim. Sci. 2021, 60, 306–310. [Google Scholar] [CrossRef]
- Jacob, S.M.; Anitha, D.; Vishwanath, R.; Parameshwari, S.; Samuel, N.M. The use of dried blood spots on filter paper for the diagnosis of HIV-1 in infants born to HIV seropositive women. Indian J. Med. Microbiol. 2008, 26, 71–74. [Google Scholar] [CrossRef]
- Mérens, A.; Guérin, P.J.; Guthmann, J.-P.; Nicand, E. Outbreak of hepatitis E virus infection in Darfur, Sudan: Effectiveness of real-time reverse transcription-PCR analysis of dried blood spots. J. Clin. Microbiol. 2009, 47, 1931–1933. [Google Scholar] [CrossRef]
- Uttayamakul, S.; Likanonsakul, S.; Sunthornkachit, R.; Kuntiranont, K.; Louisirirotchanakul, S.; Chaovavanich, A.; Thiamchai, V.; Tanprasertsuk, S.; Sutthent, R. Usage of dried blood spots for molecular diagnosis and monitoring HIV-1 infection. J. Virol. Methods 2005, 128, 128–134. [Google Scholar] [CrossRef] [PubMed]
- Azeem, S.; Gauger, P.; Sato, Y.; Baoqing, G.; Wolc, A.; Carlson, J.; Harmon, K.; Zhang, J.; Hoang, H.; Yuan, J.; et al. Environmental sampling for avian influenza virus detection in commercial layer facilities. Avian Dis. 2021, 65, 391–400. [Google Scholar] [CrossRef] [PubMed]
- Smartt, C.T.; Shin, D.; Kang, S.; Tabachnick, W.J. Culex quinquefasciatus (Diptera: Culicidae) from Florida transmitted Zika virus. Front. Microbiol. 2018, 9, 768. [Google Scholar] [CrossRef]
- Andriamandimby, S.F.; Heraud, J.-M.; Randrianasolo, L.; Rafisandratantsoa, J.T.; Andriamamonjy, S.; Richard, V. Dried-blood spots: A cost-effective field method for the detection of Chikungunya virus circulation in remote areas. PLoS Negl. Trop. Dis. 2013, 7, e2339. [Google Scholar] [CrossRef] [PubMed]
- Banura, C.; Franceschi, S.; van Doorn, L.-J.; Wabwire-Mangen, F.; Mbidde, E.K.; Weiderpass, E. Detection of cervical human papillomavirus infection in filter paper samples: A comparative study. J. Med. Microbiol. 2008, 57, 253–255. [Google Scholar] [CrossRef]
- Bhuiyan, A.R.; Chowdhury, E.H.; Kwiatek, O.; Parvin, R.; Rahman, M.M.; Islam, M.R.; Albina, E.; Libeau, G. Dried fluid spots for peste des petits ruminants virus load evaluation allowing for non-invasive diagnosis and genotyping. BMC Vet. Res. 2014, 10, 247. [Google Scholar] [CrossRef] [PubMed][Green Version]
- Cromeans, T.; Jothikumar, N.; Lee, J.; Collins, N.; Burns, C.C.; Hill, V.R.; Vinjé, J. A new solid matrix for preservation of viral nucleic acid from clinical specimens at ambient temperature. J. Virol. Methods. 2019, 274, 113732. [Google Scholar] [CrossRef]
- Gupta, B.P.; Jayasuryan, N.; Jameel, S. Direct detection of hepatitis B virus from dried blood spots by polymerase chain reaction amplification. J. Clin. Microbiol. 1992, 30, 1913–1916. [Google Scholar] [CrossRef]
- Leruez-Ville, M.; Ngin, S.; Guilleminot, T.; Kfutwah, A.; Moussa, S.; Tran, T.; Nerrienet, E. Detection of cytomegalovirus DNA on dried blood spots collected from infants infected with HIV: An in-house method adaptable in resource-limited settings. J. Virol. Methods 2013, 193, 503–507. [Google Scholar] [CrossRef]
- Matheus, S.; Huc, P.; Labeau, B.; Bremand, L.; Enfissi, A.; Merle, O.; Flusin, O.; Rousset, D.; Leparc-Goffart, I. The use of serum spotted onto filter paper for diagnosing and monitoring Chikungunya virus infection. J. Clin. Virol. 2015, 71, 89–92. [Google Scholar] [CrossRef] [PubMed]
- Michaud, V.; Gil, P.; Kwiatek, O.; Prome, S.; Dixon, L.; Romero, L.; Le Potier, M.-F.; Arias, M.; Couacy-Hymann, E.; Roger, F.; et al. Long-term storage at tropical temperature of dried-blood filter papers for detection and genotyping of RNA and DNA viruses by direct PCR. J. Virol. Methods 2007, 146, 257–265. [Google Scholar] [CrossRef]
- Randriamparany, T.; Kouakou, K.V.; Michaud, V.; Fernández-Pinero, J.; Gallardo, C.; Le Potier, M.-F.; Rabenarivahiny, R.; Couacy-Hymann, E.; Raherimandimby, M.; Albina, E. African swine fever diagnosis adapted to tropical conditions by the use of dried-blood filter papers. Transbound. Emerg. Dis. 2016, 63, 379–388. [Google Scholar] [CrossRef]
- Shukla, S.; Bharti, A.C.; Mahata, S.; Hussain, S.; Hedau, S.; Sharma, R.; Pillai, M.R.; Krishna, S.; Chiplunkar, S.; Tongaonkar, H.; et al. Application of a multiplex PCR to cervical cells collected by a paper smear for the simultaneous detection of all mucosal human papillomaviruses (HPVs) and typing of high-risk HPV types 16 and 18. J. Med. Microbiol. 2010, 59, 1303–1310. [Google Scholar] [CrossRef][Green Version]
- Sibounheuang, B.; Boutthasavong, L.; Chommanam, D.; Phommasone, K.; Panapruksachat, S.; Praphasiri, V.; Bouttavong, S.; Sisavath, H.; Christy, N.C.V.; Letizia, A.G.; et al. Dry swabs and dried saliva as alternative samples for SARS-CoV-2 detection in remote areas in Lao PDR. Open Forum Infect. Dis. 2024, 11, ofae433. [Google Scholar] [CrossRef]
- Álvarez, I.; Guerrero, A.; González, L.F.; Osorio, J.R.; Ferrer, E.; Pérez, G.C.; García, D.C. Molecular diagnosis of dengue virus infections in samples collected on filter paper. Bol. Malariol. Salud Ambient. 2016, 56, 229. [Google Scholar]
- Amellal, B.; Katlama, C.; Calvez, V. Evaluation of the use of dried spots and of different storage conditions of plasma for HIV-1 RNA quantification. HIV Med. 2007, 8, 396–400. [Google Scholar] [CrossRef]
- Andreotti, M.; Pirillo, M.; Guidotti, G.; Ceffa, S.; Paturzo, G.; Germano, P.; Luhanga, R.; Chimwaza, D.; Mancini, M.G.; Marazzi, M.C.; et al. Correlation between HIV-1 viral load quantification in plasma, dried blood spots, and dried plasma spots using the Roche COBAS Taqman assay. J. Clin. Virol. 2010, 47, 4–7. [Google Scholar] [CrossRef]
- Atama, N.C.; Chestakova, I.V.; de Bruin, E.; van den Berg, T.J.; Munger, E.; Reusken, C.; Oude Munnink, B.B.; van der Jeugd, H.; van den Brand, J.M.A.; Koopmans, M.P.G.; et al. Evaluation of the use of alternative sample types for mosquito-borne flavivirus surveillance: Using Usutu virus as a model. One Health 2022, 15, 100456. [Google Scholar] [CrossRef] [PubMed]
- Atkinson, C.; Emery, V.C.; Griffiths, P.D. Development of a novel single tube nested PCR for enhanced detection of cytomegalovirus DNA from dried blood spots. J. Virol. Methods 2014, 196, 40–44. [Google Scholar] [CrossRef] [PubMed]
- Bennett, S.; Gunson, R.N.; McAllister, G.E.; Hutchinson, S.J.; Goldberg, D.J.; Cameron, S.O.; Carman, W.F. Detection of hepatitis C virus RNA in dried blood spots. J. Clin. Virol. 2012, 54, 106–109. [Google Scholar] [CrossRef]
- Bezerra, C.S.; Portilho, M.M.; Barbosa, J.R.; de Azevedo, C.P.; Mendonça, A.C.D.; da Cruz, J.N.M.; Frota, C.C.; do Lago, B.V.; Villar, L.M. Dried blood spot sampling for hepatitis B virus quantification, sequencing and mutation detection. Sci. Rep. 2022, 12, 1651. [Google Scholar] [CrossRef]
- Boppana, S.B.; Ross, S.A.; Novak, Z.; Shimamura, M.; Tolan, R.W., Jr.; Palmer, A.L.; Ahmed, A.; Michaels, M.G.; Sánchez, P.J.; Bernstein, D.I.; et al. Dried blood spot real-time polymerase chain reaction assays to screen newborns for congenital cytomegalovirus infection. JAMA 2010, 303, 1375–1382. [Google Scholar] [CrossRef]
- Cardona-Ospina, J.A.; Stittleburg, V.; Millan-Benavidez, N.; Restrepo-Chica, J.; Key, A.; Rojas-Gallardo, D.M.; Piantadosi, A.; Collins, M.H.; Waggoner, J.J. Sensitive and stable molecular detection of dengue, chikungunya, and zika viruses from dried blood spots. Am. J. Trop. Med. Hyg. 2022, 107, 296–299. [Google Scholar] [CrossRef]
- Cassol, S.; Salas, T.; Arella, M.; Neumann, P.; Schechter, M.T.; O’Shaughnessy, M. Use of dried blood spot specimens in the detection of human immunodeficiency virus type 1 by the polymerase chain reaction. J. Clin. Microbiol. 1991, 29, 667–671. [Google Scholar] [CrossRef]
- Garg, R.; Ramachandran, K.; Jayashree, S.; Agarwal, R.; Gupta, E. Evaluation of blood samples collected by dried blood spots (DBS) method for hepatitis B virus DNA quantitation and its stability under real life conditions. J. Clin. Virol. Plus 2022, 2, 100111. [Google Scholar] [CrossRef]
- Huang, S.; Erickson, B.; Mak, W.B.; Salituro, J.; Abravaya, K. A novel realTime HIV-1 qualitative assay for the detection of HIV-1 nucleic acids in dried blood spots and plasma. J. Virol. Methods 2011, 178, 216. [Google Scholar] [CrossRef]
- Jardi, R.; Rodríguez-Frias, F.; Buti, M.; Schaper, M.; Valdes, A.; Martinez, M.; Esteban, R.; Guardia, J. Usefulness of dried samples for quantification and molecular characterization of HBV-DNA. Hepatology 2004, 40, 133–139. [Google Scholar] [CrossRef]
- Koontz, D.; Baecher, K.; Amin, M.; Nikolova, S.; Gallagher, M.; Dollard, S. Evaluation of DNA extraction methods for the detection of cytomegalovirus in dried blood spots. J. Clin. Virol. 2015, 66, 95–99. [Google Scholar] [CrossRef]
- Leelawiwat, W.; Young, N.L.; Chaowanachan, T.; Ou, C.Y.; Culnane, M.; Vanprapa, N.; Waranawat, N.; Wasinrapee, P.; Mock, P.A.; Tappero, J.; et al. Dried blood spots for the diagnosis and quantitation of HIV-1: Stability studies and evaluation of sensitivity and specificity for the diagnosis of infant HIV-1 infection in Thailand. J. Virol. Methods. 2009, 155, 109–117. [Google Scholar] [CrossRef]
- Ma, J.Q.; Xu, Q.Q.; He, L.; He, X.X.; Chen, K.; Wang, Y.H.; Xing, W.G.; Jiang, Y. Exploration of an efficient simultaneous molecular detection method of HIV, HCV, and syphilis from a single dried blood spot. Biomed. Environ. Sci. 2021, 34, 257–264. [Google Scholar]
- Makadzange, A.T.; Boyd, F.K.; Chimukangara, B.; Masimirembwa, C.; Katzenstein, D.; Ndhlovu, C.E. A simple phosphate-buffered-saline-based extraction method improves specificity of HIV viral load monitoring using dried blood spots. J. Clin. Microbiol. 2017, 55, 2172–2179. [Google Scholar] [CrossRef]
- Marques, B.L.C.; do Espírito-Santo, M.P.; Marques, V.A.; Miguel, J.C.; da Silva, E.F.; Villela-Nogueira, C.A.; Lewis-Ximenez, L.L.; Lampe, E.; Villar, L.M. Evaluation of dried blood spot samples for hepatitis C virus detection and quantification. J. Clin. Virol. 2016, 82, 139–144. [Google Scholar] [CrossRef]
- McNulty, A.; Jennings, C.; Bennett, D.; Fitzgibbon, J.; Bremer, J.W.; Ussery, M.; Kalish, M.L.; Heneine, W.; García-Lerma, J.G. Evaluation of dried blood spots for human immunodeficiency virus type 1 drug resistance testing. J. Clin. Microbiol. 2007, 45, 517–521. [Google Scholar] [CrossRef]
- Mejia, M.F.A.; Lin, S.H.; Shu, P.-Y.; Ping, Y.-H.; Ji, D.-D. One-step reverse transcription quantitative PCR assay for simultaneous detection of chikungunya, dengue and zika virus blood sample spotted on filter paper. Southeast Asian J. Trop. Med. Public Health 2020, 51, 886–895. [Google Scholar]
- Mercier-Delarue, S.; Vray, M.; Plantier, J.C.; Maillard, T.; Adjout, Z.; de Olivera, F.; Schnepf, N.; Maylin, S.; Simon, F.; Delaugerre, C. Higher specificity of nucleic acid sequence-based amplification isothermal technology than of real-time PCR for quantification of HIV-1 RNA on dried blood spots. J. Clin. Microbiol. 2014, 52, 52–56. [Google Scholar] [CrossRef][Green Version]
- Monleau, M.; Butel, C.; Delaporte, E.; Boillot, F.; Peeters, M. Effect of storage conditions of dried plasma and blood spots on HIV-1 RNA quantification and PCR amplification for drug resistance genotyping. J. Antimicrob. Chemother. 2010, 65, 1562–1566. [Google Scholar] [CrossRef]
- Nelson, J.A.E.; Hawkins, J.T.; Szhanz, M.; Mollan, K.; Miller, M.B.; Schmitz, J.L.; Fiscus, S.A. Comparison of the Gen-Probe apta HIV-1 and Abbott HIV-1 qualitative assays with the roche amplicor HIV-1 DNA assay for early infant diagnosis using dried blood spots. J. Clin. Virol. 2014, 60, 418–421. [Google Scholar] [CrossRef][Green Version]
- Nsojo, A.; Aboud, S.; Lyamuya, E. Comparative evaluation of Amplicor HIV-1 DNA test, version 1.5, by manual and automated DNA extraction methods using venous blood and dried blood spots for HIV-1 DNA PCR testing. Tanzan. J. Health Res. 2010, 12, 229–235. [Google Scholar]
- Nyambi, P.N.; Fransen, K.; De Beenhouwer, H.; Chomba, E.N.; Temmerman, M.; Ndinya-Achola, J.O.; Piot, P.; van der Groen, G. Detection of human immunodeficiency virus type 1 (HIV-1) in heel prick blood on filter paper from children born to HIV-1-seropositive mothers. J. Clin. Microbiol. 1994, 32, 2858–2860. [Google Scholar] [CrossRef]
- Ortonne, V.; Lucas, Q.; Garrigou, O.; Soulier, A.; Challine, D.; Pawlotsky, J.-M.; Leroy, V.; Chevaliez, S. Alinity m, a random-access system, for hepatitis B virus DNA quantification in plasma and whole blood collected on dried blood spots. mSphere 2022, 7, e0008222. [Google Scholar] [CrossRef]
- Ouma, K.N.; Basavaraju, S.V.; Okonji, J.A.; Williamson, J.; Thomas, T.K.; Mills, L.A.; Nkengasong, J.N.; Zeh, C. Evaluation of quantification of HIV-1 RNA viral load in plasma and dried blood spots by use of the semiautomated Cobas Amplicor assay and the fully automated Cobas Ampliprep/TaqMan assay, version 2.0, in Kisumu, Kenya. J. Clin. Microbiol. 2013, 51, 1208–1218. [Google Scholar] [CrossRef] [PubMed]
- Pasternak, Y.; Oikawa, M.T.; Mendelson, E.; Osovsky, M.; Klinger, G.; Bilavsky, E. Diagnosing congenital cytomegalovirus by saliva on Guthrie paper. J. Clin. Virol. 2020, 126, 104337. [Google Scholar] [CrossRef]
- Peng, M.; Li, H.-L.; Zhai, A.; Zhu, Q.-Y. Evaluation of dried blood spots for Epstein-Barr virus nucleic acid testing. J. Clin. Virol. 2024, 174, 105710. [Google Scholar] [CrossRef]
- Pirillo, M.F.; Recordon-Pinson, P.; Andreotti, M.; Mancini, M.G.; Amici, R.; Giuliano, M. Quantification of HIV-RNA from dried blood spots using the Siemens VERSANT® HIV-1 RNA (kPCR) assay. J. Antimicrob. Chemother. 2011, 66, 2823–2826. [Google Scholar] [CrossRef]
- Poiteau, L.; Wlassow, M.; Hézode, C.; Pawlotsky, J.M.; Chevaliez, S. Evaluation of the Xpert HBV Viral Load for hepatitis B virus molecular testing. J. Clin. Virol. 2020, 129, 104481. [Google Scholar] [CrossRef]
- Reigadas, S.; Schrive, M.H.; Aurillac-Lavignolle, V.; Fleury, H.J. Quantitation of HIV-1 RNA in dried blood and plasma spots. J. Virol. Methods 2009, 161, 177–180. [Google Scholar] [CrossRef]
- Ross, R.S.; Stambouli, O.; Grüner, N.; Marcus, U.; Cai, W.; Zhang, W.; Zimmermann, R.; Roggendorf, M. Detection of infections with hepatitis B virus, hepatitis C virus, and human immunodeficiency virus by analyses of dried blood spots--performance characteristics of the ARCHITECT system and two commercial assays for nucleic acid amplification. Virol. J. 2013, 10, 72. [Google Scholar] [CrossRef]
- Santos, C.; Reis, A.; Dos Santos, C.V.; Damas, C.; Silva, M.H.; Viana, M.V.; Ferraz, M.L.; Carnauba, D.; El-Far, F.; Serra, F.; et al. The use of real-time PCR to detect hepatitis C virus RNA in dried blood spots from Brazilian patients infected chronically. J. Virol. Methods. 2012, 179, 17–20. [Google Scholar] [CrossRef]
- Sheikhakbari, S.; Mokhtari-Azad, T.; Salimi, V.; Norouzbabaei, Z.; Abbasi, S.; Zahraei, S.M.; Shahmahmoodi, S. The use of oral fluid samples spotted on filter paper for the detection of measles virus using nested RT-PCR. J. Clin. Lab. Anal. 2012, 26, 215–222. [Google Scholar] [CrossRef]
- Shepherd, S.J.; Baxter, R.E.; Gunson, R.N. Evaluation of the Abbott m2000 system for dried blood spot detection of hepatitis C virus RNA. J. Clin. Virol. 2019, 110, 7–10. [Google Scholar] [CrossRef]
- Shimamura, M.; Kim, J.; Medoro, A.K.; Flint, K.; Kaptsan, I.; Wang, H.Y.; Pifer, T.; Harris, R.; Cuartas, J.; Leber, A.; et al. Agreement between dried blood spot and plasma PCR in infants with congenital cytomegalovirus infection. J. Med. Virol. 2025, 97, e70257. [Google Scholar] [CrossRef] [PubMed]
- Soetens, O.; Vauloup-Fellous, C.; Foulon, I.; Dubreuil, P.; De Saeger, B.; Grangeot-Keros, L.; Naessens, A. Evaluation of different cytomegalovirus (CMV) DNA PCR protocols for analysis of dried blood spots from consecutive cases of neonates with congenital CMV infections. J. Clin. Microbiol. 2008, 46, 943–946. [Google Scholar] [CrossRef] [PubMed]
- Stene-Johansen, K.; Yaqoob, N.; Overbo, J.; Aberra, H.; Desalegn, H.; Berhe, N.; Johannessen, A. Dry blood spots a reliable method for measurement of Hepatitis B viral load in resource-limited settings. PLoS ONE 2016, 11, e0166201. [Google Scholar] [CrossRef]
- Tejada-Strop, A.; Drobeniuc, J.; Mixson-Hayden, T.; Forbi, J.C.; Le, N.-T.; Li, L.; Mei, J.; Terrault, N.; Kamili, S. Disparate detection outcomes for anti-HCV IgG and HCV RNA in dried blood spots. J. Virol. Methods 2014, 212, 66–70. [Google Scholar] [CrossRef]
- Viljoen, J.; Gampini, S.; Danaviah, S.; Valéa, D.; Pillay, S.; Kania, D.; Méda, N.; Newell, M.-L.; Van de Perre, P.; Rouet, F.; et al. Dried blood spot HIV-1 RNA quantification using open real-time systems in South Africa and Burkina Faso. J. Acquir. Immune Defic. Syndr. 2010, 55, 290–298. [Google Scholar] [CrossRef]
- Vives-Oñós, I.; Codina-Grau, M.G.; Noguera-Julian, A.; Blázquez-Gamero, D.; Fortuny, C.; Baquero-Artigao, F.; Frick, M.A.; Saavedra-Lozano, J.; Goycochea-Valdivia, W.; Rives-Ferreiro, M.T.; et al. Is polymerase chain reaction in neonatal dried blood spots reliable for the diagnosis of congenital cytomegalovirus infection. Pediatr. Infect. Dis. J. 2019, 38, 520–524. [Google Scholar] [CrossRef]
- Vongsouvath, M.; Phommasone, K.; Sengvilaipaseuth, O.; Kosoltanapiwat, N.; Chantratita, N.; Blacksell, S.D.; Lee, S.J.; De-Lamballerie, X.; Mayxay, M.; Keomany, S.; et al. Using rapid diagnostic tests as a source of viral RNA for dengue serotyping by RT-PCR—A novel epidemiological tool. PLoS Negl. Trop. Dis. 2016, 10, e0004704. [Google Scholar] [CrossRef]
- Wacharapluesadee, S.; Phumesin, P.; Lumlertdaecha, B.; Hemachudha, T. Diagnosis of rabies by use of brain tissue dried on filter paper. Clin. Infect. Dis. 2003, 36, 674–675. [Google Scholar] [CrossRef]
- Whitney, J.B.; Luedemann, C.; Bao, S.; Miura, A.; Rao, S.S.; Mascola, J.R.; Letvin, N.L. Monitoring HIV vaccine trial participants for primary infection: Studies in the SIV/macaque model. AIDS 2009, 23, 1453–1460. [Google Scholar] [CrossRef][Green Version]
- Yourno, J.; Conroy, J. A novel polymerase chain reaction method for detection of human immunodeficiency virus in dried blood spots on filter paper. J. Clin. Microbiol. 1992, 30, 2887–2892. [Google Scholar] [CrossRef]
- Zeh, C.; Ndiege, K.; Inzaule, S.; Achieng, R.; Williamson, J.; Chih-Wei, C.J.; Ellenberger, D.; Nkengasong, J. Evaluation of the performance of Abbott m2000 and Roche COBAS Ampliprep/COBAS Taqman assays for HIV-1 viral load determination using dried blood spots and dried plasma spots in Kenya. PLoS ONE 2017, 12, e0179316. [Google Scholar] [CrossRef]
- Ledermann, J.P.; Burns, P.L.; Perinet, L.C.; Powers, A.M.; Byers, N.M. Improved mosquito housing and saliva collection method enhances safety while facilitating longitudinal assessment of individual mosquito vector competence for arboviruses. Vector-Borne Zoonotic Dis. 2024, 24, 55–63. [Google Scholar] [CrossRef]
- Abe, K.; Konomi, N. Hepatitis C virus RNA in dried serum spotted onto filter paper is stable at room temperature. J. Clin. Microbiol. 1998, 36, 3070–3072. [Google Scholar] [CrossRef] [PubMed]
- Ghosh, R.; Hazarika, N.K. Detection of anti-hepatitis C virus and hepatitis C virus RNA in dried blood spot specimens using Whatman No. 1 filter paper. Indian J. Med. Microbiol. 2018, 36, 230–235. [Google Scholar] [CrossRef] [PubMed]
- Vilcek, S.; Strojny, L.; Durkovic, B.; Rossmanith, W.; Paton, D. Storage of bovine viral diarrhoea virus samples on filter paper and detection of viral RNA by a RT-PCR method. J. Virol. Methods 2001, 92, 19–22. [Google Scholar] [CrossRef] [PubMed]
- Wang, C.-Y.J.; Giambrone, J.J.; Smith, B.F. Detection of duck hepatitis B virus DNA on filter paper by PCR and SYBR green dye-based quantitative PCR. J. Clin. Microbiol. 2002, 40, 2584–2590. [Google Scholar] [CrossRef][Green Version]
- Wambura, P.N. Impregnation and storage of Newcastle disease virus on to filter papers and detection of viral RNA by a single tube RT-PCR assay. Afr. J. Biotechnol. 2006, 5, 21–24. [Google Scholar]
- Rahman, M.; Goegebuer, T.; De Leener, K.; Maes, P.; Matthijnssens, J.; Podder, G.; Azim, T.; Van Ranst, M. Chromatography paper strip method for collection, transportation, and storage of rotavirus RNA in stool samples. J. Clin. Microbiol. 2004, 42, 1605–1608. [Google Scholar] [CrossRef]
- De Swart, R.L.; Nur, Y.; Abdallah, A.; Kruining, H.; El Mubarak, H.S.; Ibrahim, S.A.; Van Den Hoogen, B.; Groen, J.; Osterhaus, A.D. Combination of reverse transcriptase PCR analysis and immunoglobulin M detection on filter paper blood samples allows diagnostic and epidemiological studies of measles. J. Clin. Microbiol. 2001, 39, 270–273. [Google Scholar] [CrossRef][Green Version]
- Knuchel, M.C.; Jullu, B.; Shah, C.; Tomasik, Z.; Stoeckle, M.P.; Speck, R.F.; Nadal, D.; Mshinda, H.; Böni, J.; Tanner, M.; et al. Adaptation of the ultrasensitive HIV-1 p24 antigen assay to dried blood spot testing. J. Acquir. Immune Defic. Syndr. 2007, 44, 247–253. [Google Scholar] [CrossRef][Green Version]
- Guthrie, R. Blood screening for phenylketonuria. JAMA 1961, 178, 863. [Google Scholar] [CrossRef]
- Boyd, R.J.; Hansons, R.P. Survival of Newcastle disease virus in nature. Avian Dis. 1958, 2, 82–93. [Google Scholar] [CrossRef]
- Sadun, E.H.; Anderson, R.I.; Williams, J.S. Fluorescent antibody test for the laboratory diagnosis of schistosomiasis in humans by using dried blood smears on filter paper. Exp. Parasitol. 1961, 11, 117–120. [Google Scholar] [CrossRef]
- Pitcovski, J.; Shmueli, E.; Krispel, S.; Levi, N. Storage of viruses on filter paper for genetic analysis. J. Virol. Methods 1999, 83, 21–26. [Google Scholar] [CrossRef]
- Zhang, Y.; Zhang, H.; Ghosh, D. The stabilizing excipients in dry state therapeutic phage formulations. AAPS PharmSciTech 2020, 21, 133. [Google Scholar] [CrossRef]
- Gonzalez, T.J.; Boothby, T.C. Properties governing dry-state stability of RNA in amorphous sugar formulations. Commun. Mater. 2025, 6, 129. [Google Scholar] [CrossRef]
- Burgoyne, L.A. Solid Medium and Method for DNA Storage. US Patent 5,985,327, 16 November 1999. [Google Scholar]
- Armenta-Leyva, B.; Munguía-Ramírez, B.; Zhang, D.; Zhang, J.; Rauh, R.; Giménez-Lirola, L.G.; Zimmerman, J.J. Comparison of the recovery of PCR-detectable porcine epidemic diarrhea virus and porcine reproductive and respiratory syndrome virus from filter papers under laboratory conditions. Front. Cell. Infect. Microbiol. 2025, 15, 1677338. [Google Scholar] [CrossRef]
- Kong, C.; Tian, M.; Cai, L.; Wu, D.; Ni, L.; Zhang, C.; Yang, H. Exploration on application effectiveness of microbial capture filter membranes from different materials in barrier environment facilities. Lab. Anim. Comp. Med. 2024, 44, 436–444. [Google Scholar]
- Armenta-Leyva, B.; Munguía-Ramírez, B.; Zhang, Y.; Zhang, J.; Rauh, R.; Giménez-Lirola, L.G.; Zimmerman, J.J. Effect of temperature, relative humidity, and time on the detection of swine RNA viruses (PRRSV, PEDV, IAV) inoculated onto filter papers. Front. Cell Infect. Microbiol. 2026, in press. [Google Scholar] [CrossRef]
- Denniff, P.; Woodford, L.; Spooner, N. Effect of ambient humidity on the rate at which blood spots dry and the size of the spot produced. Bioanalysis 2013, 5, 1863–1871. [Google Scholar] [CrossRef]
- Sakai, T.; Ishii, A.; Segawa, T.; Kobayashi, Y.; Itou, I. Establishing conditions for the storage and elution of rabies virus RNA using FTA® cards. J. Vet. Med. Sci. 2014, 77, 461–465. [Google Scholar] [CrossRef]
- Samsonova, J.V.; Sushkin, N.Y.; Osipov, A.P. Dried blood spots technology for veterinary applications and biological investigations: Technical aspects, retrospective analysis, ongoing status and future perspectives. Vet. Res. Commun. 2022, 46, 655–698. [Google Scholar] [CrossRef]
- Smit, P.W.; Elliot, I.; Peeling, R.S.; Mabey, D.; Newton, P.N. An overview of the clinical use of filter paper in the diagnosis of tropical diseases. Am. J. Trop. Med. Hyg. 2014, 90, 195–210. [Google Scholar] [CrossRef]
- Lehmann, S.; Delaby, C.; Vialaret, J.; Ducos, J.; Hirtz, C. Current and future use of “dried blood spot” analyses in clinical chemistry. Clin. Chem. Lab. Med. 2013, 51, 1897–1909. [Google Scholar] [CrossRef]
- Lange, B.; Roberts, T.; Cohn, J.; Greenman, J.; Camp, J.; Ishizaki, A.; Messac, L.; Tuaillon, E.; van de Perre, P.; Pichler, C.; et al. Diagnostic accuracy of detection and quantificacion of HBV-DNA and HCV-RNA using dried blood spot (DBS) samples—A systematic review and meta-analysis. BMC Infect. Dis. 2017, 17, 693. [Google Scholar]
- Vojnov, L.; Carmona, S.; Zeh, C.; Markby, J.; Boaeras, D.; Prescott, M.R.; Mayne, A.L.H.; Swadogo, S.; Adje-Toure, C.; Zhang, G.; et al. The performance of using dried blood spot specimens for HIV-1 viral load testing: A systematic review and meta-analysis. PLoS Med. 2022, 19, e1004076. [Google Scholar] [CrossRef]
- Wang, L.; Xu, X.; Zhang, H.; Qian, J.; Zhu, J. Dried blood spots PCR assays to screen congenital cytomegalovirus infection: A meta-analysis. Virol. J. 2015, 12, 60. [Google Scholar] [CrossRef]


| Variable | Description |
|---|---|
| 1 | “virus*”[Title/Abstract] OR “viruses”[MeSH Terms] OR “viral”[Title/Abstract] OR “dna viral”[MeSH Terms] OR “rna viral”[MeSH Terms] |
| 2 | “filter paper*”[tiab] OR Whatman[tiab] OR FTA[tiab] OR Flinders[tiab] OR Reemay[tiab] OR “Sentinel EAD”[tiab:~0] OR “Schleicher Schuell”[tiab:~2] OR Guthrie[tiab] OR “nucleic acid cards”[tiab:~1] OR “exhaust air dust”[tiab] OR “saver card*”[tiab] OR “filter media”[tiab] OR “toyo roshi kaisha”[tiab:~1] OR ISOCODE[tiab] OR Munktell[tiab] OR Ahlstrom[tiab] OR Nobuto[tiab] OR “environmental sampl*”[tiab] OR “dried spots”[tiab:~1] |
| 3 | PCR[tiab] OR “polymerase chain reaction”[tiab] OR polymerase chain reaction[MeSH Terms] OR “RT-PCR”[tiab] OR “RT-qPCR”[tiab] OR “molecular method*”[tiab] |
| 4 | #1 AND #2 AND #3 |
| 1 | TS = (virus* OR viral) |
| 2 | TS = (“filter paper*” OR Whatman OR FTA OR Flinders OR Reemay OR (Sentinel NEAR/0 EAD) OR (Schleicher NEAR/2 Schuell) OR Guthrie OR (“nucleic acid” NEAR/1 (card OR cards)) OR “exhaust air dust” OR “saver card*” OR “filter media” OR “toyo roshi kaisha” OR ISOCODE OR Munktell OR Ahlstrom OR Nobuto OR “environmental sampl*” OR (dried NEAR/1 spots)) |
| 3 | TS = (PCR OR “polymerase chain reaction” OR “RT-PCR” OR “RT-qPCR” OR “molecular method*”) |
| 4 | #1 AND #2 AND #3 |
| 1 | TITLE-ABS-KEY (virus* OR viral) |
| 2 | TITLE-ABS-KEY (“filter paper*” OR Whatman OR FTA OR Flinders OR Reemay OR (Sentinel W/0 EAD) OR (Schleicher W/2 Schuell) OR Guthrie OR (“nucleic acid” W/1 (card OR cards)) OR “exhaust air dust” OR “saver card*” OR “filter media” OR “toyo roshi kaisha” OR ISOCODE OR Munktell OR Ahlstrom OR Nobuto OR “environmental sampl*” OR (dried W/1 spots)) |
| 3 | TITLE-ABS-KEY (PCR OR “polymerase chain reaction” OR “RT-PCR” OR “RT-qPCR” OR “molecular method*”) |
| 4 | #1 AND #2 AND #3 |
| Parameters | Studies Reporting | Range | Summary |
|---|---|---|---|
| Drying times | 80/145 | 0.24 to 48 h | Among studies reporting drying times, 80% were between 0.5 and 24 h. Median drying time was 4 h, i.e., one-half of studies reported shorter times. |
| Drying temperature | 59/145 | 20 to 33 °C | Among studies reporting drying temperature, 80% fell between 21 °C and 29 °C; with a median of 24 °C. |
| Storage temperature | 87/145 | −80 to 41 °C | Among studies reporting storage temperature, 80% fell between −35 °C and 37.9 °C; with a median of 23.5 °C. |
| Storage relative humidity | 3/145 | 53 to 70% | Three studies reported relative humidity during storage. |
| Storage time | 46/145 | 0 to 2920 d | Among studies reporting storage time, 80% were between 3.6 days and 803.2 days; with median of 56 days. |
Disclaimer/Publisher’s Note: The statements, opinions and data contained in all publications are solely those of the individual author(s) and contributor(s) and not of MDPI and/or the editor(s). MDPI and/or the editor(s) disclaim responsibility for any injury to people or property resulting from any ideas, methods, instructions or products referred to in the content. |
© 2026 by the authors. Licensee MDPI, Basel, Switzerland. This article is an open access article distributed under the terms and conditions of the Creative Commons Attribution (CC BY) license.
Share and Cite
Armenta-Leyva, B.; Munguía-Ramírez, B.; Kuennen, B.; Zhang, Y.; Giménez-Lirola, L.G.; Zimmerman, J.J. Detection of Viral Nucleic Acid in Specimens Spotted on Commercial Filter Papers: A Review and Meta-Analysis. Viruses 2026, 18, 630. https://doi.org/10.3390/v18060630
Armenta-Leyva B, Munguía-Ramírez B, Kuennen B, Zhang Y, Giménez-Lirola LG, Zimmerman JJ. Detection of Viral Nucleic Acid in Specimens Spotted on Commercial Filter Papers: A Review and Meta-Analysis. Viruses. 2026; 18(6):630. https://doi.org/10.3390/v18060630
Chicago/Turabian StyleArmenta-Leyva, Betsy, Berenice Munguía-Ramírez, Brad Kuennen, Yanqi Zhang, Luis G. Giménez-Lirola, and Jeffrey J. Zimmerman. 2026. "Detection of Viral Nucleic Acid in Specimens Spotted on Commercial Filter Papers: A Review and Meta-Analysis" Viruses 18, no. 6: 630. https://doi.org/10.3390/v18060630
APA StyleArmenta-Leyva, B., Munguía-Ramírez, B., Kuennen, B., Zhang, Y., Giménez-Lirola, L. G., & Zimmerman, J. J. (2026). Detection of Viral Nucleic Acid in Specimens Spotted on Commercial Filter Papers: A Review and Meta-Analysis. Viruses, 18(6), 630. https://doi.org/10.3390/v18060630