Abstract
Background: This study aims to identify predictive factors for pulmonary fibrosis development in COVID-19 patients by analyzing thorax CT (computed tomography) findings, serum prolidase activity, MMP-1, MMP-7, TGF-β values, laboratory findings, and demographic characteristics. Materials and methods: The investigation involved 68 patients, both male and female, aged 18 years and older, who were volunteers and had been diagnosed with confirmed COVID-19. The pulmonologist and the radiologist evaluated the thorax CT by consensus. Patients were evaluated in two categories, group 1 and group 2, based on the status of fibrotic changes, and 3-month fibrosis scores were calculated. Findings in both lungs were calculated and noted for the lobes, considering lobar spread. Correlations between quantitative parameters were assessed with Spearman’s rho correlation coefficient. Comparisons between independent samples were evaluated using either the independent sample t-test or the Mann–Whitney U test. We evaluated the relationship between categorical variables using the Pearson chi-square test and Fisher’s exact test. Results: Serum prolidase activity, MMP-1, MMP-7, and TGF-β biomarkers were not statistically significant among groups. LDH was found to be significantly high in the group with fibrotic changes. Additionally, the group with fibrotic changes also had higher levels of fibrinogen. The percentage of neutrophils, the severity of the disease, muscle–joint pain and fatigue symptoms, and the length of hospitalization stay were correlated with the total scores of fibrosis at the third month. In the group with fibrotic changes, the duration of muscle–joint pain and fatigue symptoms and the length of hospitalization were longer than in the other group. Conclusions: The group with fibrotic changes showed an increase in biomarkers. However, this increase did not reach a statistically significant level, suggesting that the third month may be an early period for these changes. The group with fibrotic changes showed high levels of LDH, one of the most important laboratory parameters of pulmonary fibrosis risk factors, along with fibrinogen, suggesting that these parameters are valuable in predicting pulmonary fibrosis. Patients with fibrotic changes can experience specific symptoms, commonly seen in COVID-19.
1. Introduction and Purpose
Pneumonia cases with an unknown cause were reported in Wuhan City, Hubei Province, China, on 31 December 2019. Since then, COVID-19 (coronavirus disease) has spread rapidly. WHO (World Health Organization) declared an “International Public Health Emergency” for COVID-19 caused by SARS-CoV-2 (Severe Acute Respiratory Syndrome Coronavirus 2) on 30 January 2020, and a pandemic on 11 March 2020, as a result of its spread to other countries. According to current data, the number of cases worldwide is around 700 million, and the number of confirmed deaths from COVID-19 is approximately 6.5 million [1].
The natural course of patients severely affected by the infection is currently unclear. While some patients will develop pulmonary fibrosis or post-COVID-19 interstitial lung disease (PC-ILD) over time, using our knowledge of infections closely related to the coronavirus pandemic, such as SARS and MERS (Middle East Respiratory Syndrome), we can assume that most patients will stabilize or recover. Given the scale of the pandemic, physicians are likely to encounter large numbers (potentially hundreds of thousands) of patients with PC-ILD, unlike the SARS and MERS epidemics that affected several thousand people [2].
In a study evaluating markers of pulmonary fibrosis in patients with COVID-19 pneumonia using clinical data and thorax CT, researchers found irregular interface, parenchymal bands, and interstitial thickening, evidence of fibrosis in approximately half of the patients on initial CT and in 85–92% of patients on follow-up CT. They suggested that irregular interface and parenchymal bands may be two early markers of pulmonary fibrosis [3].
Biomarkers were also examined to predict pulmonary fibrosis in COVID-19 infection and other diseases. Prolidase, a metalloenzyme among the biomarkers associated with pulmonary fibrosis, is critical for the release of proline in protein metabolism. Although changes in prolidase activity are seen in cancer and many diseases involving fibrotic processes, prolidase activity may be a useful marker in the early detection and monitoring of these diseases [4].
The metalloproteinases MMP-1 (Matrix Metalloproteinase-1) and MMP-7 (Matrix Metalloproteinase-7) are defined as potential peripheral blood biomarkers in idiopathic pulmonary fibrosis (IPF). In a study, MMP-1 and MMP-7 levels were found to be significantly higher in the serum and bronchoalveolar lavage fluid of IPF patients compared to healthy controls [5].
MMP-1/MMP-7 are MMPs known to be significantly expressed in activated alveolar epithelium in IPF lungs. MMP-1, a matrix metalloprotease that mainly degrades fibrillar collagen, is rarely expressed under normal conditions but is highly expressed in reactive alveolar epithelial cells in IPF lungs [6].
In a study, MMP-7 levels were shown to be associated with early fibrotic changes on CT scans of asymptomatic patients with familial interstitial pneumonia [7]. This suggests that MMP-7 may have a profibrotic effect in IPF patients.
When the relationship between TGF-β (transforming growth factor—beta) and pulmonary fibrosis is evaluated, the interaction of the spike protein of SARS viruses with ACE-2 (angiotensin-converting enzyme 2) downregulates the ACE-2 receptor and upregulates TGF-β.
SARS-CoV infection not only increases TGF-β expression but also facilitates signaling activity. ACE-2, a SARS-CoV receptor, is a negative regulator of lung fibrosis. Therefore, SARS-CoV infection may lead to lung fibrosis through multiple signaling activities. TGF-β activation is one of the major contributors to this condition [8].
This study aimed to determine the predictive factors for the development of pulmonary fibrosis by combining thorax CT findings at the time of hospitalization, serum prolidase activity (SPA), MMP-1, MMP-7, TGF-β values, laboratory findings, clinical–radiological features (follow-up thorax CT requested only in the case of clinical necessity) at the 12th week routine clinical controls, and demographic characteristics of patients who were treated for COVID-19 in our respiratory medicine service, had moderate to severe disease, and were discharged.
Laboratory Evaluation
Research on biochemical/hematological values in the diagnosis, follow-up, and prognosis of COVID-19 patients reveals that these parameters have an important role in predicting the severity of the disease and response to treatment. This has been supported by several studies.
Lymphopenia, one of the leukocyte parameters, was observed in COVID-19 patients, and lymphocyte count was shown to be associated with increased mortality, ARDS, need for intensive care unit follow-up, and severe COVID-19 [9]. The eosinophil count has been thought to be an indicator of response to treatment and recovery in COVID-19.
It was predicted that a high neutrophil count is an indicator of poor prognosis, and when evaluated together with a low lymphocyte count, a high neutrophil/lymphocyte ratio (NLR) can be used as a marker of poor prognosis [10].
Eosinopenia was seen in COVID-19 patients, and the decrease in eosinophils may be explained by a mechanism caused by SARS-CoV-2 inhibiting the release of eosinophils in the bone marrow through glucocorticoid secretion in cases of acute lung injury [11].
D-dimer is elevated in peripheral blood in COVID-19 patients, especially those with severe disease. D-dimer levels are suggested to be associated with disease severity and to be a reliable prognostic marker for mortality in COVID-19 [12].
Thrombocytopenia was observed to be associated with severe disease and mortality in COVID-19 patients and was suggested to be used as a clinical indicator of poor prognosis of the disease [13].
In a cohort study, it was found that COVID-19 patients were more likely to have abnormal PT, aPTT, D-dimer, and fibrinogen levels at hospital admission compared to the control group, and a statistically significant increase in fibrinogen levels was found in COVID-19 patients with ARDS (Acute Respiratory Distress Syndrome) compared to those without ARDS [14].
It was observed that increased levels of ferritin, whose function is to store iron for use in cellular functions, were indicative of a strong inflammatory response in COVID-19, and serum ferritin levels were positively correlated with the severity of COVID-19. Hyperferritinemia was observed in all patients with severe disease at hospital admission [15].
An increase or decrease in LDH (lactate dehydrogenase) was reported to be an indicator of radiographic progression or improvement, and normalization of serum LDH was found to be consistent in predicting treatment success in patients [16].
C-reactive protein (CRP) is a biomarker of systemic inflammation, and high plasma CRP levels were shown to be associated with the severity of COVID-19 pneumonia and longer hospitalization [17].
In adults, high PCT (procalcitonin) was found to be associated with an approximately 5-fold increased risk of severe disease in COVID-19 infection [18].
Multiple studies observed the association of elevated liver enzymes in patients with COVID-19 infection, hypothesizing that viral infection may cause liver damage through direct hepatotoxic injury, drug toxicity, or an immune response-mediated pathway. Acute liver injury and high ALT and AST levels were associated with poor prognosis [19].
In patients with severe COVID-19, significant elevations in renal biomarkers (creatinine, urea) were observed and associated with poor prognosis [20].
2. Materials and Methods
2.1. Ethical Approval, Study Design, and Inclusion Criteria
This study was derived from the dissertation and was approved by the Selçuk University Faculty of Medicine Clinical Research Local Ethics Committee with the decision numbered 2022/168 on 29 March 2022. This study is a case-cohort study. Patients participating in the study were informed about the study and signed informed consent forms.
The study was conducted between April 2022 and January 2023 in a university hospital that has been determined to be the COVID-19 pandemic center of the province where our hospital is located. Male and female patients aged 18 years and older with a definite diagnosis of COVID-19, who were hospitalized and treated in the Selçuk University Respiratory Medicine Clinic and who volunteered to participate in the study, were included in the study.
2.2. Exclusion Criteria for the Study
Pregnant women, patients under 18 years of age, patients with pre-existing interstitial lung disease (ILD), patients with malignancy, and patients who did not sign a consent form were excluded from the study. The study was completed with 68 patients.
All patients were classified according to the 2019 Coronavirus Disease Guidelines (7th edition) published by the National Health Commission of China [21,22,23]. According to the classification, they were grouped as mild, moderate, severe, and critical types.
2.3. Evaluation of Radiology Images
Thorax CT images of the patients, requested only in the case of clinical necessity at the 12th-week routine check-ups in our clinic after discharge, were included in the study. The thorax CT images of the patients were evaluated in a single session by the consensus of a pulmonologist and a radiologist. CT scans were evaluated together by an experienced specialist radiologist and a professor of pulmonology medicine, and a decision for fibrosis was made meticulously with a common consensus.
Traction bronchiectasis or honeycomb appearance was considered an indicator of significant fibrosis (also the findings associated with long-term fibrosis [24]), and the patients were divided into two groups. The group with significant fibrotic changes, such as traction bronchiectasis or honeycombing, was group 1, and the group without significant fibrotic changes was group 2.
The third-month total fibrosis score was obtained by evaluating reticulation and lobar spread of the subpleural band, traction bronchiectasis, or the existence of honeycomb formation.
2.4. Evaluation of Laboratory Results and Fibrosis Score
The laboratory results obtained during hospitalization were utilized. The levels of serum prolidase activity, MMP-1, MMP-7, and TGF-β were analyzed using ELISA kits.
The identified observations in both lungs were evaluated and assigned scores, taking into account lobar spread, with a score of 0–5 for the lobes and a maximum score of 25 points. The third-month total fibrosis score was calculated by summing individual lobe scores, with 1 point <5%, 2 points 5–25%, 3 points 26–49%, 4 points 50–75%, and 5 points >75%.
2.5. Statistical Analysis and Determination of Sample Size
In order to compare the serum prolidase, MMP-1, MMP-7, and TGF-β concentrations of patients diagnosed with moderate to severe COVID-19 disease, this study utilized a calculated sample size to determine the difference between patients who developed early fibrosis and those who did not develop fibrosis. For this purpose, it was planned to include at least 68 patients in the study, with at least 34 patients in each group, in order to reach 90% statistical power with a 5% significance level and an effect size of 0.8. The “pwr” package in R version 3.6.0 (The R Foundation for Statistical Computing, Vienna, Austria) was used to calculate the sample size.
All statistical analyses were performed with the help of R version 3.6.0 software (The R Foundation for Statistical Computing, Vienna, Austria). Before the analyses, the normality of the data was confirmed with the help of Shapiro–Wilk’s normality test and Q-Q graphs, and the homogeneity assumptions of group variances were evaluated with the Levene test. The statistics for descriptive numerical variables in the data are presented as the mean and standard deviation (minimum–maximum) and the median (interquartile range [IQR]: 1st quarter–3rd quarter). The categorical variables were presented as frequency (n) and percentage (%). The relationship between the fibrosis total score in the third month and several variables, including the patients’ age, smoking (pack/years), BMI, initial blood parameters, and serum levels of prolidase activity, MMP-1, MMP-7, and TGF-β, was assessed using Spearman’s rho correlation coefficient. The relationships between the presence of comorbidities and symptoms and the 3-month fibrosis score of the patients were compared using the independent samples t-test and Mann–Whitney U test. The groups with and without fibrotic change were compared using several statistical techniques, including the independent samples t-test, Mann–Whitney U test, Pearson chi-square test, Yates continuity corrected chi-square test, and Fisher’s exact test.
3. Results
The investigation was conducted with a total of 68 patients; 39 of the patients were male (57.4%) and 29 were female (42.6%). The median age was 65.5 (29–86). The measurement results of biomarkers and the demographic characteristics, classification, comorbidities, oxygen therapy, symptoms, and biomarkers are given in Table 1.

Table 1.
Summary of the overall statistical distribution of patients’ quantitative and qualitative findings.
A significant positive relationship was observed between the length of hospital stay and the fibrosis total score at the third month (Spearman’s rho = 0.461, p < 0.001). There was a significant positive correlation between the neutrophil percentages and the third-month fibrosis total scores (Spearman’s rho = 0.249, p = 0.040). However, at the time of admission, there was no significant correlation observed between the blood values (biomarkers) and the third-month fibrosis total score (p > 0.05). There was no significant correlation observed between the third-month fibrosis total score and other quantitative parameters (Table 2).
Table 2.
Relationships between the third-month fibrosis total score and the demographic and clinical characteristics of the patients, smoking exposure, biomarkers, and blood parameters at the time of hospitalization.
The relationship between the moderate and severe patient groups and the third-month fibrosis total score is summarized in Table 3. Patients were categorized based on COVID-19 classification, and it was observed that the fibrosis total score at the third month was significantly higher in the severe group compared to the moderate group (6.50 [0–16] vs. 3.0 [0–13], p = 0.019).
Table 3.
Relationships between the third-month fibrosis total score and moderate and severe patient groups.
The relationships between the third-month fibrosis total score, comorbidities, and symptoms are summarized in Table 4. Upon evaluating the patients’ comorbidities, it was observed that there was no statistically significant difference between the groups with and without comorbidities regarding fibrosis total scores at the third month (p > 0.05).
Table 4.
Relationships between third-month fibrosis total score, comorbidities, and symptoms.
Patients experiencing muscle–joint pain symptoms had a higher fibrosis total score in the third month compared to those without these symptoms (7 [0–16] vs. 5 [0–16], p = 0.030). Patients experiencing fatigue symptoms had a significantly higher fibrosis overall score in the third month compared to participants without these symptoms (7 [0–16] vs. 5 [0–11], p = 0.010).
No significant relationship was observed between the most common symptoms in patients (cough and fever) and the third-month fibrosis total score (p > 0.05).
Demographic characteristics, smoking history, biomarkers, blood parameters at the time of admission, and their relationships with clinical characteristics of group 1 and group 2 patients are summarized in Table 5 and Figure 1. There was no significant difference between the groups in terms of age and BMI (p > 0.05). There was no statistically significant difference between the groups in terms of smoking and smoking exposure (secondhand smoker) (p = 0.584 and p = 0.631, respectively).
Table 5.
Comparing group 1 and group 2 in terms of the relationship between demographic characteristics, smoking history, biomarkers, blood parameters at the time of admission, and clinical characteristics.
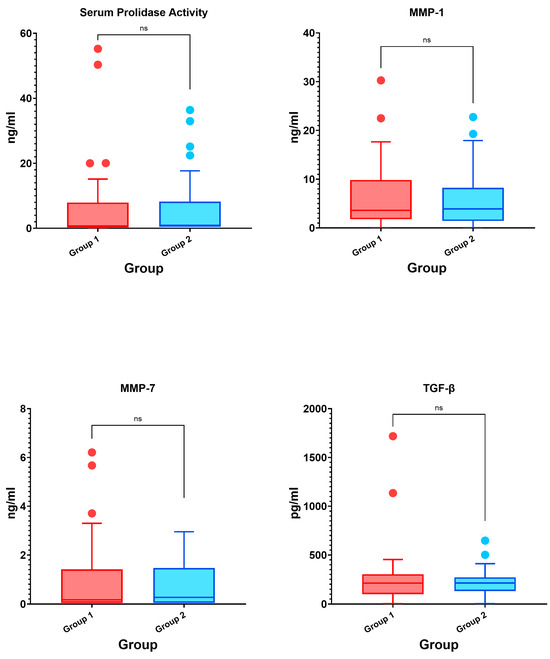
Figure 1.
Box plot graphs of the intergroup comparison of biomarkers (ns: non-significant).
Although the results revealed higher levels of serum prolidase activity (0.90 [0.50–7.30] vs. 0.50 [0.50–7.27], p = 0.491), serum MMP-1 level (3.92 [1.47–7.63] vs. 3.62 [1.82–9.28], p = 0.956), serum MMP-7 level (0.27 [0.05–1.41] vs. 0.17 [0.05–1.36], p = 0.927), and serum TGF-β level (213.35 [140.25–263.65] vs. 211.57 [107.88–295.81], p = 0.966) in the group with fibrotic changes compared to the group without fibrotic changes, these differences were not statistically significant.
LDH levels in group 1 were significantly higher compared to group 2 (363 [290.25–472.25] vs. 272.5 [215.25–360.25], p = 0.012). Additionally, the fibrinogen values at the time of admission in group 1 were also significantly higher than in group 2 (562.50 [452.50–714.74] vs. 445.5 [368.75–538.0], p = 0.002). There was no significant difference between the groups for other blood parameters at the time of admission (p > 0.05).
The results demonstrated that the length of hospitalization was greater in group 1 compared to group 2 (11 [10–16] vs. 8.5 [5–10.75], p < 0.001).
Comparisons of group 1 and group 2 patients in terms of gender, classification, comorbidities, and symptoms are summarized in Table 6. Upon evaluating group 1 and group 2 based on gender and classification (disease severity), no statistically significant difference was observed between the groups (p > 0.05). There was no significant difference between groups in terms of comorbidities (p > 0.05). When both groups were compared in terms of symptoms, muscle–joint pain and fatigue were more common in group 1 (p = 0.015 and p = 0.029, respectively). There was no statistically significant difference observed among the groups in terms of other symptoms (p > 0.05).
Table 6.
Comparison of group 1 and group 2 patients in terms of gender, classification, comorbidities, and symptoms.
A comparison of group 1 and group 2 patients in terms of oxygen treatments is summarized in Table 7. No statistically significant difference was observed between group 1 and group 2 in terms of oxygen treatment (p > 0.05).
Table 7.
Comparison of group 1 and group 2 patients in terms of oxygen therapy.
4. Discussion
Prolidase is essential for the construction and degradation of collagen-containing connective tissue, and changes in its activity are present in many diseases involving fibrotic processes [4]. In a study evaluating idiopathic and ischemic dilated cardiomyopathies, which exhibited the same histopathological feature of fibrosis, serum prolidase activity was found to be significantly lower in both groups compared to healthy volunteers [25].
In a study investigating patients with chronic obstructive pulmonary disease (COPD), an inflammatory lung disease in which irreversible fibrotic changes occur in the airways, lower plasma prolidase activity was observed in COPD patients compared to the control group (p < 0.05) [26]. In our study, no significant relationship was observed between the third-month total fibrosis score and serum prolidase levels. When evaluated in terms of fibrotic changes, although there was no significant difference between the groups, they were observed to be higher in the fibrotic group compared to the other group at the beginning. This can also be explained by the fact that it is an early period for changes in prolidase activity during the fibrosis process. Significant changes may be found when evaluated in the future.
In a recent study, MMP1 and MMP7, which are identified as potential peripheral blood biomarkers in IPF, were found to be significantly higher in serum and bronchoalveolar lavage fluid in IPF patients compared to healthy controls [5]. In a different study, MMP-7 levels were associated with early fibrotic changes on the CT scans of asymptomatic patients with familial interstitial pneumonia [7].
Our study has some limitations. For example, the patients considered in this study who were infected with COVID-19 may have been at different stages of the disease at hospital admission and hospitalization. Although the biomarkers included in our main hypothesis were found to be higher in the fibrotic group, no significant statistical difference was observed.
Studies conducted for COVID-19 showed that males have higher mortality or severe infection rates than females. While some studies reported a higher incidence of COVID-19 infection in males, some studies found no difference in the incidence of COVID-19 infection [27].
In a study involving 72,314 suspected or confirmed COVID-19 cases in China, it was found that 51.4% of the patients were male, with 22,981 cases, and mortality was significantly higher in males than females [28].
In a study conducted with 14,712 patients with COVID-19, the all-cause mortality rate was higher in males than females (p < 0.001) [29]. In our study, the number of male patients (n = 39) was high among patients with COVID-19 infection, and the proportion of male patients (n = 33) was high in the severe disease group.
In a meta-analysis of 2018 patients evaluating pulmonary fibrosis after COVID-19, the mean age of fibrotic patients was 59 years, while the mean age of non-fibrotic patients was 48.5 years (p = 0.003), and there was no significant difference between fibrotic and non-fibrotic patients in terms of BMI (25.23 and 24.75, respectively), evaluated by only two studies, and no significant gender difference (53.8% male and 46.2% female) was observed between groups [30].
In our study, age and body mass index were not significantly associated with the third-month fibrosis total score. There was no significant difference between group 1 and group 2 in terms of age and body mass index, and no significant difference was found in terms of gender (p > 0.05).
Although the symptoms of patients at hospital admission differ in COVID-19, the common symptoms are similar in most studies.
In a study evaluating the data of 1099 COVID-19 patients, fever was present in 43.8% of the patients during hospital admission and developed in 88.7% of the patients at hospitalization, and the second-most common symptom was a cough (67.8%), followed by nausea or vomiting (5.0%) and diarrhea (3.8%) [31].
In one of the first studies on COVID-19, common symptoms at the onset of the disease were fever (98%), cough (76%), and myalgia or fatigue (44%), with less common symptoms being phlegm (28%), headache (8%), and diarrhea (3%). It was observed that 22 of 40 patients (55%) developed dyspnea [32].
In a study including 10 studies and a total of 1995 cases, clinical symptoms of COVID-19 patients were fever (88.5%), cough (68.6%), myalgia/fatigue (35.8%), phlegm (28.2%), and shortness of breath (21.9%) [33]. According to a meta-analysis, among COVID-19 symptoms, cough (47.4%), chest pain (27.6%), and fever (72.4%) were more common in the fibrotic group compared to the non-fibrotic group (p < 0.05) [30].
In our study, the most common symptoms at hospital admission were cough (57.4%), fever (52.9%), and fatigue (52.9%). Our patients frequently displayed cough and fever symptoms, in line with the literature.
In a study of 80 COVID-19 patients, the frequencies of myalgia and fatigue were 46.1% and 50%, respectively. Laboratory data showed a significant increase in creatinine kinase (CK) level and lymphocyte count in patients with myalgia symptoms (p < 0.05). It was reported that caution should be exercised regarding muscle damage due to increased CK in these patients and that extremely high values may indicate a progressive myopathic process [34]. In our study, when the relationship between the symptoms at hospital admission and the third-month fibrosis total score was evaluated, the score was higher in patients with muscle–joint pain symptoms compared to the group without symptoms (p = 0.031). The third-month fibrosis total score of patients with fatigue symptoms was found to be significantly higher than that of the group without symptoms (p = 0.006). When groups 1 and 2 were compared in terms of symptoms, muscle–joint pain (p = 0.015) and fatigue symptoms were more common in group 1 (p = 0.029). There was no difference in other symptoms (p > 0.05).
In terms of clinical presentation, COVID-19 pneumonia was more severe in some patient groups, and many studies on this subject demonstrated that comorbidities play a role in this situation. In a study evaluating 191 COVID-19 patients, hypertension was found to be the most common comorbidity, followed by diabetes mellitus and coronary heart disease [35].
In a study evaluating 654 COVID-19 patients in our country, it was observed that the most common comorbidities were hypertension, diabetes mellitus, and cardiovascular diseases (25.3%, 12.4%, and 10.7%, respectively) [36].
In a study in which 81 patients were evaluated for pulmonary fibrosis, the fibrosis group had higher rates of DM, hypertension, chronic lung disease, chronic liver disease, and cardiovascular and cerebrovascular diseases than the non-fibrosis group. Abnormal parameters, including leukocytosis, neutrophilia, lymphopenia, eosinopenia, high CRP, and d-dimer, were found to be significantly different between the groups [37]. In our study, the most common comorbidities were noted as DM (44.1%, 30), respiratory disease (42.6%, 29), and hypertension (41.2%, 28). No significant difference was observed between the groups in terms of comorbidities (p > 0.05). There was also no significant correlation between comorbidities and the third-month fibrosis total score (p > 0.05).
A study conducted for SARS showed a positive correlation between peak LDH level and pulmonary fibrosis at hospital admission [38]. In our study, LDH values at hospital admission in the group with fibrotic changes were significantly higher than in the group without fibrotic changes (p = 0.012). The fibrinogen values were also significantly higher in group 1 compared to group 2 at hospital admission (p = 0.002). In light of these data, LDH values were noted to be high in the fibrotic group at hospital admission, in line with the literature.
In a study evaluating 227 COVID-19 patients, pulmonary fibrosis was found to be significantly associated with some coagulation indices and fibrinogen [39]. Similarly, in our study, it was observed that the fibrinogen value in blood parameters at hospital admission was higher in group 1 than in group 2 (p = 0.008).
Huang et al. indicated that neutrophil, neutrophil-to-lymphocyte ratio (NLR), C-reactive protein (CRP), and LDH levels were significantly above the normal range during the first four weeks after hospitalization in patients with extensive fibrosis at two-month follow-up. Conversely, CRP and LDH were shown to increase within two weeks but then sharply decrease to normal levels in the non-fibrosis group [37]. In our study, there was a significant and positive relationship between neutrophil percentages and the third-month fibrosis total scores (p = 0.040).
In another study evaluating pulmonary fibrosis after COVID-19, some predictive factors, such as old age and smoking, were reported. The incidence of post-pulmonary fibrosis was found to be much higher in patients with a smoking history than in non-smokers, and post-pulmonary fibrosis was observed to develop in 18 out of 30 smokers [40]. In our study, no significant relationship was found between smoking exposure (secondhand smoker) (p = 0.793) and the third-month fibrosis total score. There was no difference between the groups in terms of smoking and smoking exposure (secondhand smoker) (p = 0.584), and our study was different in this respect.
A significant and positive relationship was detected between the patients’ length of hospitalization (p < 0.001) and the third-month fibrosis total score. It was observed that the length of hospitalization was longer in group 1 compared to group 2 (p < 0.001). In a study in which fibrotic and non-fibrotic groups were compared after COVID-19, a statistically significant difference was observed between both groups in terms of ICU hospitalization and total length of hospitalization (p ˂ 0.001). On the other hand, the length of hospitalization in the fibrotic group was found to be longer than in the non-fibrotic group (23.26 ± 20.89 vs. 8.56 ± 7.03 days) [41]. The data in the relevant study was found to support our results.
Our study’s single-center design and small sample size are some of its limitations. Additionally, the fact that patients may have had different disease stages during admission may have affected our results.
5. Conclusions
In our study investigating the role of serum prolidase activity, MMP-1, MMP-7, and TGF-β values in predicting early fibrosis, it was observed that these biomarkers were increased in the group with fibrotic changes, although not at a statistically significant level. LDH, one of the most important laboratory parameters of pulmonary fibrosis, and fibrinogen were high in the group with fibrotic changes. Neutrophil percentages, disease severity, muscle–joint pain, fatigue symptoms, and length of hospital stay were found to be associated with 3-month fibrosis total scores. Musculoskeletal pain, fatigue symptoms, and length of hospital stays were higher in the fibrotic group compared to the group without fibrotic changes.
Based on our findings, we believe that additional studies are required to accurately predict pulmonary fibrosis following COVID-19 and evaluate the long-term outcomes of the disease.
Author Contributions
D.D.Z., Conducted the dissertation, wrote the main manuscript text, and served as corresponding author. D.E., B.Y., R.E., and B.T., Contributed to the sample size by providing patients who were followed and treated by the author. H.G., Evaluated and analyzed the biochemical parameters. M.K.K., Performed statistical analysis. H.O., Calculated the patients’ radiological scores and evaluated the thorax CT findings. A.U., Evaluated the biochemical markers. F.K., Supervised the dissertation as an advisor and contributed to the sample size by providing patients who were followed and treated by the author. All authors have read and agreed to the published version of the manuscript.
Funding
The research was funded by Selçuk University Scientific Research Projects Coordination (BAP) under project number 22122009.
Institutional Review Board Statement
The study was conducted in accordance with the Declaration of Helsinki and approval was granted by the Selçuk University Faculty of Medicine Clinical Research Local Ethics Committee with the decision number 2022/168 on 29.03.2022.
Informed Consent Statement
Informed consent was obtained from all subjects involved in the study.
Data Availability Statement
The raw data supporting the conclusions of this article will be made available by the authors on request.
Conflicts of Interest
The authors have no relevant financial or non-financial interests to disclose. The authors declare no conflicts of interest.
Abbreviations
CT: Computed tomography; WHO: World Health Organization; COVID-19: Coronavirus disease-19; SARS-CoV-2: Severe Acute Respiratory Syndrome Coronavirus 2; CoV: Coronavirus; MERS: Middle East Respiratory Syndrome; SARS: Severe Acute Respiratory Syndrome; IPF: Idiopathic pulmonary fibrosis; ACE: Angiotensin-converting enzyme; ELISA: Enzyme-linked immunosorbent assay; MMP: Matrix Metalloproteinase; MMP-1: Matrix Metalloproteinase-1; MMP-7: Matrix Metalloproteinase-7; TGF-β: Transforming growth factor—beta; WBC: White blood cell; LDH: Lactate dehydrogenase; CRP: C-reactive protein; ALT: Alanine transaminase; AST: Aspartate transaminase; HGB: Hemoglobin; HCT: Hematocrit; PLT: Platelet; RBC: Red blood cell; MCV: Mean corpuscular volume; MCH: Mean corpuscular hemoglobin; RDW: Red cell distribution width; MPV: Mean platelet volume; PDW: Platelet distribution width; DM: Diabetes mellitus; HT: Hypertension; RNA: Ribonucleic acid; ICU: Intensive care unit; ARDS: Acute Respiratory Distress Syndrome; APTT: Activated partial thromboplastin time; PT: Prothrombin time; NLR: Neutrophil to lymphocyte ratio; BMI: Body mass index; CAD: Coronary artery disease; PC-ILD: post-COVID-19 interstitial lung disease; SD: Standard deviation.
References
- COVID-19 (SARS-CoV2 Enfeksiyonu) Rehberi: T.C Sağlık Bakanlığı 2020 [updated 16.07]. Available online: https://covid19bilgi.saglik.gov.tr/depo/rehberler/COVID-19_Rehberi.pdf (accessed on 1 April 2022).
- Udwadia, Z.F.; Koul, P.A.; Richeldi, L. Post-COVID lung fibrosis: The tsunami that will follow the earthquake. Lung India 2021, 38, S41–S47. [Google Scholar] [CrossRef] [PubMed]
- Yu, M.; Liu, Y.; Xu, D.; Zhang, R.; Lan, L.; Xu, H. Prediction of the development of pulmonary fibrosis using serial thin-section CT and clinical features in patients discharged after treatment for COVID-19 pneumonia. Korean J. Radiol. 2020, 21, 746–755. [Google Scholar] [CrossRef] [PubMed]
- Kitchener, R.; Grunden, A. Prolidase function in proline metabolism and its medical and biotechnological applications. J. Appl. Microbiol. 2012, 113, 233–247. [Google Scholar] [CrossRef]
- Rosas, I.O.; Richards, T.J.; Konishi, K.; Zhang, Y.; Gibson, K.; Lokshin, A.E.; Lindell, K.O.; Cisneros, J.; MacDonald, S.D.; Pardo, A. MMP1 and MMP7 as potential peripheral blood biomarkers in idiopathic pulmonary fibrosis. PLoS Med. 2008, 5, e93. [Google Scholar] [CrossRef]
- Zuo, F.; Kaminski, N.; Eugui, E.; Allard, J.; Yakhini, Z.; Ben-Dor, A.; Lollini, L.; Morris, D.; Kim, Y.; DeLustro, B. Gene expression analysis reveals matrilysin as a key regulator of pulmonary fibrosis in mice and humans. Proc. Natl. Acad. Sci. USA 2002, 99, 6292–6297. [Google Scholar] [CrossRef]
- Kropski, J.A.; Pritchett, J.M.; Zoz, D.F.; Crossno, P.F.; Markin, C.; Garnett, E.T.; Degryse, A.L.; Mitchell, D.B.; Polosukhin, V.V.; Rickman, O.B. Extensive phenotyping of individuals at risk for familial interstitial pneumonia reveals clues to the pathogenesis of interstitial lung disease. Am. J. Respir. Crit. Care Med. 2015, 191, 417–426. [Google Scholar] [CrossRef] [PubMed]
- Zuo, W.; Zhao, X.; Chen, Y.-G. SARS coronavirus and lung fibrosis. In Molecular Biology of the SARS-Coronavirus; Springer: Berlin/Heidelberg, Germany, 2010; pp. 247–258. [Google Scholar]
- Huang, I.; Pranata, R. Lymphopenia in severe coronavirus disease-2019 (COVID-19): Systematic review and meta-analysis. J. Intensive Care 2020, 8, 36. [Google Scholar] [CrossRef]
- Thompson, S.; Bohn, M.K.; Mancini, N.; Loh, T.P.; Wang, C.-B.; Grimmler, M.; Yuen, K.-Y.; Mueller, R.; Koch, D.; Sethi, S. IFCC interim guidelines on biochemical/hematological monitoring of COVID-19 patients. Clin. Chem. Lab. Med. (CCLM) 2020, 58, 2009–2016. [Google Scholar] [CrossRef]
- Liu, F.; Xu, A.; Zhang, Y.; Xuan, W.; Yan, T.; Pan, K.; Yu, W.; Zhang, J. Patients of COVID-19 may benefit from sustained lopinavir-combined regimen and the increase of eosinophil may predict the outcome of COVID-19 progression. Int. J. Infect. Dis. 2020, 95, 183–191. [Google Scholar] [CrossRef]
- Yao, Y.; Cao, J.; Wang, Q.; Shi, Q.; Liu, K.; Luo, Z.; Chen, X.; Chen, S.; Yu, K.; Huang, Z. D-dimer as a biomarker for disease severity and mortality in COVID-19 patients: A case control study. J. Intensive Care 2020, 8, 49. [Google Scholar] [CrossRef]
- Lippi, G.; Plebani, M.; Henry, B.M. Thrombocytopenia is associated with severe coronavirus disease 2019 (COVID-19) infections: A meta-analysis. Clin. Chim. Acta 2020, 506, 145–148. [Google Scholar] [CrossRef] [PubMed]
- Di Micco, P.; Russo, V.; Carannante, N.; Imparato, M.; Cardillo, G.; Lodigiani, C. Prognostic value of fibrinogen among COVID-19 patients admitted to an emergency department: An Italian cohort study. J. Clin. Med. 2020, 9, 4134. [Google Scholar] [CrossRef]
- Gandini, O.; Criniti, A.; Ballesio, L.; Giglio, S.; Galardo, G.; Gianni, W.; Santoro, L.; Angeloni, A.; Lubrano, C. Serum Ferritin is an independent risk factor for Acute Respiratory Distress Syndrome in COVID-19. J. Infect. 2020, 81, 979–997. [Google Scholar] [CrossRef] [PubMed]
- Wu, M.-y.; Yao, L.; Wang, Y.; Zhu, X.-y.; Wang, X.-f.; Tang, P.-j.; Chen, C. Clinical evaluation of potential usefulness of serum lactate dehydrogenase (LDH) in 2019 novel coronavirus (COVID-19) pneumonia. Respir. Res. 2020, 21, 171. [Google Scholar] [CrossRef]
- Chen, W.; Zheng, K.I.; Liu, S.; Yan, Z.; Xu, C.; Qiao, Z. Plasma CRP level is positively associated with the severity of COVID-19. Ann. Clin. Microbiol. Antimicrob. 2020, 19, 18. [Google Scholar] [CrossRef] [PubMed]
- Henry, B.M.; Benoit, S.W.; de Oliveira, M.H.S.; Hsieh, W.C.; Benoit, J.; Ballout, R.A.; Plebani, M.; Lippi, G. Laboratory abnormalities in children with mild and severe coronavirus disease 2019 (COVID-19): A pooled analysis and review. Clin. Biochem. 2020, 81, 1–8. [Google Scholar] [CrossRef]
- Sharma, A.; Jaiswal, P.; Kerakhan, Y.; Saravanan, L.; Murtaza, Z.; Zergham, A.; Honganur, N.-S.; Akbar, A.; Deol, A.; Francis, B. Liver disease and outcomes among COVID-19 hospitalized patients–A systematic review and meta-analysis. Ann. Hepatol. 2021, 21, 100273. [Google Scholar] [CrossRef]
- Henry, B.M.; De Oliveira, M.H.S.; Benoit, S.; Plebani, M.; Lippi, G. Hematologic, biochemical and immune biomarker abnormalities associated with severe illness and mortality in coronavirus disease 2019 (COVID-19): A meta-analysis. Clin. Chem. Lab. Med. (CCLM) 2020, 58, 1021–1028. [Google Scholar] [CrossRef]
- Li, K.; Fang, Y.; Li, W.; Pan, C.; Qin, P.; Zhong, Y.; Liu, X.; Huang, M.; Liao, Y.; Li, S. CT image visual quantitative evaluation and clinical classification of coronavirus disease (COVID-19). Eur. Radiol. 2020, 30, 4407–4416. [Google Scholar] [CrossRef]
- Wei, P.-F. Diagnosis and Treatment Protocol for Novel Coronavirus Pneumonia (Trial Version 7). Chin. Med. J. 2020, 133, 1087–1095. [Google Scholar] [CrossRef]
- Diagnosis and Treatment Protocol for COVID-19 (Trial Version 7). Available online: http://en.nhc.gov.cn/2020-03/29/c_78469.htm (accessed on 30 March 2022).
- Han, X.; Fan, Y.; Alwalid, O.; Zhang, X.; Jia, X.; Zheng, Y.; Shi, H. Fibrotic Interstitial Lung Abnormalities at 1-year Follow-up CT after Severe COVID-19. Radiology 2021, 301, E438–E440. [Google Scholar] [CrossRef] [PubMed]
- Sezen, Y.; Bas, M.; Altıparmak, H.; Yildiz, A.; Buyukhatipoglu, H.; Faruk Dag, O.; Kaya, Z.; Aksoy, N. Serum prolidase activity in idiopathic and ischemic cardiomyopathy patients. J. Clin. Lab. Anal. 2010, 24, 213–218. [Google Scholar] [CrossRef] [PubMed]
- Gencer, M.; Aksoy, N.; Dagli, E.C.; Uzer, E.; Aksoy, S.; Selek, S.; Celik, H.; Cakir, H. Prolidase activity dysregulation and its correlation with oxidative–antioxidative status in chronic obstructive pulmonary disease. J. Clin. Lab. Anal. 2011, 25, 8–13. [Google Scholar] [CrossRef]
- Ya’qoub, L.; Elgendy, I.Y.; Pepine, C.J. Sex and gender differences in COVID-19: More to be learned! Am. Heart J. Plus Cardiol. Res. Pract. 2021, 3, 100011. [Google Scholar] [CrossRef]
- Team, E. The epidemiological characteristics of an outbreak of 2019 novel coronavirus diseases (COVID-19)—China, 2020. China CDC Wkly. 2020, 2, 113–122. [Google Scholar]
- Alkhouli, M.; Nanjundappa, A.; Annie, F.; Bates, M.C.; Bhatt, D.L. Sex differences in case fatality rate of COVID-19: Insights from a multinational registry. In Mayo Clinic Proceedings; Elsevier: Amsterdam, The Netherlands, 2020; Volume 95, pp. 1613–1620. [Google Scholar]
- Amin, B.J.H.; Kakamad, F.H.; Ahmed, G.S.; Ahmed, S.F.; Abdulla, B.A.; Mikael, T.M.; Salih, R.Q.; Salh, A.M.; Hussein, D.A. Post COVID-19 pulmonary fibrosis; a meta-analysis study. Ann. Med. Surg. 2022, 77, 103590. [Google Scholar]
- Guan, W.J.; Ni, Z.Y.; Hu, Y.; Liang, W.H.; Ou, C.Q.; He, J.X.; Liu, L.; Shan, H.; Lei, C.L.; Hui, D.S.; et al. Clinical characteristics of coronavirus disease 2019 in China. New Engl. J. Med. 2020, 382, 1708–1720. [Google Scholar] [CrossRef]
- Huang, C.; Wang, Y.; Li, X.; Ren, L.; Zhao, J.; Hu, Y.; Zhang, L.; Fan, G.; Xu, J.; Gu, X. Clinical features of patients infected with 2019 novel coronavirus in Wuhan, China. Lancet 2020, 395, 497–506. [Google Scholar] [CrossRef]
- Li, L.Q.; Huang, T.; Wang, Y.Q.; Wang, Z.P.; Liang, Y.; Huang, T.B.; Zhang, H.Y.; Sun, W.; Wang, Y. COVID-19 patients’ clinical characteristics, discharge rate, and fatality rate of meta-analysis. J. Med. Virol. 2020, 92, 577–583. [Google Scholar] [CrossRef]
- Batur, E.B.; Korez, M.K.; Gezer, I.A.; Levendoglu, F.; Ural, O. Musculoskeletal symptoms and relationship with laboratory findings in patients with COVID-19. Int. J. Clin. Pract. 2021, 75, e14135. [Google Scholar] [CrossRef]
- Zhou, F.; Yu, T.; Du, R.; Fan, G.; Liu, Y.; Liu, Z.; Xiang, J.; Wang, Y.; Song, B.; Gu, X. Clinical course and risk factors for mortality of adult inpatients with COVID-19 in Wuhan, China: A retrospective cohort study. Lancet 2020, 395, 1054–1062. [Google Scholar] [CrossRef]
- Teker, A.G.; Emecen, A.N.; Girgin, S.; Şimşek-Keskin, H.; Şiyve, N.; Sezgin, E.; Başoğlu, E.; Yıldırım-Karalar, K.; Appak, Ö.; Zeka, A.N. Türkiye’de Bir Üniversite Hastanesinde COVID-19 Olgularının Epidemiyolojik Özellikleri. Klimik J. 2021, 34, 61–68. [Google Scholar]
- Huang, W.; Wu, Q.; Chen, Z.; Xiong, Z.; Wang, K.; Tian, J.; Zhang, S. The potential indicators for pulmonary fibrosis in survivors of severe COVID-19. J. Infect. 2021, 82, e5–e7. [Google Scholar] [CrossRef] [PubMed]
- Wong, K.-t.; Antonio, G.E.; Hui, D.S.; Ho, C.; Chan, P.-n.; Ng, W.-h.; Shing, K.-k.; Wu, A.; Lee, N.; Yap, F. Severe acute respiratory syndrome: Thin-section computed tomography features, temporal changes, and clinicoradiologic correlation during the convalescent period. J. Comput. Assist. Tomogr. 2004, 28, 790–795. [Google Scholar] [CrossRef] [PubMed]
- Li, F.; Deng, J.; Song, Y.; Wu, C.; Yu, B.; Wang, G.; Li, J.; Zhong, Y.; Liang, F. Pulmonary fibrosis in patients with COVID-19: A retrospective study. Front. Cell. Infect. Microbiol. 2022, 12, 1918. [Google Scholar] [CrossRef]
- Ali, R.M.M.; Ghonimy, M.B.I. Post-COVID-19 pneumonia lung fibrosis: A worrisome sequelae in surviving patients. Egyptian J. Radiol. Nucl. Med. 2021, 52, 101. [Google Scholar] [CrossRef]
- Yasin, R.; Gomaa, A.A.K.; Ghazy, T.; Hassanein, S.A.; Khalifa, M.H. Predicting lung fibrosis in post-COVID-19 patients after discharge with follow-up chest CT findings. Egypt. J. Radiol. Nucl. Med. 2021, 52, 118. [Google Scholar] [CrossRef]
Disclaimer/Publisher’s Note: The statements, opinions and data contained in all publications are solely those of the individual author(s) and contributor(s) and not of MDPI and/or the editor(s). MDPI and/or the editor(s) disclaim responsibility for any injury to people or property resulting from any ideas, methods, instructions or products referred to in the content. |
© 2025 by the authors. Licensee MDPI, Basel, Switzerland. This article is an open access article distributed under the terms and conditions of the Creative Commons Attribution (CC BY) license (https://creativecommons.org/licenses/by/4.0/).