
Identification of Clinical and Genomic Features Associated with SARS-CoV-2 Reinfections

 , , ,
, , ,  ,
,  , , , , ,
Abstract
1. Introduction
2. Materials and Methods
2.1. Study Design and Participants
2.2. Clinical Timeline Encoding
2.3. Definitions and Categorization
2.4. SARS-CoV-2 Whole-Genome Sequencing
2.5. Bioinformatic and Phylogenetic Analysis
2.6. Statistical Analyses
3. Results
3.1. Participant Characteristics
3.2. Impact of Vaccination on SARS-CoV-2 Reinfections
3.3. Impact of SARS-CoV-2 Variants on Reinfection Patterns
4. Discussion
5. Conclusions
Supplementary Materials
Author Contributions
Funding
Institutional Review Board Statement
Informed Consent Statement
Data Availability Statement
Acknowledgments
Conflicts of Interest
References
- To, K.K.-W.; Hung, I.F.-N.; Chan, K.-H.; Yuan, S.; To, W.-K.; Tsang, D.N.-C.; Cheng, V.C.-C.; Chen, Z.; Kok, K.-H.; Yuen, K.-Y. Serum Antibody Profile of a Patient with COVID-19 Reinfection. Clin. Infect. Dis. 2020, 72, e659–e662. [Google Scholar] [CrossRef] [PubMed]
- Van Elslande, J.; Vermeersch, P.; Vandervoort, K.; Wawina-Bokalanga, T.; Vanmechelen, B.; Wollants, E.; Laenen, L.; André, E.; Van Ranst, M.; Lagrou, K.; et al. Symptomatic Severe Acute Respiratory Syndrome Coronavirus 2 (SARS-CoV-2) Reinfection by a Phylogenetically Distinct Strain. Clin. Infect. Dis. 2021, 73, 354–356. [Google Scholar] [CrossRef] [PubMed]
- Berber, E.; Ross, T.M. Factors Predicting COVID-19 Vaccine Effectiveness and Longevity of Humoral Immune Responses. Vaccines 2024, 12, 1284. [Google Scholar] [CrossRef] [PubMed]
- Peng, Q.; Zhou, R.; Wang, Y.; Zhao, M.; Liu, N.; Li, S.; Huang, H.; Yang, D.; Au, K.-K.; Wang, H.; et al. Waning Immune Responses against SARS-CoV-2 Variants of Concern among Vaccinees in Hong Kong. EBioMedicine 2022, 77, 103904. [Google Scholar] [CrossRef]
- Pérez-Alós, L.; Armenteros, J.J.A.; Madsen, J.R.; Hansen, C.B.; Jarlhelt, I.; Hamm, S.R.; Heftdal, L.D.; Pries-Heje, M.M.; Møller, D.L.; Fogh, K.; et al. Modeling of Waning Immunity after SARS-CoV-2 Vaccination and Influencing Factors. Nat. Commun. 1 2022, 13, 1614. [Google Scholar] [CrossRef]
- Stamatatos, L.; Czartoski, J.; Wan, Y.-H.; Homad, L.J.; Rubin, V.; Glantz, H.; Neradilek, M.; Seydoux, E.; Jennewein, M.F.; MacCamy, A.J.; et al. MRNA Vaccination Boosts Cross-Variant Neutralizing Antibodies Elicited by SARS-CoV-2 Infection. Science 2021, 372, 1413–1418. [Google Scholar] [CrossRef]
- Bosworth, M.L.; Shenhuy, B.; Walker, A.S.; Nafilyan, V.; Alwan, N.A.; O’Hara, M.E.; Ayoubkhani, D. Risk of New-Onset Long COVID Following Reinfection With Severe Acute Respiratory Syndrome Coronavirus 2: A Community-Based Cohort Study. Open Forum Infect. Dis. 2023, 10, ofad493. [Google Scholar] [CrossRef]
- Regulation (EU) 2016/679 of the European Parliament and of the Council of 27 April 2016 on the protection of natural persons with regard to the processing of personal data and on the free movement of such data (General Data Protection Regulation). Off. J. Eur. Union 2016, L119, 1–88. Available online: https://eur-lex.europa.eu/eli/reg/2016/679/oj (accessed on 11 March 2025).
- Monterde, D.; Vela, E.; Clèries, M.; Garcia-Eroles, L.; Roca, J.; Pérez-Sust, P. Multimorbidity as a Predictor of Health Service Utilization in Primary Care: A Registry-Based Study of the Catalan Population. BMC Fam. Pract. 2020, 21, 39. [Google Scholar] [CrossRef]
- Monterde, D.; Vela, E.; Clèries, M. Adjusted Morbidity Groups: A New Multiple Morbidity Measurement of Use in Primary Care. Aten. Primaria 2016, 48, 674–682. [Google Scholar] [CrossRef]
- López, M.G.; Chiner-Oms, Á.; García de Viedma, D.; Ruiz-Rodriguez, P.; Bracho, M.A.; Cancino-Muñoz, I.; D’Auria, G.; de Marco, G.; García-González, N.; Goig, G.A.; et al. The First Wave of the COVID-19 Epidemic in Spain Was Associated with Early Introductions and Fast Spread of a Dominating Genetic Variant. Nat. Genet. 2021, 53, 1405–1414. [Google Scholar] [CrossRef] [PubMed]
- Ewels, P.A.; Peltzer, A.; Fillinger, S.; Patel, H.; Alneberg, J.; Wilm, A.; Garcia, M.U.; Di Tommaso, P.; Nahnsen, S. The Nf-Core Framework for Community-Curated Bioinformatics Pipelines. Nat. Biotechnol. 2020, 38, 276–278. [Google Scholar] [CrossRef] [PubMed]
- Patel, H.; Monzón, S.; Varona, S.; Espinosa-Carrasco, J.; Garcia, M.U.; Kelly, S.; Heuer, M.L.; Underwood, A.; Gabernet, G.; Ewels, P.; et al. Nf-Core/Viralrecon: Nf-Core/Viralrecon v2.6.0—Rhodium Raccoon, Seqera Labs: Barcelona, Spain. [CrossRef]
- Aksamentov, I.; Roemer, C.; Hodcroft, E.B.; Neher, R.A. Nextclade: Clade Assignment, Mutation Calling and Quality Control for Viral Genomes. J. Open Source Softw. 2021, 6, 3773. [Google Scholar] [CrossRef]
- O’Toole, Á.; Scher, E.; Underwood, A.; Jackson, B.; Hill, V.; McCrone, J.T.; Colquhoun, R.; Ruis, C.; Abu-Dahab, K.; Taylor, B.; et al. Assignment of Epidemiological Lineages in an Emerging Pandemic Using the Pangolin Tool. Virus Evol. 2021, 7, veab064. [Google Scholar] [CrossRef]
- Shu, Y.; McCauley, J. GISAID: Global Initiative on Sharing All Influenza Data—from Vision to Reality. Eurosurveillance 2017, 22, 30494. [Google Scholar] [CrossRef]
- Tamura, K.; Stecher, G.; Kumar, S. MEGA11: Molecular Evolutionary Genetics Analysis Version 11. Mol. Biol. Evol. 2021, 38, 3022–3027. [Google Scholar] [CrossRef]
- Nguyen, L.T.; Schmidt, H.A.; Von Haeseler, A.; Minh, B.Q. IQ-TREE: A Fast and Effective Stochastic Algorithm for Estimating Maximum-Likelihood Phylogenies. Mol. Biol. Evol. 2015, 32, 268–274. [Google Scholar] [CrossRef]
- Wu, F.; Zhao, S.; Yu, B.; Chen, Y.M.; Wang, W.; Song, Z.G.; Hu, Y.; Tao, Z.W.; Tian, J.H.; Pei, Y.Y.; et al. A New Coronavirus Associated with Human Respiratory Disease in China. Nature 2020, 579, 265–269. [Google Scholar] [CrossRef]
- R Core Team. R: A Language and Environment for Statistical Computing 2021; R Foundation for Statistical Computing: Vienna, Austria, 2021. [Google Scholar]
- Van Rossum, G.; Drake, F. Python 3 Reference Manual; CreateSpace: Scotts Valley, CA, USA, 2009; ISBN 1441412697. [Google Scholar]
- Hunter, J.D. Matplotlib: A 2D Graphics Environment. Comput. Sci. Eng. 2007, 9, 90–95. [Google Scholar] [CrossRef]
- Waskom, M.L. Seaborn: Statistical Data Visualization. J. Open Source Softw. 2021, 6, 3021. [Google Scholar] [CrossRef]
- Plotly Technologies Inc. Collaborative Data Science; Plotly Technologies Inc.: Montreal, QC, Canada, 2015. [Google Scholar]
- Kassambara, A. Ggpubr: “ggplot2” Based Publication Ready Plots, version 0.6.0, CRAN: Vienna, Austria, 2023.
- Brunson, J.C. Ggalluvial: Layered Grammar for Alluvial Plots. J. Open Source Softw. 2020, 5, 2017. [Google Scholar] [CrossRef] [PubMed]
- Wilke, C.O. Ggridges: Ridgeline Plots in “Ggplot2”, version 0.5.6, The Comprehensive R Archive Network (CRAN): Vienna, Austria, 2024.
- Wei, J.; Stoesser, N.; Matthews, P.C.; Khera, T.; Gethings, O.; Diamond, I.; Studley, R.; Taylor, N.; Peto, T.E.A.; Walker, A.S.; et al. Risk of SARS-CoV-2 Reinfection during Multiple Omicron Variant Waves in the UK General Population. Nat. Commun. 2024, 15, 1008. [Google Scholar] [CrossRef] [PubMed]
- Peghin, M.; De Martino, M.; Palese, A.; Chiappinotto, S.; Fonda, F.; Gerussi, V.; Sartor, A.; Curcio, F.; Grossi, P.A.; Isola, M.; et al. Antibody Response and Risk of Reinfection over 2 Years among the Patients with First Wave of COVID-19. Clin. Microbiol. Infect. 2024, 30, 522–530. [Google Scholar] [CrossRef]
- Marot, S.; Malet, I.; Leducq, V.; Zafilaza, K.; Sterlin, D.; Planas, D.; Gothland, A.; Jary, A.; Dorgham, K.; Bruel, T.; et al. Rapid Decline of Neutralizing Antibodies against SARS-CoV-2 among Infected Healthcare Workers. Nat. Commun. 2021, 12, 844. [Google Scholar] [CrossRef]
- Turabelidze, G.; Womack, A.J.; Mobley, E.; Garikapaty, V.; Finley, S. SARS-CoV-2 Reinfections during the Delta Variant Surge—Missouri, June-October, 2021. MoMed 2021, 118, 539. [Google Scholar]
- Pulliam, J.R.C.; van Schalkwyk, C.; Govender, N.; von Gottberg, A.; Cohen, C.; Groome, M.J.; Dushoff, J.; Mlisana, K.; Moultrie, H. Increased Risk of SARS-CoV-2 Reinfection Associated with Emergence of Omicron in South Africa. Science 2022, 376, eabn4947. [Google Scholar] [CrossRef]
- Breznik, J.A.; Rahim, A.; Zhang, A.; Ang, J.; Stacey, H.D.; Bhakta, H.; Clare, R.; Liu, L.M.; Kennedy, A.; Hagerman, M.; et al. Early Omicron Infection Is Associated with Increased Reinfection Risk in Older Adults in Long-Term Care and Retirement Facilities. EClinicalMedicine 2023, 63, 102148. [Google Scholar] [CrossRef]
- Ellingson, K.D.; Hollister, J.; Porter, C.J.; Khan, S.M.; Feldstein, L.R.; Naleway, A.L.; Gaglani, M.; Caban-Martinez, A.J.; Tyner, H.L.; Lowe, A.A.; et al. Risk Factors for Reinfection with SARS-CoV-2 Omicron Variant among Previously Infected Frontline Workers—Volume 29, Number 3—March 2023—Emerging Infectious Diseases Journal—CDC. Emerg. Infect. Dis. 2023, 29, 599–604. [Google Scholar] [CrossRef]
- Sacco, C.; Petrone, D.; Del Manso, M.; Mateo-Urdiales, A.; Fabiani, M.; Bressi, M.; Bella, A.; Pezzotti, P.; Rota, M.C.; Riccardo, F.; et al. Risk and Protective Factors for SARS-CoV-2 Reinfections, Surveillance Data, Italy, August 2021 to March 2022. Eurosurveillance 2022, 27, 2200372. [Google Scholar] [CrossRef]
- de Rioja, V.L.; Perramon-Malavez, A.; Alonso, S.; Andrés, C.; Antón, A.; Bordoy, A.E.; Càmara, J.; Cardona, P.J.; Català, M.; López, D.; et al. Mathematical Modeling of SARS-CoV-2 Variant Substitutions in European Countries: Transmission Dynamics and Epidemiological Insights. Front. Public Health 2024, 12, 1339267. [Google Scholar] [CrossRef]
- Chu, R.Y.K.; Szeto, K.C.; Wong, I.O.L.; Chung, P.H. A Global Scale COVID-19 Variants Time-Series Analysis across 48 Countries. Front. Public Health 2023, 11, 1085020. [Google Scholar] [CrossRef] [PubMed]
- Nguyen, N.N.; Nguyen, Y.N.; Hoang, V.T.; Million, M.; Gautret, P. SARS-CoV-2 Reinfection and Severity of the Disease: A Systematic Review and Meta-Analysis. Viruses 2023, 15, 967. [Google Scholar] [CrossRef] [PubMed]
- Wu, C.; Qian, Y. The Gender Peak Effect: Women Are Most Vulnerable to Infections during COVID-19 Peaks. Front. Public Health 2022, 10, 937179. [Google Scholar] [CrossRef] [PubMed]
- Bertakis, K.D.; Azari, R.; Helms, L.J.; Callahan, E.J.; Robbins, J.A. Gender Differences in the Utilization of Health Care Services. J. Fam. Pract. 2000, 49, 147–152. [Google Scholar]
- Seko, R.; Hashimoto, S.; Kawado, M.; Murakami, Y.; Hayashi, M.; Kato, M.; Noda, T.; Ojima, T.; Nagai, M.; Tsuji, I. Trends in Life Expectancy With Care Needs Based on Long-Term Care Insurance Data in Japan. J. Epidemiol. 2012, 22, 238. [Google Scholar] [CrossRef]
- Mensah, A.A.; Lacy, J.; Stowe, J.; Seghezzo, G.; Sachdeva, R.; Simmons, R.; Bukasa, A.; O’Boyle, S.; Andrews, N.; Ramsay, M.; et al. Disease Severity during SARS-COV-2 Reinfection: A Nationwide Study. J. Infect. 2022, 84, 542–550. [Google Scholar] [CrossRef]
- Mohammed, I.; Nauman, A.; Paul, P.; Ganesan, S.; Chen, K.H.; Jalil, S.M.S.; Jaouni, S.H.; Kawas, H.; Khan, W.A.; Vattoth, A.L.; et al. The Efficacy and Effectiveness of the COVID-19 Vaccines in Reducing Infection, Severity, Hospitalization, and Mortality: A Systematic Review. Hum. Vaccin. Immunother. 2022, 18, 2027160. [Google Scholar] [CrossRef]
- Omoike, E.; Miceli, A.; Busen, K.; Kohrman, A.; Sharma, M.; Harrington, P. Relative Risk of COVID-19 Reinfection by Demographic and Vaccination Factors During the Period March 2020-October 2022. J. Community Health 2024, 49, 339–342. [Google Scholar] [CrossRef]
- Trigueros, M.; Pradenas, E.; Palacín, D.; Muñoz-López, F.; Ávila-Nieto, C.; Trinité, B.; Bonet-Simó, J.M.; Isnard, M.; Moreno, N.; Marfil, S.; et al. Reduced Humoral Response 3 Months Following BNT162b2 Vaccination in SARS-CoV-2 Uninfected Residents of Long-Term Care Facilities. Age Ageing 2022, 51, afac101. [Google Scholar] [CrossRef]
- Uludağ, M.; Incitti, R.; Gao, X.; Heeney, J.L.; Gojobori, T.; Alam, I. Global Surveillance of Emerging SARS-CoV-2 Variants. Bull. World Health Organ. 2024, 102, 374. [Google Scholar] [CrossRef]


| Concept | Definition |
|---|---|
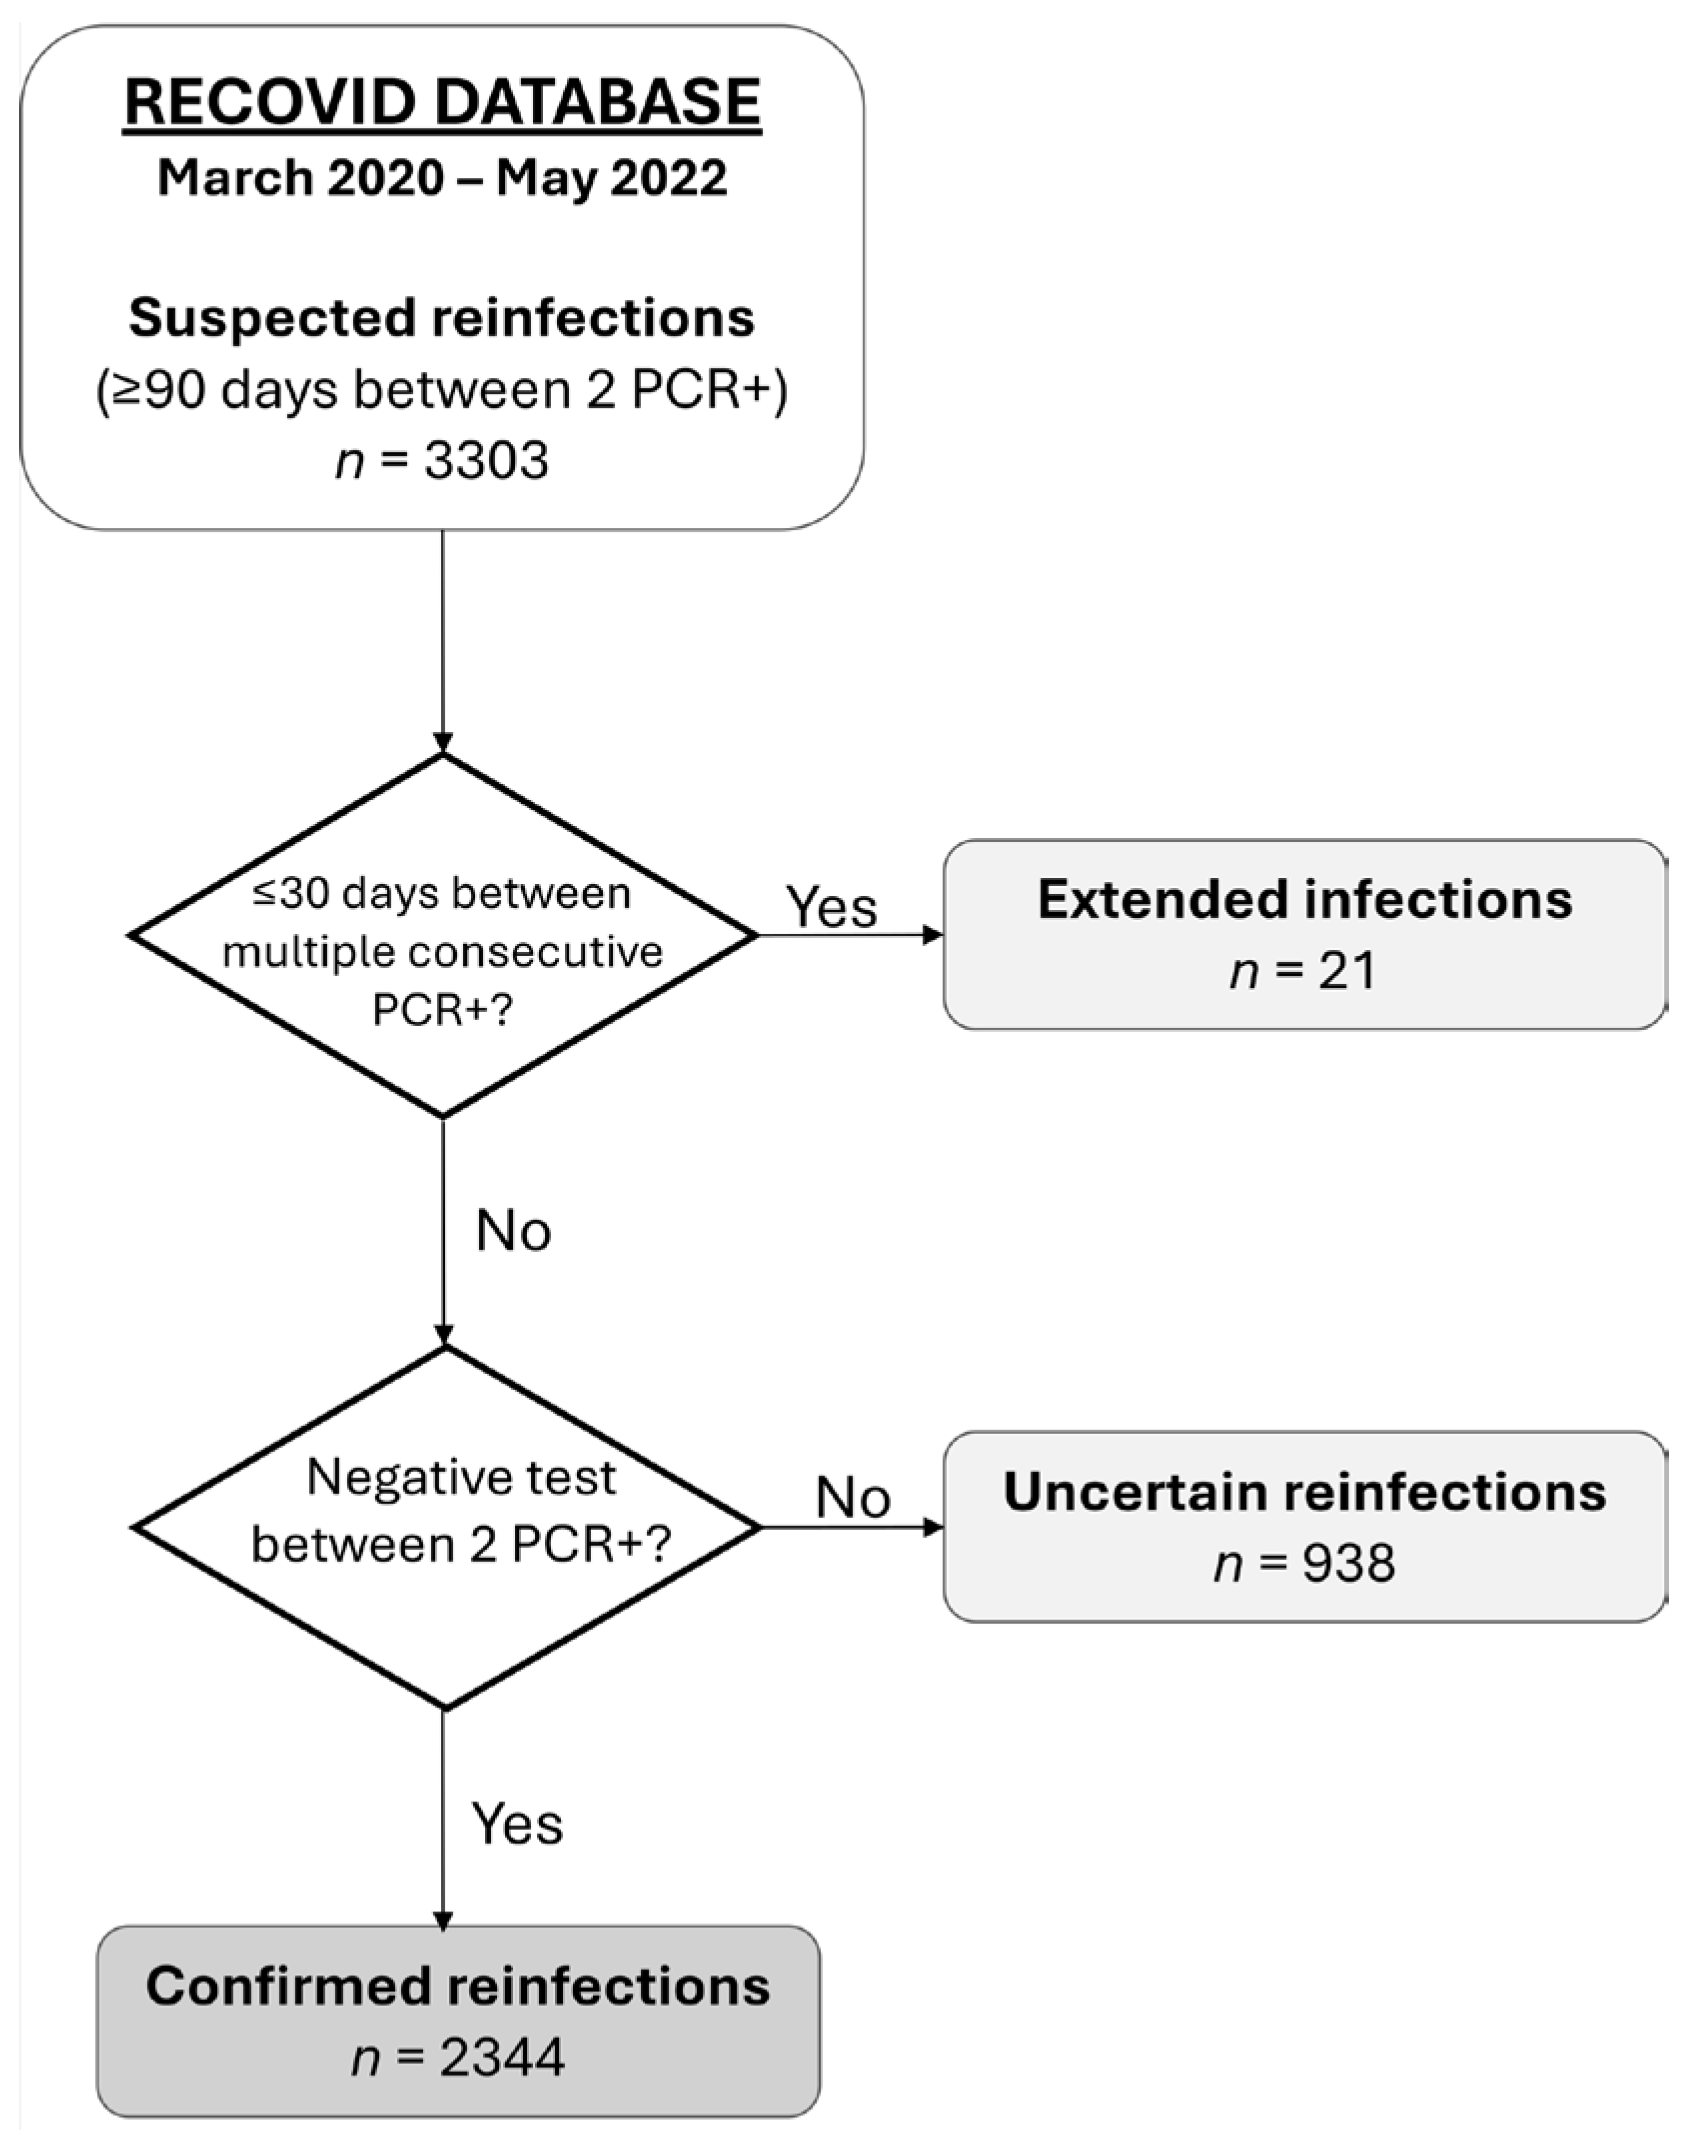
| Reinfection | Reinfection occurs when a person contracts SARS-CoV-2 infection, recovers, and becomes infected again. In our cohort, we define reinfection as two positive PCR tests separated by at least 90 days, with a negative test in between. |
| Extended infection | An extended infection is a single infection episode, lasting longer than usual, defined by at least two positive PCR tests separated by less than 30 days. Participants with extended infection were identified by reviewing complex cases in our cohort. |
| Complete vaccination schedule | A complete vaccination schedule was defined as receiving two doses of BNT162b2 (Pfizer-BioNTech, Mainz, Germany), mRNA-1273 (Moderna, Cambridge, MA, USA), and/or AZD1222 (AstraZeneca, Cambridge, United Kingdom), or a single dose of Ad26.COV2.S (Janssen, Leiden, The Netherlands) vaccine, with at least 14 days elapsed since the final dose. |
| Breakthrough infection | A breakthrough infection occurs when a fully vaccinated individual contracts SARS-CoV-2 at least two weeks after the final dose (first dose of viral vector vaccine or second dose of mRNA vaccine). |
| Partial breakthrough infection | A partial breakthrough infection occurs when a partially vaccinated individual contracts SARS-CoV-2, either after a single dose of an mRNA vaccine or less than two weeks after the final dose (first dose of viral vector vaccine or second dose of mRNA vaccine). |
| Booster dose | A booster dose is an additional vaccine dose after the primary vaccination series to enhance or prolong immunity against SARS-CoV-2. We also regard as a booster dose any dose given after a breakthrough or partial breakthrough infection. |
| Adjusted Morbidity Groups (AMG) [10] | Adjusted Morbidity Groups (AMG) [10] is a measure of a person’s general health status, developed by the Catalan Health Institute. It is based on two indicators: group and complexity. The group categories include “healthy”, “acute disease [of any type]”, “pregnant/giving birth”, “chronic condition in one system”, “chronic condition in two or three systems”, “chronic condition in four or more systems”, and “active neoplasia”. Complexity ranges from 0 to 5, reflecting an individual’s personal healthcare needs. |
| RECOVID | |
|---|---|
| Number of confirmed reinfections (2 episodes), n | 2343 |
| Number of confirmed reinfections (3 episodes), n | 1 |
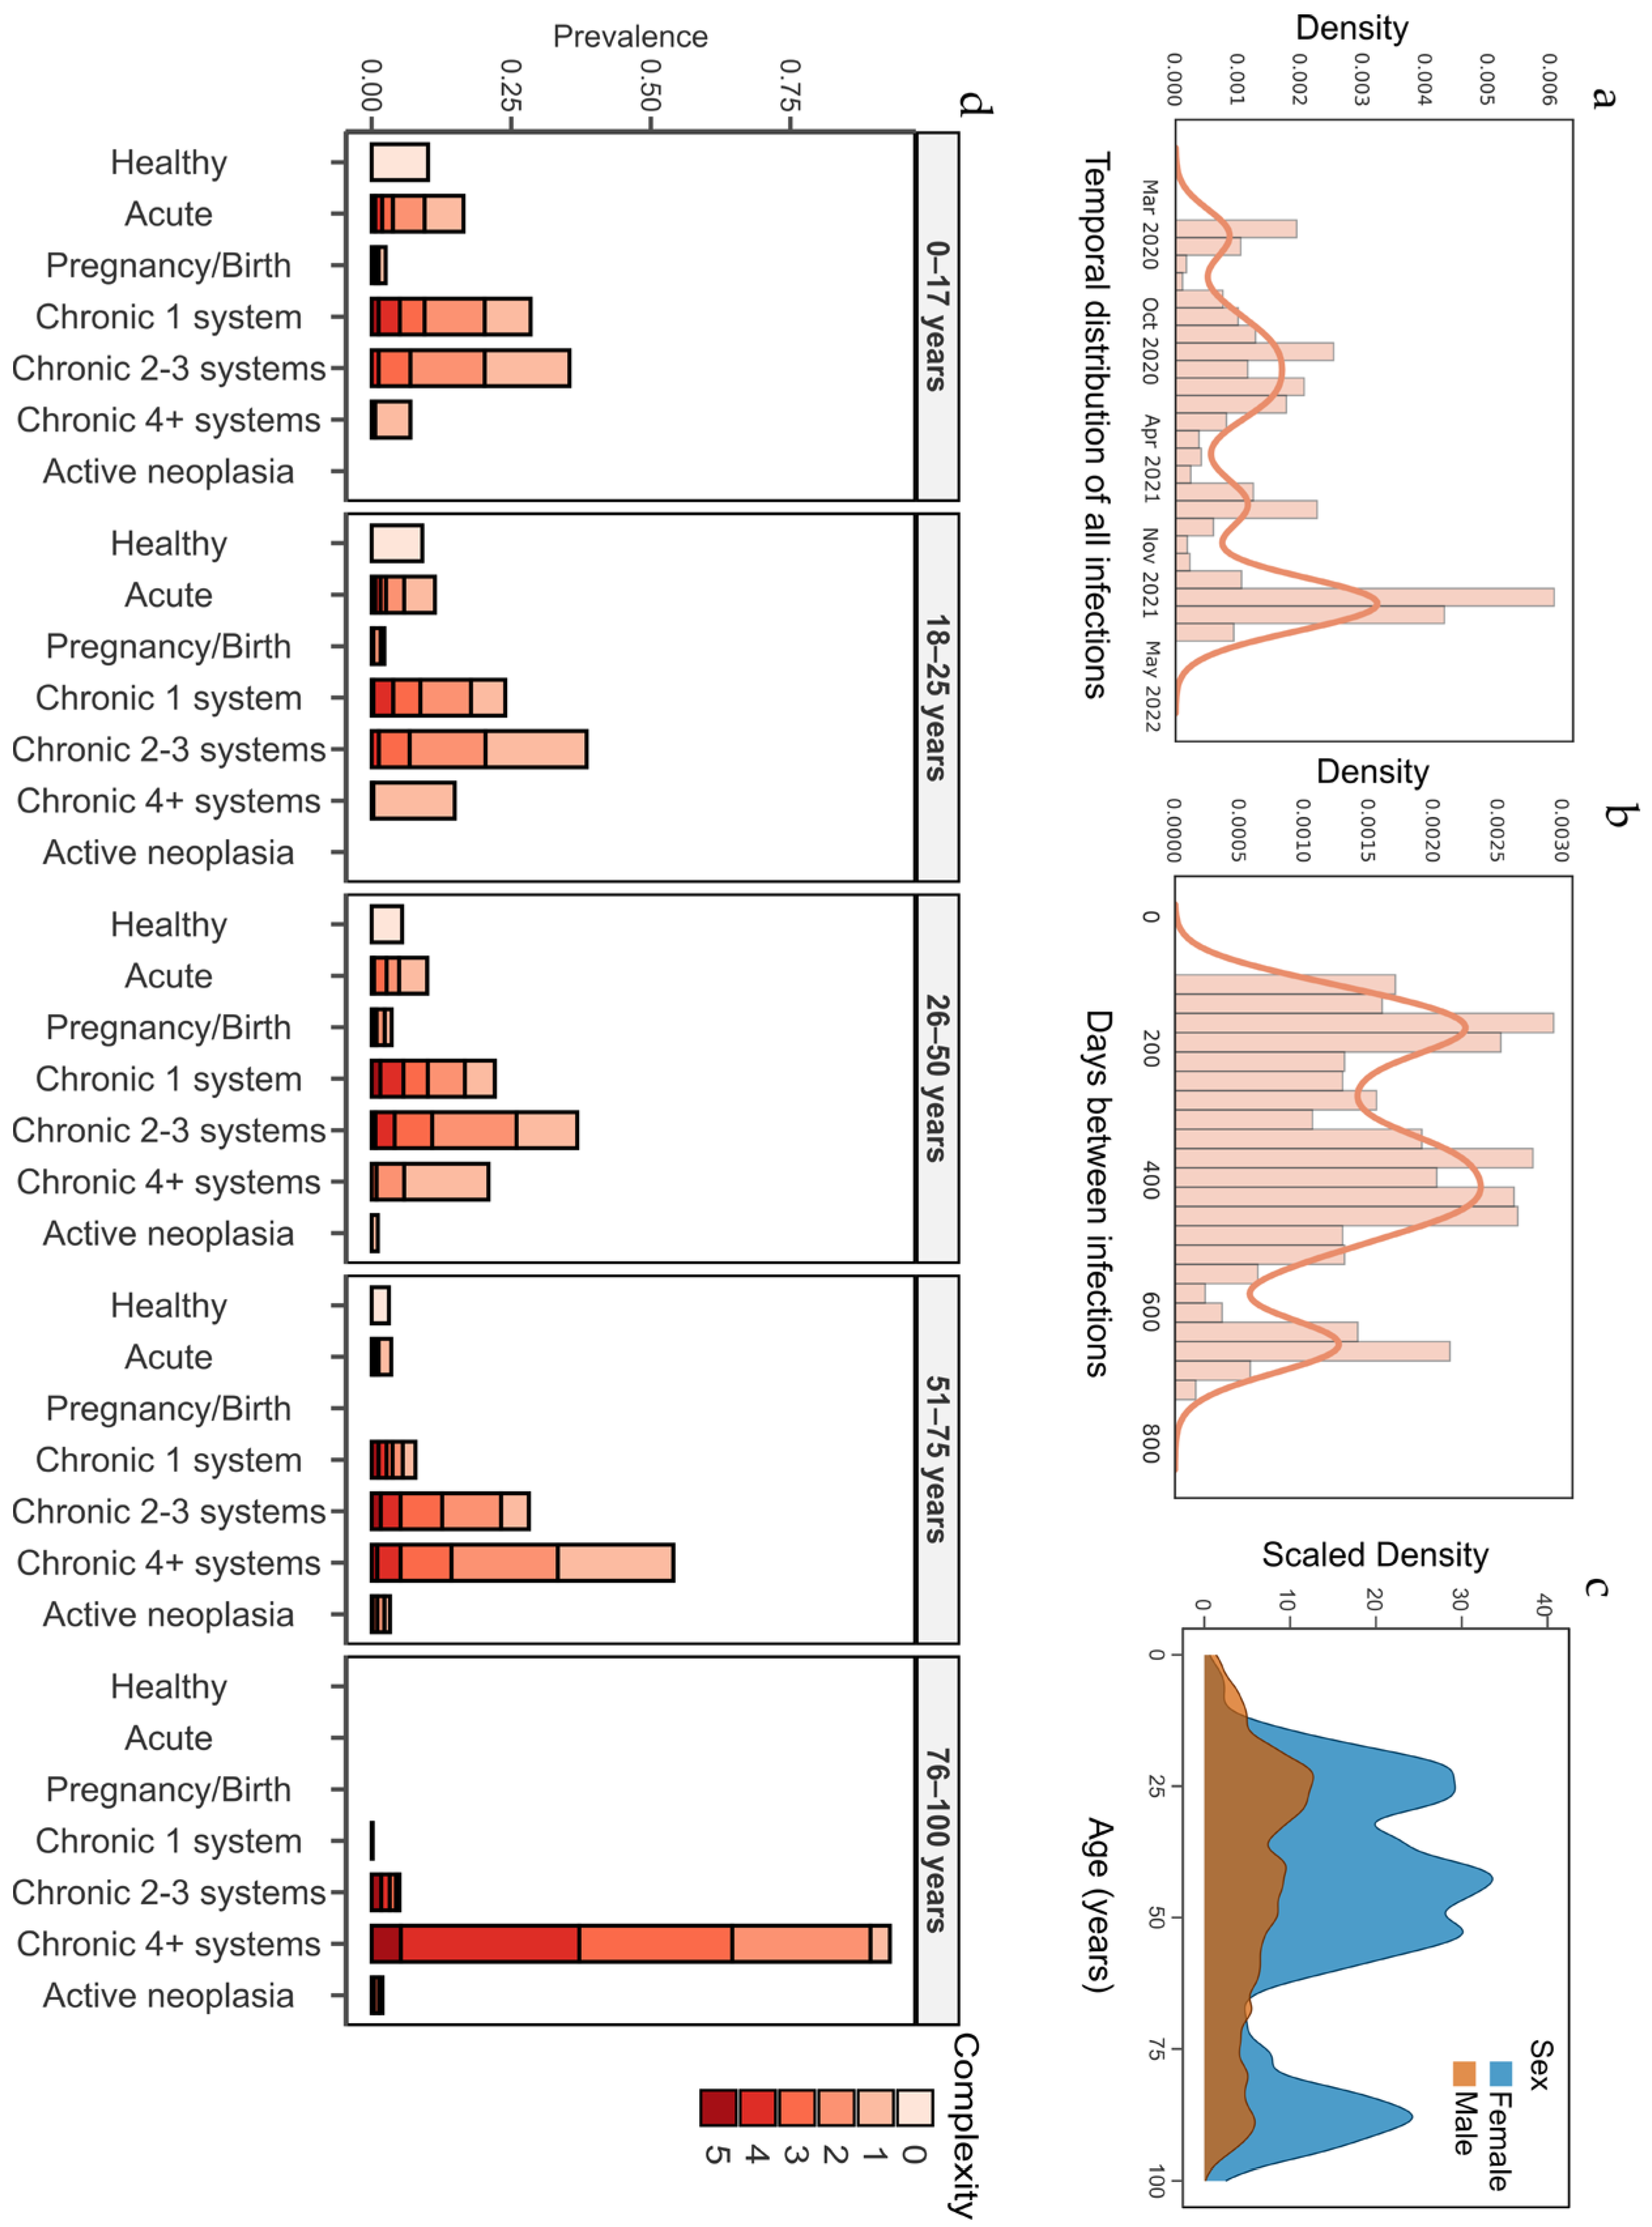
| Sex, females, n (%) | 1692 (72.2) |
| Age in years, median (IQR) | 45 (28–63) |
| Time between infections in days, median (IQR) | 364 (200–464) |
| Hospitalization related to COVID-19, n (%) | 103 (4.4) |
| Hospitalization—first infection, n (%) | 86 (3.6) |
| Hospitalization—second infection, n (%) | 11 (0.5) |
| Hospitalization—both infections, n (%) | 6 (0.3) |
| Vaccinated before first infection 1, n (%) | 421 (18) |
| Vaccinated before second infection 1, n (%) | 1882 (80.3) |
| Prevalence (%) | Chi-Square p-Value 2 | ||
|---|---|---|---|
| RECOVID Cohort | Catalonia Population 1 | ||
| AMG | |||
| Healthy | 4 | 17.8 | 0.0001 |
| Acute disease (any) | 7.2 | 8 | 0.1586 |
| Pregnancy/birth | 2.5 | 1.3 | 0.0001 |
| Chronic disease 1 system | 14 | 18.7 | 0.0001 |
| Chronic disease 2–3 systems | 28 | 25.3 | 0.0028 |
| Chronic disease 4+ systems | 42.9 | 24.5 | 0.0001 |
| Active neoplasm (any) | 1.6 | 4.4 | 0.0001 |
| Comorbidities | |||
| Diabetes (Type I and II) | 11.2 | 8.2 | 0.0001 |
| COPD 3 | 3.6 | 4.8 | 0.0059 |
| Asthma | 6.8 | 7 | 0.6809 |
| Ischemic heart disease | 3.8 | 2.9 | 0.0097 |
| Chronic heart failure | 3.5 | 3.4 | 0.7929 |
| High blood pressure | 23.6 | 20.4 | 0.0001 |
| Chronic kidney failure | 0.97 | 4.8 | 0.0001 |
| Cirrhosis | 1.1 | 0.35 | 0.0001 |
| HIV 4 infection | 0.24 | 0.42 | 0.2195 |
| Malignant neoplasm (any) | 2.9 | 7 | 0.0001 |
| Arthritis | 0.9 | 6.3 | 0.0001 |
| Organ transplant (any) | 0.4 | 0.017 | 0.0001 |
| Lineage | Variant | Episode 1 N (%) | Episode 2 N (%) |
|---|---|---|---|
| AA.1 | - | 1 (1.1) | 0 (0) |
| AY.122 | Delta | 0 (0) | 1 (0.9) |
| AY.125 | 1 (1.1) | 1 (0.9) | |
| AY.127 | 0 (0) | 1 (0.9) | |
| AY.36 | 0 (0) | 1 (0.9) | |
| AY.4 | 0 (0) | 1 (0.9) | |
| AY.4.2.3 | 0 (0) | 1 (0.9) | |
| AY.42 | 2 (2.1) | 1 (0.9) | |
| AY.43 | 26 (27.7) | 13 (12.3) | |
| AY.5 | 3 (3.2) | 1 (0.9) | |
| AY.5.4 | 0 (0) | 1 (0.9) | |
| AY.53 | 2 (2.1) | 0 (0) | |
| AY.6 | 1 (1.1) | 0 (0) | |
| AY.71 | 0 (0) | 1 (0.9) | |
| B.1 | - | 1 (1.1) | 0 (0) |
| B.1.1.269 | - | 3 (3.2) | 0 (0) |
| B.1.1.39 | - | 2 (2.1) | 0 (0) |
| B.1.1.406 | - | 1 (1.1) | 0 (0) |
| B.1.1.420 | - | 1 (1.1) | 0 (0) |
| B.1.1.7 | Alpha | 11 (11.7) | 2 (1.9) |
| B.1.160 | - | 1 (1.1) | 0 (0) |
| B.1.617.2 | - | 0 (0) | 1 (0.9) |
| B.1.1.177 | - | 36 (38.3) | 0 (0) |
| BA.1 | Omicron | 0 (0) | 9 (8.5) |
| BA.1.1 | 0 (0) | 22 (20.8) | |
| BA.1.1.1 | 0 (0) | 11 (10.4) | |
| BA.1.15 | 0 (0) | 4 (3.8) | |
| BA.1.17 | 1 (1.1) | 24 (22.6) | |
| BA.1.17.2 | 0 (0) | 5 (4.7) | |
| BA.1.18 | 0 (0) | 1 (0.9) | |
| BA.1.20 | 0 (0) | 1 (0.9) | |
| BA.2 | 0 (0) | 1 (0.9) | |
| BA.2.9 | 0 (0) | 2 (1.9) | |
| P.1.7 | Gamma | 1 (1.1) | 0 (0) |
| Total | 94 | 106 |
| Model 1 | ||||
| Coefficients | ||||
| Estimate | Std. error | p-value | ||
| (Intercept) | 1.15 × 10⁻³ | 1.03 × 10⁻⁵ | <2 × 10⁻¹⁶ | |
| Time | 3.51 × 10⁻⁶ | 4.26 × 10⁻⁸ | <2 × 10⁻¹⁶ | |
| Same individual | 3.24 × 10⁻⁴ | 1.05 × 10⁻⁴ | 0.00198 | |
| Adjusted R-squared | 0.2539 | |||
| F-statistic p-value | <2.2 × 10⁻¹⁶ | |||
| Model 2 | ||||
| Coefficients | ||||
| Estimate | Std. error | p-value | ||
| (Intercept) | 1.59 × 10⁻³ | 1.12 × 10⁻⁵ | <2 × 10⁻¹⁶ | |
| Time | 1.54 × 10⁻⁷ | 2.9 × 10⁻⁸ | 1.98E-07 | |
| Type Alpha–Delta | 6.57 × 10⁻⁴ | 1.30 × 10⁻⁵ | <2 × 10⁻¹⁶ | |
| Type Alpha–Omicron | 1.01 × 10⁻³ | 1.29 × 10⁻⁵ | <2 × 10⁻¹⁶ | |
| Type B.1.177–B.1.177 | −1.17 × 10⁻³ | 1.45 × 10⁻⁵ | <2 × 10⁻¹⁶ | |
| Type B.1.177–Delta | 9.38 × 10⁻⁶ | 1.20 × 10⁻⁵ | 0.436 | |
| Type B.1.177–Omicron | 6.99 × 10⁻⁴ | 1.39 × 10⁻⁵ | <2 × 10⁻¹⁶ | |
| Type Delta–Delta | −1.15 × 10⁻³ | 1.22 × 10⁻⁵ | <2 × 10⁻¹⁶ | |
| Type Delta–Omicron | 1.39 × 10⁻³ | 1.09 × 10⁻⁵ | <2 × 10⁻¹⁶ | |
| Type Omicron–Omicron | −1.25 × 10⁻³ | 1.16 × 10⁻⁵ | <2 × 10⁻¹⁶ | |
| Same individual | −1.44 × 10⁻⁵ | 2.93 × 10⁻⁵ | 0.623 | |
| Adjusted R-squared | 0.9537 | |||
| F-statistic p-value | <2.2 × 10⁻¹⁶ | |||
Disclaimer/Publisher’s Note: The statements, opinions and data contained in all publications are solely those of the individual author(s) and contributor(s) and not of MDPI and/or the editor(s). MDPI and/or the editor(s) disclaim responsibility for any injury to people or property resulting from any ideas, methods, instructions or products referred to in the content. |
© 2025 by the authors. Licensee MDPI, Basel, Switzerland. This article is an open access article distributed under the terms and conditions of the Creative Commons Attribution (CC BY) license (https://creativecommons.org/licenses/by/4.0/).
Share and Cite
Muñoz-López, F.; Bordoy, A.E.; Català-Moll, F.; Saludes, V.; Panisello Yagüe, D.; Parera, M.; Blanco, I.; Cardona, P.-J.; Casañ, C.; Blanco-Suárez, A.; et al. Identification of Clinical and Genomic Features Associated with SARS-CoV-2 Reinfections. Viruses 2025, 17, 840. https://doi.org/10.3390/v17060840
Muñoz-López F, Bordoy AE, Català-Moll F, Saludes V, Panisello Yagüe D, Parera M, Blanco I, Cardona P-J, Casañ C, Blanco-Suárez A, et al. Identification of Clinical and Genomic Features Associated with SARS-CoV-2 Reinfections. Viruses. 2025; 17(6):840. https://doi.org/10.3390/v17060840
Chicago/Turabian StyleMuñoz-López, Francisco, Antoni E. Bordoy, Francesc Català-Moll, Verónica Saludes, David Panisello Yagüe, Mariona Parera, Ignacio Blanco, Pere-Joan Cardona, Cristina Casañ, Ana Blanco-Suárez, and et al. 2025. "Identification of Clinical and Genomic Features Associated with SARS-CoV-2 Reinfections" Viruses 17, no. 6: 840. https://doi.org/10.3390/v17060840
APA StyleMuñoz-López, F., Bordoy, A. E., Català-Moll, F., Saludes, V., Panisello Yagüe, D., Parera, M., Blanco, I., Cardona, P.-J., Casañ, C., Blanco-Suárez, A., Franco, S., García-Jiménez, Á. F., Paredes, R., Clotet, B., Mateu, L., Noguera-Julian, M., Martró, E., Santos, J. R., & Massanella, M. (2025). Identification of Clinical and Genomic Features Associated with SARS-CoV-2 Reinfections. Viruses, 17(6), 840. https://doi.org/10.3390/v17060840