
The Association Between the Ct Value of SARS-CoV-2 and the Risk of Death from COVID-19 in Amazonas, Peru, During the Circulation of the Lambda, Gamma, and Delta Variants


Abstract
1. Introduction
2. Materials and Methods
2.1. Study Design, Population, and Sample
2.2. Data Management and Statistical Analysis
3. Results
4. Discussion
5. Conclusions
Author Contributions
Funding
Institutional Review Board Statement
Informed Consent Statement
Data Availability Statement
Acknowledgments
Conflicts of Interest
References
- Author Johns Hopkins University & Medicine. Coronavirus Resource Center. United States of America. 2023. Available online: https://coronavirus.jhu.edu/map.html (accessed on 2 March 2023).
- Costa, F. Instituto Nacional de Estadística e Informática. Resultados Definitivos-Amazonas. Perú. 2018. Available online: https://www.inei.gob.pe/media/MenuRecursivo/publicaciones_digitales/Est/Lib1567/01TOMO_01.pdf (accessed on 21 June 2021).
- CDC-MINSA, 2022. Sala COVID-19 Perú. Perú. 2023. Available online: https://www.dge.gob.pe/covid19.html (accessed on 2 March 2023).
- GOREA. Sala Situacional COVID-19 Amazonas. Perú. 2022. Available online: https://cdn.www.gob.pe/uploads/document/file/2868458/SALA%20SITUACIONAL%20COVID_19%20%20AMAZONAS%20%2003-03-22_.pdf.pdf?v=1646339081 (accessed on 6 August 2022).
- Campos, C.J.; Pajuelo-Reyes, C.; Rojas, L.M.; De La Cruz-Vargas, J.A.; Tejedo, J.R.; Tapia-Limonchi, R.; Tsukayama, P.; Chenet, S.M. Prevalence of SARS-CoV-2 Variants and Disease Outcome of COVID-19 Patients in the Amazonas Region of Perú. Am. J. Trop. Med. Hyg. 2023, 109, 523–526. [Google Scholar] [CrossRef]
- Organización Mundial de la Salud. Pruebas Diagnósticas para el SARS-CoV-2. Ginebra. 2020. Available online: https://apps.who.int/iris/bitstream/handle/10665/335830/WHO-2019-nCoV-laboratory-2020.6-spa.pdf?sequence=1&isAllowed=y (accessed on 8 August 2022).
- Reina, J.; Suarez, L. Evaluación de diferentes genes en la detección por RT-PCR del SARS-CoV-2 en muestras respiratorias y su evolución en la infección. Rev. Esp. Quimioter. 2020, 33, 292–293. [Google Scholar] [CrossRef]
- Ginzinger, D. Gene quantification using real-time quantitative PCR: An emerging technology hits the mainstream. Exp. Hematol. 2002, 30, 503–512. [Google Scholar] [CrossRef]
- Tom, M.R.; Mina, M.J. To Interpret the SARS-CoV-2 Test, Consider the Cycle Threshold Value. Clin. Infect. Dis. 2020, 71, 2252–2254. [Google Scholar] [CrossRef] [PubMed]
- Rhoads, D.; Peaper, D.R.; She, R.C.; Wojewoda, C.M.; Anderson, N.W.; Pritt, B.S. College of American Pathologists (CAP) Microbiology Committee Perspective: Caution Must Be Used in Interpreting the Cycle Threshold (Ct) Value. Clin. Infect. Dis. 2021, 72, e685–e686. [Google Scholar] [CrossRef] [PubMed]
- Pujadas, E.; Chaudhry, F.; McBride, R.; Richter, F.; Zhao, S.; Wajnberg, A.; Nadkarni, G.; Glicksberg, B.S.; Houldsworth, J.; Cordon-Cardo, C. SARS-CoV-2 viral load predicts COVID-19 mortality. Lancet Respir. Med. 2020, 8, e70. [Google Scholar] [CrossRef] [PubMed]
- Cocconcelli, E.; Castelli, G.; Onelia, F.; Lavezzo, E.; Giraudo, C.; Bernardinello, N.; Fichera, G.; Leoni, D.; Trevenzoli, M.; Saetta, M.; et al. Disease Severity and Prognosis of SARS-CoV-2 Infection in Hospitalized Patients Is Not Associated with Viral Load in Nasopharyngeal Swab. Front. Med. 2021, 8, 714221. [Google Scholar] [CrossRef]
- Magleby, R.; Westblade, L.F.; Trzebucki, A.; Simon, M.S.; Rajan, M.; Park, J.; Goyal, P.; Safford, M.M.; Satlin, M.J. Impact of SARS-CoV-2 Viral Load on Risk of Intubation and Mortality Among Hospitalized Patients with Coronavirus Disease 2019. Clin. Infect Dis. 2021, 73, e4197–e4205. [Google Scholar] [CrossRef]
- Westblade, L.F.; Brar, G.; Pinheiro, L.C.; Paidoussis, D.; Rajan, M.; Martin, P.; Goyal, P.; Sepulveda, J.L.; Zhang, L.; George, G.; et al. SARS-CoV-2 Viral Load Predicts Mortality in Patients with and without Cancer Who Are Hospitalized with COVID-19. Cancer Cell 2020, 38, 661–671.e2. [Google Scholar] [CrossRef]
- Tanner, A.R.; Phan, H.; Brendish, N.J.; Borca, F.; Beard, K.R.; Poole, S.; WClark, T. SARS-CoV-2 viral load at presentation to hospital is independently associated with the risk of death. J. Infect. 2021, 83, 458–466. [Google Scholar] [CrossRef]
- Zhang, J.; Wang, X.; Jia, X.; Li, J.; Hu, K.; Chen, G.; Wei, J.; Gong, Z.; Zhou, C.; Yu, H.; et al. Risk factors for disease severity, unimprovement, and mortality in COVID-19 patients in Wuhan, China. Clin. Microbiol. Infect. 2020, 26, 767–772. [Google Scholar] [CrossRef]
- Zhou, F.; Yu, T.; Du, R.; Fan, G.; Liu, Y.; Liu, Z.; Xiang, J.; Wang, Y.; Song, B.; Gu, X.; et al. Clinical course and risk factors for mortality of adult inpatients with COVID-19 in Wuhan, China: A retrospective cohort study. Lancet 2020, 395, 1054–1062. [Google Scholar] [CrossRef] [PubMed]
- Salazar, M.; Barochiner, J.; Espeche, W.; Ennis, I. COVID-19 and its relationship with hypertension and cardiovascular disease. Hipertens. Riesgo Vasc. 2020, 37, 176–180. [Google Scholar] [CrossRef]
- Bello-Chavolla, O.Y.; Bahena-López, J.P.; Antonio-Villa, N.E.; Vargas-Vázquez, A.; González-Díaz, A.; Márquez-Salinas, A.; Fermín-Martínez, C.A.; Naveja, J.J.; Aguilar-Salinas, C.A. Predicting Mortality Due to SARS-CoV-2: A Mechanistic Score Relating Obesity and Diabetes to COVID-19 Outcomes in Mexico. J. Clin. Endocrinol. Metab. 2020, 105, dgaa346. [Google Scholar] [CrossRef] [PubMed]
- Ministerio de Sanidad. Información Científica-Técnica. Enfermedad por Coronavirus, COVID-19. España. 2021. Available online: https://www.mscbs.gob.es/profesionales/saludPublica/ccayes/alertasActual/nCov/documentos/ITCoronavirus.pdf (accessed on 21 June 2021).
- Zambrano, L.D.; Ellington, S.; Strid, P.; Galang, R.R.; Oduyebo, T.; Tong, V.T.; Woodworth, K.R.; Nahabedian, J.F., 3rd; Azziz-Baumgartner, E.; Gilboa, S.M.; et al. Update: Characteristics of Symptomatic Women of Reproductive Age with Laboratory-Confirmed SARS-CoV-2 Infection by Pregnancy Status-United States, January 22-October 3, 2020. MMWR Morb. Mortal. Wkly. Rep. 2020, 69, 1641–1647. [Google Scholar] [CrossRef] [PubMed]
- Fajnzylber, J.; Regan, J.; Coxen, K.; Corry, H.; Wong, C.; Rosenthal, A.; Worrall, D.; Giguel, F.; Piechocka-Trocha, A.; Atyeo, C.; et al. SARS-CoV-2 viral load is associated with increased disease severity and mortality. Nat. Commun. 2020, 11, 5493. [Google Scholar] [CrossRef]
- Cajamarca-Baron, J.; Guavita-Navarro, D.; Buitrago-Bohorquez, J.; Gallego-Cardona, L.; Navas, A.; Cubides, H.; Arredondo, A.M.; Escobar, A.; Rojas-Villarraga, A. SARS-CoV-2 (COVID-19) en pacientes con algún grado de inmunosupresión [SARS-CoV-2 (COVID-19) in Patients with some Degree of Immunosuppression]. Reumatol. Clin. 2021, 17, 408–419. [Google Scholar] [CrossRef]
- Salvatore, P.; Dawson, P.; Wadhwa, A.; Rabold, E.; Buono, S.; Dietrich, E.; Reses, H.E.; Vuong, J.; Pawloski, L.; Dasu, T.; et al. Epidemiological Correlates of Polymerase Chain Reaction Cycle Threshold Values in the Detection of Severe Acute Respiratory Syndrome Coronavirus 2 (SARS-CoV-2). Clin. Infect. Dis. 2020, 72, e761–e767. [Google Scholar] [CrossRef]
- Tsukagoshi, H.; Shinoda, D.; Saito, M.; Okayama, K.; Sada, M.; Kimura, H.; Saruki, N. Relationships Between Viral Load and the Clinical Course of COVID-19. Viruses 2021, 13, 304. [Google Scholar] [CrossRef]
- Bryan, A.; Fink, S.L.; Gattuso, M.A.; Pepper, G.; Chaudhary, A.; Wener, M.H.; Morishima, C.; Jerome, K.R.; Mathias, P.C.; Greninger, A.L. SARS-CoV-2 Viral Load on Admission Is Associated with 30-Day Mortality. Open Forum Infect. Dis. 2020, 7, ofaa535. [Google Scholar] [CrossRef]
- Kelleni, M.T. SARS-CoV-2 viral load might not be the right predictor of COVID-19 mortality. J. Infect. 2021, 82, e35. [Google Scholar] [CrossRef] [PubMed]
- Shah, V.P.; Farah, W.H.; Hill, J.C.; Hassett, L.C.; Binnicker, M.J.; Yao, J.D.; Murad, M.H. Association Between SARS-CoV-2 Cycle Threshold Values and Clinical Outcomes in Patients with COVID-19: A Systematic Review and Meta-Analysis. Open Forum Infect. Dis. 2021, 8, ofab453. [Google Scholar] [CrossRef]
- He, X.; Lau, E.H.Y.; Wu, P.; Deng, X.; Wang, J.; Hao, X.; Lau, Y.C.; Wong, J.Y.; Guan, Y.; Tan, X.; et al. Temporal dynamics in viral shedding and transmissibility of COVID-19. Nat. Med. 2020, 26, 672–675. [Google Scholar] [CrossRef] [PubMed]
- Walsh, K.A.; Jordan, K.; Clyne, B.; Rohde, D.; Drummond, L.; Byrne, P.; Ahern, S.; Carty, P.G.; O’Brien, K.K.; O’Murchu, E.; et al. SARS-CoV-2 detection, viral load and infectivity over the course of an infection. J. Infect. 2020, 81, 357–371. [Google Scholar] [CrossRef] [PubMed]
- Wölfel, R.; Corman, V.M.; Guggemos, W.; Seilmaier, M.; Zange, S.; Müller, M.A.; Niemeyer, D.; Jones, T.C.; Vollmar, P.; Rothe, C.; et al. Virological assessment of hospitalized patients with COVID-2019. Nature 2020, 581, 465–469. [Google Scholar] [CrossRef]
- Li, H.; Li, Y.; Liu, J.; Liu, J.; Han, J.; Yang, L. Vaccination reduces viral load and accelerates viral clearance in SARS-CoV-2 Delta variant-infected patients. Ann. Med. 2023, 55, 419–427. [Google Scholar] [CrossRef]
- Janes, H.; Fisher, L.H.; Kee, J.J.; Parameswaran, L.; Goepfert, P.A.; Falsey, A.R.; Ludwig, J.; Magaret, C.A.; Gilbert, P.B.; Kublin, J.G.; et al. Association Between SARS-CoV-2 Viral Load and COVID-19 Vaccination in 4 Phase 3 Trials. J. Infect. Dis. 2024, 230, 1384–1389. [Google Scholar] [CrossRef] [PubMed]
- Cruz-Loustaunau, D.; Álvarez-Hernández, G.; Candia-Plata, M.D.C.; Leyva-Gastelum, M. Cycle threshold and viral load in SARS-CoV-2-infected patients in Sonora, Mexico. Gac. Med. Mex. 2023, 159, 226–232. [Google Scholar] [CrossRef]
- Santos Coy-Arechavaleta, A.; Alvarado-Yaah, J.E.; Uribe-Noguez, L.A.; Guerra-Castillo, F.X.; Santacruz-Tinoco, C.E.; Ramón-Gallegos, E.; Muñoz-Medina, J.E.; Fernandes-Matano, L. Relationship Between the Viral Load in Patients with Different COVID-19 Severities and SARS-CoV-2 Variants. Microorganisms 2024, 12, 428. [Google Scholar] [CrossRef]
- Belogiannis, K.; Florou, V.A.; Fragkou, P.C.; Ferous, S.; Chatzis, L.; Polyzou, A.; Lagopati, N.; Vassilakos, D.; Kittas, C.; Tzioufas, A.G.; et al. SARS-CoV-2 Antigenemia as a Confounding Factor in Immunodiagnostic Assays: A Case Study. Viruses 2021, 13, 1143. [Google Scholar] [CrossRef]
- Griffin, D.W.J.; Pai Mangalore, R.; Hoy, J.F.; McMahon, J.H. Immunogenicity, effectiveness, and safety of SARS-CoV-2 vaccination in people with HIV. AIDS 2023, 37, 1345–1360. [Google Scholar] [CrossRef] [PubMed]
- Cortés, A.; Casado, J.L.; Longo, F.; Serrano, J.J.; Saavedra, C.; Velasco, H.; Martin, A.; Chamorro, J.; Rosero, D.; Fernández, M.; et al. Limited T cell response to SARS-CoV-2 mRNA vaccine among patients with cancer receiving different cancer treatments. Eur. J. Cancer 2022, 166, 229–239. [Google Scholar] [CrossRef] [PubMed]
- Brosh-Nissimov, T.; Orenbuch-Harroch, E.; Chowers, M.; Elbaz, M.; Nesher, L.; Stein, M.; Maor, Y.; Cohen, R.; Hussein, K.; Weinberger, M.; et al. BNT162b2 vaccine breakthrough: Clinical characteristics of 152 fully vaccinated hospitalized COVID-19 patients in Israel. Clin. Microbiol. Infect. 2021, 27, 1652–1657. [Google Scholar] [CrossRef] [PubMed]
- Selvavinayagam, S.T.; Yong, Y.K.; Joseph, N.; Hemashree, K.; Tan, H.Y.; Zhang, Y.; Rajeshkumar, M.; Kumaresan, A.; Kalpana, R.; Kalaivani, V.; et al. Low SARS-CoV-2 viral load among vaccinated individuals infected with Delta B.1.617.2 and Omicron BA.1.1.529 but not with Omicron BA.1.1 and BA.2 variants. Front. Public Health 2022, 10, 1018399. [Google Scholar] [CrossRef]
- Mattar, S.; Martinez-Bravo, C.; Rivero, R.; Contreras, H.; Faccini-Martínez, Á.A.; Guzman-Teran, C.; Galeano, K.; Alvis-Guzman, N.; Contreras, V.; Arrieta, G.; et al. Epidemiological and viral features of a cohort of SARS-CoV-2 symptomatic and asymptomatic individuals in an area of the Colombian Caribbean. Ann. Clin. Microbiol. Antimicrob. 2020, 19, 58. [Google Scholar] [CrossRef]


| Patients with Symptomatic COVID-19 (Outpatients and Hospitalized) | Hospitalized Patients | Outpatients | ||||||||||
|---|---|---|---|---|---|---|---|---|---|---|---|---|
| Total (n = 1693) | Survivors (n = 1626) | Deceased (n = 67) | p Value a | Total (n = 273) | Survivors (n = 208) | Deceased (n = 65) | p Value a | Total (n = 1420) | Survivors (n = 1418) | Deceased (n = 2) | p Value a | |
| Demography | ||||||||||||
| Age in years b | 40 [29–54] | 39 [29–53] | 67 [58–82] | <0.001 | 55 [44–68] | 52 [41–64] | 66 [58–81] | <0.001 | 37 [28–50] | 37 [28–50] | 88 [87–89] | <0.015 |
| Ethnicity | ||||||||||||
| Mestizo | 1692 (99.9%) | 1625 (99.9%) | 67 (100%) | 0.839 | 273 (100%) | 208 (100%) | 65 (100%) | NA | 1419 (99.9%) | 1417 (99,9%) | 2 (100%) | 0.97 |
| Indigenous | 1 (0.1%) | 1 (0.1%) | 0 (0%) | 0 (0%) | 0 (0%) | 0 (0%) | 1 (0.1%) | 1 (0.1%) | 0 (0%) | |||
| Sex | ||||||||||||
| Male | 849 (50.2%) | 800 (49.2%) | 49 (73.1%) | <0.001 | 176 (64.5%) | 129 (62%) | 47 (72.3%) | 0.13 | 673 (47.4%) | 671 (47.3%) | 2 (100%) | 0.1136 |
| Female | 844 (49.8%) | 826 (50.8%) | 18 (26.9%) | 97 (35.5%) | 79 (38%) | 18 (27.7%) | 747 (52.6%) | 747 (52.7%) | 0 (0%) | |||
| Pregnancy | 12 (0.7%) | 12 (0.7%) | 0 (0%) | 0.48 | 2 (0.7%) | 2 (1%) | 0 (0%) | 0.427 | 10 (0.7%) | 10 (0.7%) | 0 (0%) | 0.905 |
| Occupational group | ||||||||||||
| High level of exposure to SARS-CoV-2 c | 489 (28.9%) | 473 (29.1%) | 16 (23.9%) | 0.357 | 64 (234 %) | 48 (23.1%) | 16 (24.6%) | 0.798 | 425 (29.9 %) | 425 (30%) | 0 (0%) | 0.355 |
| Low level of exposure to SARS-CoV-2 | 1204 (71.1%) | 1153 (70.9%) | 51 (73.1%) | 209 (76.6%) | 160 (76.9%) | 49 (75.4%) | 995 (70.1%) | 993 (70%) | 2 (100%) | |||
| Comorbidities | ||||||||||||
| Cardiovascular disease | 132 (7.8%) | 119 (7.3%) | 13 (19.4%) | <0.001 | 50 (18.3%) | 38 (18.3%) | 12 (18.5%) | 0.972 | 82 (5.8%) | 81 (5.7%) | 1 (50%) | 0.007 |
| Diabetes | 54 (3.2%) | 47 (2.9%) | 7 (10.5%) | 0.001 | 17 (6.2%) | 10 (4.8%) | 7 (10.8%) | 0.083 | 37 (2.6%) | 37 (2.6%) | 0 (0%) | 0.817 |
| Obesity | 25 (1.5%) | 25 (1.5%) | 0 (0%) | 0.307 | 11 (4%) | 11 (5.3%) | 0 (0%) | 0.058 | 14 (1%) | 14 (1%) | 0 (0%) | 0.888 |
| Other comorbidities | 18 (1.1%) d | 15 (1%) | 3 (4.5%) | NA | 8 (3%) d | 6 (2.9%) | 2 (3%) | NA | 10 (0.7%) d | 9 (0.6%) | 1 (50%) | NA |
| Laboratory data | ||||||||||||
| Cts value gene ORF1ab b | 28.4 [23.4–34.5] | 28.5 [23.5–34.6] | 27.9 [22.0–33.2] | 0.17 | 28.9 [23.4–33.6] | 29.5 [23.7–33.7] | 27.2 [22.0–32.7] | 0.185 | 29 [24.1–34.4] | 29 [24.1–34.5] | 31.2 [29.8–32.7] | 0.602 |
| High Ct (Cts ≥ 28.4) | 847 (50%) | 816 (50.2%) | 31 (46.3%) | 0.53 | 146 (53.5%) | 117 (56.3%) | 29 (44.6%) | 0.101 | 701 (49.4%) | 699 (49.3%) | 2 (100%) | 0.152 |
| Low Ct (Cts < 28.4) | 846 (50%) | 810 (48.8%) | 36 (53.7%) | 127 (46.5%) | 91 (43.7%) | 36 (55.4%) | 719 (50.6%) | 719 (50.7%) | 0 (0%) | |||
| Epidemic dynamics | ||||||||||||
| First wave_High transmission | 155 (9.2%) | 150 (9.2%) | 5 (7.5%) | <0.001 | 27 (9.9%) | 22 (10.6%) | 5 (7.7%) | 0.117 | 128 (9%) | 128 (9%) | 0 (0%) | 0.939 |
| Decline of the first wave_Low transmission | 88 (5.2%) | 82 (5.0%) | 6 (8.9%) | 22 (8.1%) | 16 (7.7%) | 6 (9.2%) | 66 (4.7%) | 66 (4.7%) | 0 (0%) | |||
| Beginning of the second wave_Low transmission | 1180 (69.7%) | 1144 (70.4%) | 36 (53.7%) | 163 (59.7%) | 129 (62.0%) | 34 (52.3%) | 1017 (71.6%) | 1015 (71.6%) | 2 (100%) | |||
| Second wave_High transmission | 148 (8.7%) | 132 (8.1%) | 16 (23.9%) | 40 (14.6%) | 24 (11.5%) | 16 (24.6%) | 108 (7.6%) | 108 (7.6%) | 0 (0%) | |||
| Decline of the second wave_Low transmission | 122 (7.2%) | 118 (7.3%) | 4 (6.0%) | 21 (7.7%) | 17 (8.2%) | 4 (6.2%) | 101 (7.1%) | 101 (7.1%) | 0 (0%) | |||
| Clinical data | ||||||||||||
| Days of symptoms until sample collection b | 5 [4–8] | 5 [4–8] | 6 [4–10] | 0.08 | 6 [4–9] | 6 [4–9] | 6 [4–10] | 0.802 | 5 [4–7] | 5 [4–7] | 2 [1–3] | 0.041 |
| Patients with Symptomatic COVID-19 (Outpatient and Hospitalized) | Patients Hospitalized for COVID-19 | ||||||
|---|---|---|---|---|---|---|---|
| Variable | aHR | Valor p | 95% CI | HRa | Valor p | 95% CI | |
| Ct value a | High Ct (Cts ≥ 28.4) | Reference category | Reference category | ||||
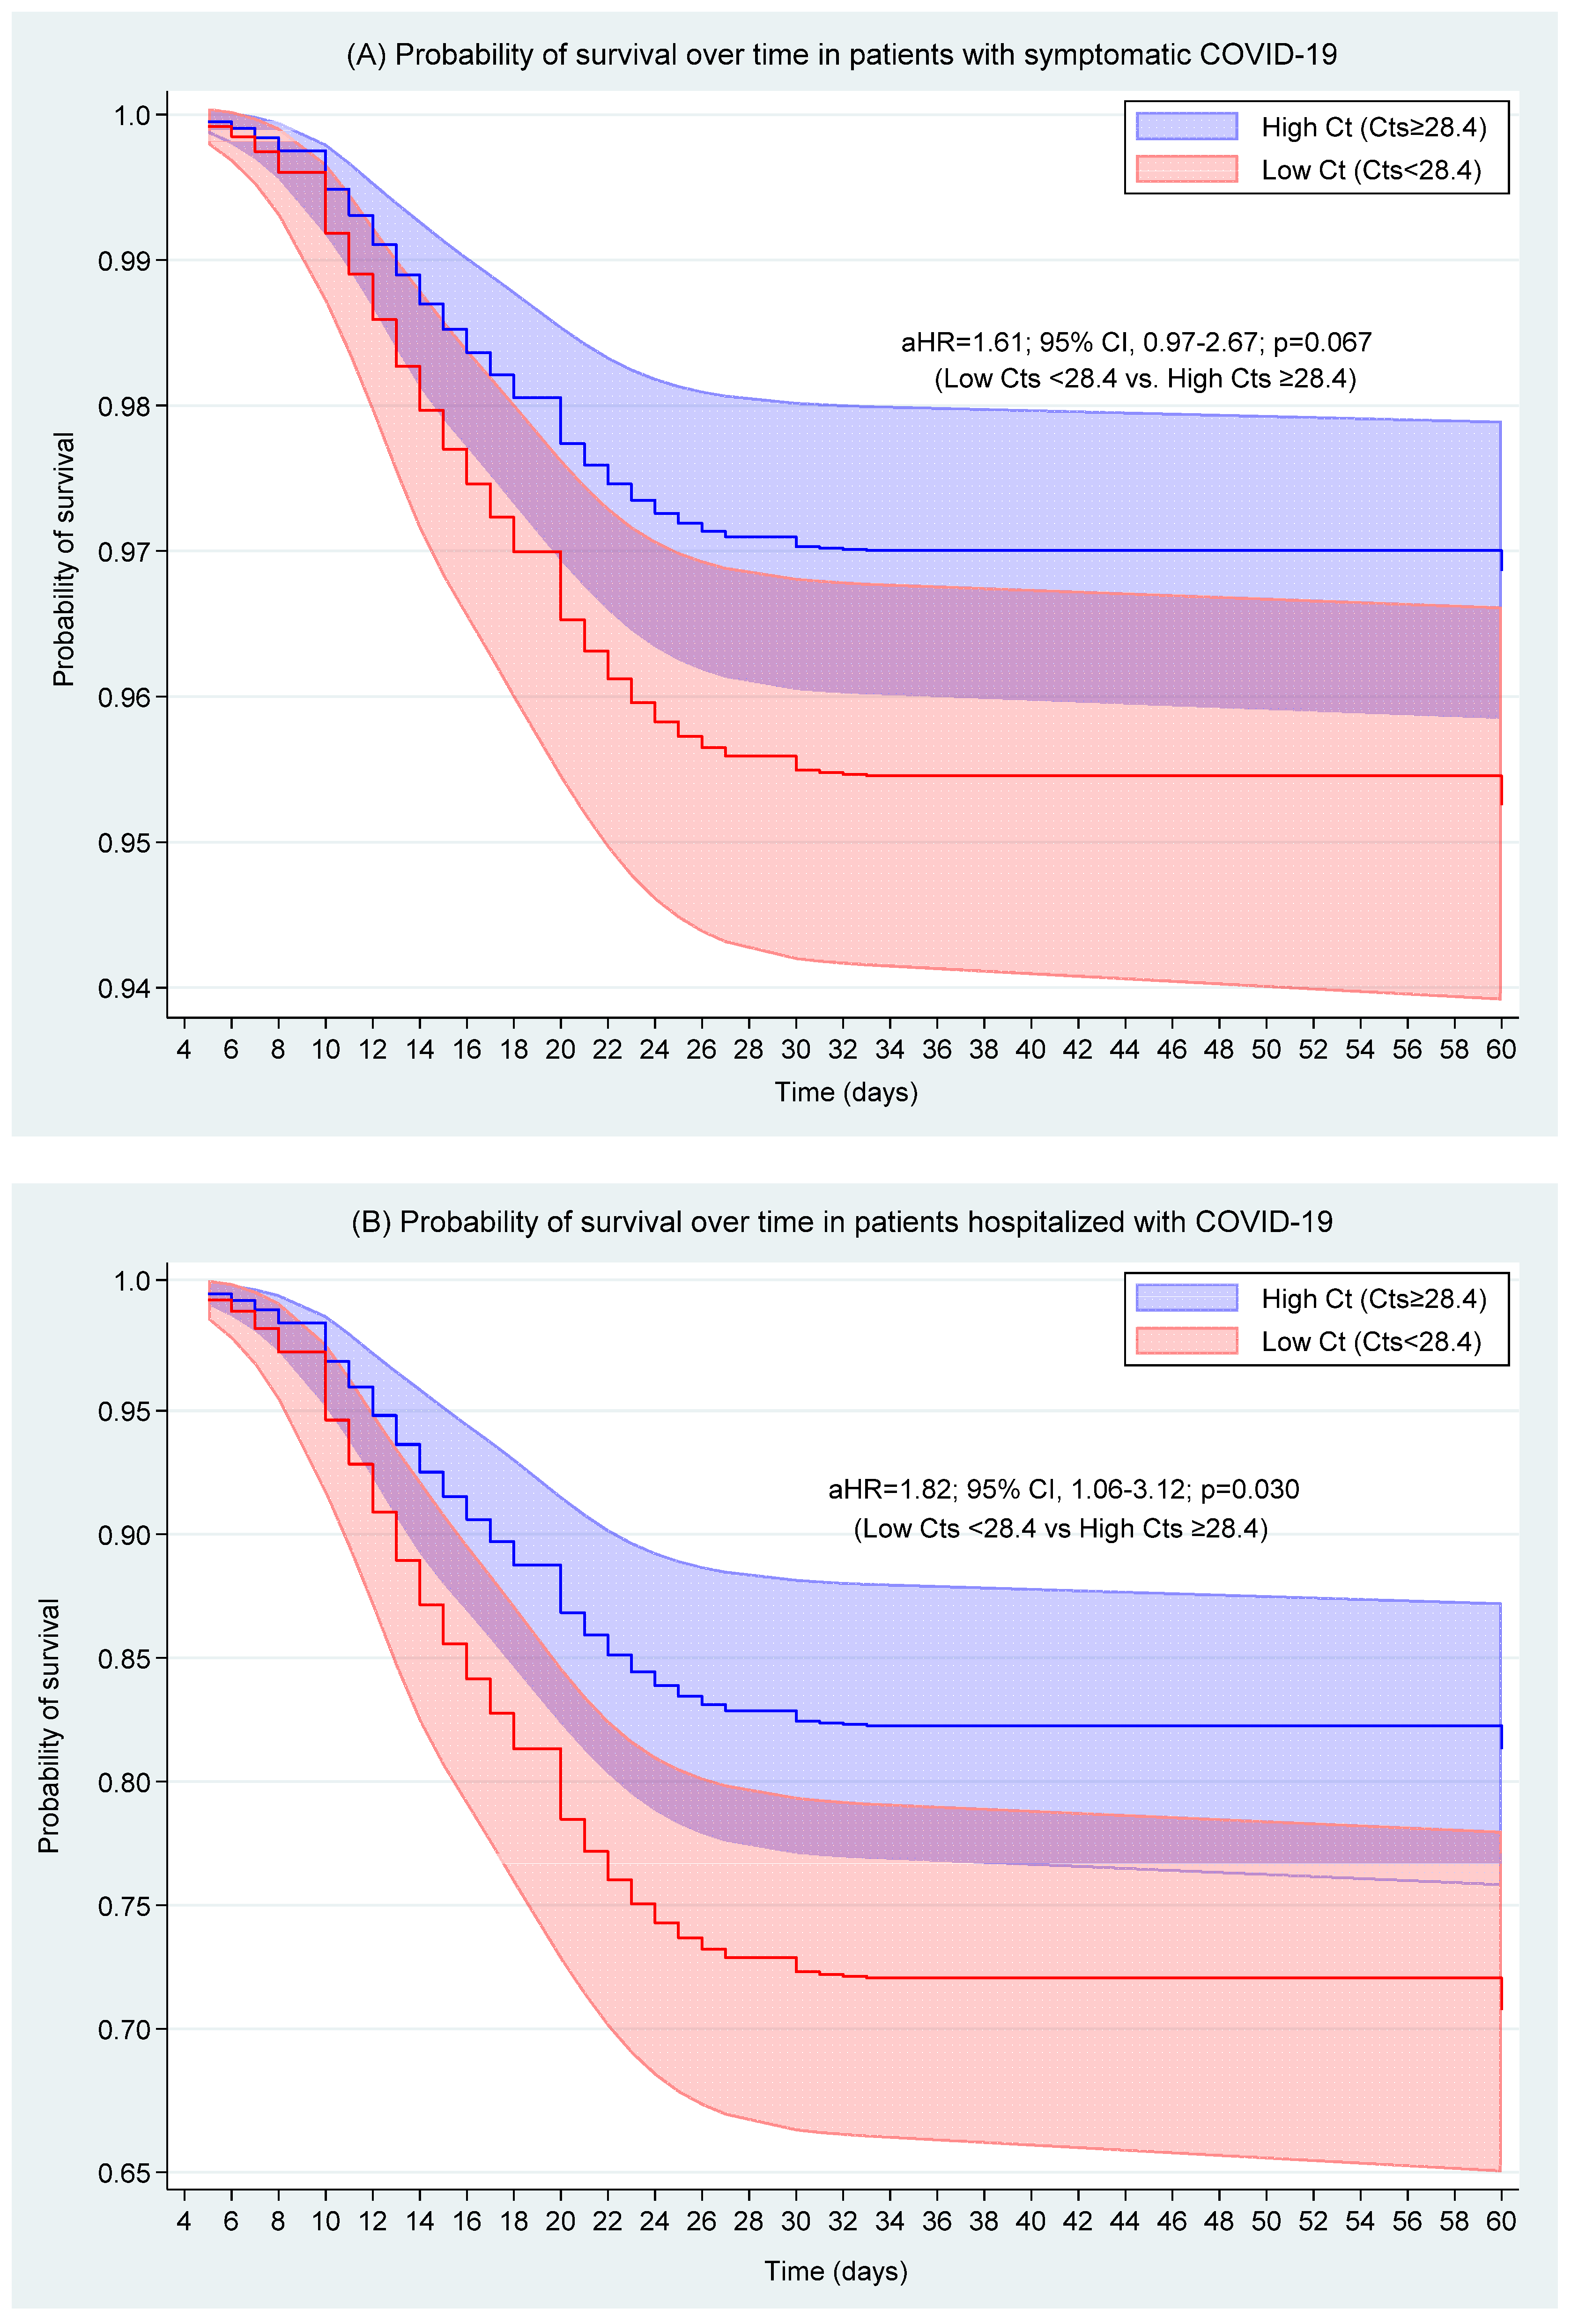
| Low Ct (Cts < 28.4) | 1.61 | 0.067 | 0.97–2.67 | 1.82 | 0.03 | 1.06–3.12 | |
| Age in years | 1.09 | <0.001 | 1.07–1.11 | 1.07 | <0.001 | 1.05–1.09 | |
| Male sex | 2.32 | 0.004 | 1.31–4.13 | 1.33 | 0.346 | 0.74–2.40 | |
| Occupational group with high level of exposure to SARS-CoV-2 | 1.71 | 0.098 | 0.91–3.22 | 2.28 | 0.015 | 0.74–2.40 | |
| Days of symptoms | 1–3 days | Reference category | Reference category | ||||
| 4–7 days | 1.69 | 0.151 | 0.83–3.45 | 1.95 | 0.101 | 0.88–4.33 | |
| 8–15 says | 2.22 | 0.033 | 1.07–4.62 | 1.38 | 0.436 | 0.61–3.11 | |
| Comorbidities | Diabetes | 1.81 | 0.171 | 0.77–4.24 | 1.49 | 0.379 | 0.61–3.64 |
| Cardiovascular disease | 0.82 | 0.565 | 0.43–1.59 | 0.61 | 0.153 | 0.31–1.20 | |
| Epidemic dynamics | Second wave decline | Reference category | Reference category | ||||
| First wave | 0.61 | 0.474 | 0.15–2.39 | 0.36 | 0.152 | 0.09–1.45 | |
| Decline of the first wave | 1.67 | 0.45 | 0.44–6.35 | 1.18 | 0.81 | 0.30–4.62 | |
| Beginning of the second wave | 0.83 | 0.736 | 0.29–2.42 | 0.66 | 0.44 | 0.23–1.90 | |
| Second wave | 2.92 | 0.064 | 0.94–9.04 | 2.12 | 0.19 | 0.69–6.53 | |
Disclaimer/Publisher’s Note: The statements, opinions and data contained in all publications are solely those of the individual author(s) and contributor(s) and not of MDPI and/or the editor(s). MDPI and/or the editor(s) disclaim responsibility for any injury to people or property resulting from any ideas, methods, instructions or products referred to in the content. |
© 2025 by the authors. Licensee MDPI, Basel, Switzerland. This article is an open access article distributed under the terms and conditions of the Creative Commons Attribution (CC BY) license (https://creativecommons.org/licenses/by/4.0/).
Share and Cite
Campos, C.J.; Chenet, S.M.; Montes-Jave, C.; Krapp, F. The Association Between the Ct Value of SARS-CoV-2 and the Risk of Death from COVID-19 in Amazonas, Peru, During the Circulation of the Lambda, Gamma, and Delta Variants. Viruses 2025, 17, 558. https://doi.org/10.3390/v17040558
Campos CJ, Chenet SM, Montes-Jave C, Krapp F. The Association Between the Ct Value of SARS-CoV-2 and the Risk of Death from COVID-19 in Amazonas, Peru, During the Circulation of the Lambda, Gamma, and Delta Variants. Viruses. 2025; 17(4):558. https://doi.org/10.3390/v17040558
Chicago/Turabian StyleCampos, Christian J., Stella M. Chenet, Cecilia Montes-Jave, and Fiorella Krapp. 2025. "The Association Between the Ct Value of SARS-CoV-2 and the Risk of Death from COVID-19 in Amazonas, Peru, During the Circulation of the Lambda, Gamma, and Delta Variants" Viruses 17, no. 4: 558. https://doi.org/10.3390/v17040558
APA StyleCampos, C. J., Chenet, S. M., Montes-Jave, C., & Krapp, F. (2025). The Association Between the Ct Value of SARS-CoV-2 and the Risk of Death from COVID-19 in Amazonas, Peru, During the Circulation of the Lambda, Gamma, and Delta Variants. Viruses, 17(4), 558. https://doi.org/10.3390/v17040558