
Turkey B Cell Transcriptome Profile During Turkey Hemorrhagic Enteritis Virus (THEV) Infection Highlights Upregulated Apoptosis and Breakdown Pathways That May Mediate Immunosuppression


Abstract
1. Introduction
2. Materials and Methods
2.1. Cell Culture and Infection
2.2. RNA Extraction and Sequencing
2.3. Quality Control and Mapping Process
2.4. DEG Analysis and Functional Enrichment Analysis
2.5. Validation of DEGs by Reverse Transcriptase Quantitative PCR (RT-qPCR)
2.6. Statistical Analysis
3. Results
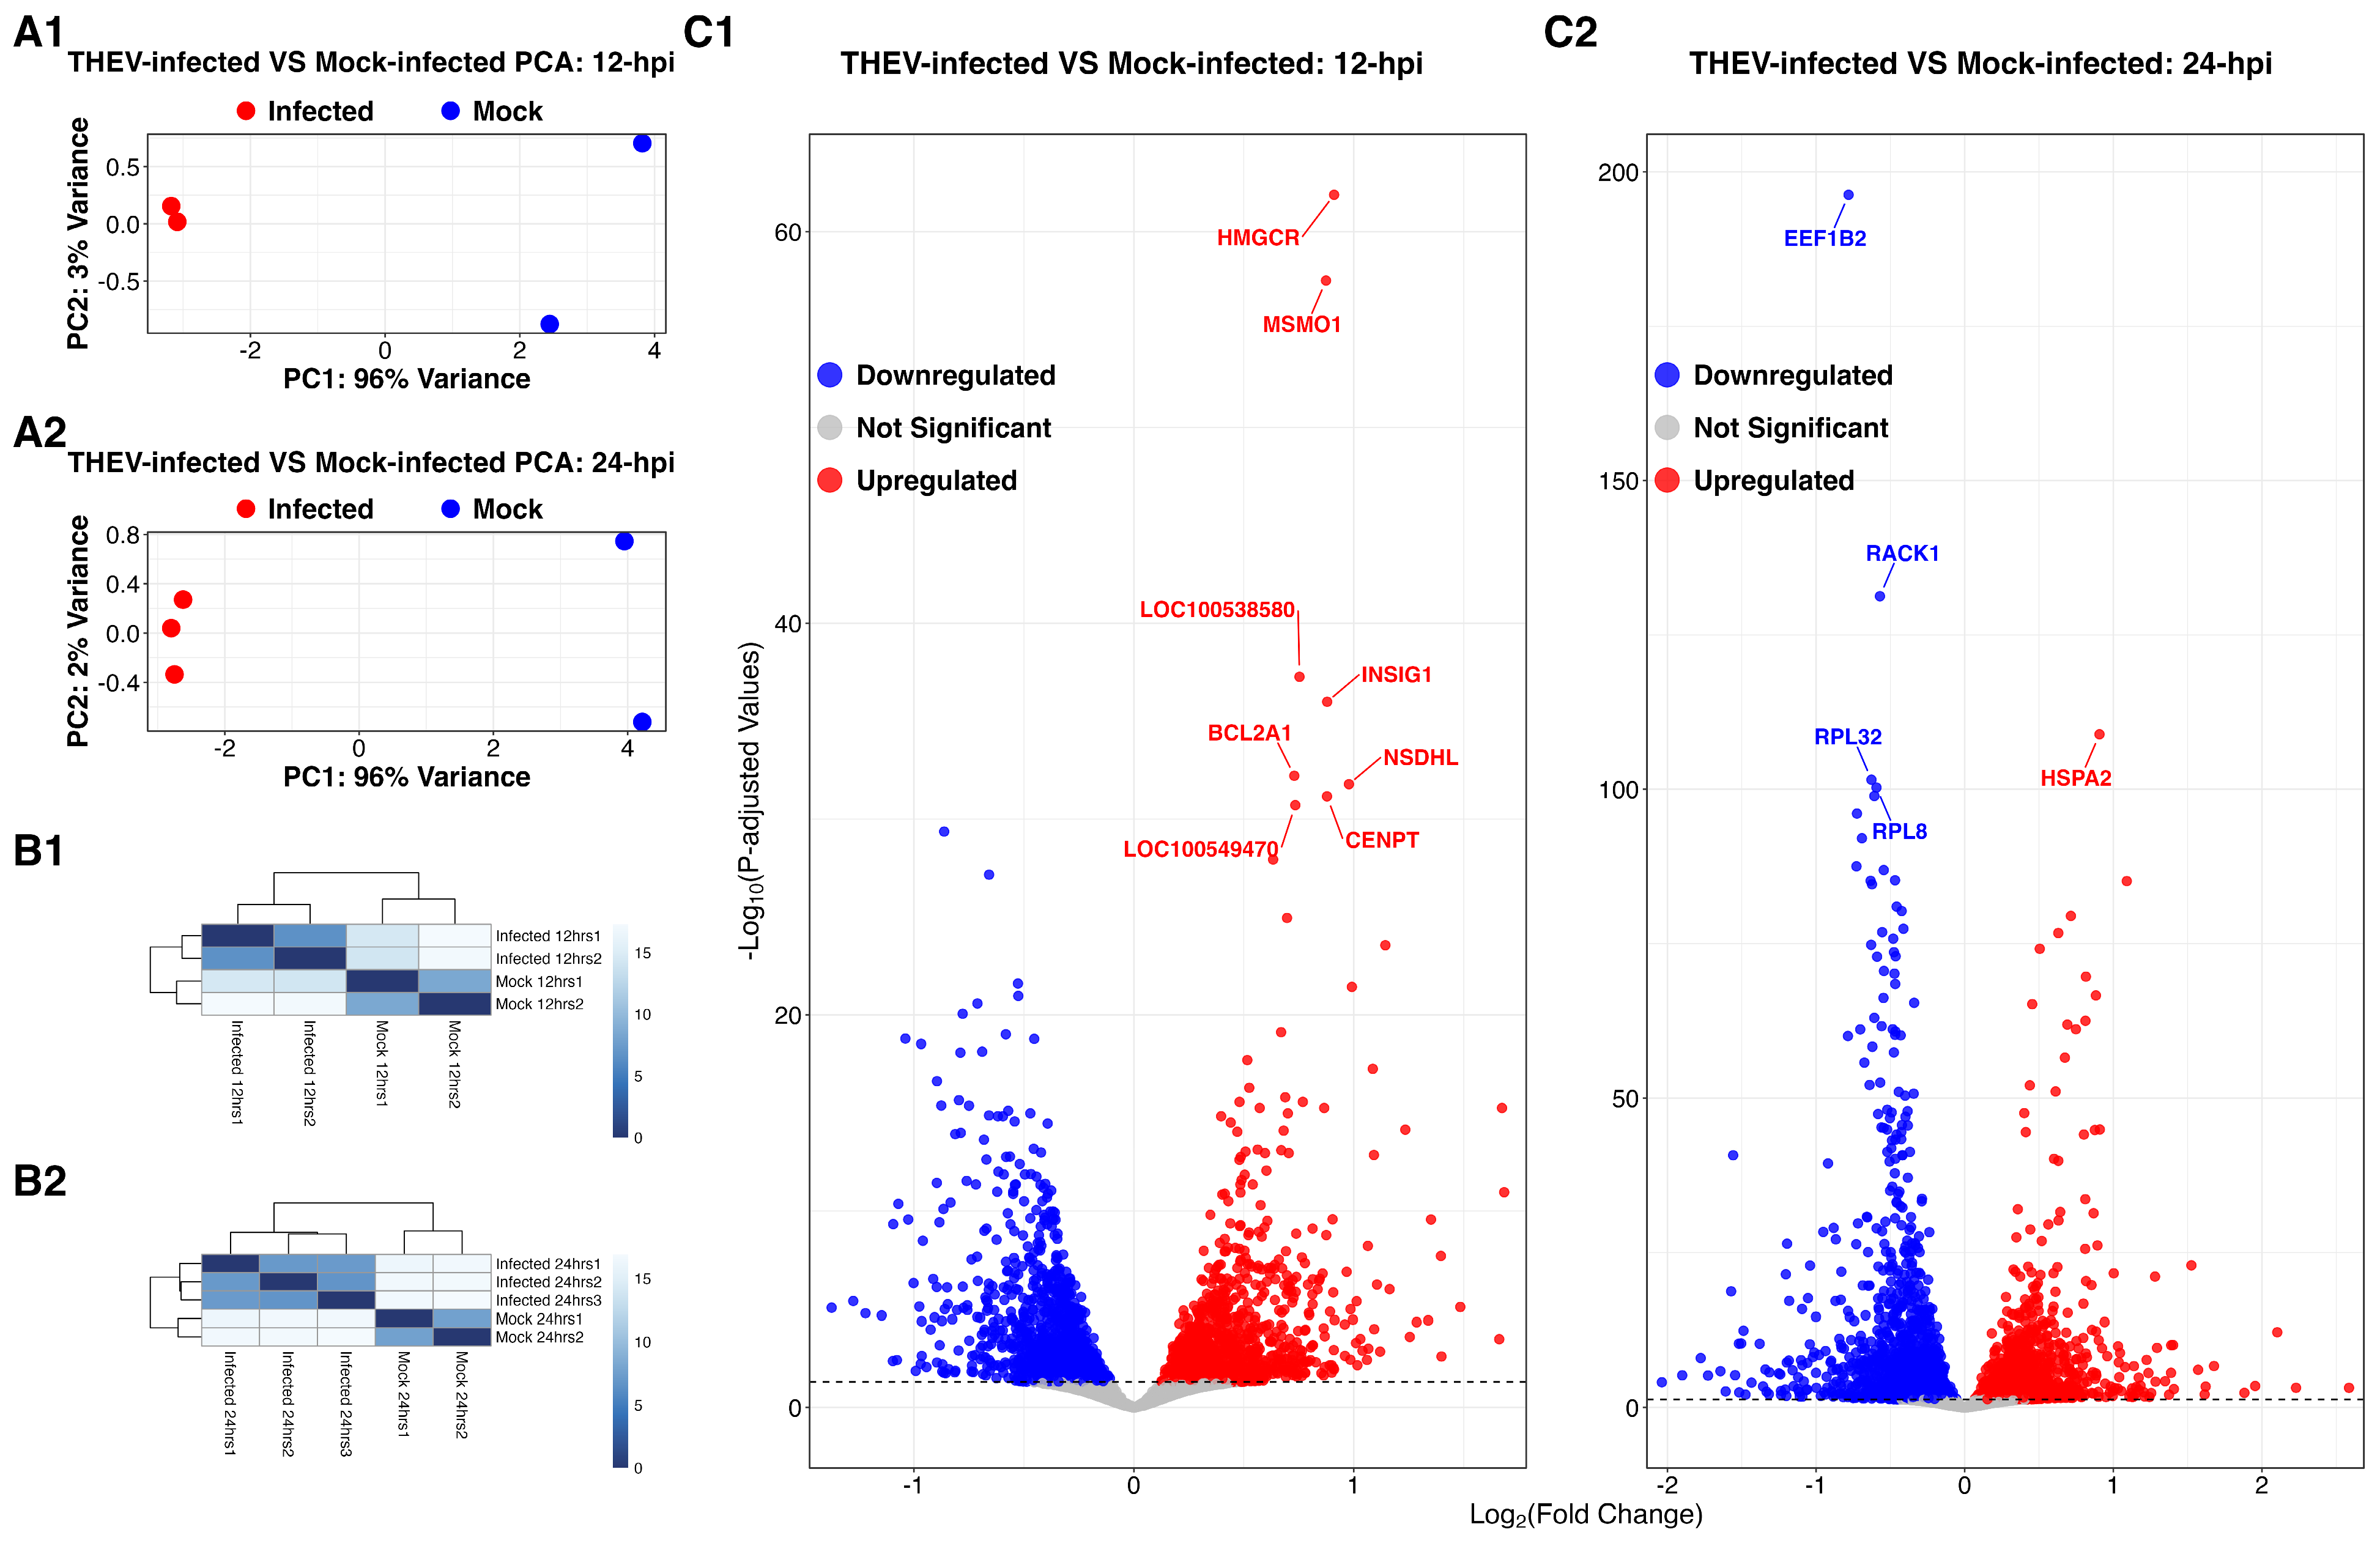
3.1. Sequencing Results
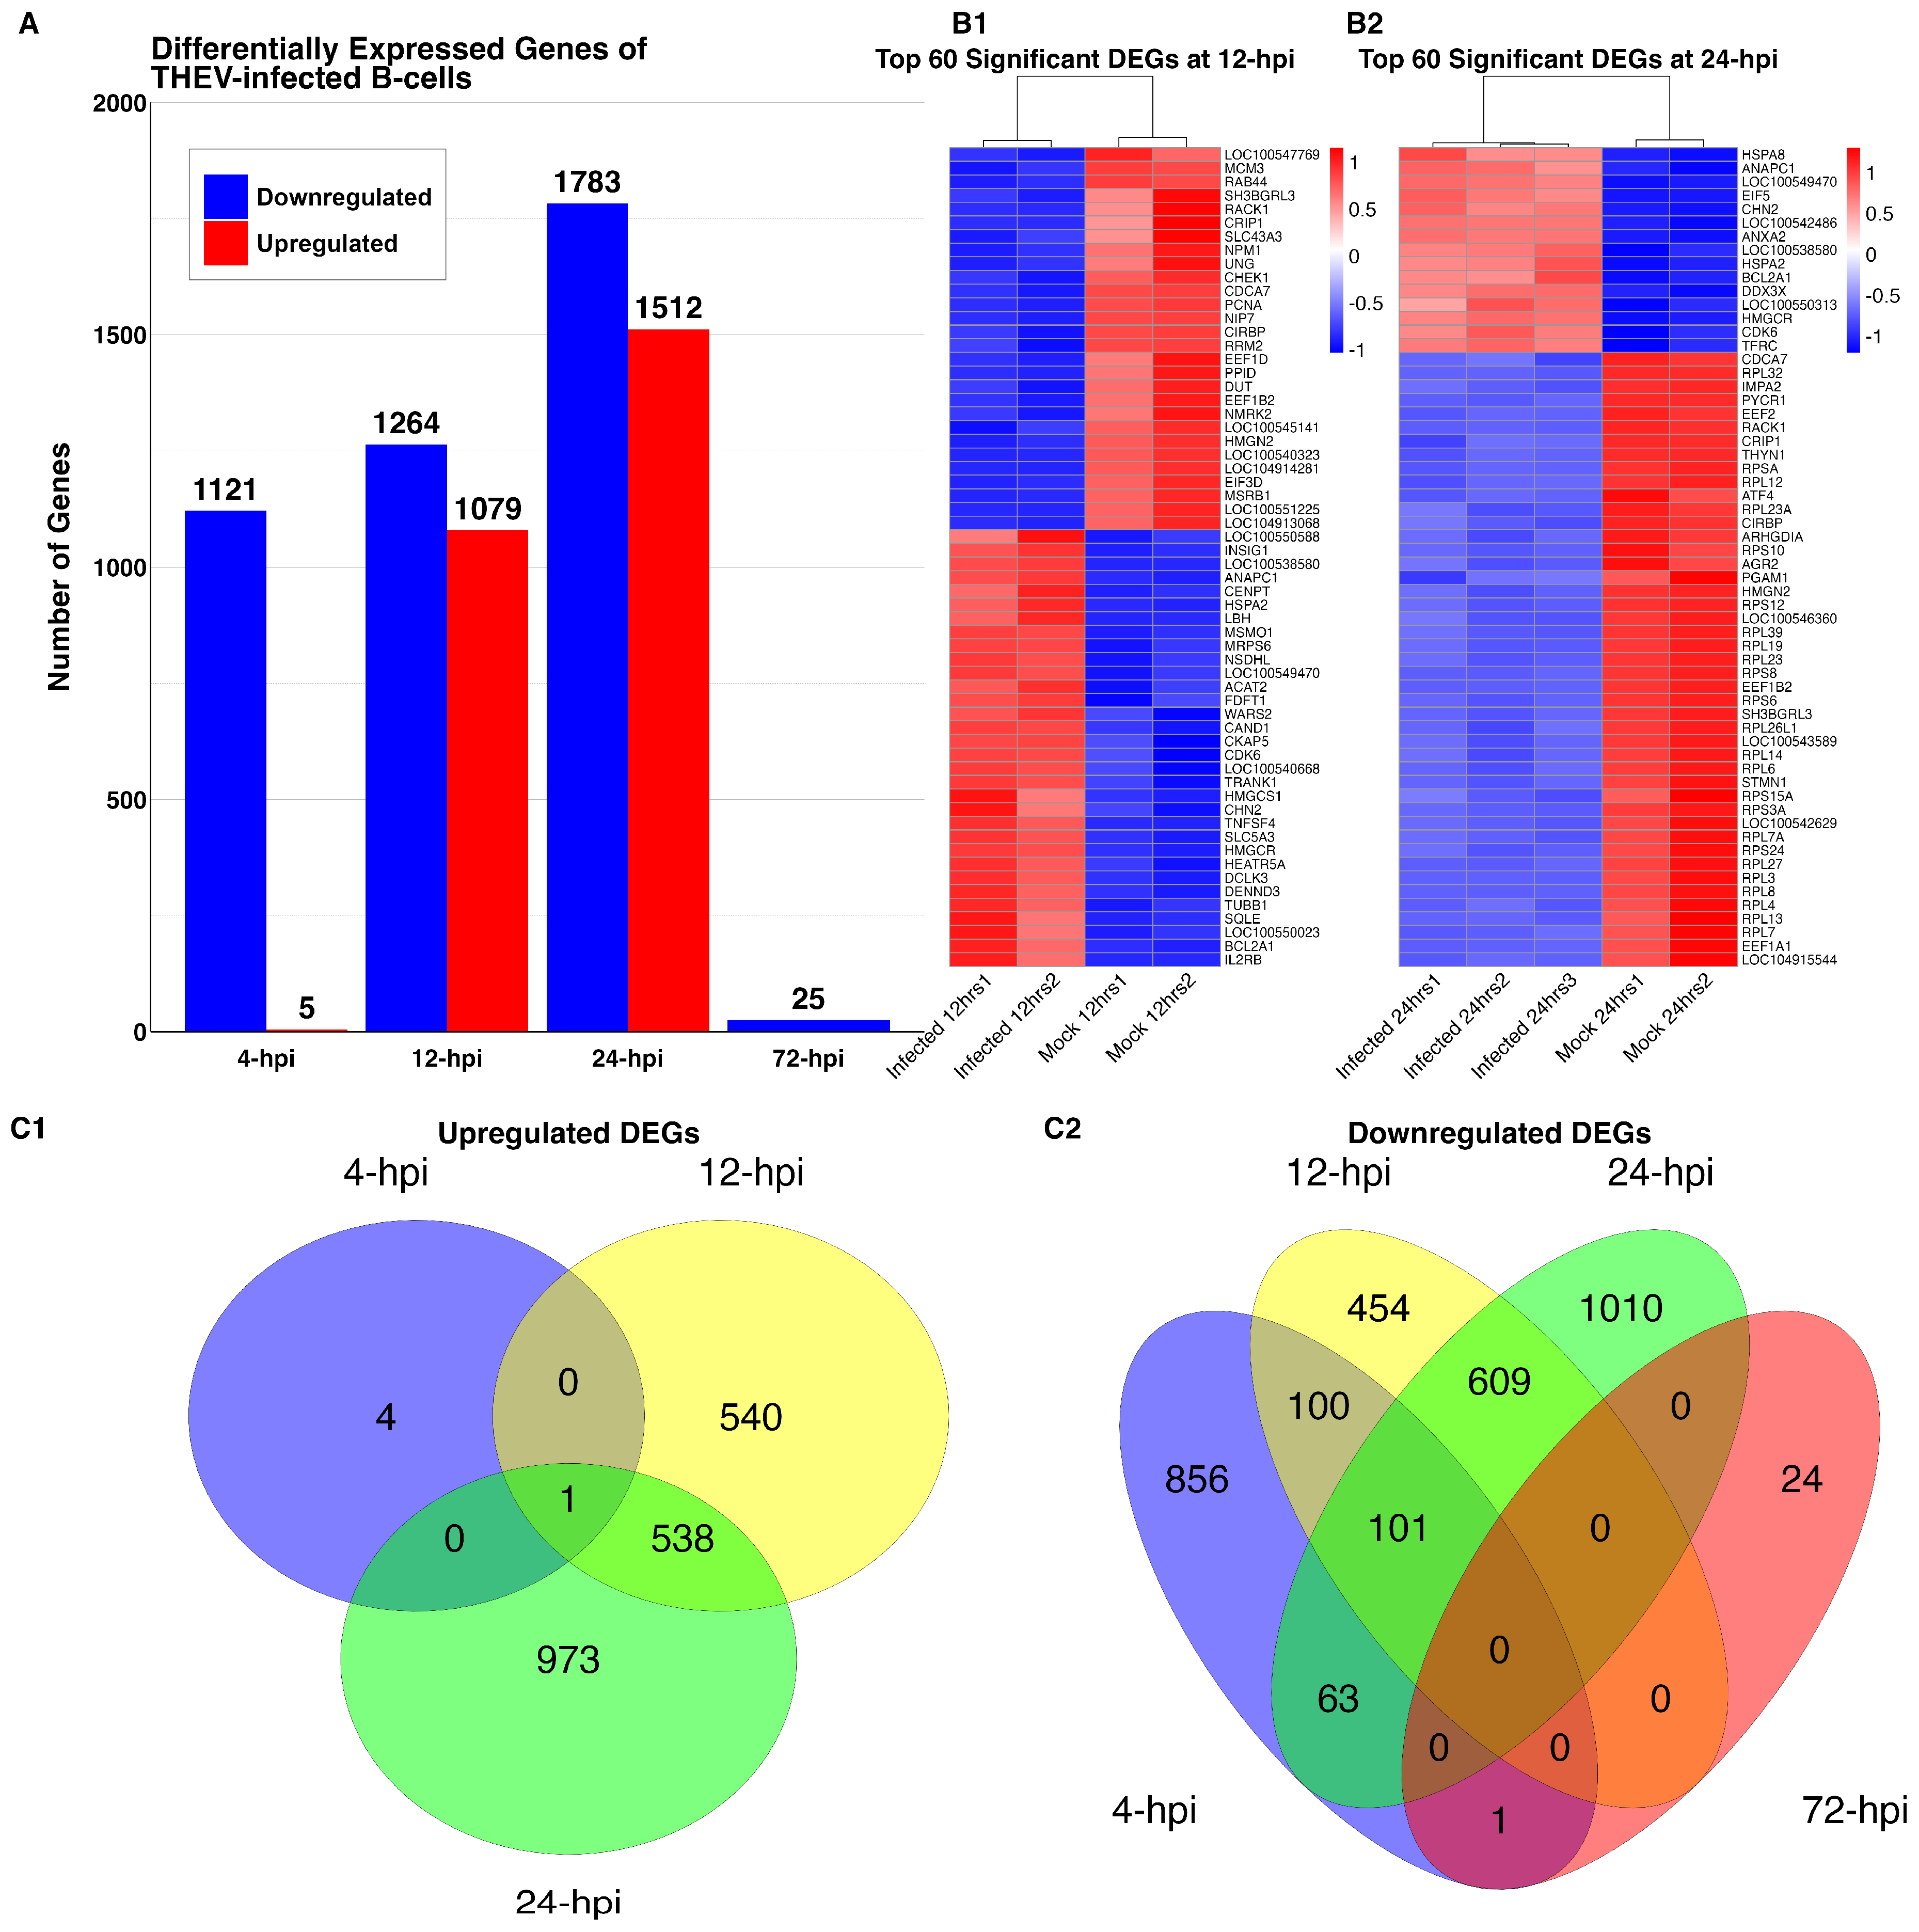
3.2. DEGs of THEV-Infected Versus Mock-Infected Cells
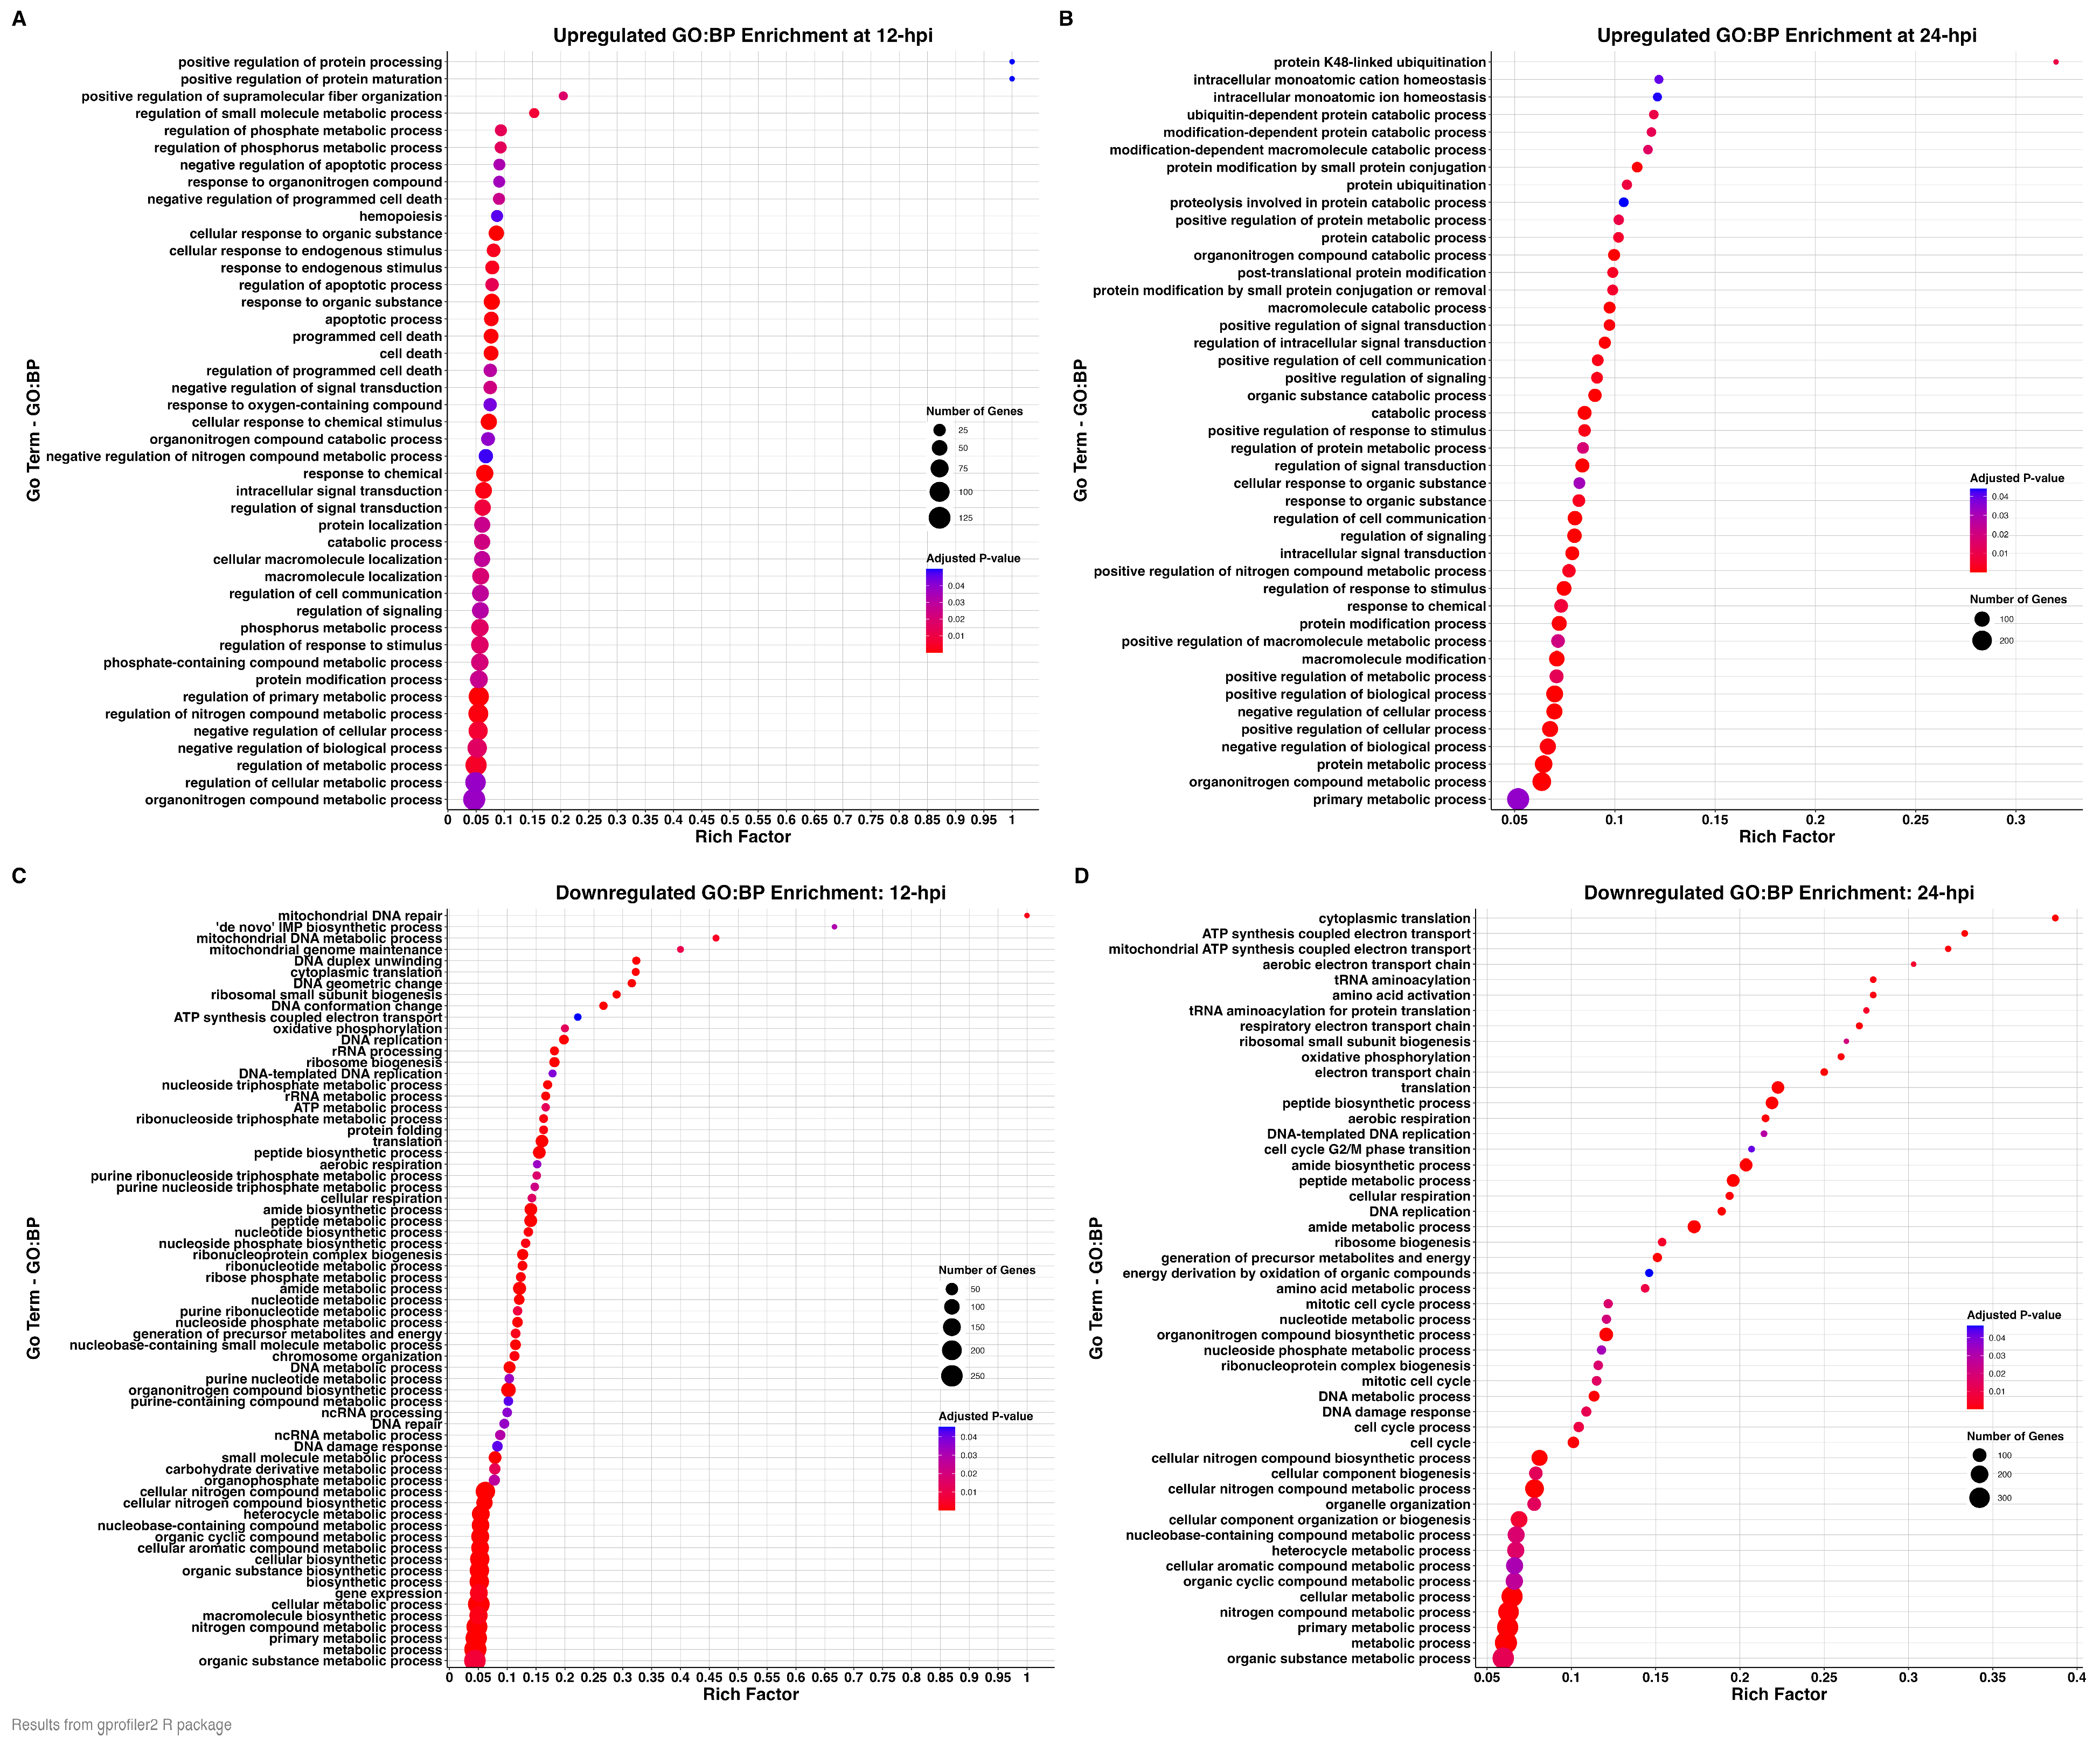
3.3. Functional Enrichment Analyses (GO and KEGG Pathway Analyses)
3.4. Cell Death and Breakdown Pathways Upregulated by THEV
3.5. Downregulation of Cell Maintenance Pathways
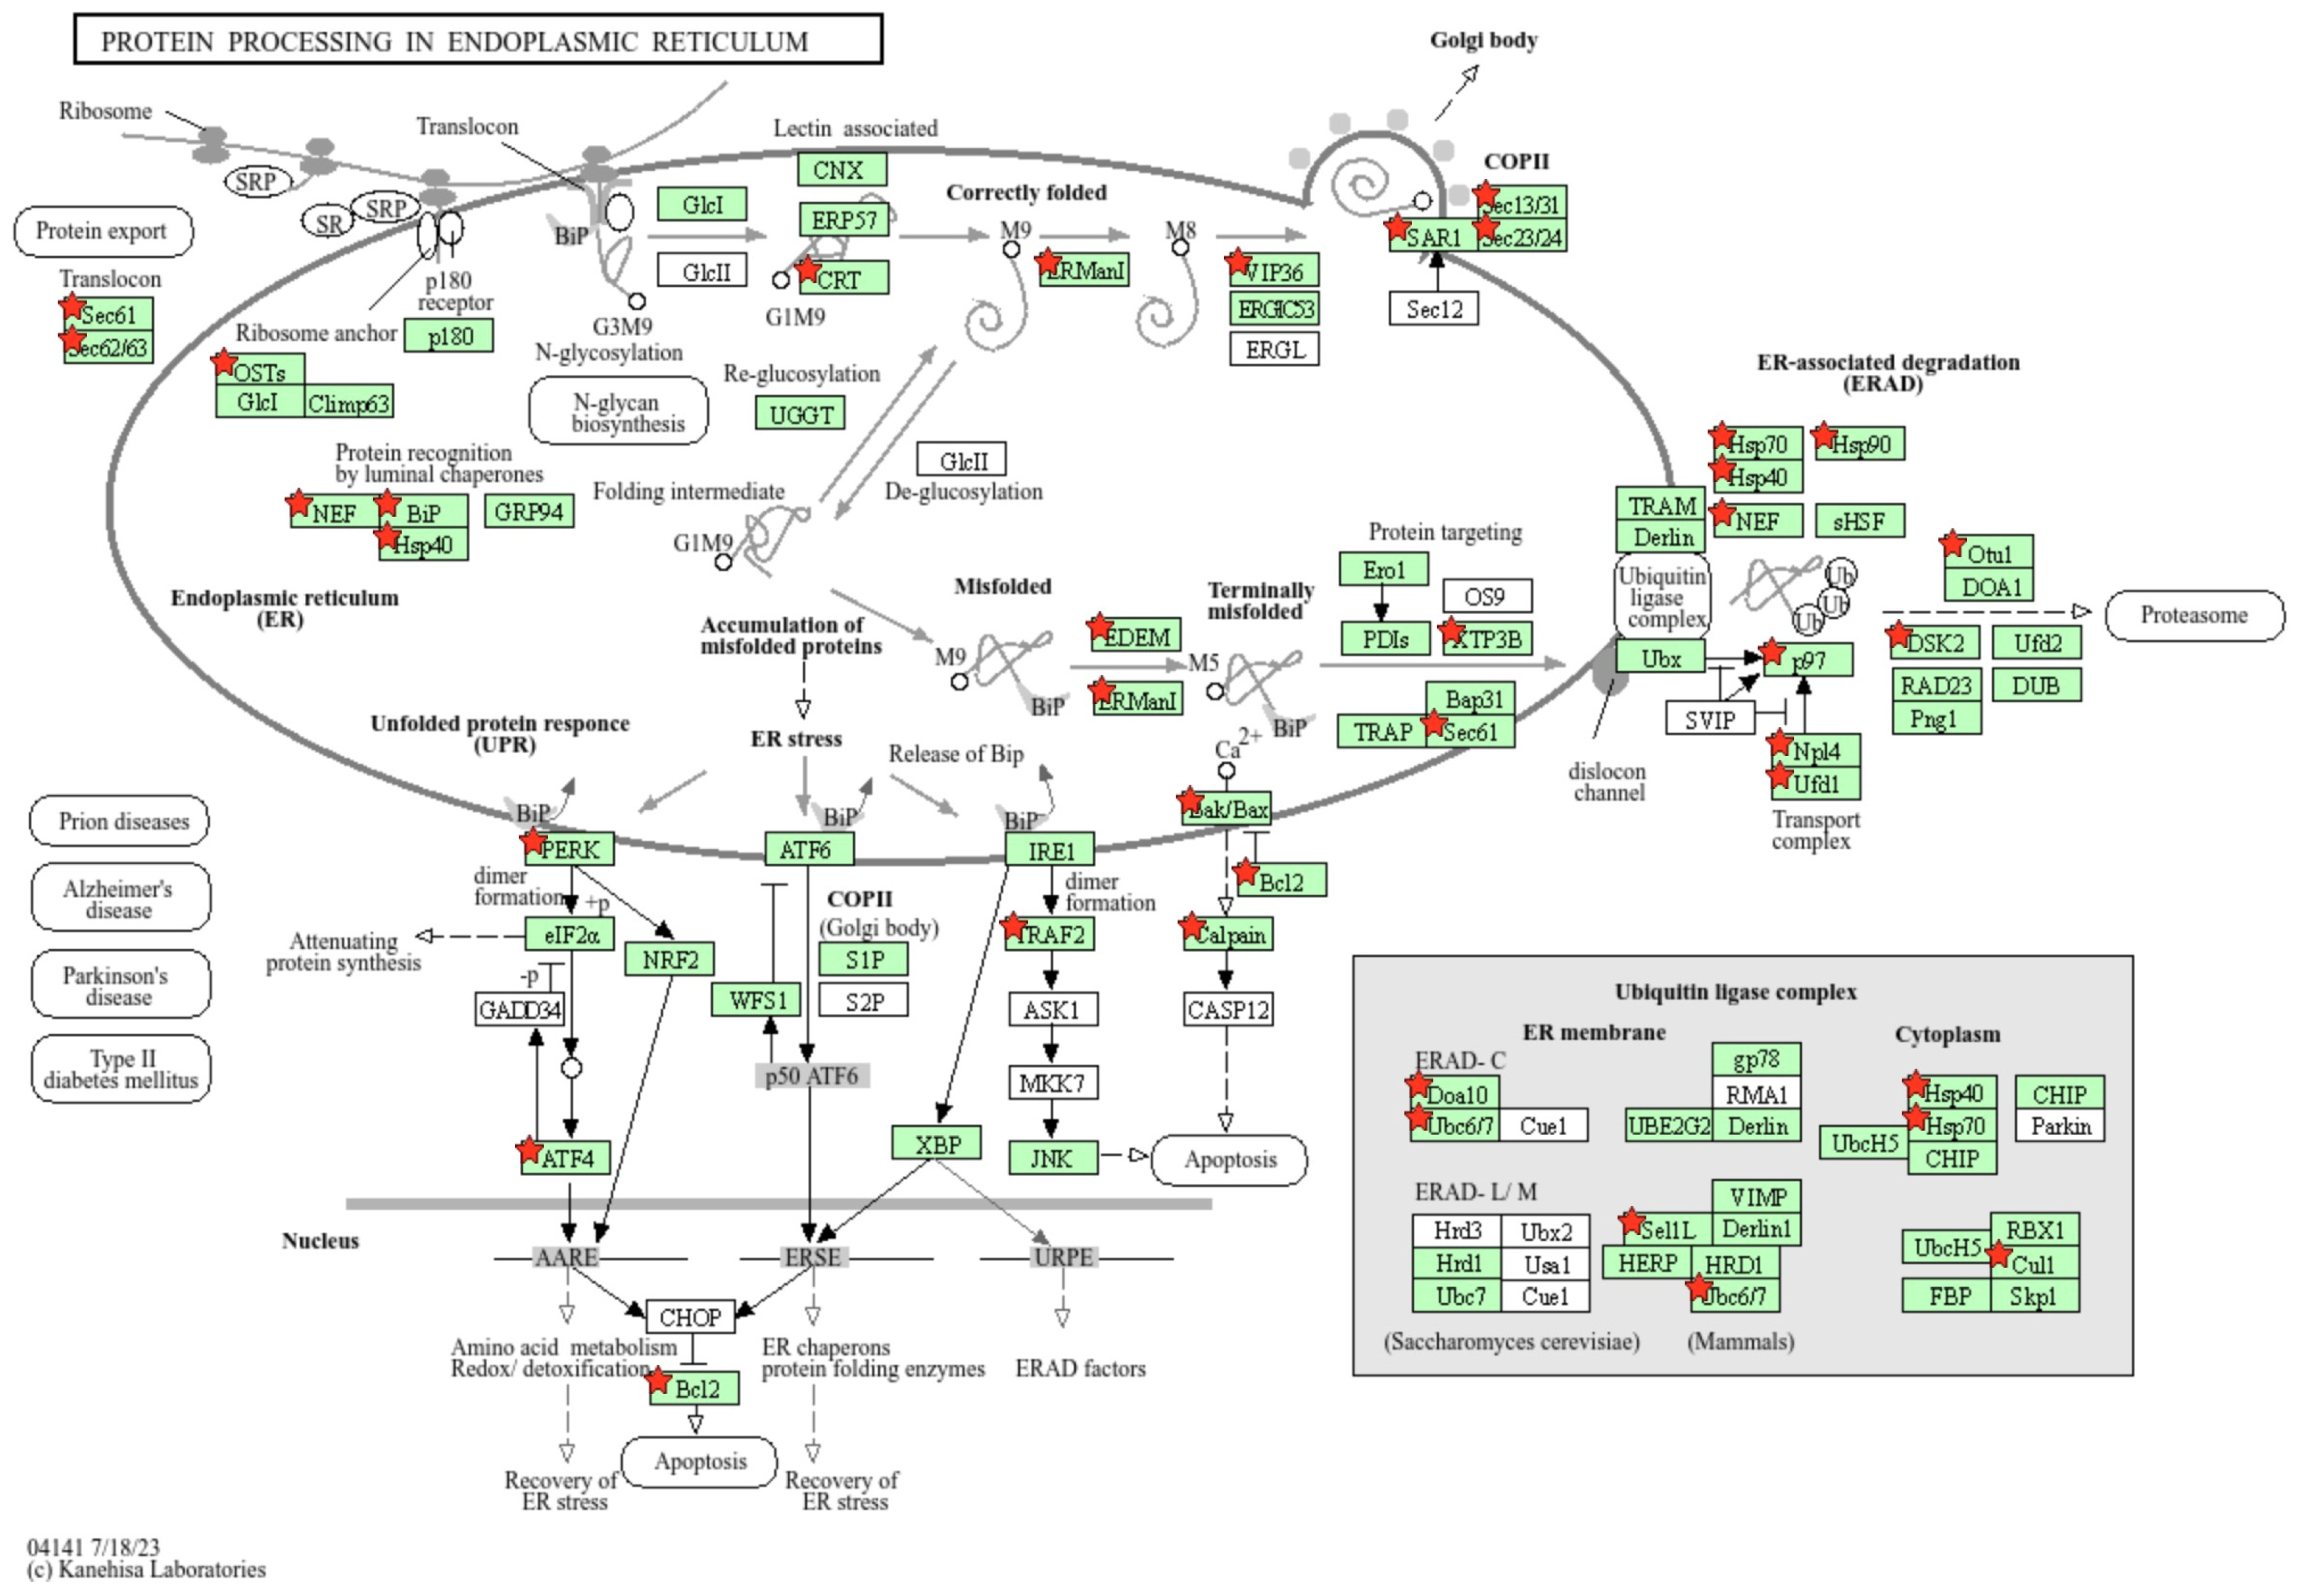
3.6. Endoplasmic Reticulum (ER) Stress Response During THEV Infection
3.7. Differential Expression of Cytokine and Cytokine Receptor-Encoding Genes
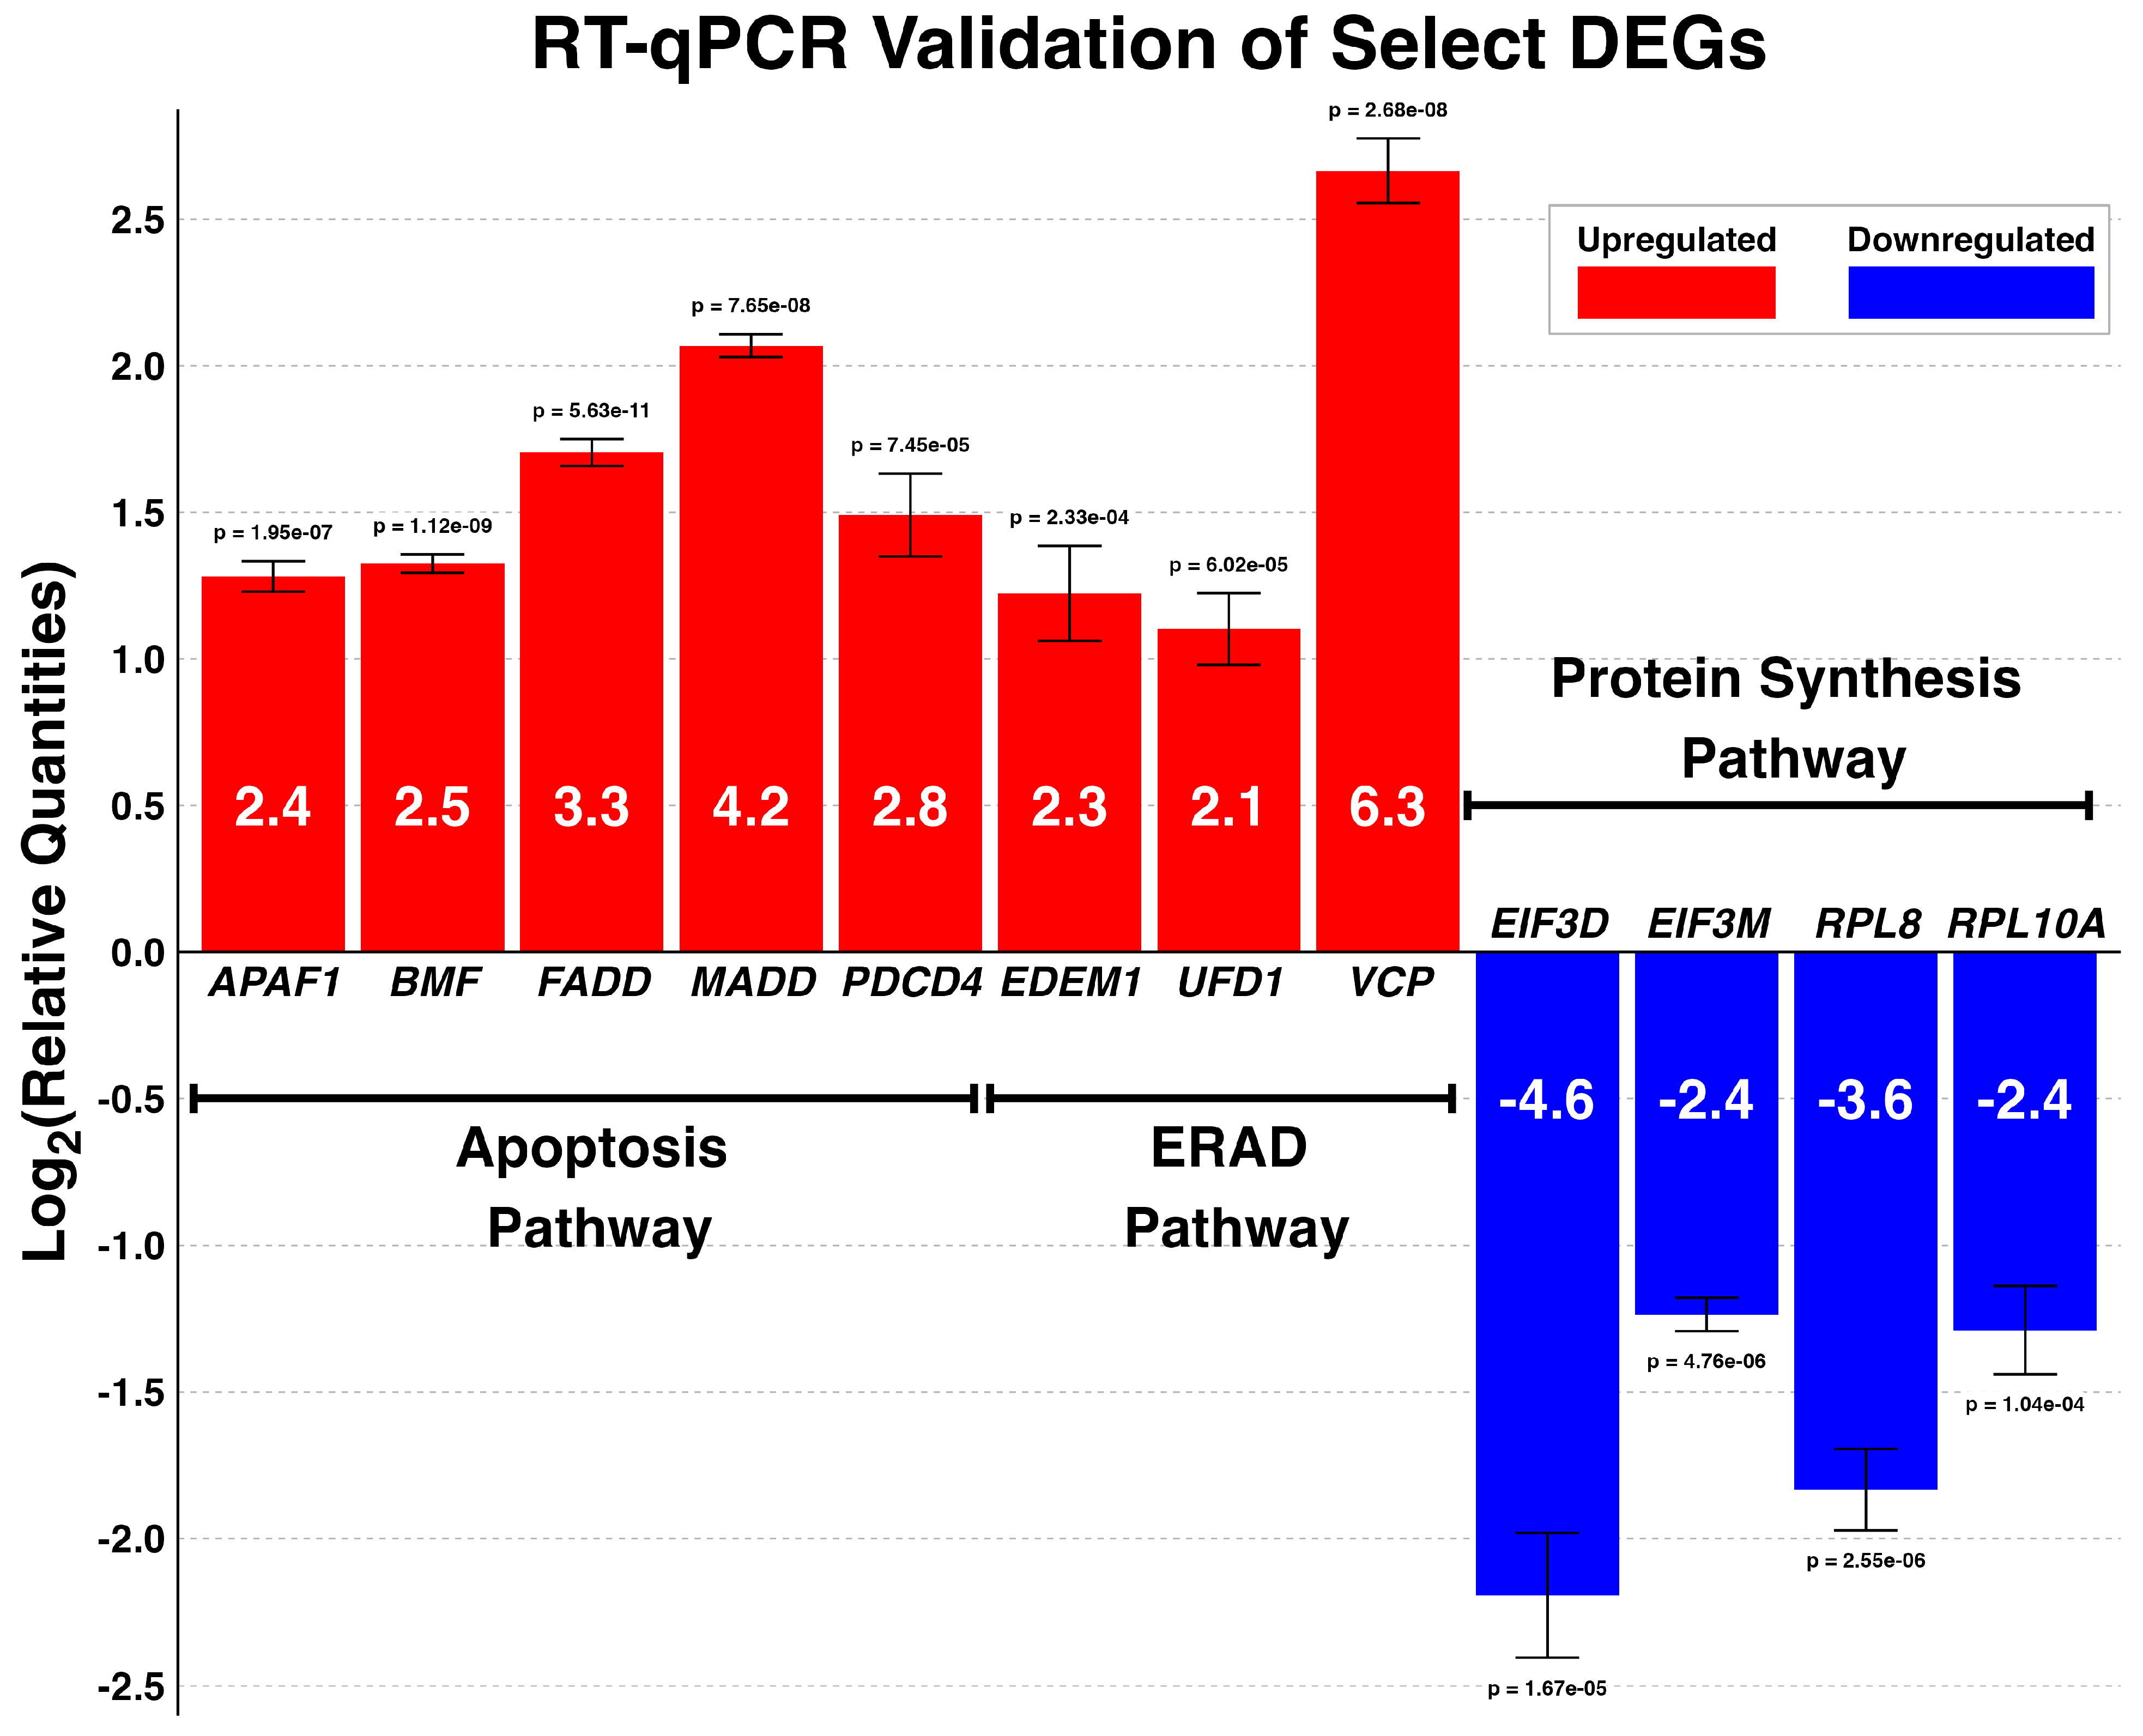
3.8. Validation of DEGs by Reverse Transcriptase Quantitative PCR (RT-qPCR)
4. Discussion
5. Conclusions
Supplementary Materials
Author Contributions
Funding
Institutional Review Board Statement
Informed Consent Statement
Data Availability Statement
Acknowledgments
Conflicts of Interest
Abbreviations
| DAVID | Database for Annotation, Visualization and Integrated Discovery |
| DEG | Differentially Expressed Gene |
| ER | Endoplasmic Reticulum |
| ERAD | Endoplasmic Reticulum-associated Degradation |
| FPKM | Fragments Per Kilobase of transcript per Million mapped reads |
| GCN | Genome Copy Number |
| GO | Gene Ontology |
| HE | Hemorrhagic Enteritis |
| IMS | Immunosuppression |
| KEGG | Kyoto Encyclopedia of Genes and Genomes |
| ORF | Open Reading Frame |
| RNA-seq | RNA sequencing |
| RT-qPCR | Reverse Transcriptase Quantitative Polymerase Chain Reaction |
| THEV | Turkey Hemorrhagic Enteritis Virus |
| UPR | Unfolded Protein Response |
| VAS | Virginia Avirulent Strain |
| hpi | Hours Post-infection |
References
- Harrach, B. Adenoviruses: General features. In Encyclopedia of Virology, 3rd ed.; Mahy, B.W.J., Van Regenmortel, M.H.V., Eds.; Academic Press: Oxford, UK, 2008; pp. 1–9. [Google Scholar]
- Davison, A.; Benko, M.; Harrach, B. Genetic content and evolution of adenoviruses. J. Gen. Virol. 2003, 84, 2895–2908. [Google Scholar] [CrossRef] [PubMed]
- Gross, W.B.; Moore, W.E. Hemorrhagic enteritis of turkeys. Avian Dis. 1967, 11, 296–307. [Google Scholar] [CrossRef] [PubMed]
- Beach, N.M. Characterization of Avirulent Turkey Hemorrhagic Enteritis Virus: A Study of the Molecular Basis for Variation in Virulence and the Occurrence of Persistent Infection. Ph.D. Thesis, Virginia Polytechnic Institute, Blacksburg, VA, USA, 2006. [Google Scholar]
- Dhama, K.; Gowthaman, V.; Karthik, K.; Tiwari, R.; Sachan, S.; Kumar, M.A.; Palanivelu, M.; Malik, Y.S.; Singh, R.K.; Munir, M. Haemorrhagic enteritis of turkeys—Current knowledge. Vet. Q. 2017, 37, 31–42. [Google Scholar] [CrossRef] [PubMed]
- Tykałowski, B.; Śmiałek, M.; Koncicki, A.; Ognik, K.; Zduńczyk, Z.; Jankowski, J. The immune response of young turkeys to haemorrhagic enteritis virus infection at different levels and sources of methionine in the diet. BMC Vet. Res. 2019, 15, 387. [Google Scholar] [CrossRef] [PubMed]
- Pierson, F.; Fitzgerald, S. Hemorrhagic enteritis and related infections. Dis. Poult. 2008, 12, 276–286. [Google Scholar]
- Rautenschlein, S.; Sharma, J.M. Immunopathogenesis of haemorrhagic enteritis virus (HEV) in turkeys. Dev. Comp. Immunol. 2000, 24, 237–246. [Google Scholar] [CrossRef] [PubMed]
- Larsen, C.T.; Domermuth, C.H.; Sponenberg, D.P.; Gross, W.B. Colibacillosis of turkeys exacerbated by hemorrhagic enteritis virus. Laboratory studies. Avian Dis. 1985, 29, 729–732. [Google Scholar] [CrossRef]
- Beach, N.M.; Duncan, R.B.; Larsen, C.T.; Meng, X.J.; Sriranganathan, N.; Pierson, F.W. Persistent infection of turkeys with an avirulent strain of turkey hemorrhagic enteritis virus. Avian Dis. 2009, 53, 370–375. [Google Scholar] [CrossRef]
- Rautenschlein, S.; Suresh, M.; Sharma, J.M. Pathogenic avian adenovirus type II induces apoptosis in turkey spleen cells. Arch. Virol. 2000, 145, 1671–1683. [Google Scholar] [CrossRef]
- Pandey, D.; Onkara Perumal, P. A scoping review on deep learning for next-generation RNA-seq. Data analysis. Funct. Integr. Genom. 2023, 23, 134. [Google Scholar] [CrossRef] [PubMed]
- Wang, B.; Kumar, V.; Olson, A.; Ware, D. Reviving the transcriptome studies: An insight into the emergence of single-molecule transcriptome sequencing. Front. Genet. 2019, 10, 384. [Google Scholar] [CrossRef] [PubMed]
- Choi, S.C. On the study of microbial transcriptomes using second- and third-generation sequencing technologies. J. Microbiol. 2016, 54, 527–536. [Google Scholar] [CrossRef]
- Satam, H.; Joshi, K.; Mangrolia, U.; Waghoo, S.; Zaidi, G.; Rawool, S.; Thakare, R.P.; Banday, S.; Mishra, A.K.; Das, G.; et al. Next-generation sequencing technology: Current trends and advancements. Biology 2023, 12, 997. [Google Scholar] [CrossRef] [PubMed]
- Mo, Q.; Feng, K.; Dai, S.; Wu, Q.; Zhang, Z.; Ali, A.; Deng, F.; Wang, H.; Ning, Y.-J. Transcriptome profiling highlights regulated biological processes and type III interferon antiviral responses upon crimean-congo hemorrhagic fever virus infection. Virol. Sin. 2023, 38, 34–46. [Google Scholar] [CrossRef]
- Ashburner, M.; Ball, C.A.; Blake, J.A.; Botstein, D.; Butler, H.; Cherry, J.M.; Davis, A.P.; Dolinski, K.; Dwight, S.S.; Eppig, J.T.; et al. Gene ontology: Tool for the unification of biology. Nat. Genet. 2000, 25, 25–29. [Google Scholar] [CrossRef] [PubMed]
- Kanehisa, M. KEGG: Kyoto encyclopedia of genes and genomes. Nucleic Acids Res. 2000, 28, 27–30. [Google Scholar] [CrossRef]
- Mahsoub, H.M.; Evans, N.P.; Beach, N.M.; Yuan, L.; Zimmerman, K.; Pierson, F.W. Real-time PCR-based infectivity assay for the titration of turkey hemorrhagic enteritis virus, an adenovirus, in live vaccines. J. Virol. Methods 2017, 239, 42–49. [Google Scholar] [CrossRef] [PubMed]
- Pertea, M.; Kim, D.; Pertea, G.M.; Leek, J.T.; Salzberg, S.L. Transcript-level expression analysis of RNA-seq experiments with HISAT, StringTie and ballgown. Nat. Protoc. 2016, 11, 1650–1667. [Google Scholar] [CrossRef]
- Mölder, F.; Jablonski, K.P.; Letcher, B.; Hall, M.B.; Tomkins-Tinch, C.H.; Sochat, V.; Forster, J.; Lee, S.; Twardziok, S.O.; Kanitz, A.; et al. Sustainable data analysis with snakemake. F1000Research 2021, 10, 33. [Google Scholar] [CrossRef] [PubMed]
- Martin, M. Cutadapt removes adapter sequences from high-throughput sequencing reads. EMBnetjournal 2011, 17, 10. [Google Scholar] [CrossRef]
- Love, M.I.; Huber, W.; Anders, S. Moderated estimation of fold change and dispersion for RNA-seq data with DESeq2. Genome Biol. 2014, 15, 550. [Google Scholar] [CrossRef] [PubMed]
- Kolberg, L.; Raudvere, U.; Kuzmin, I.; Vilo, J.; Peterson, H. gprofiler2—An r package for gene list functional enrichment analysis and namespace conversion toolset g:profiler. F1000Research 2020, 9, ELIXIR-709. [Google Scholar] [CrossRef] [PubMed]
- Wickham, H. ggplot2: Elegant Graphics for Data Analysis; Springer: New York, NY, USA, 2016; Available online: https://ggplot2.tidyverse.org (accessed on 1 January 2025).
- Kolde, R. Pheatmap: Pretty Heatmaps. 2019. Available online: https://CRAN.R-project.org/package=pheatmap (accessed on 1 January 2025).
- Yan, L. Ggvenn: Draw Venn Diagram by ’ggplot2’. 2023. Available online: https://CRAN.R-project.org/package=ggvenn (accessed on 1 January 2025).
- Livak, K.J.; Schmittgen, T.D. Analysis of relative gene expression data using real-time quantitative PCR and the 2−ΔΔCT Method. Methods 2001, 25, 402–408. [Google Scholar] [CrossRef] [PubMed]
- Sherman, B.T.; Hao, M.; Qiu, J.; Jiao, X.; Baseler, M.W.; Lane, H.C.; Imamichi, T.; Chang, W. DAVID: A web server for functional enrichment analysis and functional annotation of gene lists (2021 update). Nucleic Acids Res. 2022, 50, W216–W221. [Google Scholar] [CrossRef] [PubMed]
- Saunders, G.K.; Pierson, F.W.; Van Den Hurk, J.V. Haemorhagic enteritis virus infection in turkeys: A comparison of virulent and avirulent virus infections, and a proposed pathogenesis. Avian Pathol. 1993, 22, 47–58. [Google Scholar] [CrossRef]
- Barber, G.N. Host defense, viruses and apoptosis. Cell Death Differ. 2001, 8, 113–126. [Google Scholar] [CrossRef] [PubMed]
- Hardwick, J.M. Virus-induced apoptosis. In Apoptosls—Pharmacological Implications and Therapeutic Opportunities; Elsevier: Amsterdam, The Netherlands, 1997; pp. 295–336. [Google Scholar]
- Verburg, S.G.; Lelievre, R.M.; Westerveld, M.J.; Inkol, J.M.; Sun, Y.L.; Workenhe, S.T. Viral-mediated activation and inhibition of programmed cell death. PLOS Pathog. 2022, 18, e1010718. [Google Scholar] [CrossRef] [PubMed]
- Zhao, H.; Dahlö, M.; Isaksson, A.; Syvänen, A.-C.; Pettersson, U. The transcriptome of the adenovirus infected cell. Virology 2012, 424, 115–128. [Google Scholar] [CrossRef] [PubMed]
- Guimet, D.; Hearing, P. Adenovirus replication. In Adenoviral Vectors for Gene Therapy; Elsevier: Amsterdam, The Netherlands, 2016; pp. 59–84. [Google Scholar]
- Roos, W.P.; Kaina, B. DNA damage-induced cell death by apoptosis. Trends Mol. Med. 2006, 12, 440–450. [Google Scholar] [CrossRef]
- Martin, S.J. Protein or RNA synthesis inhibition induces apoptosis of mature human CD4+ t cell blasts. Immunol. Lett. 1993, 35, 125–134. [Google Scholar] [CrossRef] [PubMed]
- Christianson, J.C.; Carvalho, P. Order through destruction: How ER-associated protein degradation contributes to organelle homeostasis. EMBO J. 2022, 41, e109845. [Google Scholar] [CrossRef] [PubMed]
- van den Hurk, J.V. Propagation of group II avian adenoviruses in turkey and chicken leukocytes. Avian Dis. 1990, 34, 12. [Google Scholar] [CrossRef]
- Aboezz, Z.R.; Mahsoub, H.M.; El-Bagoury, G.; Pierson, F.W. In vitro growth kinetics and gene expression analysis of the turkey adenovirus 3, a siadenovirus. Virus Res. 2019, 263, 47–54. [Google Scholar] [CrossRef] [PubMed]
- Quaye, A.; Pickett, B.E.; Griffitts, J.S.; Berges, B.K.; Poole, B.D. Characterizing the splice map of turkey hemorrhagic enteritis virus. Virol. J. 2024, 21, 175. [Google Scholar] [CrossRef] [PubMed]
- Fribley, A.; Zhang, K.; Kaufman, R.J. Regulation of apoptosis by the unfolded protein response. In Apoptosis; Humana Press: Totowa, NJ, USA, 2009; pp. 191–204. [Google Scholar]
- Read, A.; Schröder, M. The unfolded protein response: An overview. Biology 2021, 10, 384. [Google Scholar] [CrossRef] [PubMed]

| Sample | Raw Reads M | Trimmed Reads M | Mapped Reads M | Uniquely Mapped Reads M | Non-Uniquely Mapped Reads M | Q20% | Q30% | GC Content (%) |
|---|---|---|---|---|---|---|---|---|
| I_12hrsS1 Inf | 40.6 | 39.0 | 34.7 (88.92%) | 33.1 (84.78%) | 1.6 (4.14%) | 99.95 | 97.23 | 47.5 |
| I_12hrsS3 Inf | 38.8 | 37.3 | 33.1 (88.78%) | 31.7 (84.95%) | 1.4 (3.83%) | 99.95 | 97.53 | 47.5 |
| I_24hrsS1 Inf | 42.7 | 41.0 | 36.2 (88.13%) | 34.5 (84.2%) | 1.6 (3.93%) | 99.95 | 96.95 | 46.5 |
| I_24hrsS2 Inf | 42.0 | 40.4 | 35.6 (88.1%) | 33.9 (83.83%) | 1.7 (4.27%) | 99.94 | 97.05 | 46.5 |
| I_24hrsS3 Inf | 40.5 | 38.9 | 34.2 (88.01%) | 32.7 (84.12%) | 1.5 (3.89%) | 99.95 | 97.08 | 47.0 |
| I_4hrsS1 Inf | 39.1 | 37.4 | 33 (88.16%) | 31.2 (83.43%) | 1.8 (4.73%) | 99.93 | 97.04 | 48.5 |
| I_4hrsS2 Inf | 41.3 | 39.6 | 35.3 (89.24%) | 33.6 (84.92%) | 1.7 (4.33%) | 99.95 | 97.15 | 47.0 |
| I_4hrsS3 Inf | 41.5 | 39.8 | 35.5 (89.2%) | 33.2 (83.29%) | 2.4 (5.91%) | 99.95 | 97.11 | 47.5 |
| I_72hrsS1 Inf | 41.2 | 39.8 | 28.3 (71.09%) | 26.9 (67.7%) | 1.3 (3.38%) | 99.96 | 97.23 | 44.5 |
| I_72hrsS2 Inf | 39.3 | 38.0 | 27 (71.11%) | 25.8 (67.86%) | 1.2 (3.25%) | 99.96 | 97.34 | 44.5 |
| I_72hrsS3 Inf | 39.9 | 37.1 | 28.3 (76.36%) | 26.1 (70.3%) | 2.2 (6.05%) | 99.87 | 96.14 | 52.5 |
| U_12hrsN1 Mk | 42.1 | 40.4 | 35.9 (88.72%) | 34.1 (84.39%) | 1.7 (4.33%) | 99.95 | 97.04 | 47.5 |
| U_12hrsN2 Mk | 41.0 | 39.3 | 34.7 (88.4%) | 33.2 (84.53%) | 1.5 (3.86%) | 99.94 | 97.08 | 47.5 |
| U_24hrsN1 Mk | 38.4 | 37.0 | 32.7 (88.46%) | 31.4 (84.74%) | 1.4 (3.72%) | 99.96 | 97.48 | 47.5 |
| U_24hrsN2 Mk | 39.9 | 38.4 | 34 (88.58%) | 32.6 (84.96%) | 1.4 (3.61%) | 99.95 | 96.95 | 47.0 |
| U_4hrsN1 Mk | 39.4 | 37.9 | 33.7 (88.9%) | 32 (84.41%) | 1.7 (4.49%) | 99.96 | 97.36 | 47.0 |
| U_4hrsN2 Mk | 37.6 | 34.7 | 22 (63.43%) | 18.5 (53.18%) | 3.6 (10.25%) | 99.80 | 94.96 | 61.0 |
| U_72hrsN1 Mk | 50.3 | 47.9 | 15.5 (32.4%) | 11.7 (24.5%) | 3.8 (7.9%) | 99.88 | 96.54 | 56.0 |
| U_72hrsN2 Mk | 40.5 | 38.9 | 34.5 (88.82%) | 32.7 (84.14%) | 1.8 (4.68%) | 99.95 | 97.04 | 46.5 |
| GO Category | GO:Term | Fold Enrichment | Number of DEGs | p-Value (Adjusted) |
|---|---|---|---|---|
| Biological Process | ||||
| GO:BP | DNA-templated transcription | 2.17 | 26 | 1.53 × 10⁻² |
| GO:BP | Alcohol biosynthetic process | 3.77 | 19 | 3.45 × 10⁻⁴ |
| GO:BP | Androgen receptor signaling pathway | 10.03 | 5 | 3.18 × 10⁻² |
| GO:BP | Apoptotic process | 2.75 | 47 | 6.09 × 10⁻⁷ |
| GO:BP | Apoptotic signaling pathway | 3.32 | 20 | 8.19 × 10⁻⁴ |
| GO:BP | Appendage development | 4.20 | 9 | 3.40 × 10⁻² |
| GO:BP | Appendage morphogenesis | 4.59 | 8 | 4.22 × 10⁻² |
| GO:BP | Autophagy | 2.59 | 23 | 4.43 × 10⁻³ |
| GO:BP | Biological process involved in interspecies interaction between organisms | 1.80 | 40 | 1.74 × 10⁻² |
| GO:BP | Biological regulation | 1.14 | 517 | 8.20 × 10⁻⁴ |
| GO:BP | Catabolic process | 1.51 | 108 | 1.03 × 10⁻³ |
| GO:BP | Cell cycle | 1.68 | 72 | 1.34 × 10⁻³ |
| GO:BP | Cell cycle phase transition | 3.29 | 11 | 4.63 × 10⁻² |
| GO:BP | Cell cycle process | 1.70 | 59 | 4.85 × 10⁻³ |
| GO:BP | Cell death | 2.85 | 51 | 4.99 × 10⁻⁸ |
| GO:BP | Cell division | 2.20 | 26 | 1.31 × 10⁻² |
| GO:BP | Cellular catabolic process | 1.64 | 44 | 4.22 × 10⁻² |
| GO:BP | Cellular component disassembly | 2.46 | 21 | 1.31 × 10⁻² |
| GO:BP | Cellular lipid biosynthetic process | 9.36 | 7 | 3.16 × 10⁻³ |
| GO:BP | Cellular lipid metabolic process | 1.67 | 67 | 3.03 × 10⁻³ |
| GO:BP | Cellular localization | 1.45 | 145 | 4.34 × 10⁻⁴ |
| GO:BP | Cellular macromolecule localization | 1.58 | 104 | 4.21 × 10⁻⁴ |
| GO:BP | Cellular metabolic process | 1.23 | 307 | 8.52 × 10⁻⁴ |
| GO:BP | Cellular response to biotic stimulus | 3.21 | 12 | 3.47 × 10⁻² |
| GO:BP | Cellular response to chemical stimulus | 1.56 | 60 | 2.49 × 10⁻² |
| GO:BP | Cellular response to decreased oxygen levels | 4.86 | 8 | 3.18 × 10⁻² |
| GO:BP | Cellular response to hypoxia | 5.02 | 8 | 2.79 × 10⁻² |
| GO:BP | Cellular response to lipid | 2.66 | 20 | 8.44 × 10⁻³ |
| GO:BP | Cellular response to lipopolysaccharide | 3.56 | 11 | 2.92 × 10⁻² |
| GO:BP | Cellular response to molecule of bacterial origin | 3.34 | 11 | 4.22 × 10⁻² |
| GO:BP | Cellular response to oxygen levels | 5.02 | 9 | 1.27 × 10⁻² |
| GO:BP | Cellular response to oxygen-containing compound | 1.92 | 33 | 1.98 × 10⁻² |
| GO:BP | Cellular response to stress | 1.77 | 81 | 1.11 × 10⁻⁴ |
| GO:BP | Cholesterol biosynthetic process | 6.92 | 10 | 7.48 × 10⁻⁴ |
| GO:BP | Cholesterol metabolic process | 3.76 | 12 | 1.20 × 10⁻² |
| GO:BP | Deadenylation-independent decapping of nuclear-transcribed mrna | 14.33 | 5 | 8.47 × 10⁻³ |
| GO:BP | Developmental growth | 2.58 | 19 | 1.53 × 10⁻² |
| GO:BP | Embryo development | 1.93 | 29 | 3.43 × 10⁻² |
| GO:BP | Embryonic morphogenesis | 2.36 | 24 | 9.41 × 10⁻³ |
| GO:BP | Endoderm development | 6.42 | 8 | 7.66 × 10⁻³ |
| GO:BP | Ergosterol biosynthetic process | 12.77 | 7 | 5.94 × 10⁻⁴ |
| GO:BP | Ergosterol metabolic process | 12.77 | 7 | 5.94 × 10⁻⁴ |
| GO:BP | Establishment of localization | 1.24 | 195 | 2.46 × 10⁻² |
| GO:BP | Establishment of localization in cell | 1.56 | 104 | 5.94 × 10⁻⁴ |
| GO:BP | Establishment of protein localization | 1.61 | 73 | 3.79 × 10⁻³ |
| GO:BP | Establishment of protein localization to organelle | 2.04 | 34 | 7.41 × 10⁻³ |
| GO:BP | Establishment or maintenance of cell polarity | 2.51 | 20 | 1.48 × 10⁻² |
| GO:BP | Extrinsic apoptotic signaling pathway | 4.18 | 10 | 1.89 × 10⁻² |
| GO:BP | Gland development | 3.06 | 16 | 9.41 × 10⁻³ |
| GO:BP | Growth | 2.58 | 19 | 1.53 × 10⁻² |
| GO:BP | Hemopoiesis | 2.16 | 26 | 1.69 × 10⁻² |
| GO:BP | Homeostasis of number of cells | 3.27 | 14 | 1.27 × 10⁻² |
| GO:BP | Intracellular lipid transport | 5.02 | 8 | 2.79 × 10⁻² |
| GO:BP | Intracellular protein transport | 2.00 | 50 | 5.94 × 10⁻⁴ |
| GO:BP | Intracellular signal transduction | 1.54 | 97 | 1.48 × 10⁻³ |
| GO:BP | Intracellular transport | 1.51 | 79 | 1.02 × 10⁻² |
| GO:BP | Intrinsic apoptotic signaling pathway | 3.70 | 12 | 1.31 × 10⁻² |
| GO:BP | Limb development | 4.20 | 9 | 3.40 × 10⁻² |
| GO:BP | Limb morphogenesis | 4.59 | 8 | 4.22 × 10⁻² |
| GO:BP | Lipid biosynthetic process | 1.94 | 46 | 1.94 × 10⁻³ |
| GO:BP | Lipid metabolic process | 1.53 | 79 | 7.41 × 10⁻³ |
| GO:BP | Localization | 1.24 | 219 | 1.25 × 10⁻² |
| GO:BP | mRNA transcription | 7.80 | 7 | 7.79 × 10⁻³ |
| GO:BP | Macroautophagy | 2.98 | 18 | 5.47 × 10⁻³ |
| GO:BP | Macromolecule catabolic process | 1.76 | 60 | 1.77 × 10⁻³ |
| GO:BP | Macromolecule localization | 1.58 | 128 | 3.56 × 10⁻⁵ |
| GO:BP | Macromolecule metabolic process | 1.21 | 286 | 6.45 × 10⁻³ |
| GO:BP | Macromolecule modification | 1.43 | 138 | 9.09 × 10⁻⁴ |
| GO:BP | Metabolic process | 1.19 | 426 | 3.93 × 10⁻⁴ |
| GO:BP | Mitotic cell cycle | 1.94 | 47 | 1.70 × 10⁻³ |
| GO:BP | Mitotic cell cycle phase transition | 3.34 | 11 | 4.22 × 10⁻² |
| GO:BP | Mitotic cell cycle process | 2.14 | 41 | 8.20 × 10⁻⁴ |
| GO:BP | Motor neuron apoptotic process | 10.03 | 5 | 3.18 × 10⁻² |
| GO:BP | Multicellular organismal-level homeostasis | 2.48 | 22 | 9.41 × 10⁻³ |
| GO:BP | Negative regulation of apoptotic process | 2.37 | 36 | 4.54 × 10⁻⁴ |
| GO:BP | Negative regulation of biological process | 1.56 | 187 | 1.90 × 10⁻⁷ |
| GO:BP | Negative regulation of biosynthetic process | 1.73 | 68 | 1.03 × 10⁻³ |
| GO:BP | Negative regulation of cellular biosynthetic process | 1.74 | 68 | 8.52 × 10⁻⁴ |
| GO:BP | Negative regulation of cellular metabolic process | 1.79 | 80 | 9.46 × 10⁻⁵ |
| GO:BP | Negative regulation of cellular process | 1.59 | 174 | 1.90 × 10⁻⁷ |
| GO:BP | Negative regulation of gene expression | 2.16 | 40 | 8.52 × 10⁻⁴ |
| GO:BP | Negative regulation of intracellular signal transduction | 2.07 | 28 | 1.78 × 10⁻² |
| GO:BP | Negative regulation of macromolecule biosynthetic process | 1.70 | 65 | 2.25 × 10⁻³ |
| GO:BP | Negative regulation of macromolecule metabolic process | 1.66 | 82 | 7.20 × 10⁻⁴ |
| GO:BP | Negative regulation of metabolic process | 1.70 | 91 | 1.10 × 10⁻⁴ |
| GO:BP | Negative regulation of programmed cell death | 2.35 | 37 | 4.29 × 10⁻⁴ |
| GO:BP | Nitrogen compound transport | 1.57 | 79 | 4.15 × 10⁻³ |
| GO:BP | Nuclear transport | 2.24 | 22 | 2.79 × 10⁻² |
| GO:BP | Nuclear-transcribed mRNA catabolic process, deadenylation-independent decay | 14.33 | 5 | 8.47 × 10⁻³ |
| GO:BP | Nucleobase-containing compound catabolic process | 2.05 | 24 | 4.40 × 10⁻² |
| GO:BP | Nucleocytoplasmic transport | 2.24 | 22 | 2.79 × 10⁻² |
| GO:BP | Nucleoside bisphosphate metabolic process | 3.03 | 13 | 3.39 × 10⁻² |
| GO:BP | Organic hydroxy compound biosynthetic process | 2.93 | 20 | 3.11 × 10⁻³ |
| GO:BP | Organonitrogen compound metabolic process | 1.29 | 260 | 3.93 × 10⁻⁴ |
| GO:BP | Organophosphate metabolic process | 1.59 | 65 | 1.09 × 10⁻² |
| GO:BP | Phosphate-containing compound metabolic process | 1.63 | 145 | 1.11 × 10⁻⁶ |
| GO:BP | Phosphorus metabolic process | 1.63 | 146 | 1.11 × 10⁻⁶ |
| GO:BP | Phosphorylation | 1.80 | 74 | 1.96 × 10⁻⁴ |
| GO:BP | Phytosteroid biosynthetic process | 12.04 | 9 | 3.75 × 10⁻⁵ |
| GO:BP | Phytosteroid metabolic process | 12.04 | 9 | 3.75 × 10⁻⁵ |
| GO:BP | Positive regulation of apoptotic process | 2.85 | 24 | 9.34 × 10⁻⁴ |
| GO:BP | Positive regulation of biological process | 1.33 | 193 | 1.29 × 10⁻³ |
| GO:BP | Positive regulation of catabolic process | 2.30 | 27 | 6.45 × 10⁻³ |
| GO:BP | Positive regulation of cell communication | 1.55 | 55 | 4.22 × 10⁻² |
| GO:BP | Positive regulation of cellular biosynthetic process | 1.44 | 72 | 4.95 × 10⁻² |
| GO:BP | Positive regulation of cellular metabolic process | 1.56 | 98 | 8.52 × 10⁻⁴ |
| GO:BP | Positive regulation of cellular process | 1.34 | 173 | 1.83 × 10⁻³ |
| GO:BP | Positive regulation of macromolecule metabolic process | 1.46 | 100 | 5.97 × 10⁻³ |
| GO:BP | Positive regulation of metabolic process | 1.53 | 116 | 4.34 × 10⁻⁴ |
| GO:BP | Positive regulation of programmed cell death | 2.74 | 24 | 1.58 × 10⁻³ |
| GO:BP | Positive regulation of signal transduction | 1.62 | 51 | 2.85 × 10⁻² |
| GO:BP | Positive regulation of signaling | 1.55 | 55 | 4.22 × 10⁻² |
| GO:BP | Primary metabolic process | 1.22 | 380 | 1.08 × 10⁻⁴ |
| GO:BP | Process utilizing autophagic mechanism | 2.59 | 23 | 4.43 × 10⁻³ |
| GO:BP | Programmed cell death | 2.85 | 51 | 4.99 × 10⁻⁸ |
| GO:BP | Protein catabolic process | 1.66 | 42 | 4.40 × 10⁻² |
| GO:BP | Protein localization | 1.58 | 104 | 4.21 × 10⁻⁴ |
| GO:BP | Protein localization to organelle | 1.90 | 52 | 1.15 × 10⁻³ |
| GO:BP | Protein metabolic process | 1.27 | 198 | 8.44 × 10⁻³ |
| GO:BP | Protein modification process | 1.55 | 138 | 3.56 × 10⁻⁵ |
| GO:BP | Protein phosphorylation | 2.33 | 61 | 9.07 × 10⁻⁷ |
| GO:BP | Protein transport | 1.58 | 62 | 1.45 × 10⁻² |
| GO:BP | Purine nucleoside bisphosphate metabolic process | 3.03 | 13 | 3.39 × 10⁻² |
| GO:BP | Regulation of DNA-templated transcription | 1.35 | 142 | 7.41 × 10⁻³ |
| GO:BP | Regulation of RNA biosynthetic process | 1.35 | 142 | 7.59 × 10⁻³ |
| GO:BP | Regulation of RNA metabolic process | 1.34 | 154 | 5.97 × 10⁻³ |
| GO:BP | Regulation of anatomical structure morphogenesis | 1.81 | 32 | 4.74 × 10⁻² |
| GO:BP | Regulation of apoptotic process | 2.15 | 57 | 2.79 × 10⁻⁵ |
| GO:BP | Regulation of autophagy | 2.61 | 20 | 1.02 × 10⁻² |
| GO:BP | Regulation of biological process | 1.15 | 497 | 5.83 × 10⁻⁴ |
| GO:BP | Regulation of biosynthetic process | 1.40 | 210 | 3.56 × 10⁻⁵ |
| GO:BP | Regulation of catabolic process | 2.01 | 47 | 8.20 × 10⁻⁴ |
| GO:BP | Regulation of cell communication | 1.36 | 120 | 1.31 × 10⁻² |
| GO:BP | Regulation of cell cycle | 1.67 | 43 | 3.66 × 10⁻² |
| GO:BP | Regulation of cell cycle process | 1.79 | 33 | 4.65 × 10⁻² |
| GO:BP | Regulation of cellular biosynthetic process | 1.41 | 210 | 2.24 × 10⁻⁵ |
| GO:BP | Regulation of cellular catabolic process | 2.35 | 21 | 2.18 × 10⁻² |
| GO:BP | Regulation of cellular metabolic process | 1.48 | 252 | 2.56 × 10⁻⁸ |
| GO:BP | Regulation of cellular process | 1.16 | 473 | 4.21 × 10⁻⁴ |
| GO:BP | Regulation of cytokine production | 2.21 | 23 | 2.61 × 10⁻² |
| GO:BP | Regulation of developmental process | 1.59 | 73 | 4.88 × 10⁻³ |
| GO:BP | Regulation of epithelial cell apoptotic process | 5.02 | 8 | 2.79 × 10⁻² |
| GO:BP | Regulation of gene expression | 1.38 | 201 | 1.06 × 10⁻⁴ |
| GO:BP | Regulation of intracellular signal transduction | 1.60 | 73 | 4.75 × 10⁻³ |
| GO:BP | Regulation of leukocyte differentiation | 3.00 | 13 | 3.64 × 10⁻² |
| GO:BP | Regulation of macromolecule biosynthetic process | 1.39 | 205 | 6.25 × 10⁻⁵ |
| GO:BP | Regulation of macromolecule metabolic process | 1.42 | 248 | 9.05 × 10⁻⁷ |
| GO:BP | Regulation of metabolic process | 1.47 | 279 | 6.08 × 10⁻⁹ |
| GO:BP | Regulation of mitotic cell cycle phase transition | 2.34 | 18 | 4.74 × 10⁻² |
| GO:BP | Regulation of nucleobase-containing compound metabolic process | 1.36 | 167 | 1.29 × 10⁻³ |
| GO:BP | Regulation of phosphate metabolic process | 1.79 | 37 | 2.89 × 10⁻² |
| GO:BP | Regulation of phosphorus metabolic process | 1.79 | 37 | 2.89 × 10⁻² |
| GO:BP | Regulation of primary metabolic process | 1.40 | 226 | 1.02 × 10⁻⁵ |
| GO:BP | Regulation of programmed cell death | 2.07 | 57 | 6.77 × 10⁻⁵ |
| GO:BP | Regulation of protein metabolic process | 1.50 | 59 | 4.97 × 10⁻² |
| GO:BP | Regulation of response to stimulus | 1.39 | 137 | 3.49 × 10⁻³ |
| GO:BP | Regulation of response to stress | 1.91 | 46 | 2.54 × 10⁻³ |
| GO:BP | Regulation of signal transduction | 1.44 | 110 | 4.85 × 10⁻³ |
| GO:BP | Regulation of signaling | 1.37 | 121 | 1.25 × 10⁻² |
| GO:BP | Regulation of transcription by RNA polymerase II | 1.41 | 111 | 7.98 × 10⁻³ |
| GO:BP | Response to chemical | 1.56 | 95 | 1.24 × 10⁻³ |
| GO:BP | Response to lipid | 2.41 | 25 | 5.91 × 10⁻³ |
| GO:BP | Response to nitrogen compound | 1.97 | 30 | 2.46 × 10⁻² |
| GO:BP | Response to organonitrogen compound | 2.19 | 29 | 7.59 × 10⁻³ |
| GO:BP | Response to oxygen-containing compound | 1.90 | 44 | 4.16 × 10⁻³ |
| GO:BP | Response to stress | 1.44 | 112 | 3.79 × 10⁻³ |
| GO:BP | Ribonucleoside bisphosphate metabolic process | 3.03 | 13 | 3.39 × 10⁻² |
| GO:BP | Secondary alcohol biosynthetic process | 7.67 | 13 | 1.58 × 10⁻⁵ |
| GO:BP | Secondary alcohol metabolic process | 3.70 | 14 | 4.85 × 10⁻³ |
| GO:BP | Small molecule biosynthetic process | 2.38 | 45 | 3.75 × 10⁻⁵ |
| GO:BP | Small molecule metabolic process | 1.44 | 93 | 1.24 × 10⁻² |
| GO:BP | Steroid biosynthetic process | 3.96 | 16 | 8.52 × 10⁻⁴ |
| GO:BP | Steroid metabolic process | 2.54 | 18 | 2.46 × 10⁻² |
| GO:BP | Sterol biosynthetic process | 7.24 | 13 | 2.79 × 10⁻⁵ |
| GO:BP | Sterol metabolic process | 3.86 | 15 | 1.83 × 10⁻³ |
| GO:BP | Tissue development | 1.58 | 51 | 4.22 × 10⁻² |
| GO:BP | Transport | 1.24 | 183 | 3.18 × 10⁻² |
| GO:BP | Vesicle-mediated transport | 1.51 | 80 | 9.41 × 10⁻³ |
| Cellular Component | ||||
| GO:CC | Golgi apparatus | 1.52 | 69 | 1.40 × 10⁻² |
| GO:CC | Bounding membrane of organelle | 1.70 | 92 | 3.49 × 10⁻⁵ |
| GO:CC | Chromatin | 1.84 | 40 | 9.58 × 10⁻³ |
| GO:CC | Chromosome | 1.58 | 63 | 1.10 × 10⁻² |
| GO:CC | Cytoplasm | 1.28 | 590 | 7.06 × 10⁻¹⁷ |
| GO:CC | Cytoplasmic vesicle | 1.57 | 88 | 1.12 × 10⁻³ |
| GO:CC | Cytoplasmic vesicle membrane | 1.69 | 41 | 2.85 × 10⁻² |
| GO:CC | Cytosol | 1.69 | 166 | 6.96 × 10⁻¹⁰ |
| GO:CC | Early endosome | 2.11 | 22 | 3.70 × 10⁻² |
| GO:CC | Endomembrane system | 1.48 | 200 | 3.53 × 10⁻⁷ |
| GO:CC | Endoplasmic reticulum | 1.54 | 86 | 2.07 × 10⁻³ |
| GO:CC | Endosome | 1.69 | 48 | 1.37 × 10⁻² |
| GO:CC | Endosome membrane | 2.02 | 25 | 3.21 × 10⁻² |
| GO:CC | Intracellular anatomical structure | 1.19 | 774 | 8.23 × 10⁻²⁰ |
| GO:CC | Intracellular membrane-bounded organelle | 1.29 | 578 | 1.08 × 10⁻¹⁶ |
| GO:CC | Intracellular organelle | 1.23 | 655 | 7.52 × 10⁻¹⁶ |
| GO:CC | Intracellular organelle lumen | 1.51 | 135 | 4.91 × 10⁻⁵ |
| GO:CC | Intracellular vesicle | 1.55 | 88 | 1.62 × 10⁻³ |
| GO:CC | Membrane-bounded organelle | 1.26 | 595 | 7.52 × 10⁻¹⁶ |
| GO:CC | Membrane-enclosed lumen | 1.51 | 135 | 4.91 × 10⁻⁵ |
| GO:CC | Nuclear lumen | 1.55 | 119 | 6.06 × 10⁻⁵ |
| GO:CC | Nucleoplasm | 1.75 | 104 | 1.57 × 10⁻⁶ |
| GO:CC | Nucleus | 1.42 | 371 | 1.33 × 10⁻¹³ |
| GO:CC | Organelle | 1.21 | 666 | 2.49 × 10⁻¹⁴ |
| GO:CC | Organelle lumen | 1.51 | 135 | 4.91 × 10⁻⁵ |
| GO:CC | Organelle membrane | 1.59 | 154 | 3.53 × 10⁻⁷ |
| GO:CC | Organelle subcompartment | 1.56 | 65 | 1.21 × 10⁻² |
| GO:CC | Perinuclear region of cytoplasm | 2.51 | 25 | 2.11 × 10⁻³ |
| GO:CC | Phagophore assembly site | 4.73 | 8 | 2.83 × 10⁻² |
| GO:CC | Protein–DNA complex | 1.76 | 42 | 1.40 × 10⁻² |
| GO:CC | Spindle | 2.04 | 25 | 2.85 × 10⁻² |
| GO:CC | Transcription regulator complex | 1.99 | 30 | 1.40 × 10⁻² |
| GO:CC | Vacuole | 1.82 | 34 | 2.73 × 10⁻² |
| GO:CC | Vesicle | 1.51 | 95 | 1.94 × 10⁻³ |
| GO:CC | Vesicle membrane | 1.74 | 43 | 1.40 × 10⁻² |
| Molecular Function | ||||
| GO:MF | ATP binding | 1.33 | 128 | 2.71 × 10⁻² |
| GO:MF | DNA-binding transcription factor binding | 2.73 | 22 | 5.83 × 10⁻³ |
| GO:MF | R-SMAD binding | 10.31 | 5 | 4.03 × 10⁻² |
| GO:MF | RNA polymerase II-specific DNA-binding transcription factor binding | 2.94 | 18 | 1.05 × 10⁻² |
| GO:MF | Adenyl nucleotide binding | 1.30 | 133 | 4.38 × 10⁻² |
| GO:MF | Adenyl ribonucleotide binding | 1.33 | 130 | 2.71 × 10⁻² |
| GO:MF | Binding | 1.09 | 714 | 4.02 × 10⁻⁴ |
| GO:MF | Enzyme binding | 2.20 | 102 | 8.60 × 10⁻¹¹ |
| GO:MF | Enzyme regulator activity | 1.50 | 82 | 1.38 × 10⁻² |
| GO:MF | Identical protein binding | 2.07 | 54 | 1.96 × 10⁻⁴ |
| GO:MF | Ion binding | 1.19 | 325 | 1.05 × 10⁻² |
| GO:MF | Kinase activity | 1.58 | 86 | 4.95 × 10⁻³ |
| GO:MF | Kinase binding | 2.14 | 35 | 5.83 × 10⁻³ |
| GO:MF | Manganese ion binding | 5.62 | 9 | 1.05 × 10⁻² |
| GO:MF | Molecular adaptor activity | 1.90 | 73 | 5.57 × 10⁻⁵ |
| GO:MF | Myosin phosphatase activity | 4.64 | 9 | 2.71 × 10⁻² |
| GO:MF | Nuclear androgen receptor binding | 12.88 | 5 | 1.83 × 10⁻² |
| GO:MF | Phosphotransferase activity, alcohol group as acceptor | 1.59 | 80 | 5.83 × 10⁻³ |
| GO:MF | Protein binding | 1.27 | 427 | 8.52 × 10⁻⁸ |
| GO:MF | Protein domain specific binding | 2.51 | 25 | 5.83 × 10⁻³ |
| GO:MF | Protein homodimerization activity | 2.29 | 23 | 2.51 × 10⁻² |
| GO:MF | Protein kinase activity | 1.59 | 67 | 1.20 × 10⁻² |
| GO:MF | Protein kinase binding | 2.10 | 31 | 1.18 × 10⁻² |
| GO:MF | Protein serine/threonine kinase activity | 1.68 | 44 | 4.27 × 10⁻² |
| GO:MF | Protein–macromolecule adaptor activity | 1.98 | 67 | 5.57 × 10⁻⁵ |
| GO:MF | Purine ribonucleoside triphosphate binding | 1.28 | 148 | 4.38 × 10⁻² |
| GO:MF | Signaling adaptor activity | 3.44 | 12 | 3.01 × 10⁻² |
| GO:MF | Small molecule binding | 1.19 | 338 | 5.83 × 10⁻³ |
| GO:MF | Transcription coregulator activity | 1.93 | 38 | 1.18 × 10⁻² |
| GO:MF | Transcription factor binding | 2.38 | 27 | 6.59 × 10⁻³ |
| GO:MF | Transferase activity | 1.30 | 176 | 1.05 × 10⁻² |
| GO:MF | Transferase activity, transferring phosphorus-containing groups | 1.51 | 96 | 5.83 × 10⁻³ |
| GO Category | GO:Term | Fold Enrichment | Number of DEGs | p-Value (Adjusted) |
|---|---|---|---|---|
| Biological Process | ||||
| GO:BP | “de novo” AMP biosynthetic process | 10.16 | 5 | 2.26 × 10⁻² |
| GO:BP | “de novo” IMP biosynthetic process | 11.43 | 5 | 1.51 × 10⁻² |
| GO:BP | “de novo” XMP biosynthetic process | 18.29 | 4 | 1.71 × 10⁻² |
| GO:BP | “de novo” post-translational protein folding | 8.31 | 10 | 6.05 × 10⁻⁵ |
| GO:BP | “de novo” protein folding | 7.95 | 10 | 8.96 × 10⁻⁵ |
| GO:BP | AMP biosynthetic process | 7.84 | 6 | 1.71 × 10⁻² |
| GO:BP | ATP biosynthetic process | 6.58 | 9 | 1.26 × 10⁻³ |
| GO:BP | ATP metabolic process | 4.29 | 19 | 1.86 × 10⁻⁵ |
| GO:BP | ATP synthesis coupled electron transport | 6.10 | 18 | 1.95 × 10⁻⁷ |
| GO:BP | DNA damage response | 2.35 | 69 | 7.26 × 10⁻⁹ |
| GO:BP | DNA geometric change | 4.33 | 9 | 2.22 × 10⁻² |
| GO:BP | DNA integrity checkpoint signaling | 3.75 | 16 | 6.72 × 10⁻⁴ |
| GO:BP | DNA metabolic process | 2.74 | 82 | 3.18 × 10⁻¹⁴ |
| GO:BP | DNA recombination | 2.07 | 23 | 3.64 × 10⁻² |
| GO:BP | DNA repair | 2.39 | 51 | 1.44 × 10⁻⁶ |
| GO:BP | DNA replication | 4.95 | 39 | 2.28 × 10⁻¹⁴ |
| GO:BP | DNA replication checkpoint signaling | 6.36 | 8 | 5.00 × 10⁻³ |
| GO:BP | DNA replication initiation | 5.23 | 8 | 1.71 × 10⁻² |
| GO:BP | DNA strand elongation | 6.97 | 8 | 2.67 × 10⁻³ |
| GO:BP | DNA strand elongation involved in DNA replication | 7.32 | 8 | 1.93 × 10⁻³ |
| GO:BP | DNA-templated DNA replication | 5.29 | 33 | 8.34 × 10⁻¹³ |
| GO:BP | DNA-templated DNA replication maintenance of fidelity | 4.43 | 8 | 3.69 × 10⁻² |
| GO:BP | GMP biosynthetic process | 9.15 | 6 | 8.32 × 10⁻³ |
| GO:BP | GMP metabolic process | 7.84 | 6 | 1.71 × 10⁻² |
| GO:BP | NADH dehydrogenase complex assembly | 4.57 | 8 | 3.13 × 10⁻² |
| GO:BP | RNA biosynthetic process | 2.55 | 135 | 4.64 × 10⁻²² |
| GO:BP | RNA export from nucleus | 3.77 | 13 | 4.16 × 10⁻³ |
| GO:BP | RNA localization | 3.69 | 22 | 2.39 × 10⁻⁵ |
| GO:BP | RNA metabolic process | 2.49 | 152 | 6.25 × 10⁻²⁴ |
| GO:BP | RNA modification | 2.30 | 19 | 3.26 × 10⁻² |
| GO:BP | RNA processing | 3.04 | 120 | 6.65 × 10⁻²⁶ |
| GO:BP | RNA splicing | 2.51 | 33 | 1.35 × 10⁻⁴ |
| GO:BP | RNA splicing, via transesterification reactions | 2.70 | 28 | 2.22 × 10⁻⁴ |
| GO:BP | RNA splicing, via transesterification reactions with bulged adenosine as nucleophile | 2.70 | 28 | 2.22 × 10⁻⁴ |
| GO:BP | RNA transport | 3.70 | 18 | 2.32 × 10⁻⁴ |
| GO:BP | XMP biosynthetic process | 18.29 | 4 | 1.71 × 10⁻² |
| GO:BP | XMP metabolic process | 18.29 | 4 | 1.71 × 10⁻² |
| GO:BP | Aerobic electron transport chain | 5.97 | 16 | 2.15 × 10⁻⁶ |
| GO:BP | Aerobic respiration | 5.10 | 29 | 1.17 × 10⁻¹⁰ |
| GO:BP | Amino acid activation | 3.25 | 11 | 3.83 × 10⁻² |
| GO:BP | Biosynthetic process | 2.25 | 377 | 3.04 × 10−57 |
| GO:BP | Carbohydrate derivative biosynthetic process | 1.64 | 49 | 2.14 × 10⁻² |
| GO:BP | Carbohydrate derivative metabolic process | 1.49 | 69 | 2.28 × 10⁻² |
| GO:BP | Cell cycle | 1.47 | 69 | 3.10 × 10⁻² |
| GO:BP | Cell cycle DNA replication | 6.33 | 9 | 1.67 × 10⁻³ |
| GO:BP | Cell cycle checkpoint signaling | 3.59 | 20 | 1.16 × 10⁻⁴ |
| GO:BP | Cell cycle process | 1.50 | 57 | 4.88 × 10⁻² |
| GO:BP | Cellular biosynthetic process | 2.29 | 329 | 4.05 × 10−50 |
| GO:BP | Cellular component assembly | 1.34 | 117 | 2.26 × 10⁻² |
| GO:BP | Cellular component biogenesis | 1.83 | 182 | 5.57 × 10⁻¹⁴ |
| GO:BP | Cellular component organization or biogenesis | 1.26 | 310 | 9.53 × 10⁻⁵ |
| GO:BP | Cellular metabolic process | 1.77 | 482 | 3.42 × 10−45 |
| GO:BP | Cellular process | 1.10 | 827 | 3.50 × 10⁻⁷ |
| GO:BP | Cellular respiration | 4.50 | 29 | 2.81 × 10⁻⁹ |
| GO:BP | Cellular response to stress | 1.79 | 90 | 5.95 × 10⁻⁶ |
| GO:BP | Chaperone cofactor-dependent protein refolding | 7.84 | 9 | 3.37 × 10⁻⁴ |
| GO:BP | Chaperone-mediated protein folding | 5.03 | 11 | 1.45 × 10⁻³ |
| GO:BP | Chromosome organization | 2.15 | 38 | 6.51 × 10⁻⁴ |
| GO:BP | Cytoplasmic translation | 9.15 | 27 | 7.21 × 10⁻¹⁷ |
| GO:BP | Cytoplasmic translational initiation | 7.48 | 9 | 4.85 × 10⁻⁴ |
| GO:BP | Double-strand break repair via break-induced replication | 7.32 | 6 | 2.28 × 10⁻² |
| GO:BP | Electron transport chain | 5.08 | 20 | 5.49 × 10⁻⁷ |
| GO:BP | Energy derivation by oxidation of organic compounds | 3.00 | 30 | 1.49 × 10⁻⁵ |
| GO:BP | Establishment of RNA localization | 3.70 | 18 | 2.32 × 10⁻⁴ |
| GO:BP | Establishment of protein localization to mitochondrion | 3.09 | 12 | 3.30 × 10⁻² |
| GO:BP | Establishment of protein localization to organelle | 1.91 | 35 | 1.13 × 10⁻² |
| GO:BP | Formation of cytoplasmic translation initiation complex | 11.64 | 7 | 3.80 × 10⁻⁴ |
| GO:BP | Gene expression | 3.07 | 289 | 4.61 × 10−70 |
| GO:BP | Generation of precursor metabolites and energy | 2.77 | 40 | 1.13 × 10⁻⁶ |
| GO:BP | Immunoglobulin production involved in immunoglobulin-mediated immune response | 5.82 | 7 | 2.28 × 10⁻² |
| GO:BP | Import into nucleus | 2.69 | 15 | 3.01 × 10⁻² |
| GO:BP | Import into the mitochondrion | 3.92 | 12 | 5.82 × 10⁻³ |
| GO:BP | Isotype switching | 9.15 | 5 | 3.13 × 10⁻² |
| GO:BP | mRNA metabolic process | 2.21 | 47 | 4.07 × 10⁻⁵ |
| GO:BP | mRNA processing | 2.50 | 39 | 2.09 × 10⁻⁵ |
| GO:BP | mRNA splicing, via spliceosome | 2.70 | 28 | 2.22 × 10⁻⁴ |
| GO:BP | Macromolecule biosynthetic process | 2.69 | 313 | 8.24 × 10−63 |
| GO:BP | Macromolecule metabolic process | 1.79 | 466 | 6.20 × 10−45 |
| GO:BP | Macromolecule methylation | 2.81 | 14 | 3.04 × 10⁻² |
| GO:BP | Maturation of 5.8S rRNA | 6.79 | 13 | 1.21 × 10⁻⁵ |
| GO:BP | Maturation of LSU-rRNA | 8.13 | 16 | 1.88 × 10⁻⁸ |
| GO:BP | Maturation of LSU-rRNA from tricistronic rRNA transcript (SSU-rRNA, 5.8S rRNA, LSU-rRNA) | 5.57 | 7 | 2.86 × 10⁻² |
| GO:BP | Maturation of SSU-rRNA | 6.22 | 17 | 4.15 × 10⁻⁷ |
| GO:BP | Maturation of SSU-rRNA from tricistronic rRNA transcript (SSU-rRNA, 5.8S rRNA, LSU-rRNA) | 6.27 | 12 | 8.09 × 10⁻⁵ |
| GO:BP | metabolic process | 1.57 | 618 | 9.00 × 10−47 |
| GO:BP | Mitochondrial ATP synthesis coupled electron transport | 6.10 | 17 | 5.49 × 10⁻⁷ |
| GO:BP | Mitochondrial DNA metabolic process | 9.85 | 7 | 1.15 × 10⁻³ |
| GO:BP | Mitochondrial DNA replication | 9.15 | 5 | 3.13 × 10⁻² |
| GO:BP | Mitochondrial electron transport, NADH to ubiquinone | 6.58 | 9 | 1.26 × 10⁻³ |
| GO:BP | Mitochondrial gene expression | 2.93 | 12 | 4.86 × 10⁻² |
| GO:BP | Mitochondrial genome maintenance | 6.10 | 7 | 1.85 × 10⁻² |
| GO:BP | Mitochondrial respiratory chain complex I assembly | 4.57 | 8 | 3.13 × 10⁻² |
| GO:BP | Mitochondrial transmembrane transport | 3.70 | 18 | 2.32 × 10⁻⁴ |
| GO:BP | Mitochondrial transport | 3.47 | 22 | 6.14 × 10⁻⁵ |
| GO:BP | Mitochondrion organization | 2.51 | 39 | 1.97 × 10⁻⁵ |
| GO:BP | Mitotic cell cycle | 1.69 | 45 | 2.01 × 10⁻² |
| GO:BP | Mitotic cell cycle checkpoint signaling | 3.13 | 13 | 2.10 × 10⁻² |
| GO:BP | Mitotic cell cycle process | 1.71 | 36 | 4.39 × 10⁻² |
| GO:BP | Negative regulation of DNA metabolic process | 3.43 | 12 | 1.71 × 10⁻² |
| GO:BP | Negative regulation of cell cycle | 2.19 | 24 | 1.71 × 10⁻² |
| GO:BP | Negative regulation of cell cycle phase transition | 2.49 | 20 | 1.22 × 10⁻² |
| GO:BP | Negative regulation of cell cycle process | 2.26 | 21 | 2.46 × 10⁻² |
| GO:BP | Non-membrane-bounded organelle assembly | 1.99 | 30 | 1.66 × 10⁻² |
| GO:BP | Nuclear DNA replication | 6.33 | 9 | 1.67 × 10⁻³ |
| GO:BP | Nuclear export | 3.33 | 20 | 3.06 × 10⁻⁴ |
| GO:BP | Nuclear transport | 2.79 | 30 | 5.99 × 10⁻⁵ |
| GO:BP | Nucleic acid biosynthetic process | 2.57 | 142 | 1.38 × 10⁻²³ |
| GO:BP | Nucleic acid metabolic process | 2.56 | 226 | 1.57 × 10−39 |
| GO:BP | Nucleic acid transport | 3.70 | 18 | 2.32 × 10⁻⁴ |
| GO:BP | Nucleobase-containing compound biosynthetic process | 2.57 | 178 | 2.25 × 10⁻³⁰ |
| GO:BP | Nucleobase-containing compound metabolic process | 2.41 | 276 | 9.74 × 10−45 |
| GO:BP | Nucleobase-containing compound transport | 3.22 | 22 | 1.83 × 10⁻⁴ |
| GO:BP | Nucleobase-containing small molecule metabolic process | 2.04 | 53 | 7.60 × 10⁻⁵ |
| GO:BP | Nucleocytoplasmic transport | 2.79 | 30 | 5.99 × 10⁻⁵ |
| GO:BP | Nucleoside monophosphate biosynthetic process | 5.12 | 14 | 9.79 × 10⁻⁵ |
| GO:BP | Nucleoside monophosphate metabolic process | 4.57 | 14 | 3.08 × 10⁻⁴ |
| GO:BP | Nucleoside phosphate biosynthetic process | 2.50 | 31 | 2.80 × 10⁻⁴ |
| GO:BP | Nucleoside phosphate metabolic process | 2.00 | 46 | 4.85 × 10⁻⁴ |
| GO:BP | Nucleoside triphosphate biosynthetic process | 5.23 | 16 | 1.41 × 10⁻⁵ |
| GO:BP | Nucleoside triphosphate metabolic process | 3.95 | 27 | 2.73 × 10⁻⁷ |
| GO:BP | Nucleotide biosynthetic process | 2.53 | 31 | 2.28 × 10⁻⁴ |
| GO:BP | Nucleotide metabolic process | 2.10 | 46 | 1.68 × 10⁻⁴ |
| GO:BP | Organelle organization | 1.23 | 174 | 4.94 × 10⁻² |
| GO:BP | Organonitrogen compound biosynthetic process | 2.74 | 170 | 3.69 × 10⁻³² |
| GO:BP | Organonitrogen compound metabolic process | 1.50 | 331 | 2.81 × 10⁻¹⁴ |
| GO:BP | Oxidative phosphorylation | 6.29 | 22 | 1.17 × 10⁻⁹ |
| GO:BP | Positive regulation of gene expression | 1.74 | 37 | 3.13 × 10⁻² |
| GO:BP | Positive regulation of signal transduction by p53 class mediator | 13.06 | 5 | 8.24 × 10⁻³ |
| GO:BP | Positive regulation of translation | 3.59 | 11 | 2.11 × 10⁻² |
| GO:BP | Primary metabolic process | 1.63 | 556 | 1.30 × 10−44 |
| GO:BP | Protein folding | 4.00 | 35 | 6.76 × 10⁻¹⁰ |
| GO:BP | Protein import into nucleus | 2.80 | 15 | 2.20 × 10⁻² |
| GO:BP | Protein localization to mitochondrion | 3.01 | 12 | 4.05 × 10⁻² |
| GO:BP | Protein localization to nucleus | 2.49 | 17 | 3.01 × 10⁻² |
| GO:BP | Protein maturation | 2.16 | 42 | 2.32 × 10⁻⁴ |
| GO:BP | Protein metabolic process | 1.52 | 261 | 2.39 × 10⁻¹¹ |
| GO:BP | Protein stabilization | 3.85 | 16 | 4.94 × 10⁻⁴ |
| GO:BP | Protein targeting | 2.11 | 22 | 3.80 × 10⁻² |
| GO:BP | Protein targeting to mitochondrion | 3.66 | 12 | 1.06 × 10⁻² |
| GO:BP | Protein–RNA complex assembly | 5.76 | 40 | 3.24 × 10⁻¹⁷ |
| GO:BP | Protein–RNA complex organization | 5.54 | 40 | 1.35 × 10⁻¹⁶ |
| GO:BP | Protein-containing complex assembly | 2.19 | 83 | 2.81 × 10⁻⁹ |
| GO:BP | Protein-containing complex organization | 1.95 | 112 | 1.17 × 10⁻⁹ |
| GO:BP | Proton motive force-driven ATP synthesis | 6.86 | 9 | 9.28 × 10⁻⁴ |
| GO:BP | Purine nucleoside monophosphate biosynthetic process | 4.57 | 8 | 3.13 × 10⁻² |
| GO:BP | Purine nucleoside triphosphate biosynthetic process | 4.91 | 11 | 1.78 × 10⁻³ |
| GO:BP | Purine nucleoside triphosphate metabolic process | 3.69 | 21 | 4.37 × 10⁻⁵ |
| GO:BP | Purine nucleotide metabolic process | 1.76 | 33 | 4.40 × 10⁻² |
| GO:BP | Purine ribonucleoside monophosphate biosynthetic process | 4.57 | 8 | 3.13 × 10⁻² |
| GO:BP | Purine ribonucleoside triphosphate biosynthetic process | 5.03 | 11 | 1.45 × 10⁻³ |
| GO:BP | Purine ribonucleoside triphosphate metabolic process | 3.88 | 21 | 2.09 × 10⁻⁵ |
| GO:BP | Purine ribonucleotide metabolic process | 1.94 | 29 | 2.52 × 10⁻² |
| GO:BP | rRNA metabolic process | 5.57 | 63 | 4.00 × 10⁻²⁷ |
| GO:BP | rRNA modification | 5.14 | 9 | 7.66 × 10⁻³ |
| GO:BP | rRNA processing | 5.97 | 62 | 1.61 × 10⁻²⁸ |
| GO:BP | Regulation of DNA metabolic process | 2.92 | 30 | 2.42 × 10⁻⁵ |
| GO:BP | Regulation of DNA replication | 6.23 | 16 | 1.18 × 10⁻⁶ |
| GO:BP | Regulation of DNA strand elongation | 8.31 | 5 | 4.39 × 10⁻² |
| GO:BP | Regulation of DNA-templated DNA replication | 7.84 | 6 | 1.71 × 10⁻² |
| GO:BP | Regulation of G2/M transition of mitotic cell cycle | 3.41 | 11 | 2.94 × 10⁻² |
| GO:BP | Regulation of apoptotic process | 1.58 | 46 | 4.77 × 10⁻² |
| GO:BP | Regulation of apoptotic signaling pathway | 2.29 | 20 | 2.86 × 10⁻² |
| GO:BP | Regulation of cell cycle | 1.95 | 55 | 1.68 × 10⁻⁴ |
| GO:BP | Regulation of cell cycle phase transition | 2.42 | 30 | 6.83 × 10⁻⁴ |
| GO:BP | Regulation of cell cycle process | 2.18 | 44 | 1.16 × 10⁻⁴ |
| GO:BP | Regulation of protein stability | 3.41 | 19 | 3.76 × 10⁻⁴ |
| GO:BP | Regulation of signal transduction by p53 class mediator | 6.10 | 7 | 1.85 × 10⁻² |
| GO:BP | Regulation of translation | 2.26 | 20 | 3.13 × 10⁻² |
| GO:BP | Respiratory electron transport chain | 4.99 | 18 | 4.43 × 10⁻⁶ |
| GO:BP | Response to stress | 1.45 | 123 | 9.23 × 10⁻⁴ |
| GO:BP | Ribonucleoprotein complex biogenesis | 5.52 | 108 | 1.71 × 10−47 |
| GO:BP | Ribonucleoside monophosphate biosynthetic process | 4.88 | 12 | 8.23 × 10⁻⁴ |
| GO:BP | Ribonucleoside monophosphate metabolic process | 4.39 | 12 | 2.07 × 10⁻³ |
| GO:BP | Ribonucleoside triphosphate biosynthetic process | 5.45 | 14 | 5.12 × 10⁻⁵ |
| GO:BP | Ribonucleoside triphosphate metabolic process | 4.14 | 24 | 8.49 × 10⁻⁷ |
| GO:BP | Ribonucleotide biosynthetic process | 2.42 | 22 | 8.55 × 10⁻³ |
| GO:BP | Ribonucleotide metabolic process | 2.12 | 34 | 2.14 × 10⁻³ |
| GO:BP | Ribose phosphate biosynthetic process | 2.55 | 24 | 2.07 × 10⁻³ |
| GO:BP | Ribose phosphate metabolic process | 2.19 | 36 | 7.72 × 10⁻⁴ |
| GO:BP | Ribosomal large subunit assembly | 10.16 | 10 | 9.32 × 10⁻⁶ |
| GO:BP | Ribosomal large subunit biogenesis | 8.18 | 34 | 8.01 × 10⁻²⁰ |
| GO:BP | Ribosomal small subunit assembly | 8.54 | 7 | 2.70 × 10⁻³ |
| GO:BP | Ribosomal small subunit biogenesis | 7.36 | 31 | 2.14 × 10⁻¹⁶ |
| GO:BP | Ribosome assembly | 8.13 | 20 | 6.51 × 10⁻¹¹ |
| GO:BP | Ribosome biogenesis | 5.80 | 86 | 2.32 × 10−39 |
| GO:BP | Small molecule metabolic process | 1.50 | 106 | 8.46 × 10⁻⁴ |
| GO:BP | Somatic diversification of immunoglobulins involved in immune response | 9.15 | 5 | 3.13 × 10⁻² |
| GO:BP | Somatic recombination of immunoglobulin genes involved in immune response | 9.15 | 5 | 3.13 × 10⁻² |
| GO:BP | tRNA aminoacylation | 3.41 | 11 | 2.94 × 10⁻² |
| GO:BP | tRNA metabolic process | 2.81 | 31 | 3.49 × 10⁻⁵ |
| GO:BP | tRNA transport | 14.63 | 4 | 3.24 × 10⁻² |
| GO:BP | Telomere maintenance | 3.35 | 11 | 3.13 × 10⁻² |
| GO:BP | Telomere organization | 3.19 | 11 | 4.28 × 10⁻² |
| GO:BP | Translation | 6.31 | 110 | 7.08 × 10−55 |
| GO:BP | Translational elongation | 4.30 | 8 | 4.31 × 10⁻² |
| GO:BP | Translational initiation | 5.78 | 12 | 1.79 × 10⁻⁴ |
| GO:BP | Viral gene expression | 18.29 | 5 | 1.45 × 10⁻³ |
| GO:BP | Viral translation | 18.29 | 4 | 1.71 × 10⁻² |
| Cellular Component | ||||
| GO:CC | 90S preribosome | 8.05 | 20 | 1.61 × 10⁻¹¹ |
| GO:CC | Arp2/3 protein complex | 7.89 | 5 | 2.33 × 10⁻² |
| GO:CC | Ctf18 RFC-like complex | 15.77 | 5 | 1.30 × 10⁻³ |
| GO:CC | DNA replication preinitiation complex | 9.46 | 5 | 1.18 × 10⁻² |
| GO:CC | INO80-type complex | 5.68 | 6 | 2.68 × 10⁻² |
| GO:CC | Ino80 complex | 7.89 | 5 | 2.33 × 10⁻² |
| GO:CC | MCM complex | 7.28 | 5 | 3.08 × 10⁻² |
| GO:CC | Sm-like protein family complex | 3.57 | 13 | 2.69 × 10⁻³ |
| GO:CC | U2-type prespliceosome | 6.31 | 6 | 1.77 × 10⁻² |
| GO:CC | U2-type spliceosomal complex | 4.32 | 13 | 4.48 × 10⁻⁴ |
| GO:CC | catalytic complex | 1.63 | 136 | 2.38 × 10⁻⁷ |
| GO:CC | Catalytic step 2 spliceosome | 3.40 | 14 | 2.49 × 10⁻³ |
| GO:CC | Chaperonin-containing T-complex | 7.36 | 7 | 2.67 × 10⁻³ |
| GO:CC | Chromatin | 1.64 | 41 | 2.10 × 10⁻² |
| GO:CC | Chromosome | 1.98 | 91 | 1.20 × 10⁻⁸ |
| GO:CC | Cytochrome complex | 5.10 | 7 | 1.77 × 10⁻² |
| GO:CC | Cytoplasm | 1.29 | 685 | 9.10 × 10⁻²² |
| GO:CC | Cytosol | 2.09 | 237 | 4.82 × 10⁻²⁸ |
| GO:CC | Cytosolic large ribosomal subunit | 10.51 | 40 | 1.85 × 10⁻²⁹ |
| GO:CC | Cytosolic ribosome | 10.70 | 69 | 3.41 × 10−52 |
| GO:CC | Cytosolic small ribosomal subunit | 12.20 | 29 | 1.62 × 10⁻²³ |
| GO:CC | Endopeptidase complex | 3.11 | 13 | 8.59 × 10⁻³ |
| GO:CC | Eukaryotic 43S preinitiation complex | 12.62 | 8 | 1.11 × 10⁻⁵ |
| GO:CC | Eukaryotic 48S preinitiation complex | 15.14 | 8 | 1.98 × 10⁻⁶ |
| GO:CC | Eukaryotic translation initiation factor 3 complex | 12.17 | 9 | 2.20 × 10⁻⁶ |
| GO:CC | Eukaryotic translation initiation factor 3 complex, eIF3m | 15.14 | 4 | 1.26 × 10⁻² |
| GO:CC | Exosome (RNase complex) | 5.16 | 6 | 3.92 × 10⁻² |
| GO:CC | Fibrillar center | 3.44 | 10 | 1.94 × 10⁻² |
| GO:CC | Inner mitochondrial membrane protein complex | 4.50 | 29 | 6.05 × 10⁻¹⁰ |
| GO:CC | Intracellular anatomical structure | 1.26 | 951 | 6.67 × 10−51 |
| GO:CC | Intracellular membrane-bounded organelle | 1.39 | 719 | 2.65 × 10−36 |
| GO:CC | Intracellular non-membrane-bounded organelle | 1.85 | 361 | 2.45 × 10⁻³⁴ |
| GO:CC | Intracellular organelle | 1.33 | 823 | 1.15 × 10−41 |
| GO:CC | Intracellular organelle lumen | 2.62 | 271 | 6.67 × 10−51 |
| GO:CC | Large ribosomal subunit | 8.79 | 52 | 1.03 × 10⁻³³ |
| GO:CC | Membrane-bounded organelle | 1.34 | 729 | 1.48 × 10⁻³¹ |
| GO:CC | Membrane-enclosed lumen | 2.62 | 271 | 6.67 × 10−51 |
| GO:CC | Mitochondrial envelope | 2.71 | 68 | 3.51 × 10⁻¹² |
| GO:CC | Mitochondrial inner membrane | 3.34 | 50 | 3.51 × 10⁻¹² |
| GO:CC | Mitochondrial intermembrane space | 4.73 | 9 | 5.04 × 10⁻³ |
| GO:CC | Mitochondrial large ribosomal subunit | 4.73 | 13 | 1.79 × 10⁻⁴ |
| GO:CC | Mitochondrial matrix | 3.99 | 42 | 9.69 × 10⁻¹³ |
| GO:CC | Mitochondrial membrane | 2.58 | 60 | 8.01 × 10⁻¹⁰ |
| GO:CC | Mitochondrial protein-containing complex | 4.57 | 55 | 9.42 × 10⁻²⁰ |
| GO:CC | Mitochondrial proton-transporting ATP synthase complex | 6.08 | 9 | 8.94 × 10⁻⁴ |
| GO:CC | Mitochondrial proton-transporting ATP synthase complex, coupling factor F(o) | 6.76 | 5 | 3.92 × 10⁻² |
| GO:CC | Mitochondrial respirasome | 5.16 | 6 | 3.92 × 10⁻² |
| GO:CC | Mitochondrial ribosome | 5.03 | 21 | 5.82 × 10⁻⁸ |
| GO:CC | Mitochondrial small ribosomal subunit | 6.06 | 8 | 2.67 × 10⁻³ |
| GO:CC | Mitochondrion | 2.46 | 177 | 2.97 × 10⁻²⁸ |
| GO:CC | Non-membrane-bounded organelle | 1.85 | 362 | 1.14 × 10⁻³⁴ |
| GO:CC | Nuclear chromosome | 3.03 | 25 | 3.48 × 10⁻⁵ |
| GO:CC | Nuclear envelope | 2.30 | 34 | 1.90 × 10⁻⁴ |
| GO:CC | Nuclear lumen | 2.49 | 221 | 4.84 × 10−37 |
| GO:CC | Nuclear membrane | 2.38 | 16 | 2.43 × 10⁻² |
| GO:CC | Nuclear pore | 3.51 | 13 | 3.05 × 10⁻³ |
| GO:CC | Nuclear protein-containing complex | 2.21 | 137 | 2.38 × 10⁻¹⁷ |
| GO:CC | Nucleolus | 4.68 | 111 | 8.60 × 10−42 |
| GO:CC | Nucleoplasm | 1.94 | 133 | 3.47 × 10⁻¹² |
| GO:CC | Nucleus | 1.53 | 462 | 4.75 × 10⁻²⁶ |
| GO:CC | Organellar large ribosomal subunit | 4.73 | 13 | 1.79 × 10⁻⁴ |
| GO:CC | Organellar ribosome | 5.03 | 21 | 5.82 × 10⁻⁸ |
| GO:CC | Organellar small ribosomal subunit | 6.06 | 8 | 2.67 × 10⁻³ |
| GO:CC | Organelle | 1.30 | 829 | 4.21 × 10−37 |
| GO:CC | Organelle envelope | 2.56 | 101 | 8.81 × 10⁻¹⁷ |
| GO:CC | Organelle envelope lumen | 4.37 | 9 | 8.53 × 10⁻³ |
| GO:CC | Organelle inner membrane | 3.14 | 54 | 4.23 × 10⁻¹² |
| GO:CC | Organelle lumen | 2.62 | 271 | 6.67 × 10−51 |
| GO:CC | Organelle membrane | 1.25 | 140 | 3.13 × 10⁻² |
| GO:CC | Oxidoreductase complex | 4.27 | 14 | 2.31 × 10⁻⁴ |
| GO:CC | Peptidase complex | 2.70 | 15 | 1.18 × 10⁻² |
| GO:CC | Preribosome | 8.06 | 43 | 6.98 × 10⁻²⁶ |
| GO:CC | Preribosome, large subunit precursor | 8.60 | 10 | 1.27 × 10⁻⁵ |
| GO:CC | Preribosome, small subunit precursor | 7.10 | 6 | 1.05 × 10⁻² |
| GO:CC | Prespliceosome | 6.31 | 6 | 1.77 × 10⁻² |
| GO:CC | Protein folding chaperone complex | 7.33 | 12 | 4.35 × 10⁻⁶ |
| GO:CC | Protein–DNA complex | 1.89 | 52 | 2.33 × 10⁻⁴ |
| GO:CC | Protein-containing complex | 1.73 | 467 | 5.00 × 10−40 |
| GO:CC | Proton-transporting ATP synthase complex | 5.87 | 9 | 1.16 × 10⁻³ |
| GO:CC | Proton-transporting ATP synthase complex, coupling factor F(o) | 7.10 | 6 | 1.05 × 10⁻² |
| GO:CC | Proton-transporting two-sector ATPase complex | 3.26 | 10 | 2.66 × 10⁻² |
| GO:CC | Replication fork | 4.82 | 13 | 1.51 × 10⁻⁴ |
| GO:CC | Respirasome | 5.22 | 8 | 6.59 × 10⁻³ |
| GO:CC | Respiratory chain complex | 5.82 | 8 | 3.33 × 10⁻³ |
| GO:CC | Ribonucleoprotein complex | 5.28 | 181 | 7.13 × 10−79 |
| GO:CC | Ribosomal subunit | 9.31 | 90 | 8.18 × 10−62 |
| GO:CC | Ribosome | 8.45 | 100 | 9.07 × 10−64 |
| GO:CC | Rough endoplasmic reticulum | 3.88 | 8 | 3.13 × 10⁻² |
| GO:CC | Small nuclear ribonucleoprotein complex | 3.65 | 11 | 7.47 × 10⁻³ |
| GO:CC | Small ribosomal subunit | 10.00 | 37 | 3.59 × 10⁻²⁶ |
| GO:CC | Small-subunit processome | 8.20 | 26 | 1.78 × 10⁻¹⁵ |
| GO:CC | sno(s)RNA-containing ribonucleoprotein complex | 7.57 | 8 | 6.08 × 10⁻⁴ |
| GO:CC | Spliceosomal complex | 2.63 | 29 | 8.28 × 10⁻⁵ |
| GO:CC | Spliceosomal snRNP complex | 3.86 | 11 | 4.98 × 10⁻³ |
| GO:CC | Spliceosomal tri-snRNP complex | 4.88 | 8 | 9.58 × 10⁻³ |
| GO:CC | Translation preinitiation complex | 13.10 | 9 | 1.03 × 10⁻⁶ |
| Molecular Function | ||||
| GO:MF | ATP hydrolysis activity | 1.81 | 38 | 1.92 × 10⁻² |
| GO:MF | ATP-dependent activity, acting on DNA | 2.75 | 20 | 4.94 × 10⁻³ |
| GO:MF | ATP-dependent protein folding chaperone | 4.92 | 15 | 1.11 × 10⁻⁴ |
| GO:MF | DNA helicase activity | 4.66 | 13 | 1.02 × 10⁻³ |
| GO:MF | NADH dehydrogenase (ubiquinone) activity | 9.68 | 6 | 7.91 × 10⁻³ |
| GO:MF | RNA binding | 3.20 | 181 | 1.08 × 10−43 |
| GO:MF | Catalytic activity, acting on DNA | 2.37 | 32 | 1.02 × 10⁻³ |
| GO:MF | Catalytic activity, acting on RNA | 2.07 | 41 | 1.27 × 10⁻³ |
| GO:MF | Catalytic activity, acting on a nucleic acid | 2.13 | 71 | 3.41 × 10⁻⁷ |
| GO:MF | Catalytic activity, acting on a tRNA | 2.83 | 19 | 4.94 × 10⁻³ |
| GO:MF | Electron transfer activity | 5.16 | 8 | 2.07 × 10⁻² |
| GO:MF | Heat shock protein binding | 3.45 | 13 | 1.17 × 10⁻² |
| GO:MF | Helicase activity | 2.66 | 21 | 4.94 × 10⁻³ |
| GO:MF | Heterocyclic compound binding | 1.23 | 180 | 4.54 × 10⁻² |
| GO:MF | Hydrolase activity, acting on acid anhydrides | 1.66 | 71 | 1.87 × 10⁻³ |
| GO:MF | Hydrolase activity, acting on acid anhydrides, in phosphorus-containing anhydrides | 1.64 | 70 | 2.65 × 10⁻³ |
| GO:MF | Identical protein binding | 2.09 | 58 | 2.05 × 10⁻⁵ |
| GO:MF | Isomerase activity | 2.25 | 21 | 3.26 × 10⁻² |
| GO:MF | mRNA binding | 2.26 | 35 | 1.02 × 10⁻³ |
| GO:MF | Nucleic acid binding | 1.74 | 292 | 1.36 × 10⁻²¹ |
| GO:MF | Nucleoside phosphate binding | 1.24 | 173 | 3.69 × 10⁻² |
| GO:MF | Nucleotide binding | 1.24 | 173 | 3.69 × 10⁻² |
| GO:MF | Organic cyclic compound binding | 1.43 | 438 | 2.05 × 10⁻¹⁷ |
| GO:MF | Oxidoreductase activity | 1.55 | 68 | 1.17 × 10⁻² |
| GO:MF | Oxidoreductase activity, acting on NAD(P)H | 4.63 | 11 | 4.18 × 10⁻³ |
| GO:MF | Oxidoreductase activity, acting on NAD(P)H, quinone or similar compound as acceptor | 7.74 | 8 | 2.16 × 10⁻³ |
| GO:MF | Oxidoreduction-driven active transmembrane transporter activity | 6.77 | 7 | 1.26 × 10⁻² |
| GO:MF | Poly(U) RNA binding | 9.68 | 5 | 3.33 × 10⁻² |
| GO:MF | Protein folding chaperone | 4.01 | 17 | 2.99 × 10⁻⁴ |
| GO:MF | Protein-folding chaperone binding | 3.45 | 13 | 1.17 × 10⁻² |
| GO:MF | Proton transmembrane transporter activity | 2.79 | 17 | 1.23 × 10⁻² |
| GO:MF | Pyrophosphatase activity | 1.65 | 70 | 2.23 × 10⁻³ |
| GO:MF | rRNA binding | 7.82 | 21 | 8.21 × 10⁻¹¹ |
| GO:MF | Ribonucleoprotein complex binding | 3.39 | 17 | 1.91 × 10⁻³ |
| GO:MF | Ribonucleoside triphosphate phosphatase activity | 1.57 | 61 | 1.65 × 10⁻² |
| GO:MF | Ribosome binding | 3.99 | 13 | 3.66 × 10⁻³ |
| GO:MF | Single-stranded DNA binding | 3.64 | 16 | 1.61 × 10⁻³ |
| GO:MF | Single-stranded DNA helicase activity | 7.04 | 8 | 3.73 × 10⁻³ |
| GO:MF | snoRNA binding | 10.84 | 14 | 7.89 × 10⁻⁹ |
| GO:MF | structural constituent of nuclear pore | 5.42 | 7 | 3.82 × 10⁻² |
| GO:MF | structural constituent of ribosome | 9.21 | 88 | 5.28 × 10−59 |
| GO:MF | Structural molecule activity | 2.69 | 109 | 8.75 × 10⁻¹⁹ |
| GO:MF | Translation elongation factor activity | 7.53 | 7 | 7.78 × 10⁻³ |
| GO:MF | Translation factor activity, RNA binding | 5.36 | 23 | 1.83 × 10⁻⁸ |
| GO:MF | Translation initiation factor activity | 5.58 | 15 | 2.21 × 10⁻⁵ |
| GO:MF | Translation regulator activity | 4.84 | 29 | 8.60 × 10⁻¹⁰ |
| GO:MF | Translation regulator activity, nucleic acid binding | 4.94 | 24 | 3.61 × 10⁻⁸ |
| GO:MF | Unfolded protein binding | 4.65 | 25 | 4.96 × 10⁻⁸ |
| GO Category | GO:Term | Fold Enrichment | Number of DEGs | p-Value (Adjusted) |
|---|---|---|---|---|
| Biological Process | ||||
| GO:BP | ERAD pathway | 6.28 | 14 | 1.77 × 10⁻⁵ |
| GO:BP | Alcohol biosynthetic process | 3.22 | 22 | 3.23 × 10⁻⁴ |
| GO:BP | Autophagy | 2.33 | 28 | 3.55 × 10⁻³ |
| GO:BP | Biosynthetic process | 1.21 | 252 | 1.72 × 10⁻² |
| GO:BP | Carbohydrate derivative metabolic process | 1.47 | 84 | 1.58 × 10⁻² |
| GO:BP | Catabolic process | 1.71 | 165 | 3.58 × 10⁻⁹ |
| GO:BP | Cell death | 1.73 | 42 | 2.50 × 10⁻² |
| GO:BP | Cellular biosynthetic process | 1.24 | 220 | 1.58 × 10⁻² |
| GO:BP | Cellular catabolic process | 1.76 | 64 | 1.02 × 10⁻³ |
| GO:BP | Cellular homeostasis | 1.64 | 45 | 3.99 × 10⁻² |
| GO:BP | Cellular lipid biosynthetic process | 7.89 | 8 | 1.81 × 10⁻³ |
| GO:BP | Cellular lipid metabolic process | 1.60 | 87 | 1.20 × 10⁻³ |
| GO:BP | Cellular localization | 1.44 | 196 | 1.35 × 10⁻⁵ |
| GO:BP | Cellular macromolecule localization | 1.51 | 135 | 1.34 × 10⁻⁴ |
| GO:BP | Cellular metabolic process | 1.25 | 422 | 7.24 × 10⁻⁶ |
| GO:BP | Cellular response to stress | 1.69 | 105 | 1.87 × 10⁻⁵ |
| GO:BP | Cellular response to topologically incorrect protein | 2.87 | 13 | 4.82 × 10⁻² |
| GO:BP | Chaperone-mediated protein folding | 3.70 | 10 | 3.73 × 10⁻² |
| GO:BP | Chemical homeostasis | 1.61 | 54 | 2.28 × 10⁻² |
| GO:BP | Cholesterol biosynthetic process | 7.14 | 14 | 3.72 × 10⁻⁶ |
| GO:BP | Cholesterol metabolic process | 3.70 | 16 | 1.34 × 10⁻³ |
| GO:BP | Cytosolic transport | 2.78 | 16 | 2.09 × 10⁻² |
| GO:BP | Embryonic epithelial tube formation | 3.89 | 10 | 2.70 × 10⁻² |
| GO:BP | Embryonic morphogenesis | 2.03 | 28 | 2.34 × 10⁻² |
| GO:BP | Endocytosis | 1.83 | 41 | 1.20 × 10⁻² |
| GO:BP | Epithelial tube formation | 3.79 | 10 | 3.22 × 10⁻² |
| GO:BP | Ergosterol biosynthetic process | 10.76 | 8 | 1.76 × 10⁻⁴ |
| GO:BP | Ergosterol metabolic process | 10.76 | 8 | 1.76 × 10⁻⁴ |
| GO:BP | Establishment of localization | 1.40 | 298 | 9.39 × 10⁻⁸ |
| GO:BP | Establishment of localization in cell | 1.60 | 145 | 2.78 × 10⁻⁶ |
| GO:BP | Establishment of protein localization | 1.63 | 100 | 1.68 × 10⁻⁴ |
| GO:BP | Establishment of protein localization to organelle | 1.85 | 42 | 7.96 × 10⁻³ |
| GO:BP | Glycoprotein metabolic process | 1.88 | 40 | 8.79 × 10⁻³ |
| GO:BP | Heparan sulfate proteoglycan biosynthetic process | 7.75 | 11 | 5.17 × 10⁻⁵ |
| GO:BP | Homeostatic process | 1.60 | 73 | 3.78 × 10⁻³ |
| GO:BP | Intracellular monoatomic cation homeostasis | 1.82 | 36 | 2.50 × 10⁻² |
| GO:BP | Intracellular monoatomic ion homeostasis | 1.82 | 36 | 2.63 × 10⁻² |
| GO:BP | Intracellular pH reduction | 6.12 | 12 | 1.68 × 10⁻⁴ |
| GO:BP | Intracellular protein transport | 2.03 | 69 | 6.74 × 10⁻⁶ |
| GO:BP | Intracellular signal transduction | 1.39 | 119 | 8.90 × 10⁻³ |
| GO:BP | Intracellular transport | 1.66 | 118 | 8.14 × 10⁻⁶ |
| GO:BP | Lipid biosynthetic process | 1.77 | 57 | 2.31 × 10⁻³ |
| GO:BP | Lipid metabolic process | 1.50 | 105 | 1.77 × 10⁻³ |
| GO:BP | Localization | 1.34 | 322 | 9.94 × 10⁻⁷ |
| GO:BP | Lysosomal lumen acidification | 10.57 | 5 | 2.34 × 10⁻² |
| GO:BP | Macroautophagy | 2.32 | 19 | 4.03 × 10⁻² |
| GO:BP | Macromolecule catabolic process | 1.95 | 90 | 5.00 × 10⁻⁷ |
| GO:BP | Macromolecule localization | 1.48 | 162 | 4.06 × 10⁻⁵ |
| GO:BP | Macromolecule metabolic process | 1.35 | 435 | 1.22 × 10⁻¹⁰ |
| GO:BP | Macromolecule modification | 1.62 | 212 | 2.68 × 10⁻¹⁰ |
| GO:BP | Metabolic process | 1.25 | 609 | 1.89 × 10⁻¹⁰ |
| GO:BP | Modification-dependent macromolecule catabolic process | 1.84 | 49 | 3.12 × 10⁻³ |
| GO:BP | Modification-dependent protein catabolic process | 1.84 | 49 | 2.99 × 10⁻³ |
| GO:BP | Monoatomic cation homeostasis | 1.75 | 39 | 2.96 × 10⁻² |
| GO:BP | Monoatomic ion homeostasis | 1.75 | 40 | 2.65 × 10⁻² |
| GO:BP | Morphogenesis of embryonic epithelium | 3.70 | 11 | 2.25 × 10⁻² |
| GO:BP | Negative regulation of biological process | 1.33 | 216 | 5.68 × 10⁻⁴ |
| GO:BP | Negative regulation of biosynthetic process | 1.56 | 83 | 3.32 × 10⁻³ |
| GO:BP | Negative regulation of cellular biosynthetic process | 1.57 | 83 | 2.79 × 10⁻³ |
| GO:BP | Negative regulation of cellular metabolic process | 1.64 | 99 | 1.56 × 10⁻⁴ |
| GO:BP | Negative regulation of cellular process | 1.37 | 203 | 1.70 × 10⁻⁴ |
| GO:BP | Negative regulation of cytokine production | 3.15 | 13 | 2.50 × 10⁻² |
| GO:BP | Negative regulation of gene expression | 2.15 | 54 | 3.27 × 10⁻⁵ |
| GO:BP | Negative regulation of intracellular signal transduction | 2.24 | 41 | 2.58 × 10⁻⁴ |
| GO:BP | Negative regulation of macromolecule biosynthetic process | 1.53 | 79 | 8.47 × 10⁻³ |
| GO:BP | Negative regulation of macromolecule metabolic process | 1.45 | 97 | 9.56 × 10⁻³ |
| GO:BP | Negative regulation of metabolic process | 1.55 | 112 | 3.27 × 10⁻⁴ |
| GO:BP | Neural tube formation | 4.03 | 9 | 4.08 × 10⁻² |
| GO:BP | Nitrogen compound transport | 1.73 | 118 | 1.35 × 10⁻⁶ |
| GO:BP | Organic hydroxy compound biosynthetic process | 2.48 | 23 | 6.55 × 10⁻³ |
| GO:BP | Organonitrogen compound catabolic process | 1.84 | 100 | 1.01 × 10⁻⁶ |
| GO:BP | Organonitrogen compound metabolic process | 1.39 | 381 | 1.64 × 10⁻¹⁰ |
| GO:BP | Peptidyl-amino acid modification | 2.40 | 42 | 4.49 × 10⁻⁵ |
| GO:BP | Peptidyl-serine modification | 2.87 | 13 | 4.82 × 10⁻² |
| GO:BP | Peptidyl-threonine modification | 5.28 | 10 | 3.48 × 10⁻³ |
| GO:BP | Phosphate-containing compound metabolic process | 1.31 | 158 | 1.20 × 10⁻² |
| GO:BP | Phospholipid biosynthetic process | 2.03 | 24 | 4.91 × 10⁻² |
| GO:BP | Phospholipid metabolic process | 1.71 | 39 | 4.17 × 10⁻² |
| GO:BP | Phosphorus metabolic process | 1.31 | 160 | 9.82 × 10⁻³ |
| GO:BP | Phosphorylation | 1.42 | 79 | 4.67 × 10⁻² |
| GO:BP | Phytosteroid biosynthetic process | 9.86 | 10 | 1.77 × 10⁻⁵ |
| GO:BP | Phytosteroid metabolic process | 9.86 | 10 | 1.77 × 10⁻⁵ |
| GO:BP | Positive regulation of apoptotic process | 2.19 | 25 | 1.78 × 10⁻² |
| GO:BP | Positive regulation of biological process | 1.26 | 249 | 2.53 × 10⁻³ |
| GO:BP | Positive regulation of catabolic process | 2.38 | 38 | 1.68 × 10⁻⁴ |
| GO:BP | Positive regulation of cell communication | 1.53 | 74 | 1.13 × 10⁻² |
| GO:BP | Positive regulation of cellular process | 1.24 | 217 | 1.54 × 10⁻² |
| GO:BP | Positive regulation of intracellular signal transduction | 1.61 | 49 | 3.55 × 10⁻² |
| GO:BP | Positive regulation of macromolecule metabolic process | 1.32 | 123 | 3.22 × 10⁻² |
| GO:BP | Positive regulation of metabolic process | 1.38 | 142 | 3.34 × 10⁻³ |
| GO:BP | Positive regulation of programmed cell death | 2.10 | 25 | 2.71 × 10⁻² |
| GO:BP | Positive regulation of protein catabolic process | 2.64 | 18 | 1.71 × 10⁻² |
| GO:BP | Positive regulation of protein metabolic process | 1.67 | 50 | 1.78 × 10⁻² |
| GO:BP | Positive regulation of response to stimulus | 1.43 | 90 | 2.09 × 10⁻² |
| GO:BP | Positive regulation of signal transduction | 1.64 | 70 | 3.22 × 10⁻³ |
| GO:BP | Positive regulation of signaling | 1.53 | 74 | 1.13 × 10⁻² |
| GO:BP | Post-translational protein modification | 1.73 | 75 | 4.24 × 10⁻⁴ |
| GO:BP | Primary metabolic process | 1.32 | 558 | 9.52 × 10⁻¹⁴ |
| GO:BP | Process utilizing autophagic mechanism | 2.33 | 28 | 3.55 × 10⁻³ |
| GO:BP | Programmed cell death | 1.73 | 42 | 2.50 × 10⁻² |
| GO:BP | Proteasomal protein catabolic process | 2.36 | 42 | 6.24 × 10⁻⁵ |
| GO:BP | Proteasome-mediated ubiquitin-dependent protein catabolic process | 1.90 | 28 | 4.97 × 10⁻² |
| GO:BP | Protein catabolic process | 2.07 | 71 | 2.36 × 10⁻⁶ |
| GO:BP | Protein export from nucleus | 4.55 | 8 | 4.17 × 10⁻² |
| GO:BP | Protein folding | 2.40 | 26 | 3.87 × 10⁻³ |
| GO:BP | Protein localization | 1.51 | 135 | 1.30 × 10⁻⁴ |
| GO:BP | Protein localization to organelle | 1.53 | 57 | 4.32 × 10⁻² |
| GO:BP | Protein localization to vacuole | 2.76 | 14 | 4.39 × 10⁻² |
| GO:BP | Protein maturation | 1.70 | 41 | 3.55 × 10⁻² |
| GO:BP | Protein metabolic process | 1.48 | 313 | 1.04 × 10⁻¹⁰ |
| GO:BP | Protein modification by small protein conjugation | 1.59 | 56 | 2.50 × 10⁻² |
| GO:BP | Protein modification by small protein conjugation or removal | 1.73 | 73 | 5.68 × 10⁻⁴ |
| GO:BP | Protein modification by small protein removal | 2.51 | 18 | 2.60 × 10⁻² |
| GO:BP | Protein modification process | 1.68 | 202 | 1.04 × 10⁻¹⁰ |
| GO:BP | Protein phosphorylation | 1.80 | 64 | 5.84 × 10⁻⁴ |
| GO:BP | Protein transport | 1.62 | 86 | 8.20 × 10⁻⁴ |
| GO:BP | Protein ubiquitination | 1.60 | 51 | 3.47 × 10⁻² |
| GO:BP | Proteoglycan biosynthetic process | 3.85 | 13 | 4.99 × 10⁻³ |
| GO:BP | Proteoglycan metabolic process | 3.70 | 15 | 2.31 × 10⁻³ |
| GO:BP | Proteolysis | 1.45 | 101 | 6.55 × 10⁻³ |
| GO:BP | Proteolysis involved in protein catabolic process | 1.97 | 63 | 5.57 × 10⁻⁵ |
| GO:BP | Regulation of apoptotic process | 1.62 | 58 | 1.54 × 10⁻² |
| GO:BP | Regulation of autophagy | 2.31 | 24 | 1.20 × 10⁻² |
| GO:BP | Regulation of catabolic process | 2.09 | 66 | 5.48 × 10⁻⁶ |
| GO:BP | Regulation of cell communication | 1.33 | 158 | 7.93 × 10⁻³ |
| GO:BP | Regulation of cellular catabolic process | 2.07 | 25 | 3.36 × 10⁻² |
| GO:BP | Regulation of cellular metabolic process | 1.26 | 290 | 8.57 × 10⁻⁴ |
| GO:BP | Regulation of cellular pH | 3.19 | 19 | 1.47 × 10⁻³ |
| GO:BP | Regulation of cytokine production | 2.27 | 32 | 2.03 × 10⁻³ |
| GO:BP | Regulation of cytoplasmic pattern recognition receptor signaling pathway | 3.89 | 10 | 2.70 × 10⁻² |
| GO:BP | Regulation of defense response | 1.88 | 34 | 2.33 × 10⁻² |
| GO:BP | Regulation of intracellular pH | 3.13 | 18 | 2.85 × 10⁻³ |
| GO:BP | Regulation of intracellular signal transduction | 1.60 | 99 | 3.58 × 10⁻⁴ |
| GO:BP | Regulation of lysosomal lumen pH | 8.07 | 6 | 1.86 × 10⁻² |
| GO:BP | Regulation of macromolecule metabolic process | 1.22 | 291 | 3.83 × 10⁻³ |
| GO:BP | Regulation of metabolic process | 1.27 | 329 | 6.35 × 10⁻⁵ |
| GO:BP | Regulation of pH | 2.99 | 19 | 3.08 × 10⁻³ |
| GO:BP | Regulation of primary metabolic process | 1.20 | 262 | 2.50 × 10⁻² |
| GO:BP | Regulation of programmed cell death | 1.58 | 59 | 2.12 × 10⁻² |
| GO:BP | Regulation of proteasomal protein catabolic process | 2.60 | 16 | 3.55 × 10⁻² |
| GO:BP | Regulation of protein catabolic process | 2.47 | 27 | 2.19 × 10⁻³ |
| GO:BP | Regulation of protein metabolic process | 1.60 | 85 | 1.41 × 10⁻³ |
| GO:BP | Regulation of proteolysis involved in protein catabolic process | 2.78 | 19 | 6.74 × 10⁻³ |
| GO:BP | Regulation of response to stimulus | 1.34 | 179 | 2.19 × 10⁻³ |
| GO:BP | Regulation of response to stress | 1.78 | 58 | 1.81 × 10⁻³ |
| GO:BP | Regulation of signal transduction | 1.41 | 146 | 1.27 × 10⁻³ |
| GO:BP | Regulation of signaling | 1.32 | 158 | 1.06 × 10⁻² |
| GO:BP | Response to chemical | 1.49 | 123 | 6.61 × 10⁻⁴ |
| GO:BP | Response to endoplasmic reticulum stress | 3.24 | 23 | 1.76 × 10⁻⁴ |
| GO:BP | Response to nitrogen compound | 1.93 | 40 | 5.15 × 10⁻³ |
| GO:BP | Response to organonitrogen compound | 2.06 | 37 | 3.12 × 10⁻³ |
| GO:BP | Response to stress | 1.42 | 149 | 8.20 × 10⁻⁴ |
| GO:BP | Response to topologically incorrect protein | 3.00 | 15 | 1.61 × 10⁻² |
| GO:BP | Secondary alcohol biosynthetic process | 7.40 | 17 | 6.60 × 10⁻⁸ |
| GO:BP | Secondary alcohol metabolic process | 3.50 | 18 | 8.20 × 10⁻⁴ |
| GO:BP | Small molecule biosynthetic process | 1.72 | 44 | 2.28 × 10⁻² |
| GO:BP | Steroid biosynthetic process | 3.65 | 20 | 1.68 × 10⁻⁴ |
| GO:BP | Steroid metabolic process | 2.50 | 24 | 4.19 × 10⁻³ |
| GO:BP | Sterol biosynthetic process | 6.99 | 17 | 1.44 × 10⁻⁷ |
| GO:BP | Sterol metabolic process | 3.60 | 19 | 3.27 × 10⁻⁴ |
| GO:BP | Sulfur compound biosynthetic process | 2.75 | 18 | 1.13 × 10⁻² |
| GO:BP | Sulfur compound metabolic process | 1.95 | 30 | 2.66 × 10⁻² |
| GO:BP | Tissue morphogenesis | 2.10 | 24 | 3.43 × 10⁻² |
| GO:BP | Transport | 1.41 | 283 | 9.39 × 10⁻⁸ |
| GO:BP | Ubiquitin-dependent protein catabolic process | 1.89 | 49 | 1.89 × 10⁻³ |
| GO:BP | Vacuolar acidification | 6.16 | 10 | 1.18 × 10⁻³ |
| GO:BP | Vacuolar transport | 2.47 | 23 | 7.10 × 10⁻³ |
| GO:BP | Vacuole organization | 2.24 | 20 | 4.33 × 10⁻² |
| GO:BP | Vesicle organization | 1.89 | 29 | 4.52 × 10⁻² |
| GO:BP | Vesicle-mediated transport | 1.66 | 119 | 8.14 × 10⁻⁶ |
| Cellular Component | ||||
| GO:CC | ATPase complex | 2.46 | 19 | 1.18 × 10⁻² |
| GO:CC | ATPase dependent transmembrane transport complex | 3.96 | 11 | 6.39 × 10⁻³ |
| GO:CC | Golgi apparatus | 1.68 | 105 | 4.83 × 10⁻⁶ |
| GO:CC | Golgi apparatus subcompartment | 1.83 | 28 | 4.19 × 10⁻² |
| GO:CC | Golgi cisterna | 3.11 | 12 | 2.23 × 10⁻² |
| GO:CC | Golgi membrane | 2.28 | 45 | 1.13 × 10⁻⁵ |
| GO:CC | Bounding membrane of organelle | 1.89 | 141 | 1.37 × 10⁻¹¹ |
| GO:CC | Catalytic complex | 1.30 | 130 | 2.23 × 10⁻² |
| GO:CC | Cation-transporting ATPase complex | 4.14 | 11 | 4.36 × 10⁻³ |
| GO:CC | Clathrin-coated vesicle | 2.72 | 16 | 1.23 × 10⁻² |
| GO:CC | Coated vesicle | 2.38 | 26 | 1.90 × 10⁻³ |
| GO:CC | Cytoplasm | 1.30 | 827 | 6.20 × 10⁻²⁷ |
| GO:CC | Cytoplasmic vesicle | 1.65 | 128 | 5.29 × 10⁻⁷ |
| GO:CC | Cytoplasmic vesicle membrane | 1.85 | 62 | 9.07 × 10⁻⁵ |
| GO:CC | Cytosol | 1.58 | 214 | 4.32 × 10⁻¹⁰ |
| GO:CC | Early endosome | 1.94 | 28 | 2.07 × 10⁻² |
| GO:CC | Endocytic vesicle | 2.26 | 18 | 3.61 × 10⁻² |
| GO:CC | Endomembrane system | 1.68 | 315 | 1.99 × 10⁻²⁰ |
| GO:CC | Endoplasmic reticulum | 1.88 | 145 | 8.54 × 10⁻¹² |
| GO:CC | Endoplasmic reticulum membrane | 1.98 | 84 | 1.17 × 10⁻⁷ |
| GO:CC | Endoplasmic reticulum subcompartment | 1.98 | 85 | 9.98 × 10⁻⁸ |
| GO:CC | Endosome | 1.81 | 71 | 3.79 × 10⁻⁵ |
| GO:CC | Endosome membrane | 2.16 | 37 | 4.17 × 10⁻⁴ |
| GO:CC | Intracellular anatomical structure | 1.16 | 1043 | 5.44 × 10⁻²⁰ |
| GO:CC | Intracellular membrane-bounded organelle | 1.30 | 805 | 3.83 × 10⁻²⁵ |
| GO:CC | Intracellular organelle | 1.19 | 881 | 2.20 × 10⁻¹⁶ |
| GO:CC | Intracellular organelle lumen | 1.53 | 190 | 5.31 × 10⁻⁸ |
| GO:CC | Intracellular protein-containing complex | 1.47 | 79 | 1.13 × 10⁻² |
| GO:CC | Intracellular vesicle | 1.63 | 128 | 1.01 × 10⁻⁶ |
| GO:CC | Lysosomal membrane | 3.03 | 32 | 1.47 × 10⁻⁶ |
| GO:CC | Lysosome | 2.62 | 52 | 2.58 × 10⁻⁸ |
| GO:CC | Lytic vacuole | 2.59 | 52 | 3.79 × 10⁻⁸ |
| GO:CC | Lytic vacuole membrane | 3.03 | 32 | 1.47 × 10⁻⁶ |
| GO:CC | Membrane | 1.12 | 612 | 2.43 × 10⁻³ |
| GO:CC | Membrane microdomain | 2.66 | 16 | 1.48 × 10⁻² |
| GO:CC | Membrane raft | 2.69 | 16 | 1.35 × 10⁻² |
| GO:CC | Membrane-bounded organelle | 1.26 | 822 | 4.43 × 10⁻²² |
| GO:CC | Membrane-enclosed lumen | 1.53 | 190 | 5.31 × 10⁻⁸ |
| GO:CC | Nuclear body | 1.81 | 33 | 2.23 × 10⁻² |
| GO:CC | Nuclear lumen | 1.55 | 164 | 4.35 × 10⁻⁷ |
| GO:CC | Nuclear outer membrane-endoplasmic reticulum membrane network | 1.94 | 84 | 2.90 × 10⁻⁷ |
| GO:CC | Nucleolus | 1.62 | 46 | 2.25 × 10⁻² |
| GO:CC | Nucleoplasm | 1.67 | 137 | 9.98 × 10⁻⁸ |
| GO:CC | Nucleus | 1.24 | 447 | 1.08 × 10⁻⁶ |
| GO:CC | Organelle | 1.17 | 893 | 9.33 × 10⁻¹⁴ |
| GO:CC | Organelle lumen | 1.53 | 190 | 5.31 × 10⁻⁸ |
| GO:CC | Organelle membrane | 1.82 | 244 | 1.57 × 10⁻¹⁹ |
| GO:CC | Organelle subcompartment | 1.93 | 111 | 1.94 × 10⁻⁹ |
| GO:CC | Perinuclear region of cytoplasm | 2.47 | 34 | 6.02 × 10⁻⁵ |
| GO:CC | Protein-containing complex | 1.13 | 366 | 4.13 × 10⁻² |
| GO:CC | Proton-transporting V-type ATPase complex | 4.52 | 8 | 2.23 × 10⁻² |
| GO:CC | Vacuolar membrane | 2.73 | 39 | 9.21 × 10⁻⁷ |
| GO:CC | Vacuolar proton-transporting V-type ATPase complex | 6.33 | 8 | 2.95 × 10⁻³ |
| GO:CC | Vacuole | 2.48 | 64 | 2.52 × 10⁻⁹ |
| GO:CC | Vesicle | 1.56 | 136 | 3.62 × 10⁻⁶ |
| GO:CC | Vesicle membrane | 1.94 | 66 | 9.55 × 10⁻⁶ |
| Molecular Function | ||||
| GO:MF | Acyltransferase activity | 1.63 | 72 | 7.45 × 10⁻³ |
| GO:MF | Binding | 1.07 | 924 | 1.02 × 10⁻² |
| GO:MF | Catalytic activity | 1.16 | 522 | 1.47 × 10⁻³ |
| GO:MF | Catalytic activity, acting on a protein | 1.28 | 230 | 4.88 × 10⁻³ |
| GO:MF | Enzyme binding | 1.95 | 120 | 2.10 × 10⁻⁹ |
| GO:MF | Identical protein binding | 2.17 | 75 | 2.02 × 10⁻⁷ |
| GO:MF | Kinase binding | 2.08 | 45 | 1.47 × 10⁻³ |
| GO:MF | Lipid binding | 1.57 | 62 | 4.54 × 10⁻² |
| GO:MF | Manganese ion binding | 4.71 | 10 | 2.12 × 10⁻² |
| GO:MF | Misfolded protein binding | 7.40 | 10 | 9.76 × 10⁻⁴ |
| GO:MF | Protein binding | 1.24 | 551 | 4.61 × 10⁻⁸ |
| GO:MF | Protein domain specific binding | 2.12 | 28 | 3.51 × 10⁻² |
| GO:MF | Protein kinase binding | 2.04 | 40 | 4.88 × 10⁻³ |
| GO:MF | Steroid binding | 3.20 | 14 | 3.61 × 10⁻² |
| GO:MF | Transferase activity | 1.30 | 233 | 2.67 × 10⁻³ |
| GO:MF | Ubiquitin-like protein ligase binding | 2.50 | 19 | 4.88 × 10⁻² |
| GO Category | GO:Term | Fold Enrichment | Number of DEGs | p-Value (Adjusted) |
|---|---|---|---|---|
| Biological Process | ||||
| GO:BP | “de novo” IMP biosynthetic process | 8.46 | 5 | 3.63 × 10⁻² |
| GO:BP | “de novo” XMP biosynthetic process | 13.53 | 4 | 3.42 × 10⁻² |
| GO:BP | 2′-deoxyribonucleotide biosynthetic process | 7.89 | 7 | 3.48 × 10⁻³ |
| GO:BP | 2′-deoxyribonucleotide metabolic process | 5.26 | 7 | 3.23 × 10⁻² |
| GO:BP | ADP catabolic process | 3.54 | 11 | 2.13 × 10⁻² |
| GO:BP | ADP metabolic process | 3.46 | 11 | 2.38 × 10⁻² |
| GO:BP | ATP biosynthetic process | 5.95 | 11 | 2.49 × 10⁻⁴ |
| GO:BP | ATP metabolic process | 3.84 | 23 | 4.27 × 10⁻⁶ |
| GO:BP | ATP synthesis coupled electron transport | 6.26 | 25 | 1.40 × 10⁻¹¹ |
| GO:BP | DNA damage response | 2.04 | 81 | 1.12 × 10⁻⁷ |
| GO:BP | DNA integrity checkpoint signaling | 2.95 | 17 | 5.00 × 10⁻³ |
| GO:BP | DNA metabolic process | 2.27 | 92 | 2.37 × 10⁻¹¹ |
| GO:BP | DNA recombination | 2.13 | 32 | 3.19 × 10⁻³ |
| GO:BP | DNA repair | 2.28 | 66 | 5.27 × 10⁻⁸ |
| GO:BP | DNA replication | 3.29 | 35 | 9.38 × 10⁻⁸ |
| GO:BP | DNA-templated DNA replication | 3.44 | 29 | 8.52 × 10⁻⁷ |
| GO:BP | DNA-templated DNA replication maintenance of fidelity | 3.69 | 9 | 4.84 × 10⁻² |
| GO:BP | GMP biosynthetic process | 6.76 | 6 | 2.73 × 10⁻² |
| GO:BP | L-amino acid biosynthetic process | 3.09 | 13 | 2.14 × 10⁻² |
| GO:BP | L-amino acid metabolic process | 2.46 | 28 | 9.12 × 10⁻⁴ |
| GO:BP | RNA biosynthetic process | 1.71 | 122 | 4.31 × 10⁻⁷ |
| GO:BP | RNA metabolic process | 1.89 | 156 | 1.03 × 10⁻¹² |
| GO:BP | RNA processing | 1.85 | 99 | 2.56 × 10⁻⁷ |
| GO:BP | RNA splicing | 2.25 | 40 | 1.31 × 10⁻⁴ |
| GO:BP | RNA splicing, via transesterification reactions | 2.42 | 34 | 1.68 × 10⁻⁴ |
| GO:BP | RNA splicing, via transesterification reactions with bulged adenosine as nucleophile | 2.42 | 34 | 1.68 × 10⁻⁴ |
| GO:BP | XMP biosynthetic process | 13.53 | 4 | 3.42 × 10⁻² |
| GO:BP | XMP metabolic process | 13.53 | 4 | 3.42 × 10⁻² |
| GO:BP | Aerobic electron transport chain | 6.35 | 23 | 9.80 × 10⁻¹¹ |
| GO:BP | Aerobic respiration | 5.33 | 41 | 7.30 × 10⁻¹⁷ |
| GO:BP | Alpha-amino acid biosynthetic process | 3.05 | 14 | 1.48 × 10⁻² |
| GO:BP | Alpha-amino acid metabolic process | 2.16 | 29 | 5.33 × 10⁻³ |
| GO:BP | Amino acid activation | 4.80 | 22 | 1.38 × 10⁻⁷ |
| GO:BP | Amino acid metabolic process | 2.61 | 52 | 4.48 × 10⁻⁸ |
| GO:BP | Biosynthetic process | 1.78 | 404 | 6.23 × 10⁻³³ |
| GO:BP | Carbohydrate derivative metabolic process | 1.42 | 89 | 1.91 × 10⁻² |
| GO:BP | Carboxylic acid metabolic process | 1.76 | 78 | 6.39 × 10⁻⁵ |
| GO:BP | Catabolic process | 1.30 | 138 | 2.31 × 10⁻² |
| GO:BP | Cell cycle | 2.28 | 145 | 5.63 × 10⁻¹⁹ |
| GO:BP | Cell cycle DNA replication | 4.68 | 9 | 1.22 × 10⁻² |
| GO:BP | Cell cycle checkpoint signaling | 3.05 | 23 | 1.96 × 10⁻⁴ |
| GO:BP | Cell cycle phase transition | 2.83 | 14 | 2.68 × 10⁻² |
| GO:BP | Cell cycle process | 2.35 | 121 | 1.51 × 10⁻¹⁶ |
| GO:BP | Cell division | 2.28 | 40 | 9.83 × 10⁻⁵ |
| GO:BP | Cellular biosynthetic process | 1.83 | 356 | 7.55 × 10⁻³¹ |
| GO:BP | Cellular component assembly | 1.51 | 179 | 8.36 × 10⁻⁷ |
| GO:BP | Cellular component biogenesis | 1.61 | 217 | 5.62 × 10⁻¹¹ |
| GO:BP | Cellular component disassembly | 2.06 | 26 | 2.14 × 10⁻² |
| GO:BP | Cellular component organization | 1.20 | 381 | 8.36 × 10⁻⁴ |
| GO:BP | Cellular component organization or biogenesis | 1.25 | 417 | 3.54 × 10⁻⁶ |
| GO:BP | Cellular metabolic process | 1.55 | 571 | 2.12 × 10⁻³² |
| GO:BP | Cellular modified amino acid metabolic process | 2.19 | 21 | 3.21 × 10⁻² |
| GO:BP | Cellular process | 1.10 | 1121 | 1.42 × 10⁻¹⁰ |
| GO:BP | Cellular respiration | 4.93 | 43 | 2.46 × 10⁻¹⁶ |
| GO:BP | Cellular response to stress | 1.74 | 118 | 2.81 × 10⁻⁷ |
| GO:BP | Centromere complex assembly | 4.92 | 8 | 2.09 × 10⁻² |
| GO:BP | Chromatin organization | 2.10 | 51 | 4.41 × 10⁻⁵ |
| GO:BP | Chromatin remodeling | 2.07 | 37 | 1.70 × 10⁻³ |
| GO:BP | Chromosome organization | 2.47 | 59 | 2.36 × 10⁻⁸ |
| GO:BP | Chromosome segregation | 2.49 | 47 | 1.02 × 10⁻⁶ |
| GO:BP | Cytoplasmic translation | 8.27 | 33 | 2.36 × 10⁻²⁰ |
| GO:BP | Cytoplasmic translational initiation | 7.38 | 12 | 7.93 × 10⁻⁶ |
| GO:BP | Deoxyribonucleotide biosynthetic process | 6.37 | 8 | 3.90 × 10⁻³ |
| GO:BP | Deoxyribonucleotide metabolic process | 4.51 | 8 | 3.17 × 10⁻² |
| GO:BP | Deoxyribose phosphate biosynthetic process | 7.89 | 7 | 3.48 × 10⁻³ |
| GO:BP | Deoxyribose phosphate metabolic process | 4.98 | 7 | 4.10 × 10⁻² |
| GO:BP | Double-strand break repair | 2.15 | 31 | 3.48 × 10⁻³ |
| GO:BP | Double-strand break repair via homologous recombination | 2.29 | 20 | 2.53 × 10⁻² |
| GO:BP | Electron transport chain | 5.64 | 30 | 1.03 × 10⁻¹² |
| GO:BP | Energy derivation by oxidation of organic compounds | 3.40 | 46 | 5.23 × 10⁻¹¹ |
| GO:BP | Fatty acid beta-oxidation | 3.57 | 14 | 3.37 × 10⁻³ |
| GO:BP | Fatty acid oxidation | 3.27 | 14 | 7.85 × 10⁻³ |
| GO:BP | Formation of cytoplasmic translation initiation complex | 9.84 | 8 | 1.51 × 10⁻⁴ |
| GO:BP | Formation of translation preinitiation complex | 9.66 | 5 | 2.30 × 10⁻² |
| GO:BP | Gene expression | 2.26 | 288 | 1.04 × 10−39 |
| GO:BP | Generation of precursor metabolites and energy | 3.07 | 60 | 1.49 × 10⁻¹² |
| GO:BP | Glycolytic process | 3.63 | 11 | 1.81 × 10⁻² |
| GO:BP | Import into the mitochondrion | 3.14 | 13 | 1.89 × 10⁻² |
| GO:BP | Lipid oxidation | 3.21 | 14 | 9.33 × 10⁻³ |
| GO:BP | mRNA metabolic process | 1.95 | 56 | 1.28 × 10⁻⁴ |
| GO:BP | mRNA processing | 2.14 | 45 | 1.28 × 10⁻⁴ |
| GO:BP | mRNA splicing, via spliceosome | 2.42 | 34 | 1.68 × 10⁻⁴ |
| GO:BP | Macromolecule biosynthetic process | 2.03 | 319 | 5.47 × 10⁻³⁵ |
| GO:BP | Macromolecule catabolic process | 1.43 | 72 | 4.46 × 10⁻² |
| GO:BP | Macromolecule metabolic process | 1.54 | 540 | 3.53 × 10⁻²⁹ |
| GO:BP | Maturation of LSU-rRNA | 3.76 | 10 | 2.42 × 10⁻² |
| GO:BP | Meiosis I cell cycle process | 2.43 | 16 | 4.50 × 10⁻² |
| GO:BP | Meiotic cell cycle | 2.42 | 29 | 8.58 × 10⁻⁴ |
| GO:BP | Meiotic cell cycle process | 2.71 | 28 | 1.68 × 10⁻⁴ |
| GO:BP | Meiotic nuclear division | 2.71 | 24 | 8.57 × 10⁻⁴ |
| GO:BP | Metabolic process | 1.43 | 761 | 3.14 × 10−36 |
| GO:BP | Microtubule cytoskeleton organization involved in mitosis | 2.67 | 28 | 2.13 × 10⁻⁴ |
| GO:BP | Microtubule-based process | 1.44 | 85 | 1.63 × 10⁻² |
| GO:BP | Mitochondrial ATP synthesis coupled electron transport | 6.37 | 24 | 2.94 × 10⁻¹¹ |
| GO:BP | Mitochondrial electron transport, NADH to ubiquinone | 5.41 | 10 | 1.70 × 10⁻³ |
| GO:BP | Mitochondrial electron transport, succinate to ubiquinone | 13.53 | 4 | 3.42 × 10⁻² |
| GO:BP | Mitochondrial gene expression | 3.07 | 17 | 3.37 × 10⁻³ |
| GO:BP | Mitochondrial translation | 3.64 | 14 | 2.78 × 10⁻³ |
| GO:BP | Mitochondrial transmembrane transport | 2.89 | 19 | 2.75 × 10⁻³ |
| GO:BP | Mitochondrial transport | 2.68 | 23 | 1.42 × 10⁻³ |
| GO:BP | Mitochondrion organization | 1.81 | 38 | 1.58 × 10⁻² |
| GO:BP | Mitotic DNA integrity checkpoint signaling | 3.06 | 12 | 3.38 × 10⁻² |
| GO:BP | Mitotic cell cycle | 2.64 | 95 | 5.25 × 10⁻¹⁶ |
| GO:BP | Mitotic cell cycle checkpoint signaling | 3.03 | 17 | 3.78 × 10⁻³ |
| GO:BP | Mitotic cell cycle phase transition | 2.87 | 14 | 2.38 × 10⁻² |
| GO:BP | Mitotic cell cycle process | 2.68 | 76 | 9.49 × 10⁻¹³ |
| GO:BP | Mitotic nuclear division | 2.82 | 20 | 2.41 × 10⁻³ |
| GO:BP | Mitotic sister chromatid segregation | 2.92 | 19 | 2.39 × 10⁻³ |
| GO:BP | Mitotic spindle organization | 2.76 | 22 | 1.43 × 10⁻³ |
| GO:BP | Negative regulation of cell cycle | 2.03 | 30 | 1.10 × 10⁻² |
| GO:BP | Negative regulation of cell cycle phase transition | 2.30 | 25 | 6.05 × 10⁻³ |
| GO:BP | Negative regulation of cell cycle process | 2.15 | 27 | 9.53 × 10⁻³ |
| GO:BP | Non-membrane-bounded organelle assembly | 2.40 | 49 | 1.65 × 10⁻⁶ |
| GO:BP | Nuclear DNA replication | 4.68 | 9 | 1.22 × 10⁻² |
| GO:BP | Nuclear chromosome segregation | 2.47 | 32 | 2.06 × 10⁻⁴ |
| GO:BP | Nuclear division | 2.71 | 42 | 6.47 × 10⁻⁷ |
| GO:BP | Nucleic acid biosynthetic process | 1.75 | 131 | 2.42 × 10⁻⁸ |
| GO:BP | Nucleic acid metabolic process | 2.02 | 241 | 3.92 × 10⁻²⁵ |
| GO:BP | Nucleobase-containing compound biosynthetic process | 1.80 | 168 | 6.72 × 10⁻¹² |
| GO:BP | Nucleobase-containing compound catabolic process | 1.84 | 32 | 2.83 × 10⁻² |
| GO:BP | Nucleobase-containing compound metabolic process | 1.99 | 308 | 3.62 × 10⁻³² |
| GO:BP | Nucleobase-containing small molecule metabolic process | 1.91 | 67 | 2.86 × 10⁻⁵ |
| GO:BP | Nucleoside diphosphate metabolic process | 2.91 | 14 | 2.17 × 10⁻² |
| GO:BP | Nucleoside monophosphate biosynthetic process | 3.25 | 12 | 2.30 × 10⁻² |
| GO:BP | Nucleoside monophosphate metabolic process | 2.90 | 12 | 4.90 × 10⁻² |
| GO:BP | Nucleoside phosphate biosynthetic process | 2.09 | 35 | 2.32 × 10⁻³ |
| GO:BP | Nucleoside phosphate metabolic process | 1.96 | 61 | 3.63 × 10⁻⁵ |
| GO:BP | Nucleoside triphosphate biosynthetic process | 4.35 | 18 | 2.11 × 10⁻⁵ |
| GO:BP | Nucleoside triphosphate metabolic process | 3.36 | 31 | 5.03 × 10⁻⁷ |
| GO:BP | Nucleotide biosynthetic process | 2.05 | 34 | 3.69 × 10⁻³ |
| GO:BP | Nucleotide metabolic process | 2.00 | 59 | 3.40 × 10⁻⁵ |
| GO:BP | Organelle assembly | 1.63 | 79 | 8.36 × 10⁻⁴ |
| GO:BP | Organelle fission | 2.44 | 42 | 1.11 × 10⁻⁵ |
| GO:BP | Organelle organization | 1.38 | 265 | 8.36 × 10⁻⁷ |
| GO:BP | Organic acid metabolic process | 1.70 | 80 | 1.79 × 10⁻⁴ |
| GO:BP | Organonitrogen compound biosynthetic process | 2.54 | 213 | 1.45 × 10⁻³⁵ |
| GO:BP | Organonitrogen compound metabolic process | 1.46 | 436 | 4.46 × 10⁻¹⁷ |
| GO:BP | Oxidative phosphorylation | 6.34 | 30 | 2.57 × 10⁻¹⁴ |
| GO:BP | Oxoacid metabolic process | 1.75 | 79 | 6.92 × 10⁻⁵ |
| GO:BP | Peptidyl-amino acid modification | 1.78 | 34 | 3.42 × 10⁻² |
| GO:BP | Peptidyl-proline modification | 4.51 | 9 | 1.58 × 10⁻² |
| GO:BP | Positive regulation of apoptotic process | 2.00 | 25 | 3.42 × 10⁻² |
| GO:BP | Positive regulation of signal transduction by p53 class mediator | 9.66 | 5 | 2.30 × 10⁻² |
| GO:BP | Primary metabolic process | 1.45 | 670 | 5.01 × 10⁻³² |
| GO:BP | Protein metabolic process | 1.41 | 327 | 6.60 × 10⁻¹⁰ |
| GO:BP | Protein peptidyl-prolyl isomerization | 6.37 | 8 | 3.90 × 10⁻³ |
| GO:BP | Protein–DNA complex assembly | 3.28 | 23 | 6.53 × 10⁻⁵ |
| GO:BP | Protein–DNA complex organization | 2.23 | 62 | 3.95 × 10⁻⁷ |
| GO:BP | Protein–RNA complex assembly | 4.26 | 40 | 1.03 × 10⁻¹² |
| GO:BP | Protein–RNA complex organization | 4.20 | 41 | 8.95 × 10⁻¹³ |
| GO:BP | Protein-containing complex assembly | 2.07 | 106 | 1.19 × 10⁻¹⁰ |
| GO:BP | Protein-containing complex organization | 1.97 | 153 | 5.98 × 10⁻¹⁴ |
| GO:BP | Proteinogenic amino acid biosynthetic process | 3.09 | 13 | 2.14 × 10⁻² |
| GO:BP | Proteinogenic amino acid metabolic process | 2.46 | 26 | 1.73 × 10⁻³ |
| GO:BP | Proton motive force-driven ATP synthesis | 6.20 | 11 | 1.68 × 10⁻⁴ |
| GO:BP | Purine nucleoside diphosphate catabolic process | 3.46 | 11 | 2.38 × 10⁻² |
| GO:BP | Purine nucleoside diphosphate metabolic process | 3.61 | 12 | 1.02 × 10⁻² |
| GO:BP | Purine nucleoside triphosphate biosynthetic process | 4.29 | 13 | 1.08 × 10⁻³ |
| GO:BP | Purine nucleoside triphosphate metabolic process | 3.25 | 25 | 2.63 × 10⁻⁵ |
| GO:BP | Purine nucleotide biosynthetic process | 1.95 | 26 | 3.69 × 10⁻² |
| GO:BP | Purine nucleotide metabolic process | 1.90 | 48 | 1.11 × 10⁻³ |
| GO:BP | Purine ribonucleoside diphosphate catabolic process | 3.46 | 11 | 2.38 × 10⁻² |
| GO:BP | Purine ribonucleoside diphosphate metabolic process | 3.38 | 11 | 2.75 × 10⁻² |
| GO:BP | Purine ribonucleoside triphosphate biosynthetic process | 4.06 | 12 | 3.66 × 10⁻³ |
| GO:BP | Purine ribonucleoside triphosphate metabolic process | 3.28 | 24 | 3.71 × 10⁻⁵ |
| GO:BP | Purine ribonucleotide biosynthetic process | 2.09 | 23 | 3.25 × 10⁻² |
| GO:BP | Purine ribonucleotide metabolic process | 2.03 | 41 | 1.00 × 10⁻³ |
| GO:BP | Purine-containing compound biosynthetic process | 1.93 | 27 | 3.50 × 10⁻² |
| GO:BP | Purine-containing compound metabolic process | 1.86 | 50 | 1.20 × 10⁻³ |
| GO:BP | Pyridine nucleotide catabolic process | 3.46 | 11 | 2.38 × 10⁻² |
| GO:BP | Pyridine-containing compound catabolic process | 3.38 | 11 | 2.75 × 10⁻² |
| GO:BP | Pyruvate metabolic process | 2.87 | 14 | 2.38 × 10⁻² |
| GO:BP | rRNA metabolic process | 2.48 | 38 | 2.68 × 10⁻⁵ |
| GO:BP | rRNA processing | 2.56 | 36 | 2.63 × 10⁻⁵ |
| GO:BP | Recombinational repair | 2.24 | 20 | 3.24 × 10⁻² |
| GO:BP | Regulation of DNA metabolic process | 2.01 | 28 | 1.89 × 10⁻² |
| GO:BP | Regulation of DNA replication | 3.74 | 13 | 3.86 × 10⁻³ |
| GO:BP | Regulation of G2/M transition of mitotic cell cycle | 3.44 | 15 | 2.78 × 10⁻³ |
| GO:BP | Regulation of apoptotic process | 1.53 | 60 | 2.68 × 10⁻² |
| GO:BP | Regulation of apoptotic signaling pathway | 2.11 | 25 | 1.93 × 10⁻² |
| GO:BP | Regulation of cell cycle | 2.05 | 78 | 2.06 × 10⁻⁷ |
| GO:BP | Regulation of cell cycle G2/M phase transition | 3.18 | 16 | 3.60 × 10⁻³ |
| GO:BP | Regulation of cell cycle phase transition | 2.32 | 39 | 8.76 × 10⁻⁵ |
| GO:BP | Regulation of cell cycle process | 2.13 | 58 | 5.99 × 10⁻⁶ |
| GO:BP | Regulation of cellular response to stress | 2.09 | 30 | 6.75 × 10⁻³ |
| GO:BP | Regulation of chromosome organization | 2.35 | 17 | 4.54 × 10⁻² |
| GO:BP | Regulation of chromosome segregation | 3.10 | 14 | 1.27 × 10⁻² |
| GO:BP | Regulation of double-strand break repair | 2.90 | 12 | 4.90 × 10⁻² |
| GO:BP | Regulation of metaphase/anaphase transition of cell cycle | 3.76 | 10 | 2.42 × 10⁻² |
| GO:BP | Regulation of mitotic cell cycle | 2.05 | 37 | 1.99 × 10⁻³ |
| GO:BP | Regulation of mitotic cell cycle phase transition | 2.28 | 26 | 5.00 × 10⁻³ |
| GO:BP | Regulation of mitotic metaphase/anaphase transition | 3.87 | 10 | 2.13 × 10⁻² |
| GO:BP | Regulation of mitotic sister chromatid separation | 3.80 | 9 | 4.04 × 10⁻² |
| GO:BP | Regulation of translation | 2.00 | 24 | 4.09 × 10⁻² |
| GO:BP | Respiratory electron transport chain | 5.74 | 28 | 5.17 × 10⁻¹² |
| GO:BP | Response to stress | 1.40 | 161 | 3.57 × 10⁻⁴ |
| GO:BP | Ribonucleoprotein complex biogenesis | 3.17 | 84 | 5.63 × 10⁻¹⁹ |
| GO:BP | Ribonucleoside diphosphate catabolic process | 3.38 | 11 | 2.75 × 10⁻² |
| GO:BP | Ribonucleoside diphosphate metabolic process | 3.25 | 12 | 2.30 × 10⁻² |
| GO:BP | Ribonucleoside triphosphate biosynthetic process | 4.03 | 14 | 1.00 × 10⁻³ |
| GO:BP | Ribonucleoside triphosphate metabolic process | 3.32 | 26 | 1.07 × 10⁻⁵ |
| GO:BP | Ribonucleotide biosynthetic process | 2.04 | 25 | 2.81 × 10⁻² |
| GO:BP | Ribonucleotide metabolic process | 2.03 | 44 | 5.34 × 10⁻⁴ |
| GO:BP | Ribose phosphate biosynthetic process | 2.20 | 28 | 5.00 × 10⁻³ |
| GO:BP | Ribose phosphate metabolic process | 2.16 | 48 | 4.64 × 10⁻⁵ |
| GO:BP | Ribosomal large subunit biogenesis | 3.74 | 21 | 2.61 × 10⁻⁵ |
| GO:BP | Ribosomal small subunit assembly | 6.31 | 7 | 1.33 × 10⁻² |
| GO:BP | Ribosomal small subunit biogenesis | 3.69 | 21 | 3.07 × 10⁻⁵ |
| GO:BP | Ribosome assembly | 5.71 | 19 | 9.60 × 10⁻⁸ |
| GO:BP | Ribosome biogenesis | 2.90 | 58 | 5.23 × 10⁻¹¹ |
| GO:BP | Sexual reproduction | 1.74 | 51 | 4.56 × 10⁻³ |
| GO:BP | Signal transduction in response to DNA damage | 2.54 | 15 | 4.38 × 10⁻² |
| GO:BP | Sister chromatid segregation | 2.91 | 20 | 1.62 × 10⁻³ |
| GO:BP | Small molecule metabolic process | 1.54 | 147 | 7.02 × 10⁻⁶ |
| GO:BP | Spindle organization | 2.62 | 32 | 6.68 × 10⁻⁵ |
| GO:BP | tRNA aminoacylation | 5.04 | 22 | 5.27 × 10⁻⁸ |
| GO:BP | tRNA aminoacylation for protein translation | 4.92 | 20 | 5.03 × 10⁻⁷ |
| GO:BP | tRNA metabolic process | 2.28 | 34 | 5.83 × 10⁻⁴ |
| GO:BP | Tetrahydrofolate metabolic process | 6.24 | 6 | 3.75 × 10⁻² |
| GO:BP | Translation | 5.77 | 136 | 3.59 × 10−65 |
| GO:BP | Translational elongation | 4.77 | 12 | 8.57 × 10⁻⁴ |
| GO:BP | Translational initiation | 5.34 | 15 | 1.59 × 10⁻⁵ |
| GO:BP | Tricarboxylic acid cycle | 5.34 | 15 | 1.59 × 10⁻⁵ |
| Cellular Component | ||||
| GO:CC | Arp2/3 protein complex | 6.92 | 6 | 1.02 × 10⁻² |
| GO:CC | Sm-like protein family complex | 3.21 | 16 | 1.16 × 10⁻³ |
| GO:CC | U1 snRNP | 5.10 | 7 | 1.67 × 10⁻² |
| GO:CC | U12-type spliceosomal complex | 4.62 | 7 | 2.88 × 10⁻² |
| GO:CC | U2 snRNP | 5.54 | 8 | 3.72 × 10⁻³ |
| GO:CC | U2-type spliceosomal complex | 3.64 | 15 | 5.33 × 10⁻⁴ |
| GO:CC | U4 snRNP | 10.39 | 6 | 1.12 × 10⁻³ |
| GO:CC | U5 snRNP | 7.55 | 6 | 6.68 × 10⁻³ |
| GO:CC | Aminoacyl-tRNA synthetase multienzyme complex | 8.08 | 7 | 1.12 × 10⁻³ |
| GO:CC | Catalytic complex | 1.64 | 188 | 1.31 × 10⁻¹⁰ |
| GO:CC | Catalytic step 2 spliceosome | 3.02 | 17 | 1.37 × 10⁻³ |
| GO:CC | Centrosome | 1.78 | 55 | 5.33 × 10⁻⁴ |
| GO:CC | Chromatin | 1.69 | 58 | 1.18 × 10⁻³ |
| GO:CC | Chromosomal region | 2.85 | 41 | 6.00 × 10⁻⁸ |
| GO:CC | Chromosome | 2.09 | 131 | 2.56 × 10⁻¹⁴ |
| GO:CC | Chromosome, centromeric region | 2.94 | 34 | 7.34 × 10⁻⁷ |
| GO:CC | Cleavage furrow | 4.82 | 8 | 9.12 × 10⁻³ |
| GO:CC | Condensed chromosome | 2.77 | 36 | 1.29 × 10⁻⁶ |
| GO:CC | Condensed chromosome, centromeric region | 2.70 | 24 | 3.03 × 10⁻⁴ |
| GO:CC | Cytochrome complex | 5.86 | 11 | 1.01 × 10⁻⁴ |
| GO:CC | Cytoplasm | 1.28 | 929 | 7.97 × 10⁻²⁸ |
| GO:CC | Cytosol | 1.95 | 302 | 3.27 × 10⁻³⁰ |
| GO:CC | Cytosolic large ribosomal subunit | 8.46 | 44 | 4.02 × 10⁻²⁹ |
| GO:CC | Cytosolic ribosome | 8.63 | 76 | 4.32 × 10−52 |
| GO:CC | Cytosolic small ribosomal subunit | 9.54 | 31 | 1.85 × 10⁻²² |
| GO:CC | Eukaryotic 43S preinitiation complex | 9.23 | 8 | 9.12 × 10⁻⁵ |
| GO:CC | Eukaryotic 48S preinitiation complex | 11.08 | 8 | 1.63 × 10⁻⁵ |
| GO:CC | Eukaryotic translation initiation factor 3 complex | 8.90 | 9 | 2.36 × 10⁻⁵ |
| GO:CC | Eukaryotic translation initiation factor 3 complex, eIF3m | 11.08 | 4 | 3.24 × 10⁻² |
| GO:CC | Inner mitochondrial membrane protein complex | 3.86 | 34 | 4.75 × 10⁻¹⁰ |
| GO:CC | Intracellular anatomical structure | 1.23 | 1265 | 8.08 × 10−52 |
| GO:CC | Intracellular membrane-bounded organelle | 1.28 | 905 | 4.52 × 10⁻²⁶ |
| GO:CC | Intracellular non-membrane-bounded organelle | 1.72 | 459 | 4.71 × 10⁻³⁵ |
| GO:CC | Intracellular organelle | 1.29 | 1087 | 1.05 × 10−42 |
| GO:CC | Intracellular organelle lumen | 1.94 | 275 | 3.97 × 10⁻²⁷ |
| GO:CC | Intracellular protein-containing complex | 1.44 | 89 | 4.68 × 10⁻³ |
| GO:CC | Kinetochore | 2.89 | 24 | 1.01 × 10⁻⁴ |
| GO:CC | Large ribosomal subunit | 6.31 | 51 | 3.76 × 10⁻²⁶ |
| GO:CC | Membrane-bounded organelle | 1.26 | 933 | 9.54 × 10⁻²⁵ |
| GO:CC | Membrane-enclosed lumen | 1.94 | 275 | 3.97 × 10⁻²⁷ |
| GO:CC | Microtubule cytoskeleton | 1.48 | 111 | 4.41 × 10⁻⁴ |
| GO:CC | Microtubule organizing center | 1.54 | 60 | 1.02 × 10⁻² |
| GO:CC | Mitochondrial envelope | 2.13 | 73 | 3.18 × 10⁻⁸ |
| GO:CC | Mitochondrial inner membrane | 2.94 | 60 | 2.55 × 10⁻¹² |
| GO:CC | Mitochondrial matrix | 3.48 | 50 | 4.42 × 10⁻¹³ |
| GO:CC | Mitochondrial membrane | 2.17 | 69 | 4.32 × 10⁻⁸ |
| GO:CC | Mitochondrial protein-containing complex | 3.58 | 59 | 2.73 × 10⁻¹⁶ |
| GO:CC | Mitochondrial proton-transporting ATP synthase complex | 6.43 | 13 | 4.00 × 10⁻⁶ |
| GO:CC | Mitochondrial proton-transporting ATP synthase complex, coupling factor F(o) | 5.93 | 6 | 2.21 × 10⁻² |
| GO:CC | Mitochondrial respirasome | 5.66 | 9 | 1.12 × 10⁻³ |
| GO:CC | Mitochondrial ribosome | 3.68 | 21 | 9.69 × 10⁻⁶ |
| GO:CC | Mitochondrial small ribosomal subunit | 6.65 | 12 | 8.40 × 10⁻⁶ |
| GO:CC | Mitochondrion | 2.39 | 235 | 6.18 × 10−36 |
| GO:CC | Mitotic spindle | 2.16 | 17 | 4.58 × 10⁻² |
| GO:CC | Non-membrane-bounded organelle | 1.72 | 460 | 2.54 × 10⁻³⁵ |
| GO:CC | Nuclear chromosome | 1.95 | 22 | 3.89 × 10⁻² |
| GO:CC | Nuclear lumen | 1.85 | 224 | 6.28 × 10⁻¹⁹ |
| GO:CC | Nuclear protein-containing complex | 1.60 | 136 | 7.62 × 10⁻⁷ |
| GO:CC | Nucleolus | 2.34 | 76 | 1.62 × 10⁻¹⁰ |
| GO:CC | Nucleoplasm | 1.80 | 169 | 1.02 × 10⁻¹² |
| GO:CC | Nucleus | 1.36 | 561 | 2.14 × 10⁻¹⁷ |
| GO:CC | Organellar ribosome | 3.68 | 21 | 9.69 × 10⁻⁶ |
| GO:CC | Organellar small ribosomal subunit | 6.65 | 12 | 8.40 × 10⁻⁶ |
| GO:CC | Organelle | 1.26 | 1100 | 9.05 × 10−39 |
| GO:CC | Organelle envelope | 1.93 | 104 | 2.99 × 10⁻⁹ |
| GO:CC | Organelle inner membrane | 2.73 | 64 | 1.16 × 10⁻¹¹ |
| GO:CC | Organelle lumen | 1.94 | 275 | 3.97 × 10⁻²⁷ |
| GO:CC | Oxidoreductase complex | 4.24 | 19 | 4.39 × 10⁻⁶ |
| GO:CC | pICln-Sm protein complex | 9.89 | 5 | 8.41 × 10⁻³ |
| GO:CC | Preribosome | 2.74 | 20 | 1.16 × 10⁻³ |
| GO:CC | Proteasome core complex | 6.23 | 9 | 5.43 × 10⁻⁴ |
| GO:CC | Protein–DNA complex | 1.72 | 65 | 3.03 × 10⁻⁴ |
| GO:CC | Protein-containing complex | 1.54 | 570 | 5.76 × 10⁻³² |
| GO:CC | Proton-transporting ATP synthase complex | 6.21 | 13 | 5.94 × 10⁻⁶ |
| GO:CC | Proton-transporting ATP synthase complex, coupling factor F(o) | 5.19 | 6 | 3.99 × 10⁻² |
| GO:CC | Proton-transporting two-sector ATPase complex | 3.58 | 15 | 6.27 × 10⁻⁴ |
| GO:CC | Replication fork | 3.53 | 13 | 2.44 × 10⁻³ |
| GO:CC | Respirasome | 5.25 | 11 | 3.03 × 10⁻⁴ |
| GO:CC | Respiratory chain complex | 5.86 | 11 | 1.01 × 10⁻⁴ |
| GO:CC | Respiratory chain complex IV | 5.70 | 7 | 9.06 × 10⁻³ |
| GO:CC | Ribonucleoprotein complex | 3.78 | 177 | 5.05 × 10−54 |
| GO:CC | Ribosomal subunit | 7.04 | 93 | 1.92 × 10−53 |
| GO:CC | Ribosome | 6.68 | 108 | 4.42 × 10−59 |
| GO:CC | Small nuclear ribonucleoprotein complex | 3.64 | 15 | 5.33 × 10⁻⁴ |
| GO:CC | Small ribosomal subunit | 8.11 | 41 | 3.74 × 10⁻²⁶ |
| GO:CC | Small-subunit processome | 2.77 | 12 | 3.26 × 10⁻² |
| GO:CC | Spindle | 2.33 | 45 | 4.67 × 10⁻⁶ |
| GO:CC | Spliceosomal complex | 2.45 | 37 | 1.52 × 10⁻⁵ |
| GO:CC | Spliceosomal snRNP complex | 3.59 | 14 | 1.12 × 10⁻³ |
| GO:CC | Spliceosomal tri-snRNP complex | 4.47 | 10 | 2.72 × 10⁻³ |
| GO:CC | Translation preinitiation complex | 9.59 | 9 | 1.15 × 10⁻⁵ |
| GO:CC | Tricarboxylic acid cycle heteromeric enzyme complex | 6.92 | 5 | 3.76 × 10⁻² |
| Molecular Function | ||||
| GO:MF | ATP-dependent activity, acting on DNA | 2.32 | 23 | 1.60 × 10⁻² |
| GO:MF | NAD binding | 3.78 | 17 | 5.51 × 10⁻⁴ |
| GO:MF | NAD+ binding | 6.22 | 7 | 2.33 × 10⁻² |
| GO:MF | RNA binding | 2.37 | 182 | 6.82 × 10⁻²⁶ |
| GO:MF | Aminoacyl-tRNA ligase activity | 5.08 | 20 | 5.57 × 10⁻⁷ |
| GO:MF | Binding | 1.05 | 999 | 2.45 × 10⁻² |
| GO:MF | Catalytic activity | 1.13 | 553 | 9.04 × 10⁻³ |
| GO:MF | Catalytic activity, acting on DNA | 2.07 | 38 | 2.37 × 10⁻³ |
| GO:MF | Catalytic activity, acting on RNA | 1.89 | 51 | 1.40 × 10⁻³ |
| GO:MF | Catalytic activity, acting on a nucleic acid | 1.91 | 87 | 7.53 × 10⁻⁷ |
| GO:MF | Catalytic activity, acting on a tRNA | 3.17 | 29 | 8.40 × 10⁻⁶ |
| GO:MF | Electron transfer activity | 5.21 | 11 | 1.73 × 10⁻³ |
| GO:MF | Heterocyclic compound binding | 1.24 | 247 | 8.80 × 10⁻³ |
| GO:MF | Identical protein binding | 1.77 | 67 | 5.59 × 10⁻⁴ |
| GO:MF | Isomerase activity | 2.20 | 28 | 9.04 × 10⁻³ |
| GO:MF | Ligase activity | 2.63 | 45 | 6.96 × 10⁻⁷ |
| GO:MF | Ligase activity, forming carbon-oxygen bonds | 5.08 | 20 | 5.57 × 10⁻⁷ |
| GO:MF | mRNA binding | 1.99 | 42 | 2.32 × 10⁻³ |
| GO:MF | Nucleic acid binding | 1.49 | 340 | 2.94 × 10⁻¹³ |
| GO:MF | Nucleoside phosphate binding | 1.25 | 236 | 9.04 × 10⁻³ |
| GO:MF | Nucleotide binding | 1.25 | 236 | 9.04 × 10⁻³ |
| GO:MF | Organic cyclic compound binding | 1.30 | 544 | 9.27 × 10⁻¹² |
| GO:MF | Oxidoreductase activity | 1.61 | 96 | 3.56 × 10⁻⁴ |
| GO:MF | Oxidoreductase activity, acting on NAD(P)H | 3.71 | 12 | 1.38 × 10⁻² |
| GO:MF | Oxidoreductase activity, acting on NAD(P)H, quinone or similar compound as acceptor | 5.69 | 8 | 1.42 × 10⁻² |
| GO:MF | Oxidoreductase activity, acting on the CH-NH group of donors, NAD or NADP as acceptor | 6.63 | 7 | 1.60 × 10⁻² |
| GO:MF | Proton transmembrane transporter activity | 2.41 | 20 | 2.45 × 10⁻² |
| GO:MF | rRNA binding | 6.56 | 24 | 3.02 × 10⁻¹¹ |
| GO:MF | Single-stranded DNA binding | 2.84 | 17 | 1.33 × 10⁻² |
| GO:MF | Structural constituent of ribosome | 7.30 | 95 | 1.45 × 10−55 |
| GO:MF | Structural molecule activity | 2.26 | 125 | 1.73 × 10⁻¹⁵ |
| GO:MF | Translation elongation factor activity | 5.53 | 7 | 4.38 × 10⁻² |
| GO:MF | Translation factor activity, RNA binding | 4.28 | 25 | 2.61 × 10⁻⁷ |
| GO:MF | Translation initiation factor activity | 4.37 | 16 | 1.74 × 10⁻⁴ |
| GO:MF | Translation regulator activity | 3.92 | 32 | 1.15 × 10⁻⁸ |
| GO:MF | Translation regulator activity, nucleic acid binding | 3.93 | 26 | 5.88 × 10⁻⁷ |
| Time Point | Regulation | KEGG Term | DEG Count | Fold Enrichment | p-Value (Adjusted) |
|---|---|---|---|---|---|
| 12 hpi | Down | Ribosome | 80 | 6.68 | 3.16 × 10−49 |
| 12 hpi | Down | Oxidative phosphorylation | 37 | 3.22 | 1.08 × 10⁻⁸ |
| 12 hpi | Down | DNA replication | 18 | 6.01 | 1.09 × 10⁻⁸ |
| 12 hpi | Down | Ribosome biogenesis in eukaryotes | 27 | 4.03 | 1.09 × 10⁻⁸ |
| 12 hpi | Down | Spliceosome | 30 | 2.50 | 1.25 × 10⁻⁴ |
| 12 hpi | Down | Nucleocytoplasmic transport | 22 | 2.29 | 1.00 × 10⁻² |
| 12 hpi | Down | Base excision repair | 13 | 3.10 | 1.13 × 10⁻² |
| 12 hpi | Down | Mismatch repair | 9 | 4.29 | 1.13 × 10⁻² |
| 12 hpi | Down | Nucleotide excision repair | 14 | 2.86 | 1.29 × 10⁻² |
| 12 hpi | Up | Steroid biosynthesis | 10 | 6.14 | 1.65 × 10⁻³ |
| 12 hpi | Up | Autophagy—animal | 29 | 2.34 | 2.12 × 10⁻³ |
| 12 hpi | Up | Cell cycle | 27 | 2.30 | 3.90 × 10⁻³ |
| 12 hpi | Up | Influenza A | 22 | 2.13 | 4.74 × 10⁻² |
| 24 hpi | Down | Ribosome | 88 | 5.54 | 2.81 × 10−49 |
| 24 hpi | Down | Oxidative phosphorylation | 50 | 3.28 | 2.71 × 10⁻¹³ |
| 24 hpi | Down | Carbon metabolism | 39 | 2.98 | 1.08 × 10⁻⁸ |
| 24 hpi | Down | Aminoacyl-tRNA biosynthesis | 22 | 3.78 | 1.10 × 10⁻⁶ |
| 24 hpi | Down | Biosynthesis of amino acids | 24 | 3.02 | 2.50 × 10⁻⁵ |
| 24 hpi | Down | Citrate cycle (TCA cycle) | 15 | 4.36 | 2.50 × 10⁻⁵ |
| 24 hpi | Down | DNA replication | 15 | 3.78 | 1.93 × 10⁻⁴ |
| 24 hpi | Down | Spliceosome | 33 | 2.08 | 1.09 × 10⁻³ |
| 24 hpi | Down | Metabolic pathways | 225 | 1.22 | 3.04 × 10⁻³ |
| 24 hpi | Down | Cell cycle | 36 | 1.89 | 3.04 × 10⁻³ |
| 24 hpi | Down | Propanoate metabolism | 12 | 3.24 | 7.53 × 10⁻³ |
| 24 hpi | Down | Fatty acid degradation | 14 | 2.86 | 7.77 × 10⁻³ |
| 24 hpi | Down | Glycolysis/Gluconeogenesis | 17 | 2.42 | 1.19 × 10⁻² |
| 24 hpi | Down | One carbon pool by folate | 9 | 3.78 | 1.35 × 10⁻² |
| 24 hpi | Down | Nucleotide excision repair | 15 | 2.31 | 3.73 × 10⁻² |
| 24 hpi | Down | Pyruvate metabolism | 12 | 2.59 | 4.20 × 10⁻² |
| 24 hpi | Up | Steroid biosynthesis | 11 | 5.15 | 1.92 × 10⁻³ |
| 24 hpi | Up | Lysosome | 29 | 2.24 | 3.94 × 10⁻³ |
| 24 hpi | Up | Terpenoid backbone biosynthesis | 9 | 4.43 | 1.73 × 10⁻² |
| 24 hpi | Up | Glycosaminoglycan biosynthesis—heparan sulfate/heparin | 10 | 3.90 | 1.73 × 10⁻² |
| 24 hpi | Up | Protein processing in endoplasmic reticulum | 30 | 1.94 | 1.73 × 10⁻² |
| 24 hpi | Up | Autophagy—animal | 30 | 1.85 | 3.19 × 10⁻² |
Disclaimer/Publisher’s Note: The statements, opinions and data contained in all publications are solely those of the individual author(s) and contributor(s) and not of MDPI and/or the editor(s). MDPI and/or the editor(s) disclaim responsibility for any injury to people or property resulting from any ideas, methods, instructions or products referred to in the content. |
© 2025 by the author. Licensee MDPI, Basel, Switzerland. This article is an open access article distributed under the terms and conditions of the Creative Commons Attribution (CC BY) license (https://creativecommons.org/licenses/by/4.0/).
Share and Cite
Quaye, A.; Pickett, B.E.; Griffitts, J.S.; Berges, B.K.; Poole, B.D. Turkey B Cell Transcriptome Profile During Turkey Hemorrhagic Enteritis Virus (THEV) Infection Highlights Upregulated Apoptosis and Breakdown Pathways That May Mediate Immunosuppression. Viruses 2025, 17, 299. https://doi.org/10.3390/v17030299
Quaye A, Pickett BE, Griffitts JS, Berges BK, Poole BD. Turkey B Cell Transcriptome Profile During Turkey Hemorrhagic Enteritis Virus (THEV) Infection Highlights Upregulated Apoptosis and Breakdown Pathways That May Mediate Immunosuppression. Viruses. 2025; 17(3):299. https://doi.org/10.3390/v17030299
Chicago/Turabian StyleQuaye, Abraham, Brett E. Pickett, Joel S. Griffitts, Bradford K. Berges, and Brian D. Poole. 2025. "Turkey B Cell Transcriptome Profile During Turkey Hemorrhagic Enteritis Virus (THEV) Infection Highlights Upregulated Apoptosis and Breakdown Pathways That May Mediate Immunosuppression" Viruses 17, no. 3: 299. https://doi.org/10.3390/v17030299
APA StyleQuaye, A., Pickett, B. E., Griffitts, J. S., Berges, B. K., & Poole, B. D. (2025). Turkey B Cell Transcriptome Profile During Turkey Hemorrhagic Enteritis Virus (THEV) Infection Highlights Upregulated Apoptosis and Breakdown Pathways That May Mediate Immunosuppression. Viruses, 17(3), 299. https://doi.org/10.3390/v17030299