

Unraveling the Dynamics of Omicron (BA.1, BA.2, and BA.5) Waves and Emergence of the Deltacron Variant: Genomic Epidemiology of the SARS-CoV-2 Epidemic in Cyprus (Oct 2021–Oct 2022)

 , ,
, ,  add
Show full author list
add
Show full author list
Abstract
:1. Introduction
2. Materials and Methods
2.1. Sample Collection, RNA Extraction, and SARS-CoV-2 Real-Time RT-PCR
2.2. Next-Generation Sequencing (NGS)
2.3. Sequences Used in This Study
2.4. Bioinformatic Analysis
2.4.1. Lineage Classification and Mutation Calling
2.4.2. Dataset Compilation and Time-Scaled Migration Histories
2.5. Calculations and Figure Information
3. Results
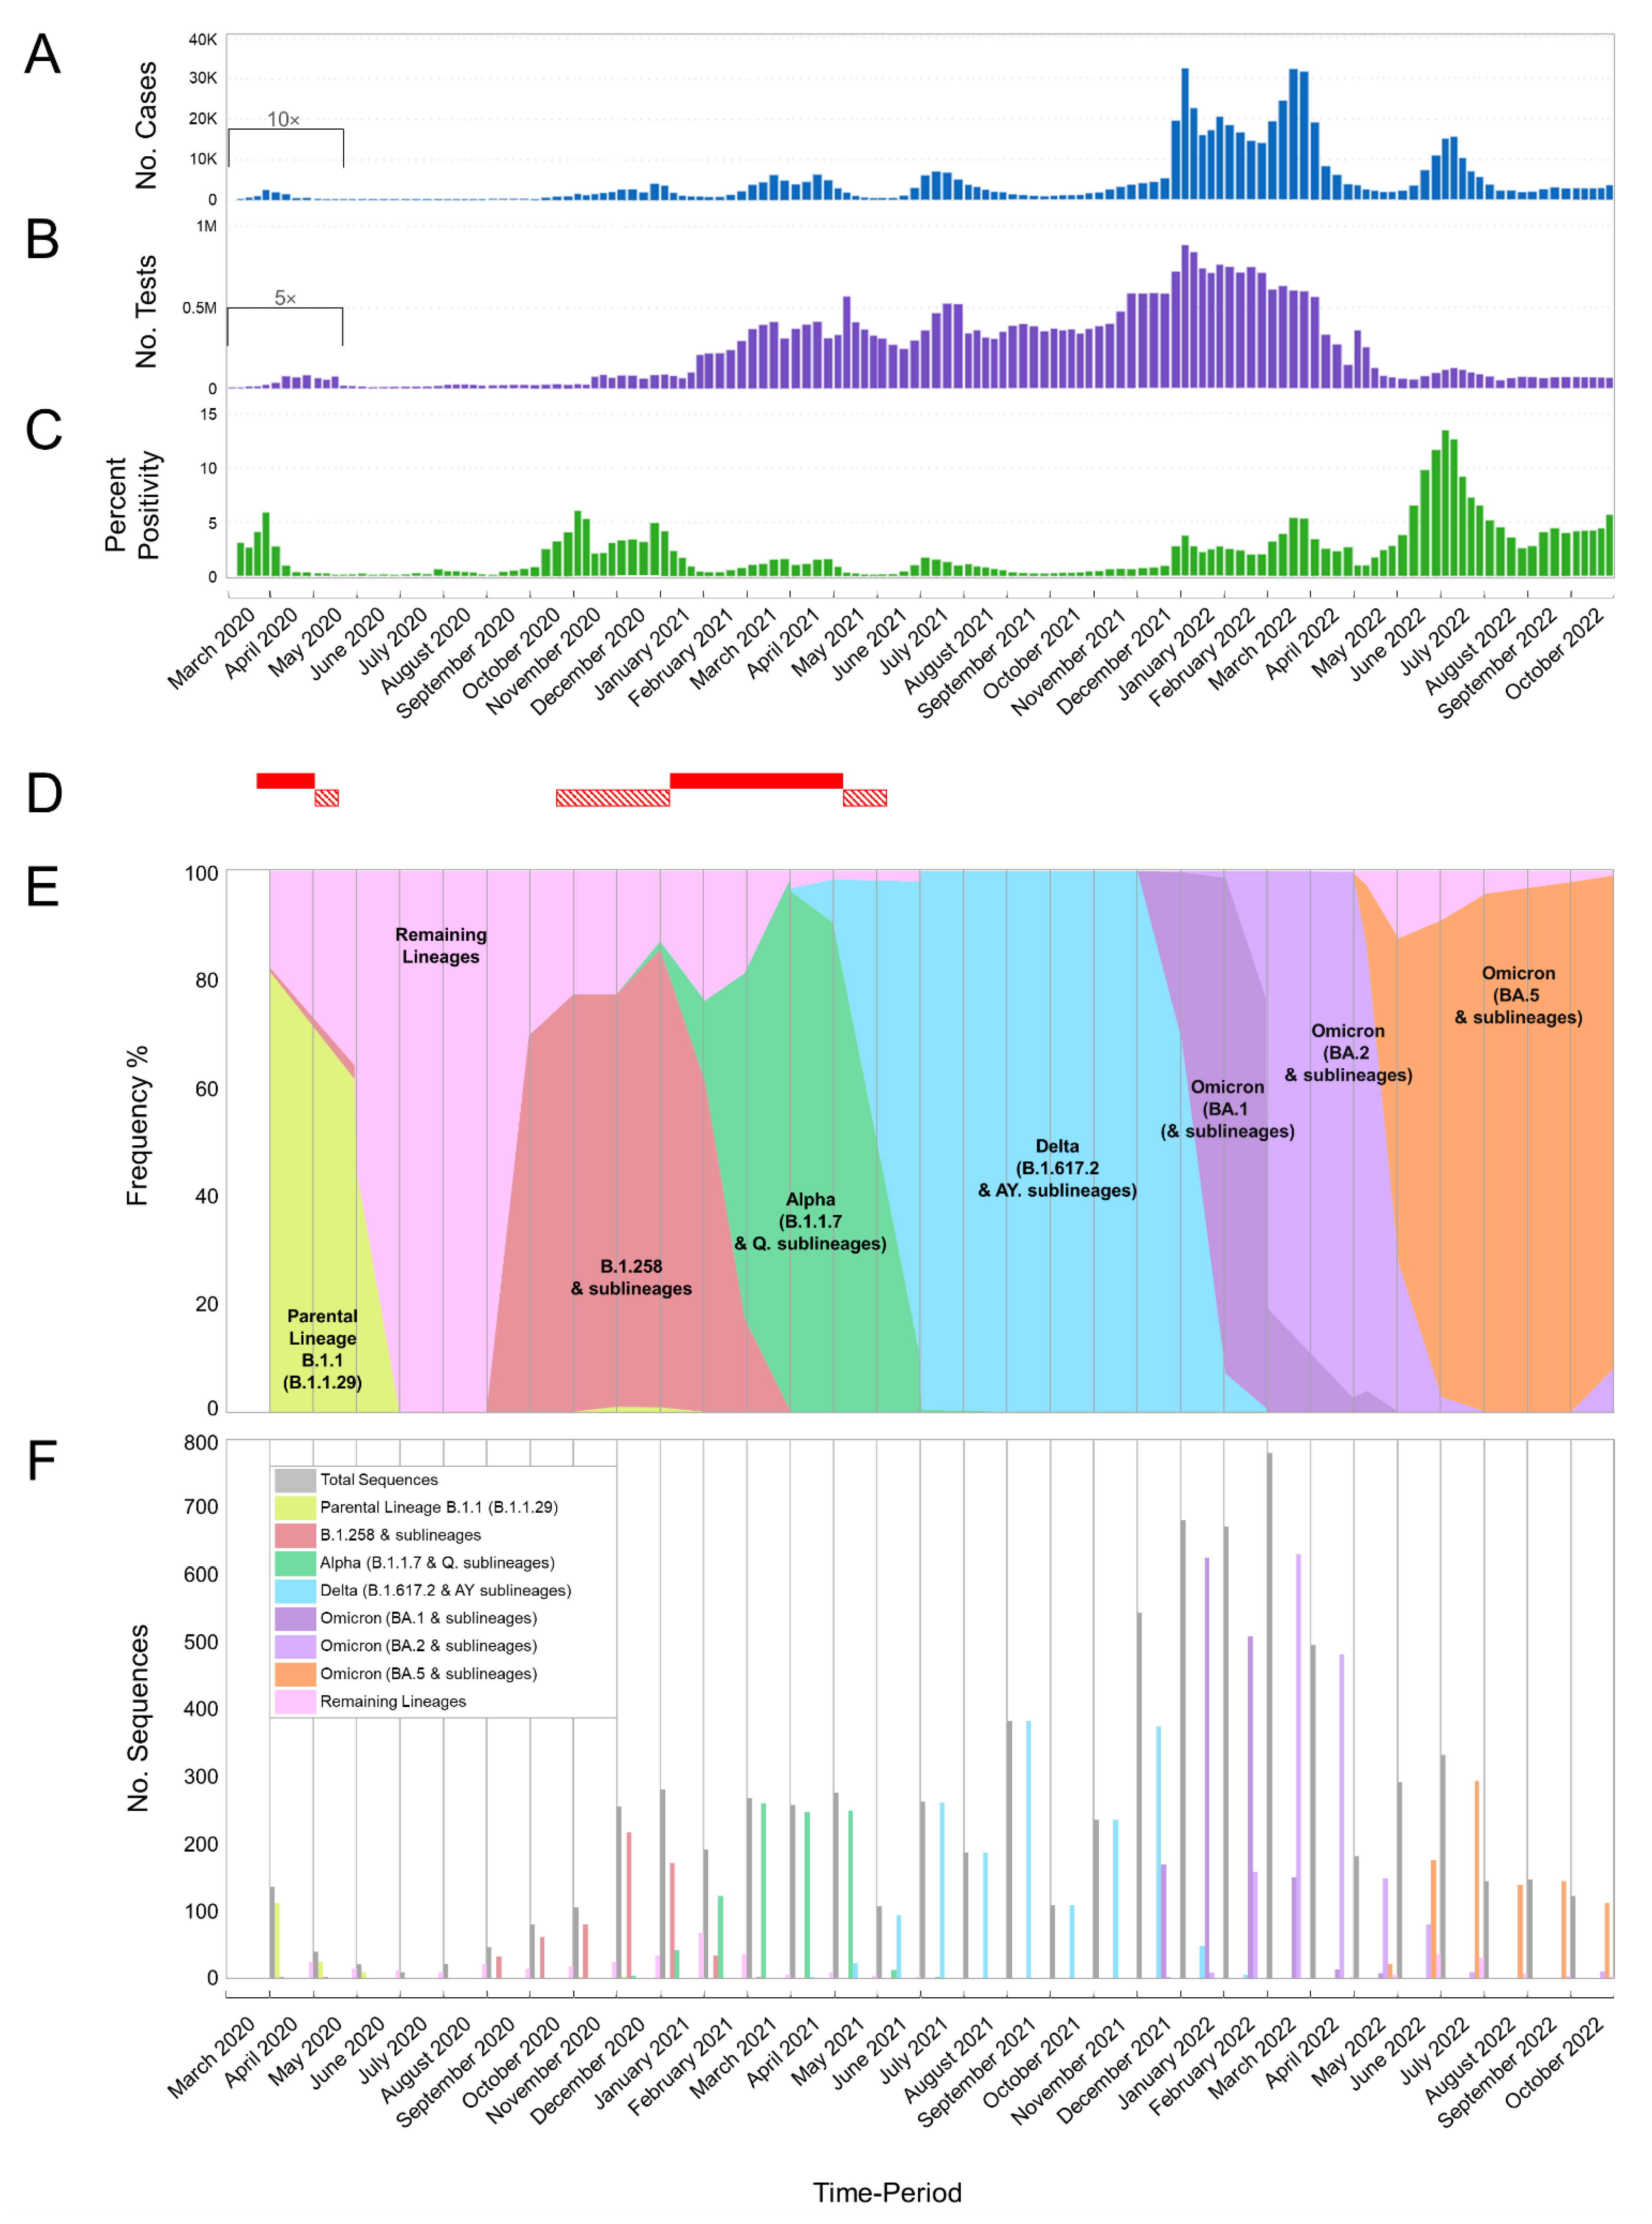
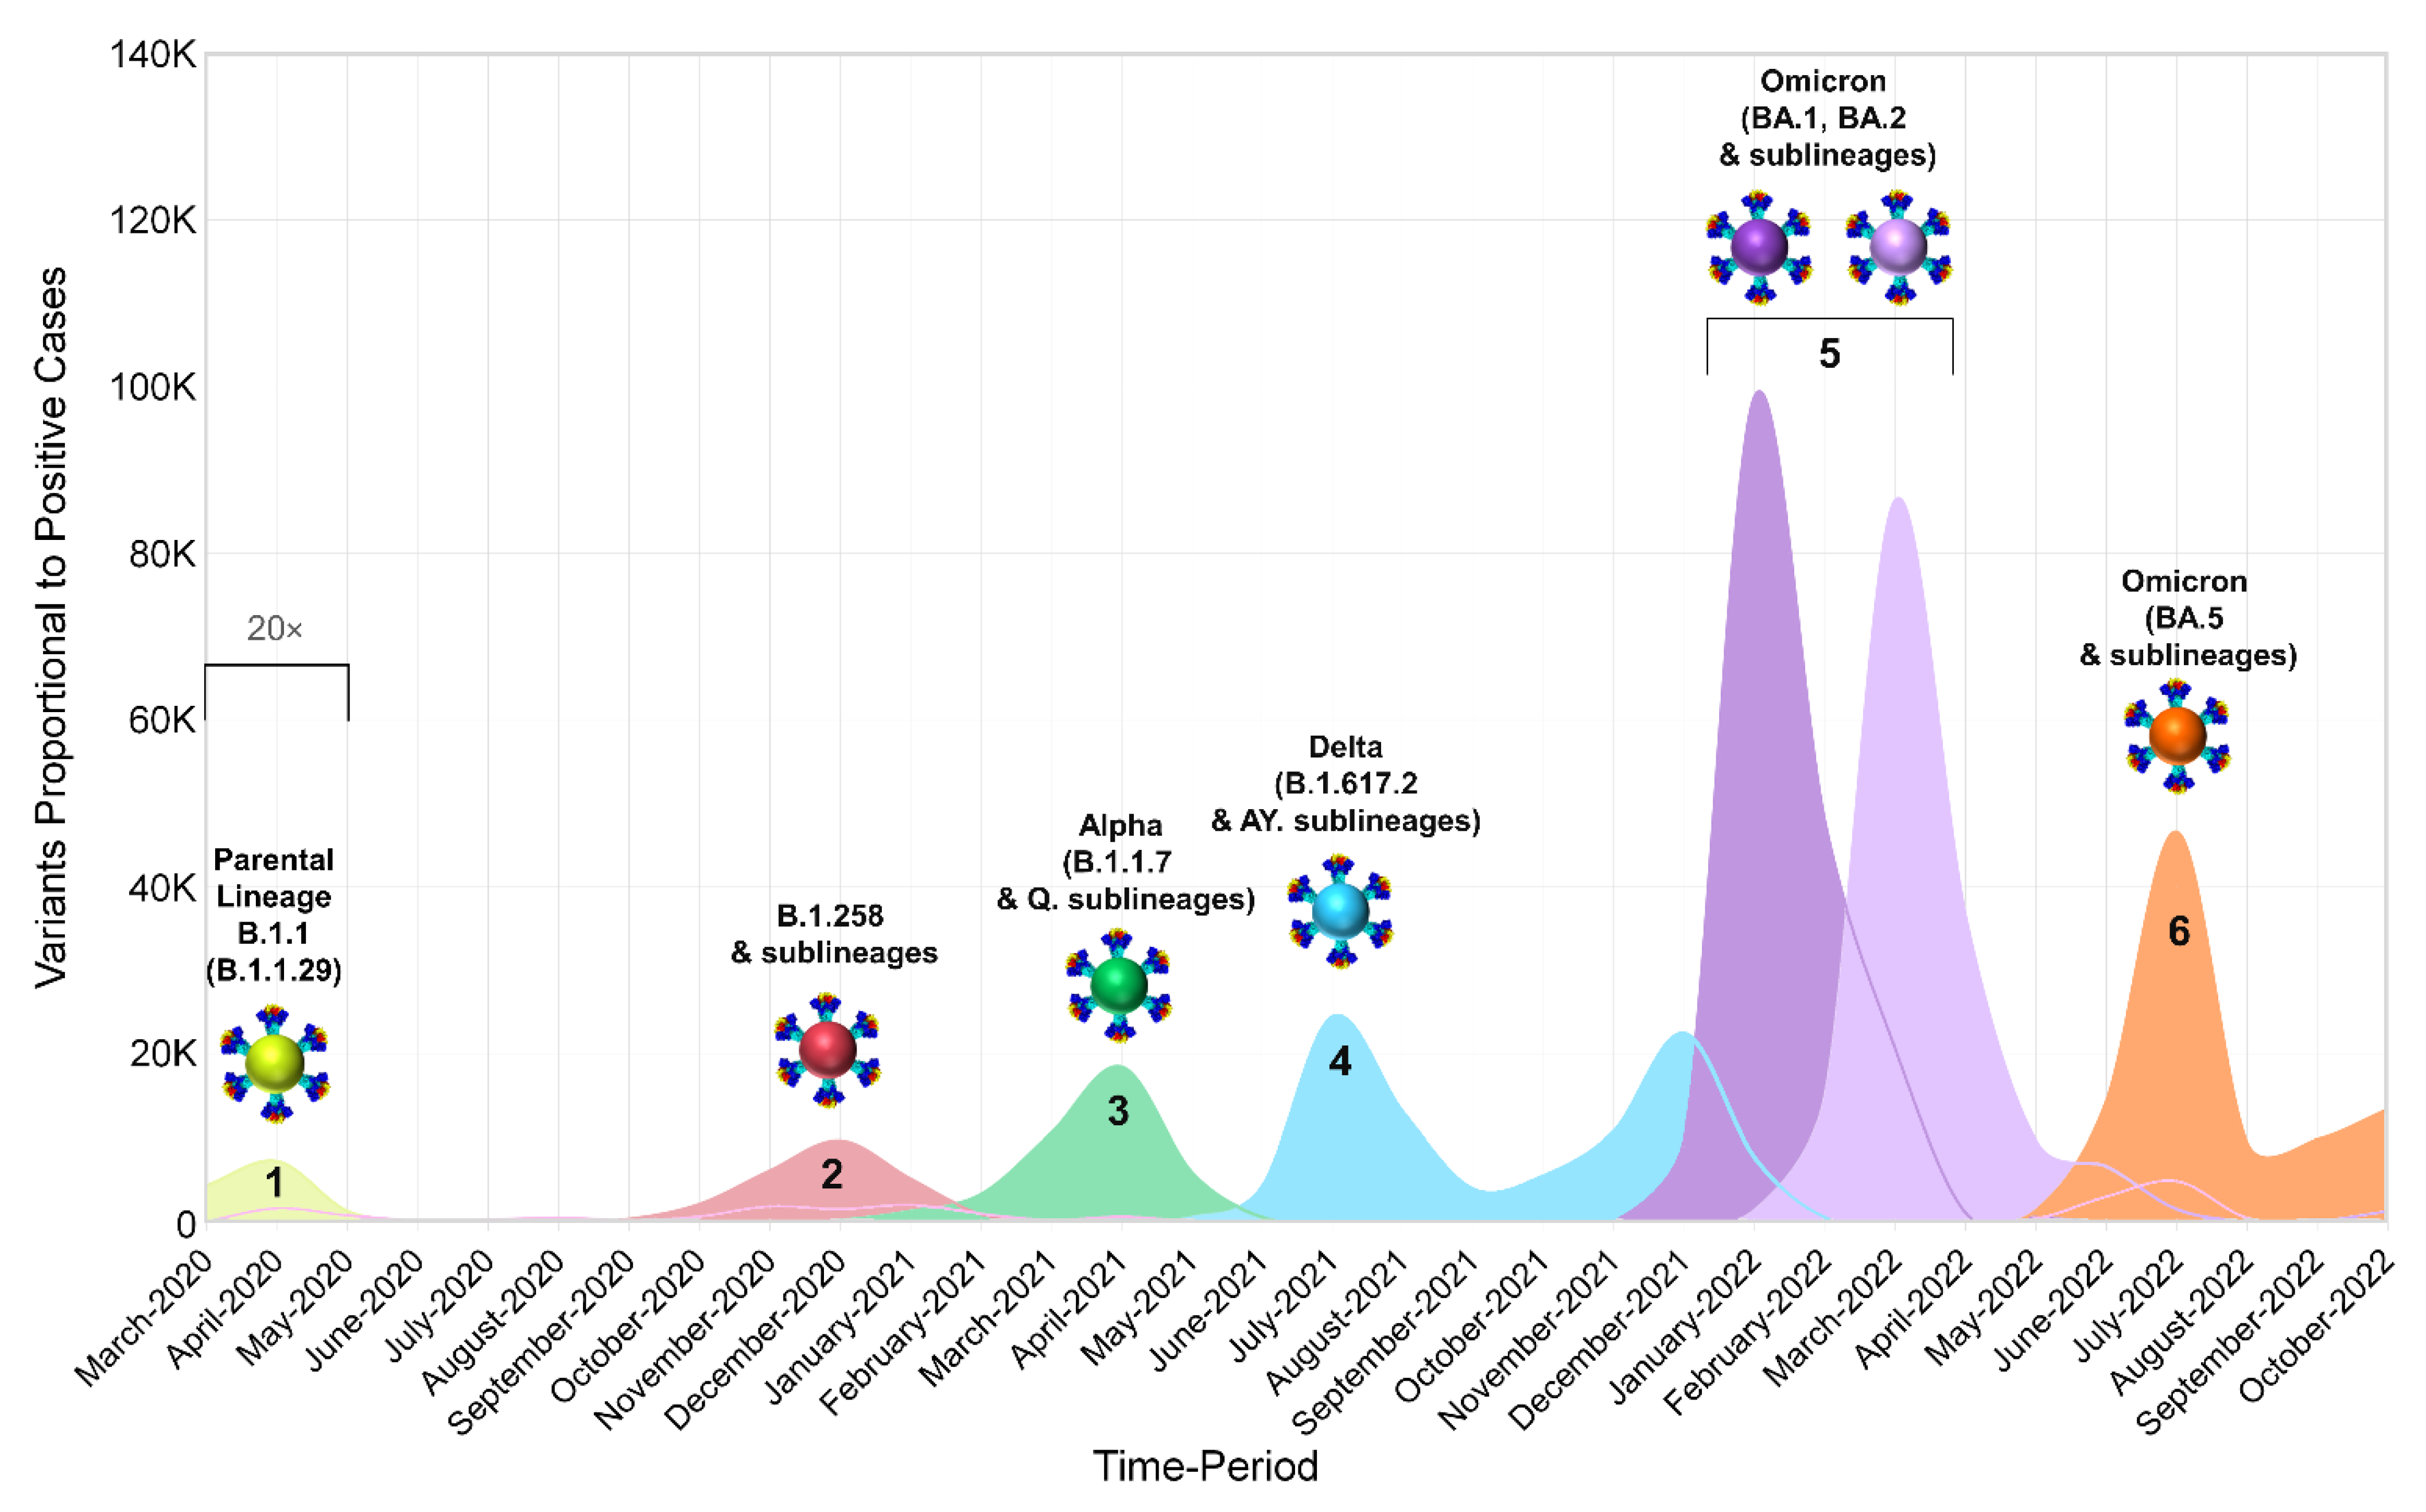
3.1. The Appearance of Lineages and SARS-CoV-2 Waves in Cyprus
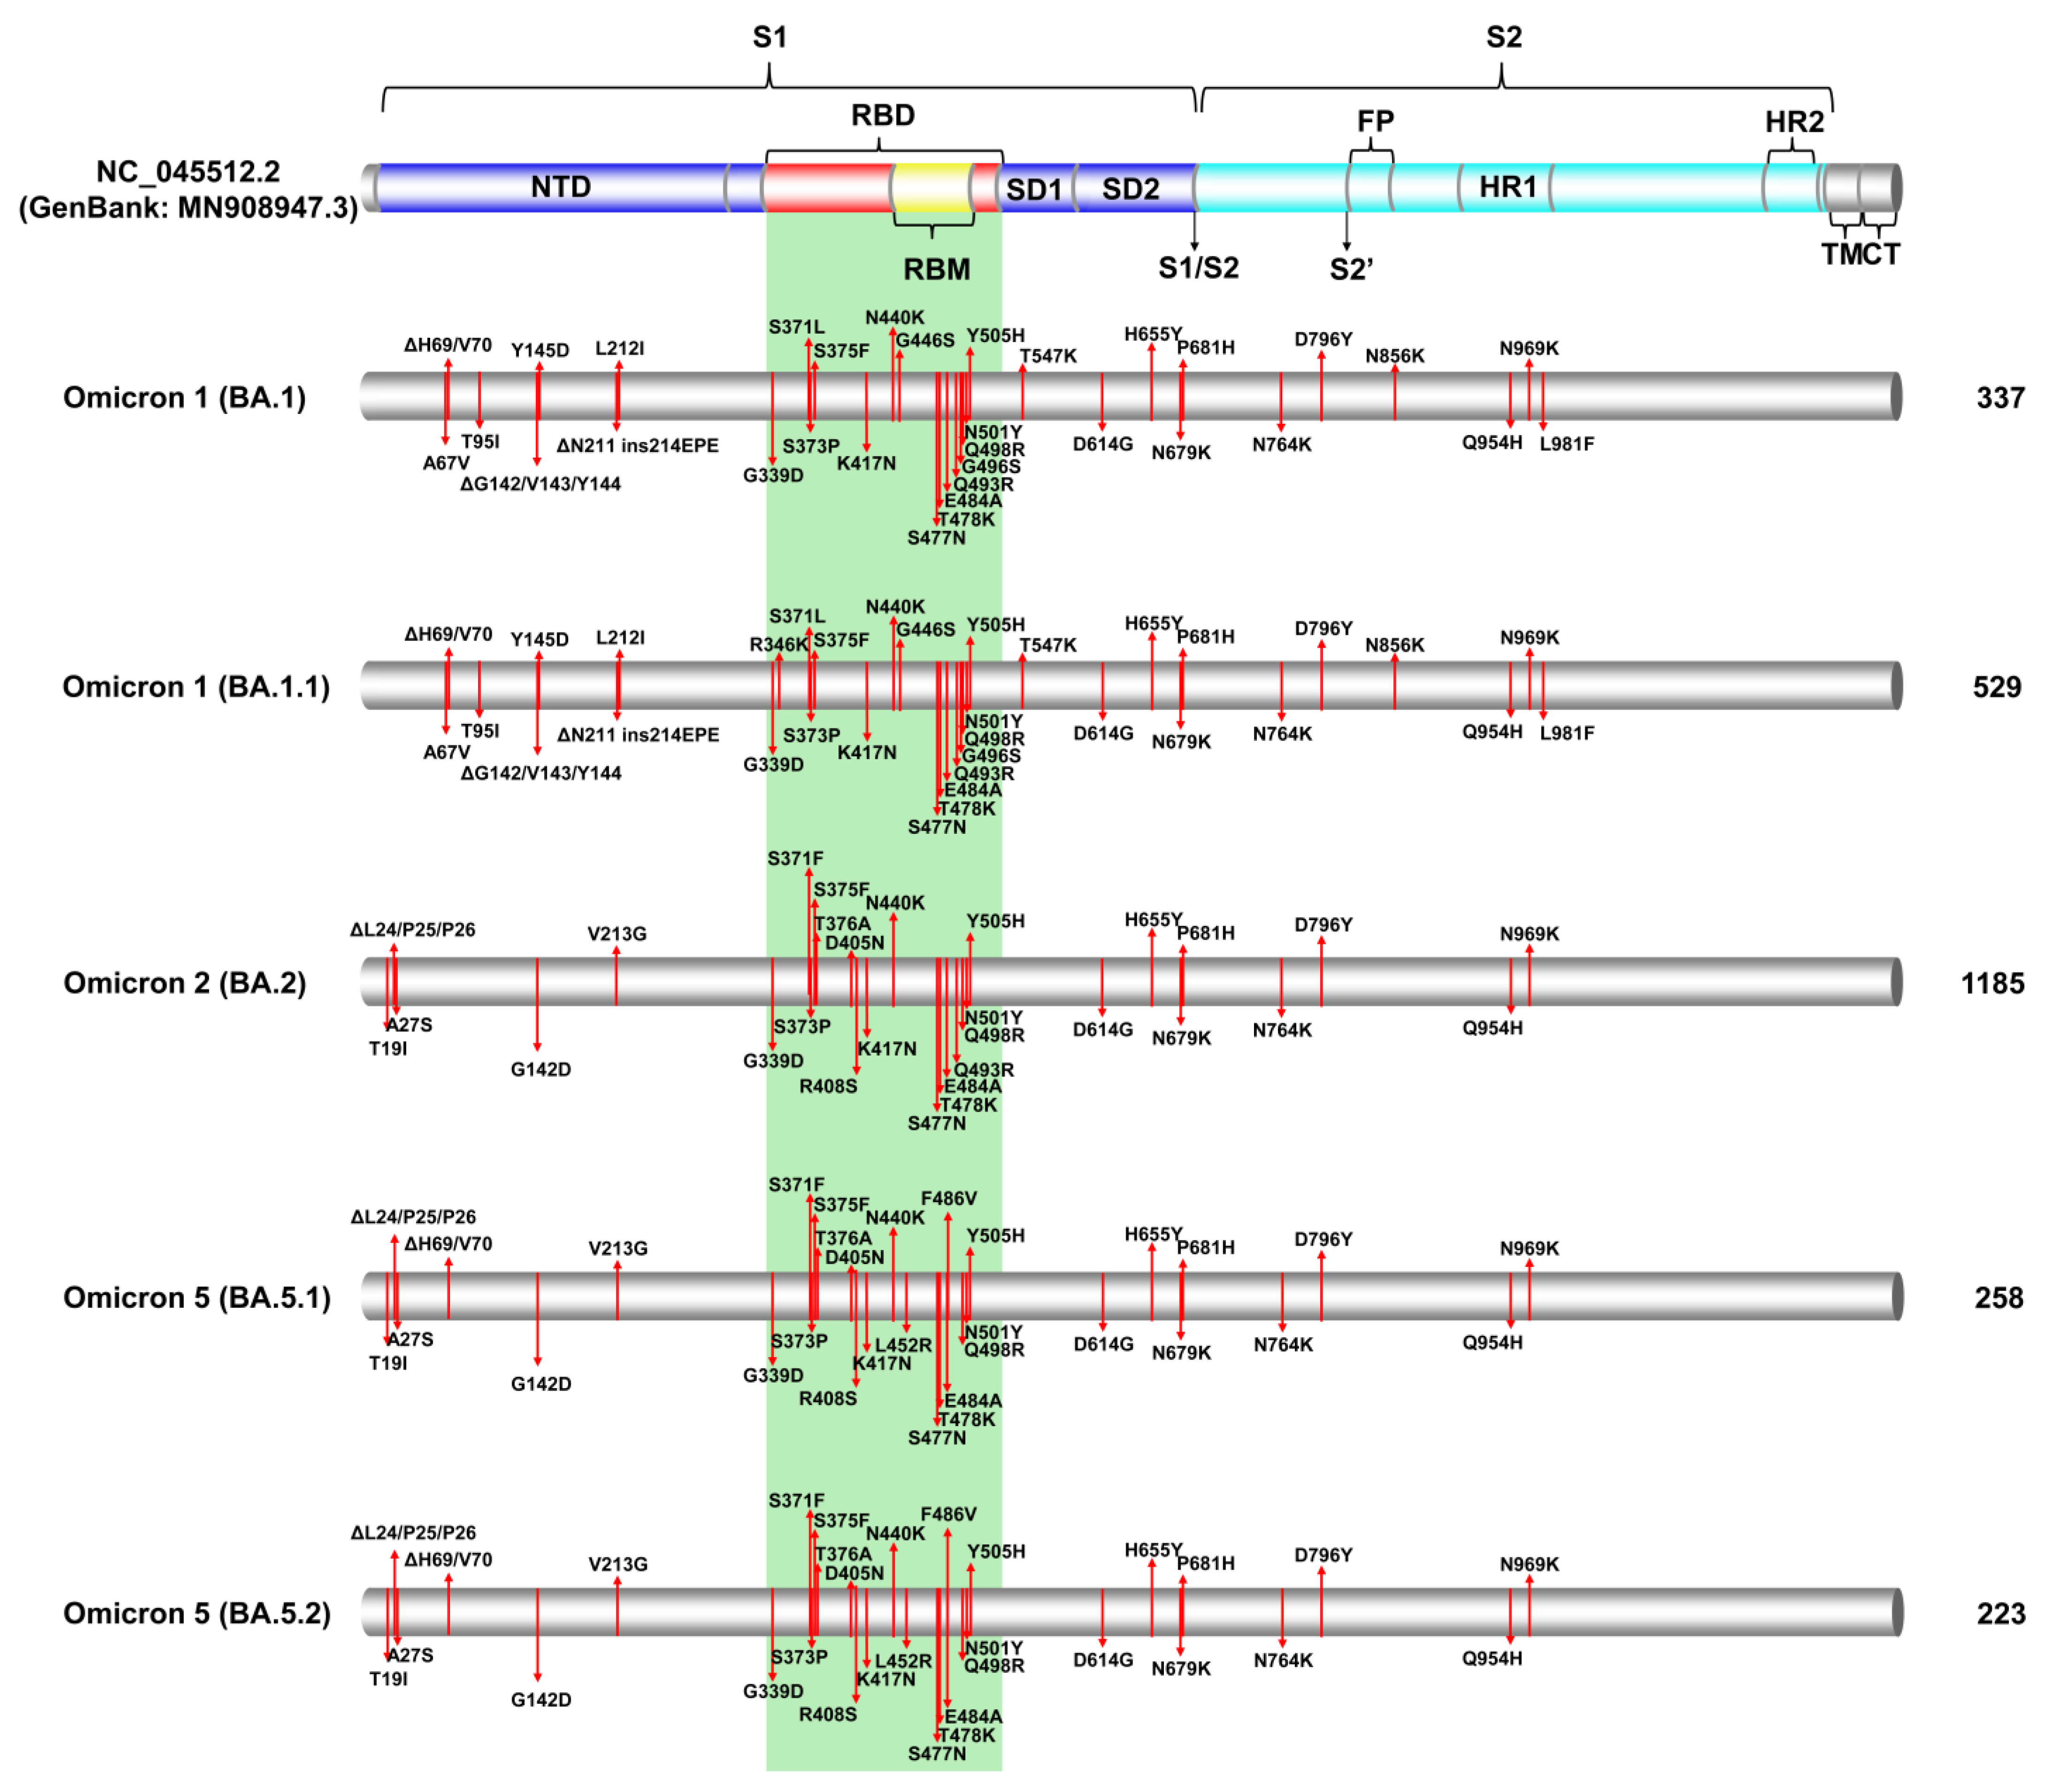
3.2. SARS-CoV-2 Spike Protein Mutations
3.2.1. Common Spike Protein Mutations: The Most Prevalent Lineages/Variants in Cyprus
3.2.2. Identification of Omicron-like Spike Protein Mutations in Delta Variants, Nicknamed Deltacron Variants: In-Depth Molecular Characterization
3.3. Phylogeny of Cypriot SARS-CoV-2 Sequences
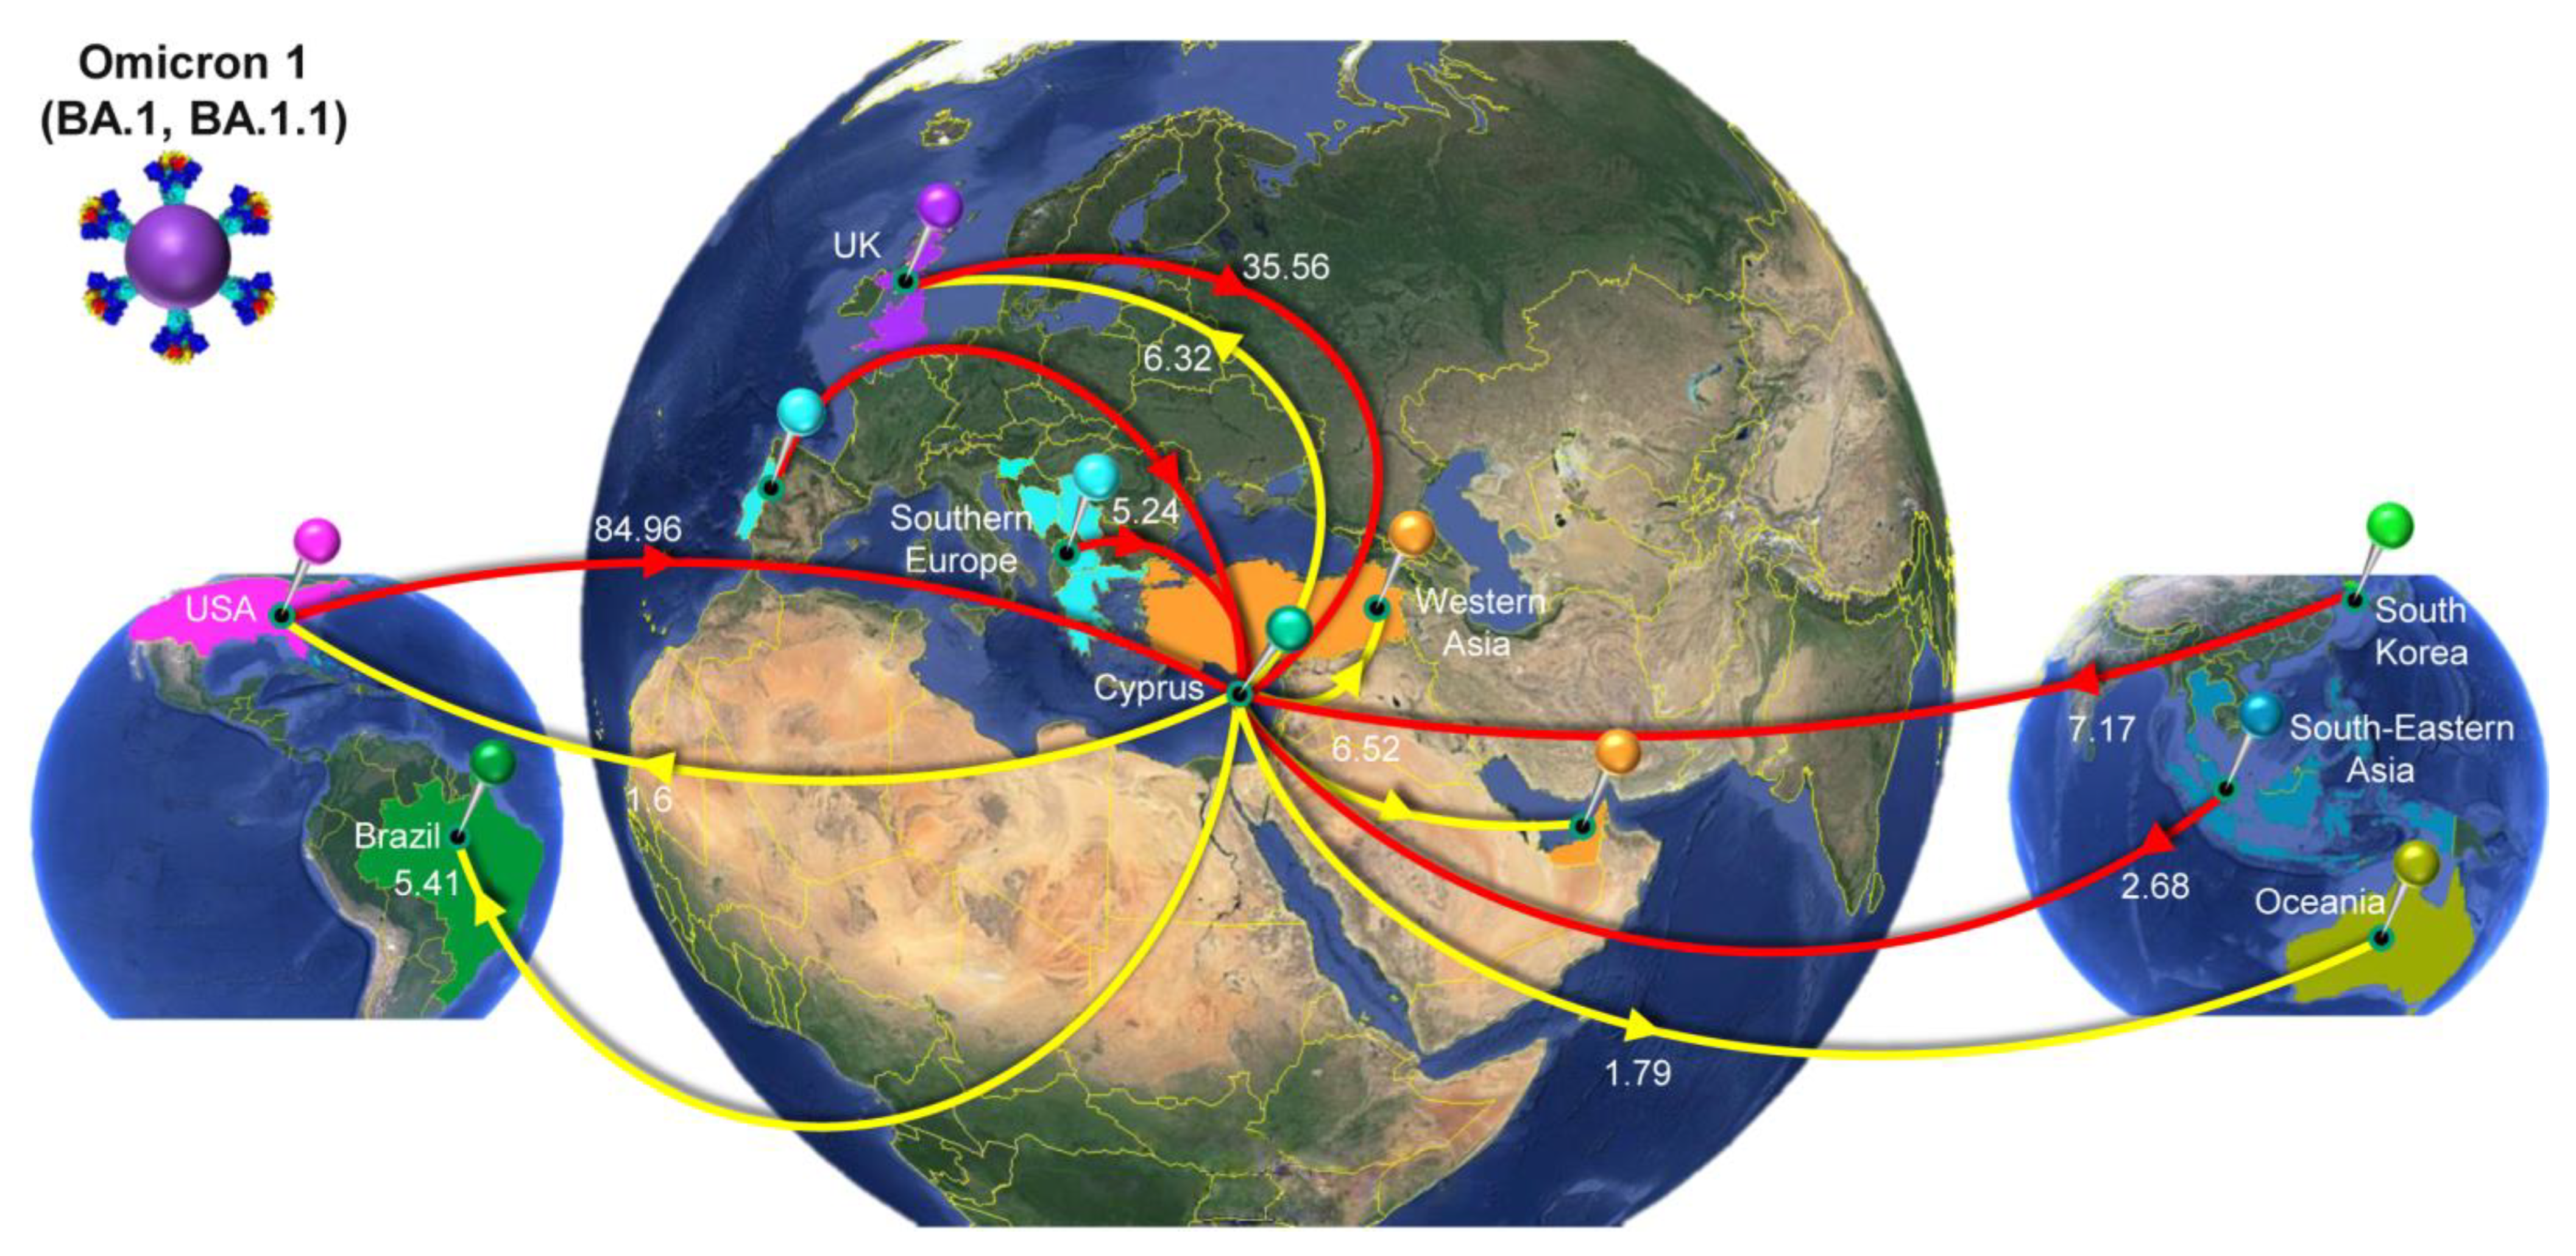
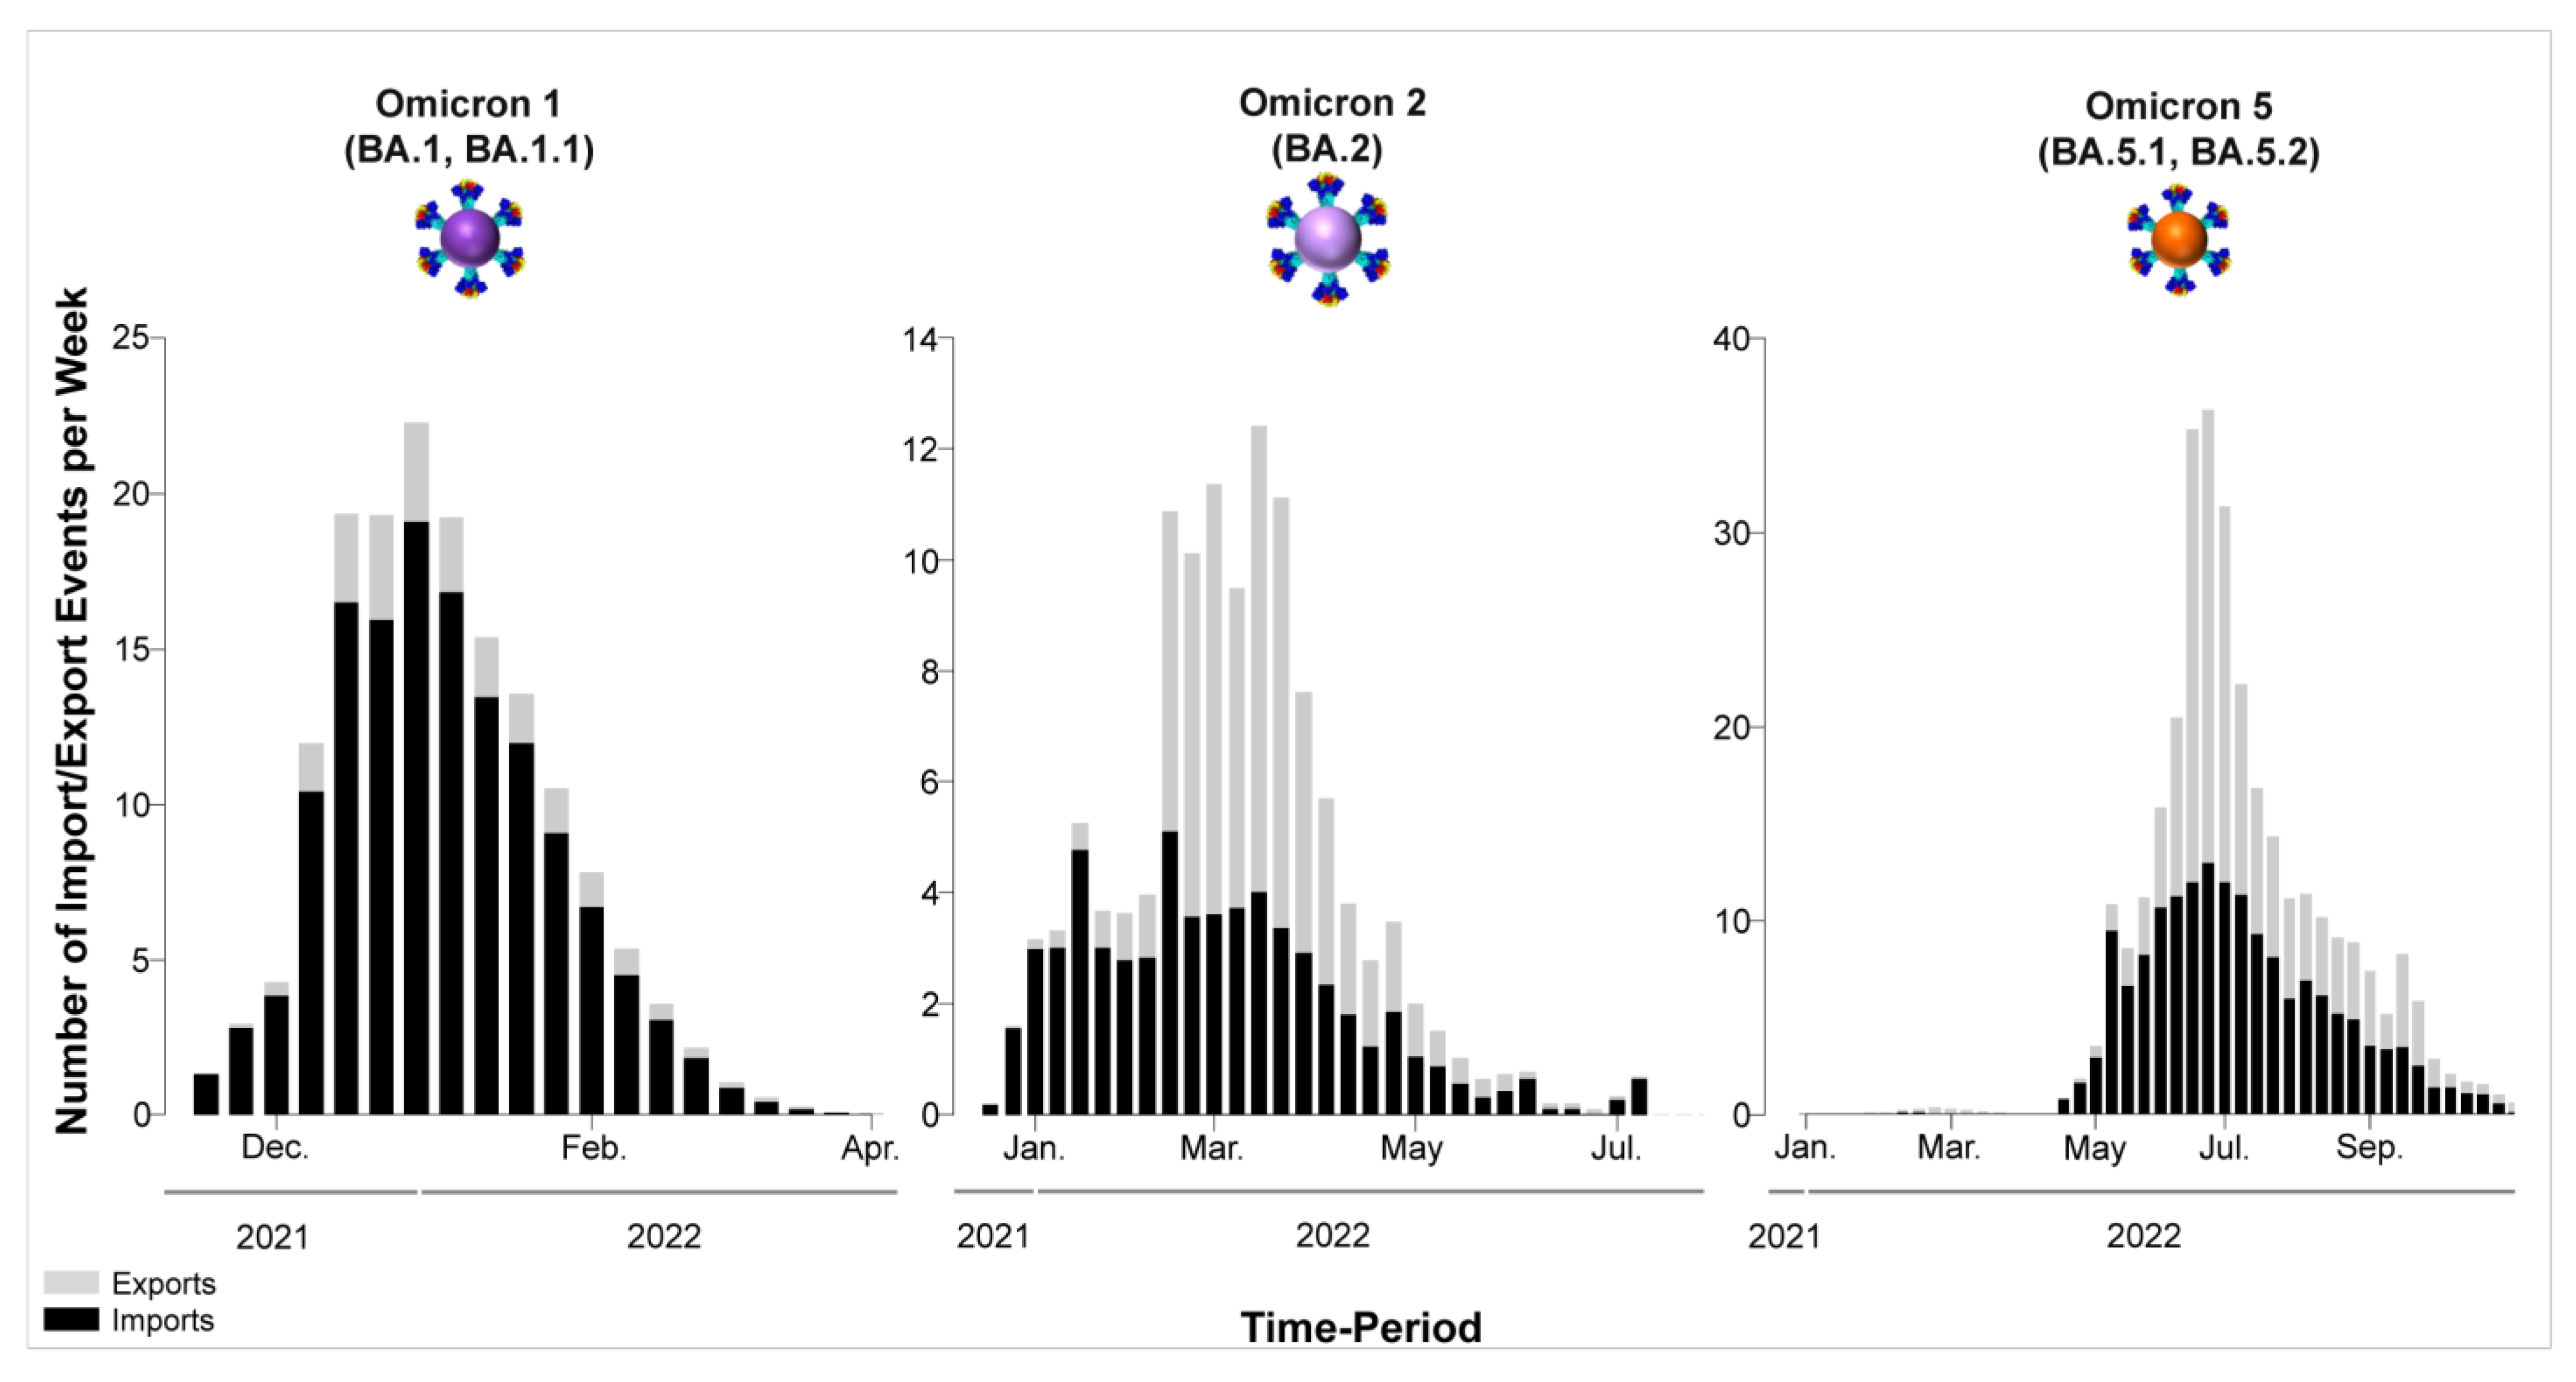
3.4. Time-Scaled Migration Histories
4. Discussion
4.1. Overview of the SARS-CoV-2 Waves Identified in This Study
4.2. Delta Variant Variability and Deltacron Genomes
4.3. The First Peak of the Fifth Wave: Omicron 1
4.4. The Second Peak of the Fifth Wave: Omicron 2
4.5. The Sixth Wave: Omicron 5
4.6. The Dominance of Omicron
4.7. Conclusions
Supplementary Materials
Author Contributions
Funding
Institutional Review Board Statement
Informed Consent Statement
Data Availability Statement
Acknowledgments
Conflicts of Interest
References
- Rabi, F.A.; Al Zoubi, M.S.; Al-Nasser, A.D.; Kasasbeh, G.A.; Salameh, D.M. Sars-cov-2 and coronavirus disease 2019: What we know so far. Pathogens 2020, 9, 231. [Google Scholar] [CrossRef] [PubMed]
- Nicola, M.; Alsafi, Z.; Sohrabi, C.; Kerwan, A.; Al-Jabir, A.; Iosifidis, C.; Agha, M.; Agha, R. The socio-economic implications of the coronavirus pandemic (COVID-19): A review. Int. J. Surg. 2020, 78, 185–193. [Google Scholar] [CrossRef] [PubMed]
- Dong, E.; Du, H.; Gardner, L. An interactive web-based dashboard to track COVID-19 in real time. Lancet Infect. Dis. 2020, 20, 533–534. [Google Scholar] [CrossRef]
- Center for Systems Science and Engineering (CSSE) at Johns Hopkins University (JHU). COVID-19 Dashboard. Available online: https://gisanddata.maps.arcgis.com/apps/dashboards/bda7594740fd40299423467b48e9ecf6 (accessed on 15 August 2023).
- The World Health Organization (WHO) Tracking SARS-CoV-2 Variants. Available online: https://www.who.int/activities/tracking-SARS-CoV-2-variants (accessed on 3 May 2023).
- Kumar, A.; Parashar, R.; Kumar, S.; Faiq, M.A.; Kumari, C.; Kulandhasamy, M.; Narayan, R.K.; Jha, R.K.; Singh, H.N.; Prasoon, P.; et al. Emerging SARS-CoV-2 variants can potentially break set epidemiological barriers in COVID-19. J. Med. Virol. 2022, 94, 1300–1314. [Google Scholar] [CrossRef]
- Ahmad, A.; Fawaz, M.A.M.; Aisha, A. A comparative overview of SARS-CoV-2 and its variants of concern. Le Infez. Med. 2022, 30, 328–343. [Google Scholar] [CrossRef]
- Tosta, S.; Moreno, K.; Schuab, G.; Fonseca, V.; Segovia, F.M.C.; Kashima, S.; Elias, M.C.; Sampaio, S.C.; Ciccozzi, M.; Alcantara, L.C.J.; et al. Global SARS-CoV-2 genomic surveillance: What we have learned (so far). Infect. Genet. Evol. 2023, 108, 105405. [Google Scholar] [CrossRef] [PubMed]
- Wagner, A.L. What Makes a “Wave” of Disease? An Epidemiologist Explains. Available online: https://theconversation.com/what-makes-a-wave-of-disease-an-epidemiologist-explains-141573 (accessed on 25 July 2022).
- da Silva, S.J.R.; Kohl, A.; Pena, L.; Pardee, K. Recent insights into SARS-CoV-2 omicron variant. Rev. Med. Virol. 2023, 33, e2373. [Google Scholar] [CrossRef]
- Tatsi, E.-B.; Filippatos, F.; Michos, A. SARS-CoV-2 variants and effectiveness of vaccines: A review of current evidence. Epidemiol. Infect. 2021, 149, e237. [Google Scholar] [CrossRef]
- Viana, R.; Moyo, S.; Amoako, D.G.; Tegally, H.; Scheepers, C.; Althaus, C.L.; Anyaneji, U.J.; Bester, P.A.; Boni, M.F.; Chand, M.; et al. Rapid epidemic expansion of the SARS-CoV-2 Omicron variant in southern Africa. Nature 2022, 603, 679–686. [Google Scholar] [CrossRef]
- Islam, F.; Dhawan, M.; Nafady, M.H.; Emran, T.B.; Mitra, S.; Choudhary, O.P.; Akter, A. Understanding the omicron variant (B.1.1.529) of SARS-CoV-2: Mutational impacts, concerns, and the possible solutions. Ann. Med. Surg. 2022, 78, 103737. [Google Scholar] [CrossRef]
- Markov, P.V.; Ghafari, M.; Beer, M.; Lythgoe, K.; Simmonds, P.; Stilianakis, N.I.; Katzourakis, A. The evolution of SARS-CoV-2. Nat. Rev. Microbiol. 2023, 21, 361–379. [Google Scholar] [CrossRef] [PubMed]
- Karyakarte, R.P.; Das, R.; Rajmane, M.V.; Dudhate, S.; Agarasen, J.; Pillai, P.; Chandankhede, P.M.; Labhshetwar, R.S.; Gadiyal, Y.; Kulkarni, P.P.; et al. Chasing SARS-CoV-2 XBB.1.16 Recombinant Lineage in India and the Clinical Profile of XBB.1.16 cases in Maharashtra, India. medRxiv 2023, 15, e39816. [Google Scholar] [CrossRef] [PubMed]
- Callaway, E. COVID “variant soup” is making winter surges hard to predict. Nature 2022, 611, 213–214. [Google Scholar] [CrossRef]
- Callaway, E. COVID’s future: Mini-waves rather than seasonal surges. Nature 2023, 617, 229–230. [Google Scholar] [CrossRef] [PubMed]
- Parra-Lucares, A.; Segura, P.; Rojas, V.; Pumarino, C.; Saint-Pierre, G.; Toro, L. Emergence of SARS-CoV-2 Variants in the World: How Could This Happen? Life 2022, 12, 194. [Google Scholar] [CrossRef] [PubMed]
- Rodrigo, G.-L.; Estibalitz, L.-S.; Roselyn, L.-M.; Alejandro, S.-F.; Carlos, S.-V. The New SARS-CoV-2 Variants and Their Epidemiological Impact in Mexico. MBio 2022, 13, e01060-12. [Google Scholar] [CrossRef]
- Andrés, C.; Piñana, M.; Borràs-Bermejo, B.; González-Sánchez, A.; García-Cehic, D.; Esperalba, J.; Rando, A.; Zules-Oña, R.-G.; Campos, C.; Codina, M.G.; et al. A year living with SARS-CoV-2: An epidemiological overview of viral lineage circulation by whole-genome sequencing in Barcelona city (Catalonia, Spain). Emerg. Microbes Infect. 2022, 11, 172–181. [Google Scholar] [CrossRef]
- da Silva, M.S.; Gularte, J.S.; Filippi, M.; Demoliner, M.; Girardi, V.; Mosena, A.C.S.; de Abreu Góes Pereira, V.M.; Hansen, A.W.; Weber, M.N.; de Almeida, P.R.; et al. Genomic and epidemiologic surveillance of SARS-CoV-2 in Southern Brazil and identification of a new Omicron-L452R sublineage. Virus Res. 2022, 321, 198907. [Google Scholar] [CrossRef]
- Menezes, D.; Fonseca, P.L.; de Araújo, J.L.; Souza, R.P. SARS-CoV-2 Genomic Surveillance in Brazil: A Systematic Review with Scientometric Analysis. Viruses 2022, 14, 2715. [Google Scholar] [CrossRef]
- The COVID-19 Genomics UK (COG-UK) Consortium. An integrated national scale SARS-CoV-2 genomic surveillance network. Lancet Microbe 2020, 1, e99–e100. [Google Scholar] [CrossRef]
- Chrysostomou, A.C.; Vrancken, B.; Haralambous, C.; Alexandrou, M.; Aristokleous, A.; Christodoulou, C.; Gregoriou, I.; Ioannides, M.; Kalakouta, O.; Karagiannis, C.; et al. Genomic Epidemiology of the SARS-CoV-2 Epidemic in Cyprus from November 2020 to October 2021: The Passage of Waves of Alpha and Delta Variants of Concern. Viruses 2022, 15, 108. [Google Scholar] [CrossRef] [PubMed]
- Chrysostomou, A.C.; Vrancken, B.; Koumbaris, G.; Themistokleous, G.; Aristokleous, A.; Masia, C.; Eleftheriou, C.; Ioannou, C.; Stylianou, D.C.; Ioannides, M.; et al. A Comprehensive Molecular Epidemiological Analysis of SARS-CoV-2 Infection in Cyprus from April 2020 to January 2021: Evidence of a Highly Polyphyletic and Evolving Epidemic. Viruses 2021, 13, 1098. [Google Scholar] [CrossRef]
- O’Toole, Á.; Scher, E.; Underwood, A.; Jackson, B.; Hill, V.; McCrone, J.T.; Colquhoun, R.; Ruis, C.; Abu-Dahab, K.; Taylor, B.; et al. Assignment of epidemiological lineages in an emerging pandemic using the pangolin tool. Virus Evol. 2021, 7, veab064. [Google Scholar] [CrossRef] [PubMed]
- Aksamentov, I.; Roemer, C.; Hodcroft, E.; Neher, R. Nextclade: Clade assignment, mutation calling and quality control for viral genomes. J. Open Source Softw. 2021, 6, 3773. [Google Scholar] [CrossRef]
- Suzuki, Y.; Nishimura, M.; Inoue, T.; Kobayashi, Y. Methods for reducing the number of sequences in molecular evolutionary analyses. Meta Gene 2020, 23, 100629. [Google Scholar] [CrossRef]
- Katoh, K.; Standley, D.M. MAFFT multiple sequence alignment software version 7: Improvements in performance and usability. Mol. Biol. Evol. 2013, 30, 772–780. [Google Scholar] [CrossRef]
- Larsson, A. AliView: A fast and lightweight alignment viewer and editor for large datasets. Bioinformatics 2014, 30, 3276–3278. [Google Scholar] [CrossRef]
- Nguyen, L.T.; Schmidt, H.A.; Von Haeseler, A.; Minh, B.Q. IQ-TREE: A fast and effective stochastic algorithm for estimating maximum-likelihood phylogenies. Mol. Biol. Evol. 2015, 32, 268–274. [Google Scholar] [CrossRef]
- Guindon, S.; Dufayard, J.F.; Lefort, V.; Anisimova, M.; Hordijk, W.; Gascuel, O. New algorithms and methods to estimate maximum-likelihood phylogenies: Assessing the performance of PhyML 3.0. Syst. Biol. 2010, 59, 307–321. [Google Scholar] [CrossRef]
- Hoang, D.T.; Chernomor, O.; Von Haeseler, A.; Minh, B.Q.; Vinh, L.S. UFBoot2: Improving the ultrafast bootstrap approximation. Mol. Biol. Evol. 2018, 35, 518–522. [Google Scholar] [CrossRef]
- To, T.-H.; Jung, M.; Lycett, S.; Gascuel, O. Fast Dating Using Least-Squares Criteria and Algorithms. Syst. Biol. 2016, 65, 82–97. [Google Scholar] [CrossRef] [PubMed]
- Lemey, P.; Rambaut, A.; Drummond, A.J.; Suchard, M.A. Bayesian phylogeography finds its roots. PLoS Comput. Biol. 2009, 5, e1000520. [Google Scholar] [CrossRef] [PubMed]
- Lemey, P.; Rambaut, A.; Bedford, T.; Faria, N.; Bielejec, F.; Baele, G.; Russell, C.A.; Smith, D.J.; Pybus, O.G.; Brockmann, D.; et al. Unifying Viral Genetics and Human Transportation Data to Predict the Global Transmission Dynamics of Human Influenza H3N2. PLoS Pathog. 2014, 10, e1003932. [Google Scholar] [CrossRef] [PubMed]
- Minin, V.N.; Suchard, M.A. Fast, accurate and simulation-free stochastic mapping. Philos. Trans. R. Soc. B Biol. Sci. 2008, 363, 3985–3995. [Google Scholar] [CrossRef]
- KIOS Research and Innovation Center of Excellence (KIOS CoE) H εξάπλωση της COVID-19 στη Κύπρο (The Spread of COVID-19 in Cyprus). Available online: https://covid19.ucy.ac.cy/ (accessed on 16 December 2022).
- Press and Information Office Aνακοινωθέντα (Press Releases)-Aνακοίνωση του Υπουργείου Υγείας για νέα περιστατικά της νόσου COVID-19 (Announcement of the Ministry of Health of New COVID-19 Incidents. Available online: https://www.pio.gov.cy/ανακοινωθέντα/?keyword=Aνακοίνωση+του+Υπουργείου+Υγείας+για+νέα+περιστατικά+της+νόσου+COVID-19&startdate=&enddate=&category=&submitbtn=Aναζήτηση (accessed on 15 June 2022).
- Centers for Disease Control and Prevention (CDC) Calculating SARS-CoV-2 Laboratory Test Percent Positivity: CDC Methods and Considerations for Comparisons and Interpretation. Available online: https://www.cdc.gov/coronavirus/2019-ncov/lab/resources/calculating-percent-positivity.html (accessed on 15 June 2022).
- Liu, L.; Wang, P.; Nair, M.S.; Yu, J.; Rapp, M.; Wang, Q.; Luo, Y.; Chan, J.F.W.; Sahi, V.; Figueroa, A.; et al. Potent neutralizing antibodies against multiple epitopes on SARS-CoV-2 spike. Nature 2020, 584, 450–456. [Google Scholar] [CrossRef] [PubMed]
- Bateman, A.; Martin, M.J.; O’Donovan, C.; Magrane, M.; Alpi, E.; Antunes, R.; Bely, B.; Bingley, M.; Bonilla, C.; Britto, R.; et al. UniProt: The universal protein knowledgebase. Nucleic Acids Res. 2017, 45, D158–D169. [Google Scholar] [CrossRef]
- Ma, J.; Acevedo, A.C.; Wang, Q. High-Potency Polypeptide-based Interference for Coronavirus Spike Glycoproteins. bioRxiv 2021. [Google Scholar] [CrossRef]
- Khelashvili, G.; Plante, A.; Doktorova, M.; Weinstein, H. Ca(2+)-dependent mechanism of membrane insertion and destabilization by the SARS-CoV-2 fusion peptide. Biophys. J. 2021, 120, 1105–1119. [Google Scholar] [CrossRef]
- Wang, P.; Nair, M.S.; Liu, L.; Iketani, S.; Luo, Y.; Guo, Y.; Wang, M.; Yu, J.; Zhang, B.; Kwong, P.D.; et al. Antibody Resistance of SARS-CoV-2 Variants B.1.351 and B.1.1.7. Nature 2021, 593, 130–135. [Google Scholar] [CrossRef]
- Kim, S.; Lee, J.H.; Lee, S.; Shim, S.; Nguyen, T.T.; Hwang, J.; Kim, H.; Choi, Y.O.; Hong, J.; Bae, S.; et al. The progression of sars coronavirus 2 (SARS-CoV-2): Mutation in the receptor binding domain of spike gene. Immune Netw. 2020, 20, e41. [Google Scholar] [CrossRef]
- Mittal, A.; Manjunath, K.; Ranjan, R.K.; Kaushik, S.; Kumar, S.; Verma, V. COVID-19 pandemic: Insights into structure, function, and hACE2 receptor recognition by SARS-CoV-2. PLoS Pathog. 2020, 16, e1008762. [Google Scholar] [CrossRef] [PubMed]
- Huang, Y.; Yang, C.; Xu, X.f.; Xu, W.; Liu, S.w. Structural and functional properties of SARS-CoV-2 spike protein: Potential antivirus drug development for COVID-19. Acta Pharmacol. Sin. 2020, 41, 1141–1149. [Google Scholar] [CrossRef] [PubMed]
- Xia, X. Domains and Functions of Spike Protein in Sars-Cov-2 in the Context of Vaccine Design. Viruses 2021, 13, 109. [Google Scholar] [CrossRef] [PubMed]
- Gobeil, S.M.C.; Janowska, K.; McDowell, S.; Mansouri, K.; Parks, R.; Manne, K.; Stalls, V.; Kopp, M.F.; Henderson, R.; Edwards, R.J.; et al. D614G Mutation Alters SARS-CoV-2 Spike Conformation and Enhances Protease Cleavage at the S1/S2 Junction. Cell Rep. 2021, 34, 108630. [Google Scholar] [CrossRef] [PubMed]
- Sasaki, M.; Uemura, K.; Sato, A.; Toba, S.; Sanaki, T.; Maenaka, K.; Hall, W.W.; Orba, Y.; Sawa, H. SARS-CoV-2 variants with mutations at the S1/S2 cleavage site are generated in vitro during propagation in TMPRSS2-deficient cells. PLoS Pathog. 2021, 17, e1009233. [Google Scholar] [CrossRef] [PubMed]
- Kapoor, K.; Chen, T.; Tajkhorshid, E. Posttranslational modifications optimize the ability of SARS-CoV-2 spike for effective interaction with host cell receptors. Proc. Natl. Acad. Sci. USA 2022, 119, e2119761119. [Google Scholar] [CrossRef]
- Magazine, N.; Zhang, T.; Wu, Y.; McGee, M.C.; Veggiani, G.; Huang, W. Mutations and Evolution of the SARS-CoV-2 Spike Protein. Viruses 2022, 14, 640. [Google Scholar] [CrossRef]
- Hodcroft, E.B. CoVariants: SARS-CoV-2 Mutations and Variants of Interest. Available online: https://covariants.org/ (accessed on 2 June 2023).
- Shrestha, L.B.; Foster, C.; Rawlinson, W.; Tedla, N.; Bull, R.A. Evolution of the SARS-CoV-2 omicron variants BA.1 to BA.5: Implications for immune escape and transmission. Rev. Med. Virol. 2022, 32, e2381. [Google Scholar] [CrossRef]
- Beheshti Namdar, A.; Keikha, M. BA. 2.12.1 is a new omicron offshoot that is a highly contagious but not severe disease. Ann. Med. Surg. 2022, 79, 104034. [Google Scholar] [CrossRef]
- Parums, D.V. Editorial: World Health Organization (WHO) Variants of Concern Lineages Under Monitoring (VOC-LUM) in Response to the Global Spread of Lineages and Sublineages of Omicron, or B.1.1.529, SARS-CoV-2. Med. Sci. Monit. Int. Med. J. Exp. Clin. Res. 2022, 28, e937676. [Google Scholar] [CrossRef]
- Philip, A.M.; Ahmed, W.S.; Biswas, K.H. Reversal of the unique Q493R mutation increases the affinity of Omicron S1-RBD for ACE2. Comput. Struct. Biotechnol. J. 2023, 21, 1966–1977. [Google Scholar] [CrossRef] [PubMed]
- Dijokaite-Guraliuc, A.; Das, R.; Zhou, D.; Ginn, H.M.; Liu, C.; Duyvesteyn, H.M.E.; Huo, J.; Nutalai, R.; Supasa, P.; Selvaraj, M.; et al. Rapid escape of new SARS-CoV-2 Omicron variants from BA.2-directed antibody responses. Cell Rep. 2023, 42, 112271. [Google Scholar] [CrossRef] [PubMed]
- Chen, C.; Nadeau, S.; Yared, M.; Voinov, P.; Xie, N.; Roemer, C.; Stadler, T. CoV-Spectrum: Analysis of globally shared SARS-CoV-2 data to identify and characterize new variants. Bioinformatics 2022, 38, 1735–1737. [Google Scholar] [CrossRef]
- Rambaut, A.; Holmes, E.C.; O’Toole, Á.; Hill, V.; McCrone, J.T.; Ruis, C.; du Plessis, L.; Pybus, O.G. A dynamic nomenclature proposal for SARS-CoV-2 lineages to assist genomic epidemiology. Nat. Microbiol. 2020, 5, 1403–1407. [Google Scholar] [CrossRef] [PubMed]
- Singh, J.K.; Anand, S.; Srivastava, S.K. Is BF.7 more infectious than other Omicron subtypes: Insights from structural and simulation studies of BF.7 spike RBD variant. Int. J. Biol. Macromol. 2023, 238, 124154. [Google Scholar] [CrossRef]
- Chakraborty, C.; Bhattacharya, M.; Sharma, A.R. Present variants of concern and variants of interest of severe acute respiratory syndrome coronavirus 2: Their significant mutations in S-glycoprotein, infectivity, re-infectivity, immune escape and vaccines activity. Rev. Med. Virol. 2022, 32, e2270. [Google Scholar] [CrossRef]
- Planas, D.; Bruel, T.; Staropoli, I.; Guivel-Benhassine, F.; Porrot, F.; Maes, P.; Grzelak, L.; Prot, M.; Mougari, S.; Planchais, C.; et al. Resistance of Omicron subvariants BA.2.75.2, BA.4.6, and BQ.1.1 to neutralizing antibodies. Nat. Commun. 2023, 14, 824. [Google Scholar] [CrossRef]
- Focosi, D.; Quiroga, R.; McConnell, S.; Johnson, M.C.; Casadevall, A. Convergent Evolution in SARS-CoV-2 Spike Creates a Variant Soup from Which New COVID-19 Waves Emerge. Int. J. Mol. Sci. 2023, 24, 2264. [Google Scholar] [CrossRef]
- Saputri, D.S.; Li, S.; van Eerden, F.J.; Rozewicki, J.; Xu, Z.; Ismanto, H.S.; Davila, A.; Teraguchi, S.; Katoh, K.; Standley, D.M. Flexible, Functional, and Familiar: Characteristics of SARS-CoV-2 Spike Protein Evolution. Front. Microbiol. 2020, 11, 2112. [Google Scholar] [CrossRef]
- Peng, Q.; Zhou, R.; Liu, N.; Wang, H.; Xu, H.; Zhao, M.; Yang, D.; Au, K.-K.; Huang, H.; Liu, L.; et al. Naturally occurring spike mutations influence the infectivity and immunogenicity of SARS-CoV-2. Cell. Mol. Immunol. 2022, 19, 1302–1310. [Google Scholar] [CrossRef]
- McCallum, M.; De Marco, A.; Lempp, F.A.; Tortorici, M.A.; Pinto, D.; Walls, A.C.; Beltramello, M.; Chen, A.; Liu, Z.; Zatta, F.; et al. N-terminal domain antigenic mapping reveals a site of vulnerability for SARS-CoV-2. Cell 2021, 184, 2332–2347.e16. [Google Scholar] [CrossRef] [PubMed]
- Carabelli, A.M.; Peacock, T.P.; Thorne, L.G.; Harvey, W.T.; Hughes, J.; de Silva, T.I.; Peacock, S.J.; Barclay, W.S.; de Silva, T.I.; Towers, G.J.; et al. SARS-CoV-2 variant biology: Immune escape, transmission and fitness. Nat. Rev. Microbiol. 2023, 21, 162–177. [Google Scholar] [CrossRef] [PubMed]
- Khare, S.; Gurry, C.; Freitas, L.; Schultz, M.B.; Bach, G.; Diallo, A.; Akite, N.; Ho, J.; Lee, R.T.C.; Yeo, W. GISAID’s Role in Pandemic Response. China CDC Wkly. 2021, 3, 1049. [Google Scholar] [CrossRef]
- Artic-Network Artic-ncov2019. Available online: https://github.com/artic-network/artic-ncov2019/blob/master/primer_schemes/nCoV-2019/V3/nCoV-2019.tsv (accessed on 13 February 2022).
- Quick, J.; Loman, N. RTIC Network: Artic. Network. 2020. Available online: https://artic.network/resources/ncov/ncov-amplicon-v3.pdf (accessed on 13 February 2022).
- Sanderson, T.; Barrett, J.C. Variation at Spike position 142 in SARS-CoV-2 Delta genomes is a technical artifact caused by dropout of a sequencing amplicon. Wellcome Open Res. 2021, 6, 305. [Google Scholar] [CrossRef]
- Kreier, F. Deltacron: The story of the variant that wasn’t. Nature 2022, 602, 19. [Google Scholar] [CrossRef] [PubMed]
- Dhawan, M.; Sharma, A.; Priyanka; Thakur, N.; Rajkhowa, T.K.; Choudhary, O.P. Delta variant (B.1.617.2) of SARS-CoV-2: Mutations, impact, challenges and possible solutions. Hum. Vaccin. Immunother. 2022, 18, 2068883. [Google Scholar] [CrossRef] [PubMed]
- Robinson, J.; Banerjee, I. Omicron: Subvariants, Flurona, Deltacron media misinformation and plot twists. J. Adv. Intern. Med. 2022, 11, 29–31. [Google Scholar] [CrossRef]
- Wang, J.; Fatima Muhammad, S.; Aman, S.; Khan, A.; Munir, S.; Khan, M.; Mohammad, A.; Waheed, Y.; Munir, M.; Guo, L.; et al. Structural communication fingerprinting and dynamic investigation of RBD-hACE2 complex from BA.1 × AY.4 recombinant variant (Deltacron) of SARS-CoV-2 to decipher the structural basis for enhanced transmission. J. Biomol. Struct. Dyn. 2022, 41, 7665–7676. [Google Scholar] [CrossRef]
- Evans, J.P.; Qu, P.; Zeng, C.; Zheng, Y.-M.; Carlin, C.; Bednash, J.S.; Lozanski, G.; Mallampalli, R.K.; Saif, L.J.; Oltz, E.M.; et al. Neutralization of the SARS-CoV-2 Deltacron and BA.3 Variants. N. Engl. J. Med. 2022, 386, 2340–2342. [Google Scholar] [CrossRef]
- Farheen, S.; Araf, Y.; Tang, Y.-D.; Zheng, C. The Deltacron conundrum: Its origin and potential health risks. J. Med. Virol. 2022, 94, 5096–5102. [Google Scholar] [CrossRef]
- Maulud, S.Q.; Hasan, D.A.; Ali, R.K.; Rashid, R.F.; Saied, A.A.; Dhawan, M.; Priyanka; Choudhary, O.P. Deltacron: Apprehending a new phase of the COVID-19 pandemic. Int. J. Surg. 2022, 102, 106654. [Google Scholar] [CrossRef]
- Moisan, A.; Mastrovito, B.; De Oliveira, F.; Martel, M.; Hedin, H.; Leoz, M.; Nesi, N.; Schaeffer, J.; Ar Gouilh, M.; Plantier, J.-C. Evidence of Transmission and Circulation of Deltacron XD Recombinant Severe Acute Respiratory Syndrome Coronavirus 2 in Northwest France. Clin. Infect. Dis. 2022, 75, 1841–1844. [Google Scholar] [CrossRef]
- Johnson, R.; Mangwana, N.; Sharma, J.R.; Muller, C.J.F.; Malemela, K.; Mashau, F.; Dias, S.; Ramharack, P.; Kinnear, C.; Glanzmann, B.; et al. Delineating the Spread and Prevalence of SARS-CoV-2 Omicron Sublineages (BA.1–BA.5) and Deltacron Using Wastewater in the Western Cape, South Africa. J. Infect. Dis. 2022, 226, 1418–1427. [Google Scholar] [CrossRef] [PubMed]
- Focosi, D.; Maggi, F. Recombination in Coronaviruses, with a Focus on SARS-CoV-2. Viruses 2022, 14, 1239. [Google Scholar] [CrossRef] [PubMed]
- Lacek, K.A.; Rambo-Martin, B.L.; Batra, D.; Zheng, X.-Y.; Hassell, N.; Sakaguchi, H.; Peacock, T.; Groves, N.; Keller, M.; Wilson, M.M.; et al. SARS-CoV-2 Delta-Omicron Recombinant Viruses, United States. Emerg. Infect. Dis. 2022, 28, 1442–1445. [Google Scholar] [CrossRef] [PubMed]
- Colson, P.; Fournier, P.-E.; Delerce, J.; Million, M.; Bedotto, M.; Houhamdi, L.; Yahi, N.; Bayette, J.; Levasseur, A.; Fantini, J.; et al. Culture and identification of a “Deltamicron” SARS-CoV-2 in a three cases cluster in southern France. J. Med. Virol. 2022, 94, 3739–3749. [Google Scholar] [CrossRef]
- Simon-Loriere, E.; Montagutelli, X.; Lemoine, F.; Donati, F.; Touret, F.; Bourret, J.; Prot, M.; Munier, S.; Attia, M.; Conquet, L. Rapid characterization of a Delta-Omicron SARS-CoV-2 recombinant detected in Europe. Biol. Sci. 2022. [Google Scholar] [CrossRef]
- Sant’Anna, F.H.; Finger Andreis, T.; Salvato, R.S.; Muterle Varela, A.P.; Comerlato, J.; Gregianini, T.S.; Barcellos, R.B.; de Souza Godinho, F.M.; Resende, P.C.; da Luz Wallau, G.; et al. Incipient Parallel Evolution of SARS-CoV-2 Deltacron Variant in South Brazil. Vaccines 2023, 11, 212. [Google Scholar] [CrossRef]
- Chavda, V.P.; Mishra, T.; Vuppu, S. Immunological Studies to Understand Hybrid/Recombinant Variants of SARS-CoV-2. Vaccines 2023, 11, 45. [Google Scholar] [CrossRef]
- Chakraborty, C.; Bhattacharya, M.; Sharma, A.R.; Dhama, K. Recombinant SARS-CoV-2 variants XD, XE, and XF: The emergence of recombinant variants requires an urgent call for research–Correspondence. Int. J. Surg. 2022, 102, 106670. [Google Scholar] [CrossRef]
- Thakur, P.; Thakur, V.; Kumar, P.; Singh Patel, S.K. Emergence of novel omicron hybrid variants: BA(x), XE, XD, XF more than just alphabets. Int. J. Surg. 2022, 104, 106727. [Google Scholar] [CrossRef] [PubMed]
- Chavda, V.P.; Vuppu, S.; Mishra, T.; Balar, P. The Emergence of Hybrid Variants of SARS-CoV-2: Towards Hybrid Immunity. Vaccines 2023, 11, 764. [Google Scholar] [CrossRef] [PubMed]
- Cinelli, M.; De Francisci Morales, G.; Galeazzi, A.; Quattrociocchi, W.; Starnini, M. The echo chamber effect on social media. Proc. Natl. Acad. Sci. USA 2021, 118, e2023301118. [Google Scholar] [CrossRef] [PubMed]
- Abbas, J.; Wang, D.; Su, Z.; Ziapour, A. The Role of Social Media in the Advent of COVID-19 Pandemic: Crisis Management, Mental Health Challenges and Implications. Risk Manag. Healthc. Policy 2021, 14, 1917–1932. [Google Scholar] [CrossRef]
- Karbalaei, M.; Keikha, M. Deltacron is a recombinant variant of SARS-CoV-2 but not a laboratory mistake. Ann. Med. Surg. 2022, 79, 104032. [Google Scholar] [CrossRef]
- Wang, L.; Gao, G.F. The “Wolf” Is Indeed Coming: Recombinant “Deltacron” SARS-CoV-2 Detected. China CDC Wkly. 2022, 4, 285–287. [Google Scholar] [CrossRef]
- Republic of Cyprus Ministry of Health New Coronavirus Disease (COVID-19). Available online: https://www.pio.gov.cy/coronavirus/eng/categories/important-announcements (accessed on 4 August 2023).
- Rahmani, S.; Rezaei, N. Omicron (B.1.1.529) variant: Development, dissemination, and dominance. J. Med. Virol. 2022, 94, 1787–1788. [Google Scholar] [CrossRef]
- Thakur, V.; Ratho, R.K. OMICRON (B.1.1.529): A new SARS-CoV-2 variant of concern mounting worldwide fear. J. Med. Virol. 2022, 94, 1821–1824. [Google Scholar] [CrossRef]
- Elliott, P.; Eales, O.; Steyn, N.; Tang, D.; Bodinier, B.; Wang, H.; Elliott, J.; Whitaker, M.; Atchison, C.; Diggle, P.J.; et al. Twin peaks: The Omicron SARS-CoV-2 BA.1 and BA.2 epidemics in England. Science 2023, 376, eabq4411. [Google Scholar] [CrossRef]
- Eales, O.; de Oliveira Martins, L.; Page, A.J.; Wang, H.; Bodinier, B.; Tang, D.; Haw, D.; Jonnerby, J.; Atchison, C.; Ashby, D.; et al. Dynamics of competing SARS-CoV-2 variants during the Omicron epidemic in England. Nat. Commun. 2022, 13, 4375. [Google Scholar] [CrossRef]
- Agyapon-Ntra, K.; McSharry, P.E. A global analysis of the effectiveness of policy responses to COVID-19. Sci. Rep. 2023, 13, 5629. [Google Scholar] [CrossRef] [PubMed]
- Rahimi, F.; Talebi Bezmin Abadi, A. The Omicron subvariant BA.2: Birth of a new challenge during the COVID-19 pandemic. Int. J. Surg. 2022, 99, 106261. [Google Scholar] [CrossRef]
- Tiecco, G.; Storti, S.; Arsuffi, S.; Degli Antoni, M.; Focà, E.; Castelli, F.; Quiros-Roldan, E. Omicron BA.2 Lineage, the “Stealth” Variant: Is It Truly a Silent Epidemic? A Literature Review. Int. J. Mol. Sci. 2022, 23, 7315. [Google Scholar] [CrossRef]
- Scandurra, C.; Bochicchio, V.; Dolce, P.; Valerio, P.; Muzii, B.; Maldonato, N.M. Why people were less compliant with public health regulations during the second wave of the Covid-19 outbreak: The role of trust in governmental organizations, future anxiety, fatigue, and COVID-19 risk perception. Curr. Psychol. 2023, 42, 7403–7413. [Google Scholar] [CrossRef] [PubMed]
- Zarowsky, Z.; Rashid, T. Resilience and Wellbeing Strategies for Pandemic Fatigue in Times of COVID-19. Int. J. Appl. Posit. Psychol. 2023, 8, 1–36. [Google Scholar] [CrossRef]
- Gavenčiak, T.; Monrad, J.T.; Leech, G.; Sharma, M.; Mindermann, S.; Bhatt, S.; Brauner, J.; Kulveit, J. Seasonal variation in SARS-CoV-2 transmission in temperate climates: A Bayesian modelling study in 143 European regions. PLoS Comput. Biol. 2022, 18, e1010435. [Google Scholar] [CrossRef]
- Cappi, R.; Casini, L.; Tosi, D.; Roccetti, M. Questioning the seasonality of SARS-CoV-2: A Fourier spectral analysis. BMJ Open 2022, 12, e061602. [Google Scholar] [CrossRef] [PubMed]
- Pascall, D.J.; Vink, E.; Blacow, R.; Bulteel, N.; Campbell, A.; Campbell, R.; Clifford, S.; Davis, C.; da Silva Filipe, A.; El Sakka, N.; et al. Directions of change in intrinsic case severity across successive SARS-CoV-2 variant waves have been inconsistent. J. Infect. 2023, 87, 128–135. [Google Scholar] [CrossRef]
- López-Andreo, M.J.; Vicente-Romero, M.R.; Bernal, E.; Navarro-González, I.; Salazar-Martínez, F.; Cánovas-Cánovas, V.; Gil-Ortuño, C.; Riquelme-Rocamora, M.G.; Solano, F.; Ibáñez-López, F.J.; et al. Whole Sequencing and Detailed Analysis of SARS-CoV-2 Genomes in Southeast Spain: Identification of Recurrent Mutations in the 20E (EU1) Variant with Some Clinical Implications. Diseases 2023, 11, 54. [Google Scholar] [CrossRef]
- Islam, M.R.; Shahriar, M.; Bhuiyan, M.A. The latest Omicron BA.4 and BA.5 lineages are frowning toward COVID-19 preventive measures: A threat to global public health. Heal. Sci. Rep. 2022, 5, e884. [Google Scholar] [CrossRef]
- Desingu, P.A.; Nagarajan, K. The emergence of Omicron lineages BA.4 and BA.5, and the global spreading trend. J. Med. Virol. 2022, 94, 5077–5079. [Google Scholar] [CrossRef] [PubMed]
- Cyprus Statistical Service Tourism–Predefined Tables. Available online: https://www.cystat.gov.cy/en/KeyFiguresList?s=51&fbclid=IwAR0mThPdhjg-Uj64Q2kAW7ibreEZgx1i4PftJZ_orJimRXU1AOKpbUXExB0 (accessed on 7 September 2023).
- Tabatabai, M.; Juarez, P.D.; Matthews-Juarez, P.; Wilus, D.M.; Ramesh, A.; Alcendor, D.J.; Tabatabai, N.; Singh, K.P. An Analysis of COVID-19 Mortality during the Dominancy of Alpha, Delta, and Omicron in the USA. J. Prim. Care Community Health 2023, 14, 21501319231170164. [Google Scholar] [CrossRef] [PubMed]
- Ward, I.L.; Bermingham, C.; Ayoubkhani, D.; Gethings, O.J.; Pouwels, K.B.; Yates, T.; Khunti, K.; Hippisley-Cox, J.; Banerjee, A.; Walker, A.S.; et al. Risk of covid-19 related deaths for SARS-CoV-2 omicron (B.1.1.529) compared with delta (B.1.617.2): Retrospective cohort study. Br. Med. J. 2022, 378, e070695. [Google Scholar] [CrossRef] [PubMed]
- Mohapatra, R.K.; Tiwari, R.; Sarangi, A.K.; Islam, M.R.; Chakraborty, C.; Dhama, K. Omicron (B.1.1.529) variant of SARS-CoV-2: Concerns, challenges, and recent updates. J. Med. Virol. 2022, 94, 2336–2342. [Google Scholar] [CrossRef] [PubMed]
- Stowe, J.; Andrews, N.; Kirsebom, F.; Ramsay, M.; Bernal, J.L. Effectiveness of COVID-19 vaccines against Omicron and Delta hospitalisation, a test negative case-control study. Nat. Commun. 2022, 13, 5736. [Google Scholar] [CrossRef] [PubMed]
- Chemaitelly, H.; Ayoub, H.H.; Coyle, P.; Tang, P.; Yassine, H.M.; Al-Khatib, H.A.; Smatti, M.K.; Hasan, M.R.; Al-Kanaani, Z.; Al-Kuwari, E.; et al. Protection of Omicron sub-lineage infection against reinfection with another Omicron sub-lineage. Nat. Commun. 2022, 13, 4675. [Google Scholar] [CrossRef]
- Memorial Sloan Kettering Cancer Center Library SARS-CoV-2: It’s All “Omicron”. Available online: https://libguides.mskcc.org/SARS2/Omicron (accessed on 11 August 2023).
- Christoph, J.; Dorota, K.; Lennart, K.; Fabian, Z.; Timo, J.; Sparrer, K.M.; Frank, K. Omicron: What Makes the Latest SARS-CoV-2 Variant of Concern So Concerning? J. Virol. 2022, 96, e02077-21. [Google Scholar] [CrossRef]
- Ke, H.; Chang, M.R.; Marasco, W.A. Immune Evasion of SARS-CoV-2 Omicron Subvariants. Vaccines 2022, 10, 1545. [Google Scholar] [CrossRef]
- Mohapatra, R.K.; Verma, S.; Kandi, V.; Sarangi, A.K.; Seidel, V.; Das, S.N.; Behera, A.; Tuli, H.S.; Sharma, A.K.; Dhama, K. The SARS-CoV-2 Omicron Variant and its Multiple Sub-lineages: Transmissibility, Vaccine Development, Antiviral Drugs, Monoclonal Antibodies, and Strategies for Infection Control–A Review. ChemistrySelect 2023, 8, e202201380. [Google Scholar] [CrossRef]
- Wang, Q.; Iketani, S.; Li, Z.; Liu, L.; Guo, Y.; Huang, Y.; Bowen, A.D.; Liu, M.; Wang, M.; Yu, J.; et al. Alarming antibody evasion properties of rising SARS-CoV-2 BQ and XBB subvariants. Cell 2023, 186, 279–286.e8. [Google Scholar] [CrossRef]
- Lenharo, M. WHO declares end to COVID-19′s emergency phase. Nature 2023, 882, 1038. [Google Scholar] [CrossRef] [PubMed]
- Gangavarapu, K.; Latif, A.A.; Mullen, J.L.; Alkuzweny, M.; Hufbauer, E.; Tsueng, G.; Haag, E.; Zeller, M.; Aceves, C.M.; Zaiets, K.; et al. Outbreak.info genomic reports: Scalable and dynamic surveillance of SARS-CoV-2 variants and mutations. Nat. Methods 2023, 20, 512–522. [Google Scholar] [CrossRef] [PubMed]


| Time Period | Oct–Dec 2021 | Jan–Mar 2022 | Apr–June 2022 | Jul–Oct 2022 | Total |
|---|---|---|---|---|---|
| Lineage | Νumber of Sequences per Lineage (%) | Νumber of Sequences per Lineage (%) | Νumber of Sequences per Lineage (%) | Νumber of Sequences per Lineage (%) | Νumber of Sequences per Lineage (%) |
| AY.3 | 2 (0.23) | - | - | - | 2 (0.04) |
| AY.4 | 103 (12.02) | 3 (0.14) | - | - | 106 (2.26) |
| AY.4.2 | 33 (3.85) | 5 (0.23) | - | - | 38 (0.81) |
| AY.4.2.1 | 3 (0.35) | - | - | - | 3 (0.06) |
| AY.4.2.5 | - | 1 (0.05) | - | - | 1 (0.02) |
| AY.4.5 | 4 (0.47) | - | - | - | 4 (0.09) |
| AY.4.6 | 1 (0.12) | - | - | - | 1 (0.02) |
| AY.5 | 3 (0.35) | - | - | - | 3 (0.06) |
| AY.6 | 2 (0.23) | - | - | - | 2 (0.04) |
| AY.7.2 | 19 (2.22) | 3 (0.14) | - | - | 22 (0.47) |
| AY.9.2 | 5 (0.58) | - | - | - | 5 (0.11) |
| AY.23 | 1 (0.12) | - | - | - | 1 (0.02) |
| AY.25 | 1 (0.12) | - | - | - | 1 (0.02) |
| AY.33 | 1 (0.12) | - | - | - | 1 (0.02) |
| AY.34 | 1 (0.12) | - | - | - | 1 (0.02) |
| AY.34.1 | 1 (0.12) | - | - | - | 1 (0.02) |
| AY.36 | 4 (0.47) | - | - | - | 4 (0.09) |
| AY.42 | 1 (0.12) | - | - | - | 1 (0.02) |
| AY.43 | 192 (22.4) | 5 (0.23) | - | - | 197 (4.19) |
| AY.43.8 | 1 (0.12) | - | - | - | 1 (0.02) |
| AY.46.5 | 2 (0.23) | - | - | - | 2 (0.04) |
| AY.46.6 | 4 (0.47) | - | - | - | 4 (0.09) |
| AY.60 | 2 (0.23) | - | - | - | 2 (0.04) |
| AY.98 | 32 (3.73) | - | - | - | 32 (0.68) |
| AY.98.1 | 11 (1.28) | - | - | - | 11 (0.23) |
| AY.103 | 4 (0.47) | - | - | - | 4 (0.09) |
| AY.106 | 1 (0.12) | - | - | - | 1 (0.02) |
| AY.107 | - | 1 (0.05) | - | - | 1 (0.02) |
| AY.109 | 1 (0.12) | - | - | - | 1 (0.02) |
| AY.111 | 1 (0.12) | - | - | - | 1 (0.02) |
| AY.114 | 1 (0.12) | - | - | - | 1 (0.02) |
| AY.116 | 1 (0.12) | - | - | - | 1 (0.02) |
| AY.119.2 | 1 (0.12) | - | - | - | 1 (0.02) |
| AY.120 | 2 (0.23) | - | - | - | 2 (0.04) |
| AY.120.2.1 | 1 (0.12) | - | - | - | 1 (0.02) |
| AY.121 | 35 (4.08) | 10 (0.47) | - | - | 45 (0.96) |
| AY.122 | 106 (12.37) | 9 (0.42) | - | - | 115 (2.45) |
| AY.124 | 3 (0.35) | - | - | - | 3 (0.06) |
| AY.124.1 | 1 (0.12) | - | - | - | 1 (0.02) |
| AY.125 | 3 (0.35) | - | - | - | 3 (0.06) |
| AY.126 | 17 (1.98) | 1 (0.05) | - | - | 18 (0.38) |
| AY.127 | 33 (3.85) | 11 (0.52) | - | - | 44 (0.94) |
| AY.127.2 | 1 (0.12) | - | - | - | 1 (0.02) |
| AY.128 | 2 (0.23) | - | - | - | 2 (0.04) |
| AY.129 | 1 (0.12) | - | - | - | 1 (0.02) |
| B.1.617.2 | 43 (5.02) | 4 (0.19) | - | - | 47 (1) |
| BA.1 | 62 (7.23) | 272 (12.76) | 3 (0.31) | - | 337 (7.17) |
| BA.1.1 | 23 (2.68) | 492 (23.09) | 14 (1.45) | - | 529 (11.26) |
| BA.1.1.1 | - | 71 (3.33) | - | - | 71 (1.51) |
| BA.1.1.11 | 1 (0.12) | 1 (0.05) | - | - | 2 (0.04) |
| BA.1.1.14 | - | - | 1 (0.10) | - | 1 (0.02) |
| BA.1.1.15 | 7 (0.82) | 150 (7.04) | - | - | 157 (3.34) |
| BA.1.1.18 | - | 2 (0.09) | - | - | 2 (0.04) |
| BA.1.7 | - | 1 (0.05) | - | - | 1 (0.02) |
| BA.1.8 | - | 1 (0.05) | - | - | 1 (0.02) |
| BA.1.10 | 1 (0.12) | - | - | - | 1 (0.02) |
| BA.1.13 | - | 1 (0.05) | 1 (0.10) | - | 2 (0.04) |
| BA.1.15 | 9 (1.05) | 16 (0.75) | - | - | 25 (0.53) |
| BA.1.15.1 | 8 (0.93) | 6 (0.28) | - | - | 14 (0.3) |
| BA.1.16 | 2 (0.23) | 14 (0.66) | - | - | 16 (0.34) |
| BA.1.17 | 14 (1.63) | 84 (3.94) | 1 (0.10) | - | 99 (2.11) |
| BA.1.17.2 | 39 (4.55) | 155 (7.27) | - | - | 194 (4.13) |
| BA.1.18 | 2 (0.23) | 12 (0.56) | - | - | 14 (0.3) |
| BA.1.19 | 1 (0.12) | 1 (0.05) | - | - | 2 (0.04) |
| BA.1.20 | - | 2 (0.09) | - | - | 2 (0.04) |
| BA.1.21 | - | 1 (0.05) | - | - | 1 (0.02) |
| BA.2 | 1 (0.12) | 660 (30.97) | 522 (53.98) | 2 (0.27) | 1185 (25.21) |
| BA.2.1 | - | 1 (0.05) | 8 (0.83) | - | 9 (0.19) |
| BA.2.2 | - | - | 1 (0.10) | - | 1 (0.02) |
| BA.2.3 | - | 23 (1.08) | 26 (2.69) | - | 49 (1.04) |
| BA.2.3.15 | - | - | 1 (0.10) | - | 1 (0.02) |
| BA.2.3.20 | - | - | - | 6 (0.81) | 6 (0.13) |
| BA.2.5 | - | 1 (0.05) | 4 (0.41) | - | 5 (0.11) |
| BA.2.9 | - | 68 (3.19) | 60 (6.2) | - | 128 (2.72) |
| BA.2.9.3 | - | - | 1 (0.10) | 1 (0.13) | 2 (0.04) |
| BA.2.9.5 | - | 2 (0.09) | - | - | 2 (0.04) |
| BA.2.10 | - | 5 (0.23) | 3 (0.31) | - | 8 (0.17) |
| BA.2.10.3 | - | - | 1 (0.10) | - | 1 (0.02) |
| BA.2.12.1 | - | - | 43 (4.45) | 4 (0.54) | 47 (1) |
| BA.2.18 | - | 1 (0.05) | 2 (0.21) | - | 3 (0.06) |
| BA.2.19 | - | - | 2 (0.21) | - | 2 (0.04) |
| BA.2.23 | - | - | 1 (0.10) | - | 1 (0.02) |
| BA.2.23.1 | - | - | 1 (0.10) | - | 1 (0.02) |
| BA.2.31 | - | - | 1 (0.10) | - | 1 (0.02) |
| BA.2.36 | - | - | 3 (0.31) | - | 3 (0.06) |
| BA.2.37 | - | 32 (1.5) | 13 (1.34) | - | 45 (0.96) |
| BA.2.38 | - | - | - | 2 (0.27) | 2 (0.04) |
| BA.2.39 | - | 1 (0.05) | - | - | 1 (0.02) |
| BA.2.41 | - | - | 1 (0.10) | - | 1 (0.02) |
| BA.2.56 | - | - | 1 (0.10) | - | 1 (0.02) |
| BA.2.63 | - | 1 (0.05) | 2 (0.21) | - | 3 (0.06) |
| BA.2.65 | - | 1 (0.05) | 5 (0.52) | - | 6 (0.13) |
| BA.2.68 | - | - | 1 (0.10) | - | 1 (0.02) |
| BA.2.71 | - | - | 4 (0.41) | - | 4 (0.09) |
| BA.2.72 | - | - | 1 (0.10) | - | 1 (0.02) |
| BN.1.3 | - | - | - | 1 (0.13) | 1 (0.02) |
| BA.2.78 | - | - | 1 (0.10) | - | 1 (0.02) |
| XBB.1 | - | - | - | 2 (0.27) | 2 (0.04) |
| XBB.2 | - | - | - | 1 (0.13) | 1 (0.02) |
| XL | - | - | 1 (0.10) | - | 1 (0.02) |
| XAL | - | - | 3 (0.31) | - | 3 (0.06) |
| BA.4 | - | - | 24 (2.48) | 24 (3.22) | 48 (1.02) |
| BA.4.1 | - | - | 11 (1.14) | 11 (1.48) | 22 (0.47) |
| BA.4.1.1 | - | - | 1 (0.10) | - | 1 (0.02) |
| BA.4.1.5 | - | - | - | 1 (0.13) | 1 (0.02) |
| BA.4.4 | - | - | 2 (0.21) | 1 (0.13) | 3 (0.06) |
| BA.4.6 | - | - | - | 2 (0.27) | 2 (0.04) |
| BA.4.7 | - | - | - | 1 (0.13) | 1 (0.02) |
| BA.5 | - | - | 1 (0.10) | 5 (0.67) | 6 (0.13) |
| BA.5.1 | - | - | 88 (9.1) | 170 (22.82) | 258 (5.49) |
| BA.5.1.1 | - | - | 1 (0.10) | - | 1 (0.02) |
| BA.5.1.2 | - | - | 4 (0.41) | 4 (0.54) | 8 (0.17) |
| BA.5.1.3 | - | - | 3 (0.31) | 10 (1.34) | 13 (0.28) |
| BA.5.1.5 | - | - | - | 3 (0.40) | 3 (0.06) |
| BA.5.1.10 | - | - | - | 2 (0.27) | 2 (0.04) |
| BK.1 | - | - | - | 1 (0.13) | 1 (0.02) |
| BA.5.1.12 | - | - | - | 3 (0.40) | 3 (0.06) |
| BA.5.1.17 | - | - | - | 1 (0.13) | 1 (0.02) |
| BA.5.1.22 | - | - | - | 2 (0.27) | 2 (0.04) |
| BA.5.1.23 | - | - | - | 2 (0.27) | 2 (0.04) |
| BA.5.2 | - | - | 40 (4.14) | 183 (24.56) | 223 (4.74) |
| BA.5.2.1 | - | - | 32 (3.31) | 107 (14.36) | 139 (2.96) |
| BF.1 | - | - | 6 (0.62) | 5 (0.67) | 11 (0.23) |
| BF.2 | - | - | - | 1 (0.13) | 1 (0.02) |
| BF.4 | - | - | - | 3 (0.40) | 3 (0.06) |
| BF.5 | - | - | 2 (0.21) | 23 (3.09) | 25 (0.53) |
| BF.7 | - | - | - | 15 (2.01) | 15 (0.32) |
| BF.7.1 | - | - | - | 2 (0.27) | 2 (0.04) |
| BF.7.4.2 | - | - | - | 1 (0.13) | 1 (0.02) |
| BF.7.5 | - | - | - | 1 (0.13) | 1 (0.02) |
| BF.7.5.1 | - | - | - | 1 (0.13) | 1 (0.02) |
| BF.7.8 | - | - | - | 1 (0.13) | 1 (0.02) |
| BF.10 | - | - | - | 5 (0.67) | 5 (0.11) |
| BF.11 | - | - | - | 11 (1.48) | 11 (0.23) |
| BF.11.2 | - | - | - | 1 (0.13) | 1 (0.02) |
| BF.14 | - | - | - | 1 (0.13) | 1 (0.02) |
| BF.19 | - | - | - | 1 (0.13) | 1 (0.02) |
| BA.5.2.2 | - | - | - | 1 (0.13) | 1 (0.02) |
| BA.5.2.3 | - | - | 1 (0.10) | 4 (0.54) | 5 (0.11) |
| BA.5.2.13 | - | - | - | 1 (0.13) | 1 (0.02) |
| BA.5.2.14 | - | - | - | 1 (0.13) | 1 (0.02) |
| BA.5.2.18 | - | - | - | 1 (0.13) | 1 (0.02) |
| BA.5.2.20 | - | - | - | 12 (1.61) | 12 (0.26) |
| BA.5.2.22 | - | - | - | 1 (0.13) | 1 (0.02) |
| CK.2 | - | - | - | 1 (0.13) | 1 (0.02) |
| BA.5.2.26 | - | - | - | 1 (0.13) | 1 (0.02) |
| BA.5.2.33 | - | - | - | 2 (0.27) | 2 (0.04) |
| BA.5.2.35 | - | - | - | 1 (0.13) | 1 (0.02) |
| BA.5.3 | - | - | 1 (0.10) | - | 1 (0.02) |
| BA.5.3.1 | - | - | - | 1 (0.13) | 1 (0.02) |
| BE.1 | - | - | 9 (0.93) | 21 (2.82) | 30 (0.64) |
| BE.1.1 | - | - | 1 (0.10) | 27 (3.62) | 28 (0.6) |
| BE.1.1.1 | - | - | - | 4 (0.54) | 4 (0.09) |
| BQ.1 | - | - | - | 2 (0.27) | 2 (0.04) |
| BQ.1.1 | - | - | - | 7 (0.94) | 7 (0.15) |
| BQ.1.1.1 | - | - | - | 1 (0.13) | 1 (0.02) |
| BQ.1.1.11 | - | - | - | 2 (0.27) | 2 (0.04) |
| BQ.1.3 | - | - | - | 1 (0.13) | 1 (0.02) |
| BQ.1.5 | - | - | - | 2 (0.27) | 2 (0.04) |
| BQ.1.8 | - | - | - | 1 (0.13) | 1 (0.02) |
| BA.5.3.2 | - | - | 1 (0.10) | - | 1 (0.02) |
| BA.5.3.3 | - | - | 1 (0.10) | 6 (0.81) | 7 (0.15) |
| BA.5.3.4 | - | - | - | 1 (0.13) | 1 (0.02) |
| BA.5.5 | - | - | 2 (0.21) | 4 (0.54) | 6 (0.13) |
| BA.5.6 | - | - | 2 (0.21) | 3 (0.40) | 5 (0.11) |
| BA.5.8 | - | - | 1 (0.10) | 1 (0.13) | 2 (0.04) |
| BA.5.9 | - | - | - | 11 (1.48) | 11 (0.23) |
| Total | 857 | 2131 | 967 | 745 | 4700 |
| Variant/Lineage a | From b | To c | Average d | Lower e | Upper f |
|---|---|---|---|---|---|
| Omicron 1 (BA.1, BA.1.1) | All g | Cyprus | 139.06 | 127 | 150 |
| USA | Cyprus | 84.96 | 74 | 99 | |
| UnitedKingdom | Cyprus | 35.56 | 23 | 47 | |
| SouthKorea | Cyprus | 7.17 | 3 | 11 | |
| SouthernEurope | Cyprus | 5.24 | 2 | 9 | |
| SouthEasternAsia | Cyprus | 2.68 | 0 | 6 | |
| NorthernEurope | Cyprus | 1.47 | 0 | 9 | |
| France | Cyprus | 1.11 | 0 | 5 | |
| Germany | Cyprus | 0.87 | 0 | 5 | |
| Cyprus | All | 21.62 | 8 | 34 | |
| Cyprus | WesternAsia | 6.52 | 2 | 10 | |
| Cyprus | UnitedKingdom | 6.32 | 0 | 18 | |
| Cyprus | Brazil | 5.41 | 0 | 12 | |
| Cyprus | Oceania | 1.79 | 0 | 8 | |
| Cyprus | USA | 1.60 | 0 | 9 | |
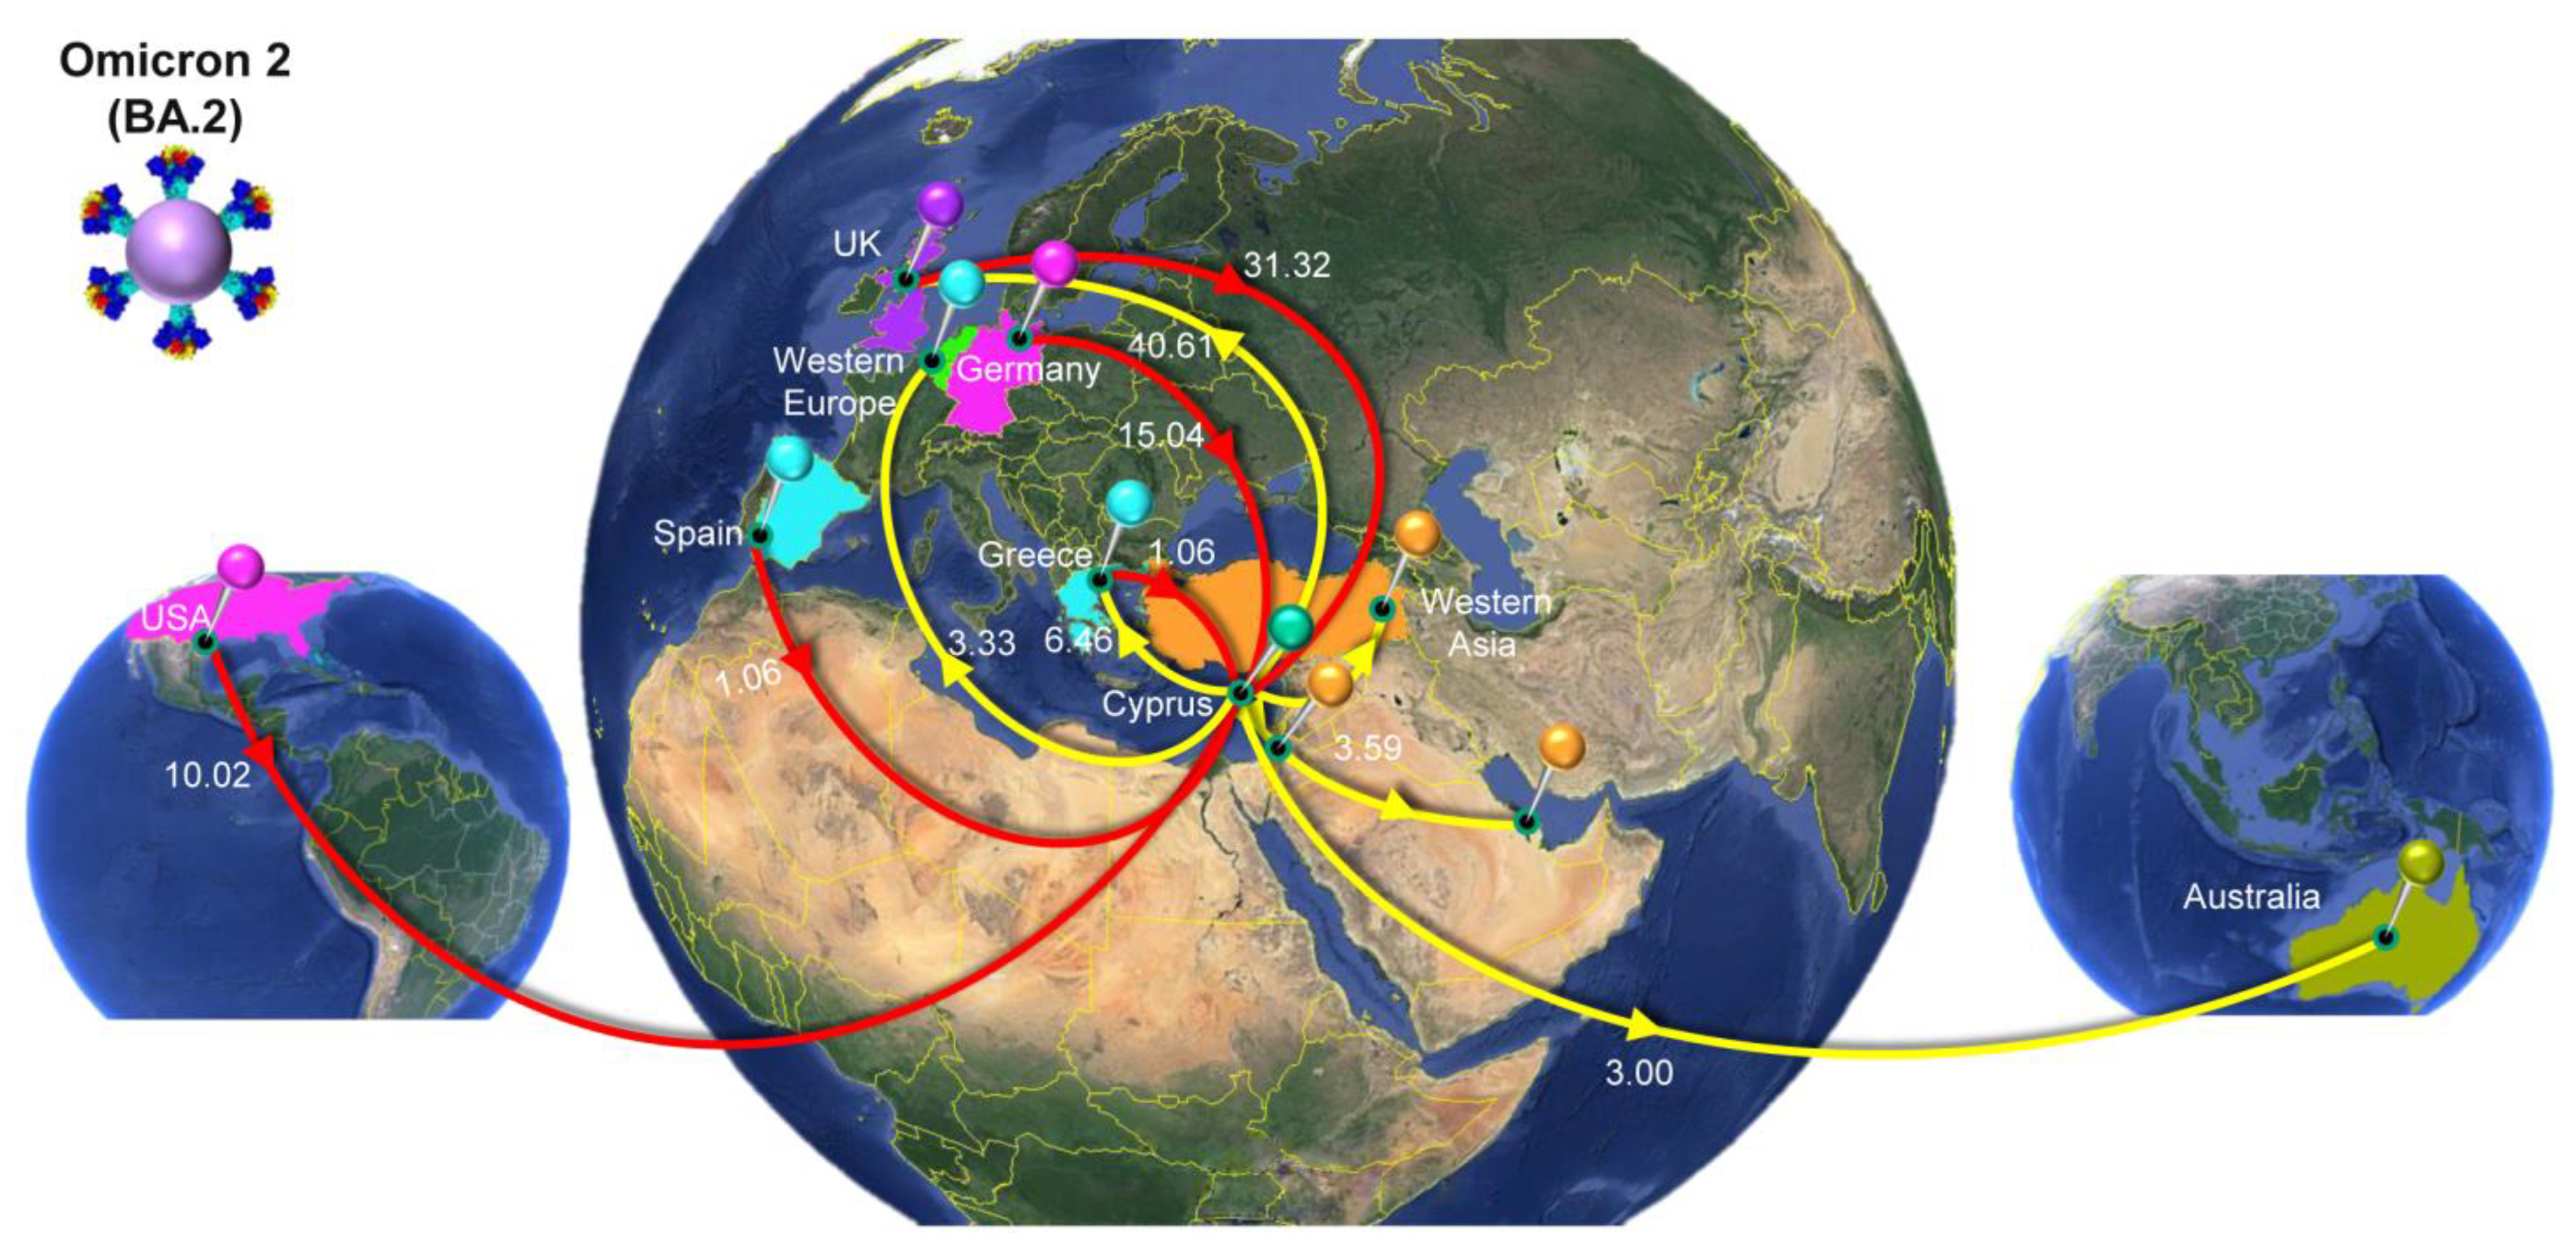
| Omicron 2 (BA.2) | All | Cyprus | 59.95 | 50 | 69 |
| UnitedKingdom | Cyprus | 31.32 | 20 | 42 | |
| Germany | Cyprus | 15.04 | 8 | 22 | |
| USA | Cyprus | 10.02 | 3 | 17 | |
| Greece | Cyprus | 1.06 | 0 | 4 | |
| Spain | Cyprus | 1.06 | 0 | 2 | |
| Australia | Cyprus | 0.98 | 0 | 4 | |
| EasternEurope | Cyprus | 0.46 | 0 | 2 | |
| Cyprus | All | 61.55 | 52 | 71 | |
| Cyprus | UnitedKingdom | 40.61 | 30 | 50 | |
| Cyprus | Greece | 6.46 | 4 | 9 | |
| Cyprus | WesternAsia | 3.59 | 1 | 6 | |
| Cyprus | WesternEurope | 3.33 | 1 | 6 | |
| Cyprus | Australia | 3.00 | 0 | 8 | |
| Cyprus | Oceania | 1.82 | 0 | 3 | |
| Cyprus | USA | 1.42 | 0 | 8 | |
| Cyprus | Mauritius | 1.32 | 0 | 2 | |
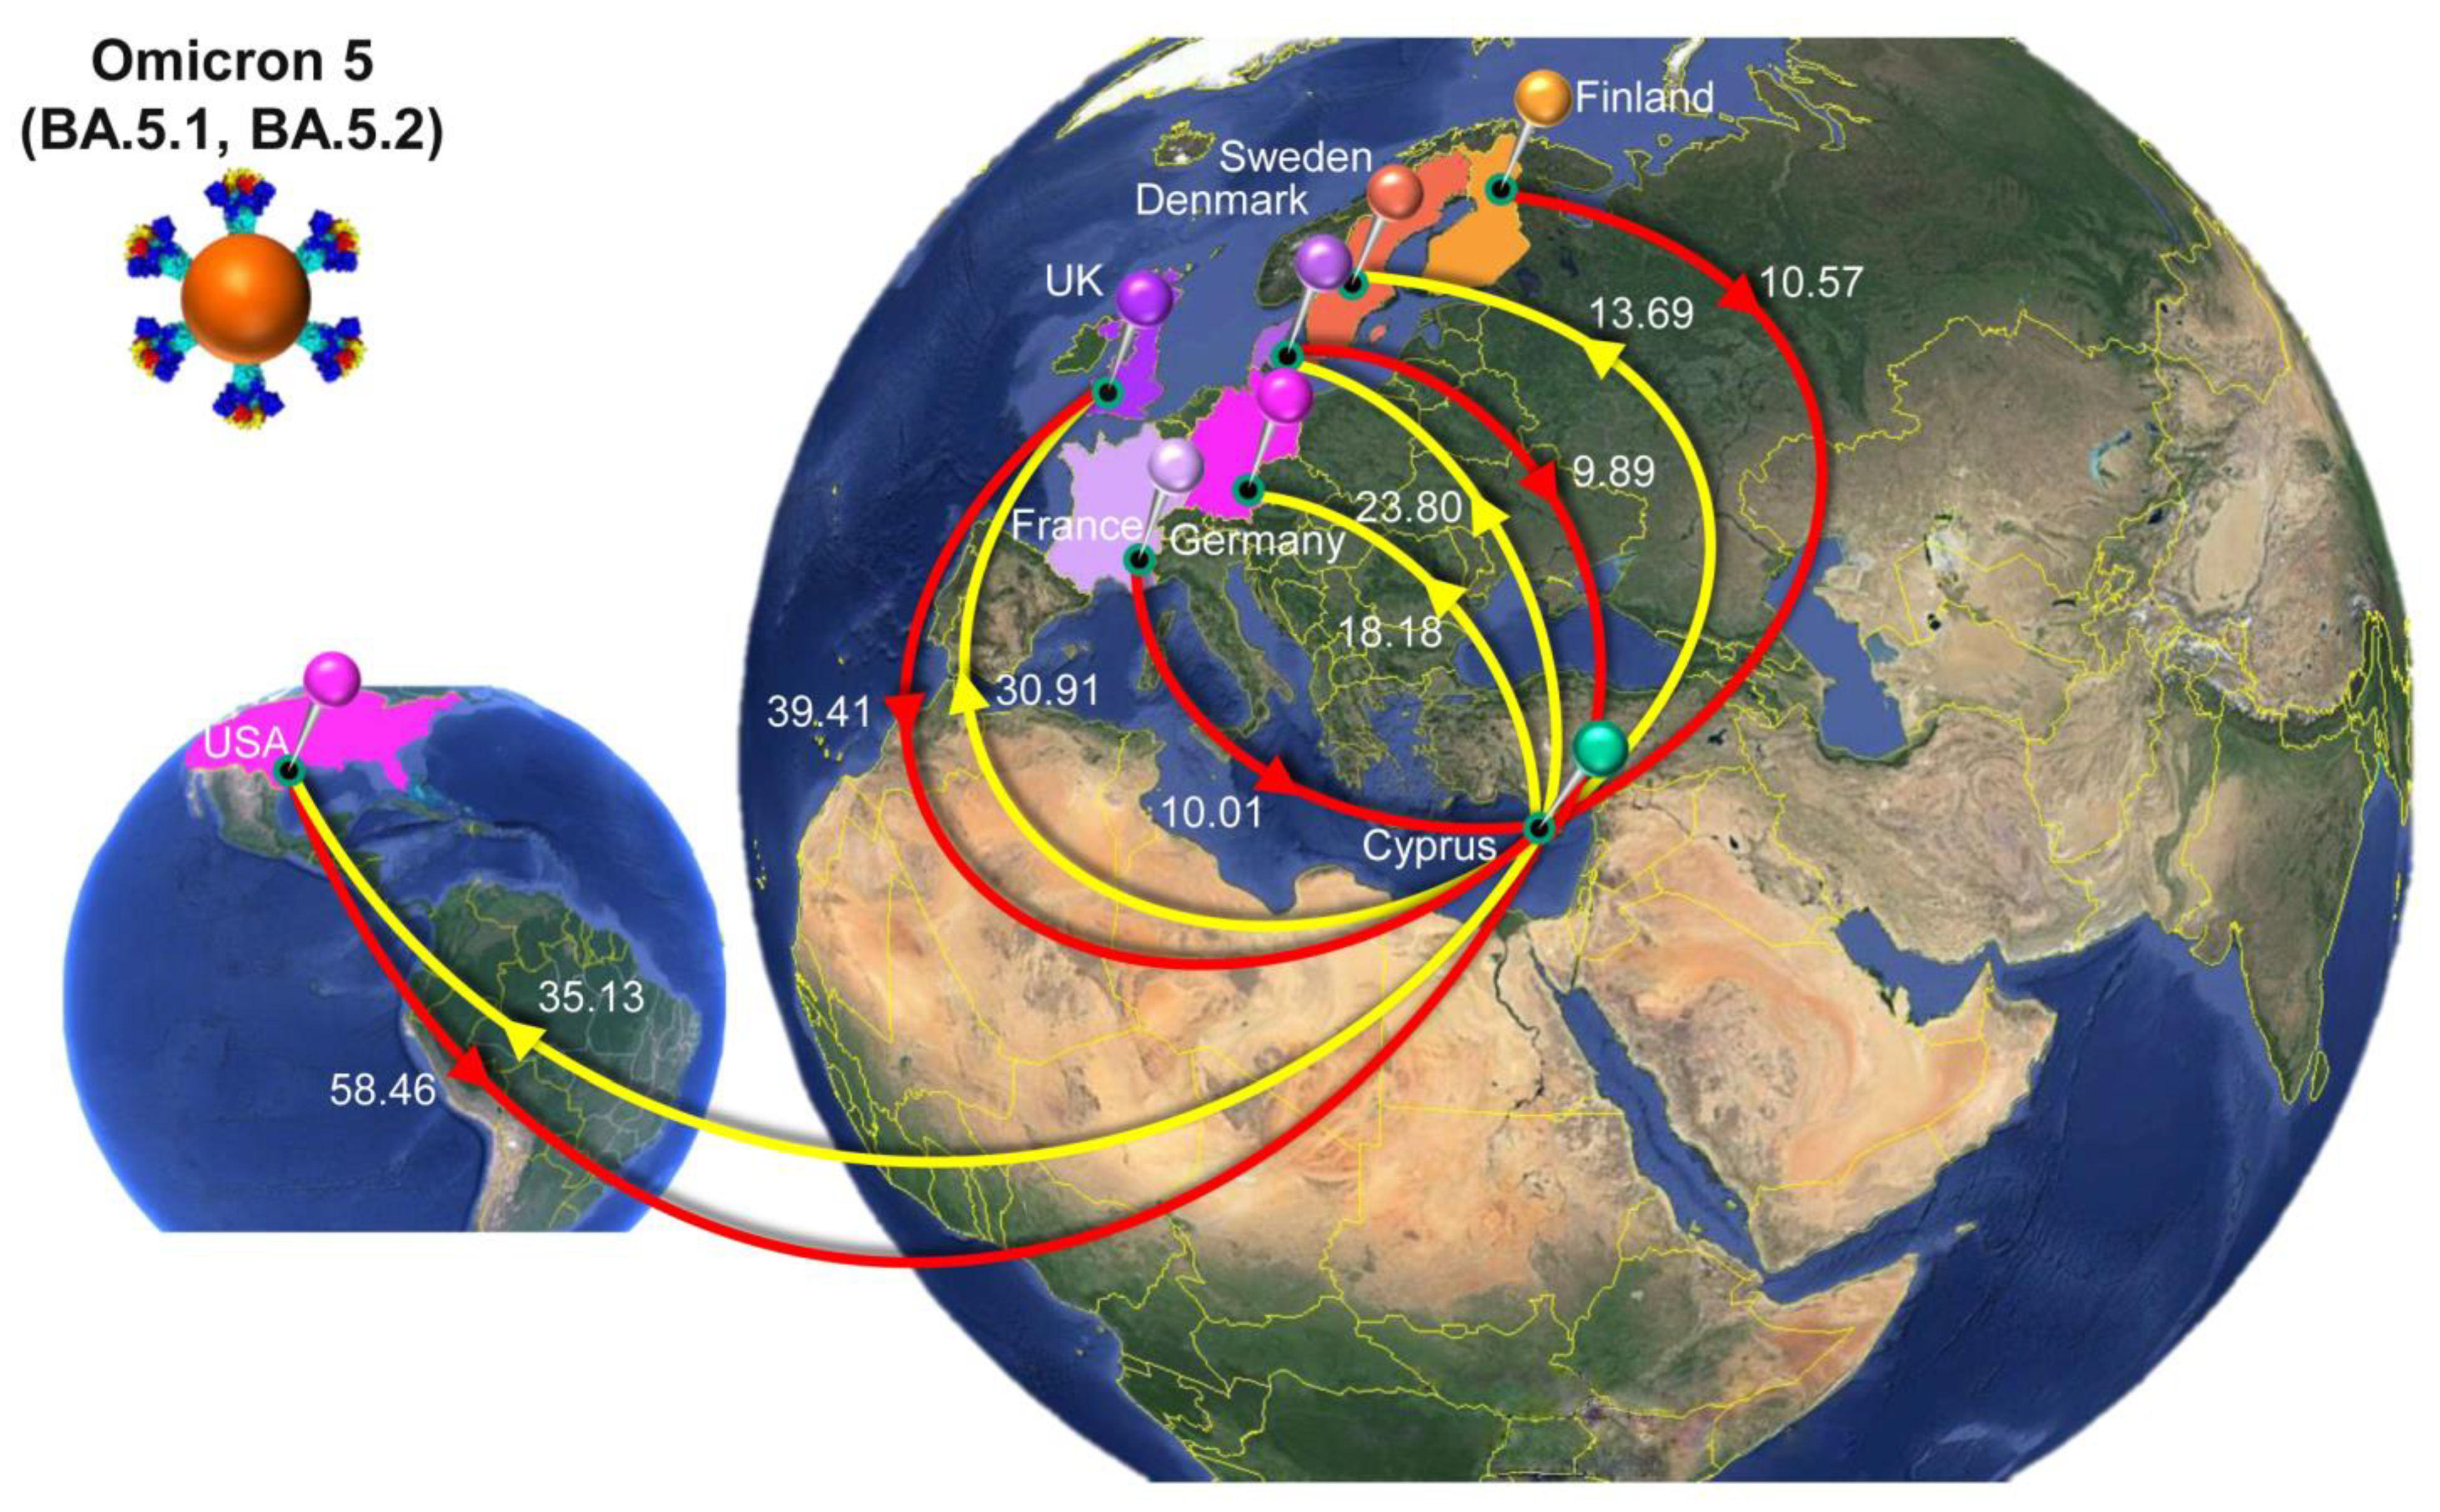
| Omicron 5 (BA.5.1, BA.5.2) | All | Cyprus | 165.84 | 146 | 194 |
| USA | Cyprus | 58.46 | 37 | 79 | |
| UnitedKingdom | Cyprus | 39.41 | 22 | 55 | |
| Finland | Cyprus | 10.57 | 5 | 20 | |
| France | Cyprus | 10.01 | 0 | 19 | |
| Denmark | Cyprus | 9.89 | 3 | 23 | |
| Spain | Cyprus | 8.51 | 0 | 30 | |
| Japan | Cyprus | 7.96 | 3 | 12 | |
| Germany | Cyprus | 7.13 | 0 | 13 | |
| Italy | Cyprus | 5.53 | 0 | 10 | |
| WesternAsia | Cyprus | 2.75 | 0 | 7 | |
| Israel | Cyprus | 2.65 | 0 | 10 | |
| Slovenia | Cyprus | 1.29 | 0 | 3 | |
| Australia | Cyprus | 1.02 | 0 | 3 | |
| EasternEurope | Cyprus | 0.47 | 0 | 3 | |
| WesternEurope | Cyprus | 0.19 | 0 | 1 | |
| Cyprus | All | 151.99 | 127 | 186 | |
| Cyprus | USA | 35.13 | 18 | 52 | |
| Cyprus | UnitedKingdom | 30.91 | 18 | 44 | |
| Cyprus | Denmark | 23.80 | 15 | 32 | |
| Cyprus | Germany | 18.18 | 10 | 25 | |
| Cyprus | Sweden | 13.69 | 8 | 19 | |
| Cyprus | Italy | 8.29 | 0 | 14 | |
| Cyprus | Greece | 7.90 | 5 | 10 | |
| Cyprus | WesternEurope | 4.70 | 0 | 12 | |
| Cyprus | Slovakia | 2.39 | 0 | 8 | |
| Cyprus | Curacao | 1.80 | 0 | 2 | |
| Cyprus | Russia | 1.41 | 0 | 8 | |
| Cyprus | EasternEurope | 1.23 | 0 | 10 | |
| Cyprus | Israel | 1.02 | 0 | 8 | |
| Cyprus | Slovenia | 0.91 | 0 | 8 | |
| Cyprus | SouthernEurope | 0.63 | 0 | 4 |
Disclaimer/Publisher’s Note: The statements, opinions and data contained in all publications are solely those of the individual author(s) and contributor(s) and not of MDPI and/or the editor(s). MDPI and/or the editor(s) disclaim responsibility for any injury to people or property resulting from any ideas, methods, instructions or products referred to in the content. |
© 2023 by the authors. Licensee MDPI, Basel, Switzerland. This article is an open access article distributed under the terms and conditions of the Creative Commons Attribution (CC BY) license (https://creativecommons.org/licenses/by/4.0/).
Share and Cite
Chrysostomou, A.C.; Vrancken, B.; Haralambous, C.; Alexandrou, M.; Gregoriou, I.; Ioannides, M.; Ioannou, C.; Kalakouta, O.; Karagiannis, C.; Marcou, M.; et al. Unraveling the Dynamics of Omicron (BA.1, BA.2, and BA.5) Waves and Emergence of the Deltacron Variant: Genomic Epidemiology of the SARS-CoV-2 Epidemic in Cyprus (Oct 2021–Oct 2022). Viruses 2023, 15, 1933. https://doi.org/10.3390/v15091933
Chrysostomou AC, Vrancken B, Haralambous C, Alexandrou M, Gregoriou I, Ioannides M, Ioannou C, Kalakouta O, Karagiannis C, Marcou M, et al. Unraveling the Dynamics of Omicron (BA.1, BA.2, and BA.5) Waves and Emergence of the Deltacron Variant: Genomic Epidemiology of the SARS-CoV-2 Epidemic in Cyprus (Oct 2021–Oct 2022). Viruses. 2023; 15(9):1933. https://doi.org/10.3390/v15091933
Chicago/Turabian StyleChrysostomou, Andreas C., Bram Vrancken, Christos Haralambous, Maria Alexandrou, Ioanna Gregoriou, Marios Ioannides, Costakis Ioannou, Olga Kalakouta, Christos Karagiannis, Markella Marcou, and et al. 2023. "Unraveling the Dynamics of Omicron (BA.1, BA.2, and BA.5) Waves and Emergence of the Deltacron Variant: Genomic Epidemiology of the SARS-CoV-2 Epidemic in Cyprus (Oct 2021–Oct 2022)" Viruses 15, no. 9: 1933. https://doi.org/10.3390/v15091933
APA StyleChrysostomou, A. C., Vrancken, B., Haralambous, C., Alexandrou, M., Gregoriou, I., Ioannides, M., Ioannou, C., Kalakouta, O., Karagiannis, C., Marcou, M., Masia, C., Mendris, M., Papastergiou, P., Patsalis, P. C., Pieridou, D., Shammas, C., Stylianou, D. C., Zinieri, B., Lemey, P., ... Kostrikis, L. G. (2023). Unraveling the Dynamics of Omicron (BA.1, BA.2, and BA.5) Waves and Emergence of the Deltacron Variant: Genomic Epidemiology of the SARS-CoV-2 Epidemic in Cyprus (Oct 2021–Oct 2022). Viruses, 15(9), 1933. https://doi.org/10.3390/v15091933