Abstract
Decades of studies in antiretroviral therapy (ART) have passed, and the mechanisms that determine impaired immunological recovery in HIV-positive patients receiving ART have not been completely elucidated yet. Thus, T-lymphocytes immunophenotyping and cytokines levels were analyzed in 44 ART-treated HIV-positive patients who had a prolonged undetectable plasma viral load. The patients were classified as immunological non-responders (INR = 13) and immunological responders (IR = 31), according to their CD4+ T cell levels. Evaluating pre-CD4+ levels, we observed a statistically significant trend between lower CD4+ T cell levels and INR status (Z = 3.486, p < 0.001), and during 18 months of ART, the CD4+ T cell levels maintained statistical differences between the INR and IR groups (WTS = 37.252, p < 0.001). Furthermore, the INRs were associated with an elevated age at ART start; a lower pre-treatment CD4+ T cell count and a percentage that remained low even after 18 months of ART; lower levels of recent thymic emigrant (RTE) CD4+ T cell (CD45RA + CD31+) and a naïve CD4+ T cell (CD45RA + CD62L+); higher levels of central memory CD4+ T cells (CD45RA-CD62L+); and higher immune activation by CD4+ expressing HLA-DR+ or both (HLA-DR+ and CD38+) when compared with IRs. Our study demonstrates that thymic exhaustion and increased immune activation are two mechanisms substantially implicated in the impaired immune recovery of ART-treated HIV patients.
1. Introduction
Currently, more than 38 million people are living with HIV-1 (human immunodeficiency type 1) around the world [1]. Over the past four decades, since the beginning of the pandemic, many advances have been made, especially regarding antiretroviral therapy (ART), whose regimens are based on many different available antiretrovirals [2,3]. ART aims to reduce plasma viral load to undetectable levels (<40 RNA copies/mL), making HIV-positive individuals less susceptible to developing opportunistic infections and neoplasms, and decreasing the number of AIDS-related deaths. Presently, more than 28 million people with HIV use ART [4,5].
It is expected that, with the course of treatment, the loss of CD4+ T cell levels during HIV infection may be gradually recovered. However, 15–30% of ART-treated patients, despite complete viral suppression, fail to recover immunologically [6]. These patients are defined as virological responders but immunological non-responders (INR), and they are more susceptible to HIV-related complications and an increased risk of death [7,8,9].
Although there are no clear and well-established mechanisms, impaired immunological recovery has been described as a multifactorial condition, and factors such as advanced age, male sex, low pre-treatment CD4+ T cell count, residual viral replication, genetic factors, and coinfections during ART may influence CD4+ T cell restoration [10,11,12,13]. Moreover, some studies have demonstrated that dysregulation of T lymphocyte homeostasis is a determining aspect of immune reconstitution in ART-treated patients. It is regulated by a dynamic balance between CD4+ T cell production, destruction, and trafficking to and from lymphoid organs and peripheral circulation [6,7].
Two main processes have been associated with the imbalance in T cell homeostasis and, consequently, with the impaired immunological recovery: the decrease in thymic production of T lymphocytes and the excessive destruction of these cells [8,14]. Thymic function can be evaluated, among others, by the output of RTE (recent thymic emigrants) and naïve CD4+ T cells [15,16,17]. The reduction of these cells has been reported as a contributing factor to ineffective immune recovery [18,19,20]. In addition, cytokine production, which normally results from cell death, has been investigated to increase immune activation, another important mechanism involved in poor immune reconstitution. This process can generate the trigger of a vicious cycle of cell death and reduce CD4+ T cell count [21,22,23].
Studies that aim to provide more data regarding immunological recovery deficiency are essential to better understand this condition due to its complexity in an HIV infection context. Thus, the present study used immunophenotypic tools to investigate different aspects of thymic function, immune activation, T lymphocytes, and cytokine profiles, seeking to clarify the impaired immunological recovery in ART-treated HIV-positive patients.
2. Materials and Methods
2.1. Study Population
This study consisted of 44 HIV-positive patients (33 males and 11 females) under ART recruited from the Instituto de Medicina Integral Professor Fernando Figueira (IMIP), Pernambuco state (Northeast Brazil), between 2018 and 2020. The general inclusion criteria were age over 18 years old, undergoing ART for at least 18 months with a prolonged undetectable viral load (<40 copies/mL), and good adherence to treatment. The exclusion criteria were pregnancy, autoimmune diseases, cancer, and a history of injecting drug use. Sociodemographic and clinical data were collected from medical records: age at the ART start date, time until ART start after HIV diagnosis, ART regimens, pre- and during-treatment viral loads as well as CD4+ and CD8+ T cell counts and percentages, and serological data regarding co-infections (hepatitis B virus—HBV, hepatitis C virus—HCV, syphilis, cytomegalovirus—CMV, toxoplasmosis, herpes simplex virus types 1 and 2—HSV-1/2, and human T cell lymphotropic virus types I and II—HTLV-I/II). All patients answered standard questionnaires and signed written informed consent forms, providing blood samples for immunological analyses.
2.2. Immunological Classification
These 44 HIV-positive ART-treated patients, who had undetectable plasma viral loads (<40 copies/mL) during the first 18 months of ART and maintained them at all clinical appointments, were classified according to CD4+ T cell count recovery. The classification is based on a late or early ART start after HIV diagnosis, defined by the 500 CD4+ T lymphocytes (cells/μL) threshold. Therefore, patients who start ART with a CD4+ T cell count ≥500 cells/μL or achieve a CD4+ T cell count above that threshold after 18 months of ART are classified as immunological responders (IR). The other patients, who started ART with a CD4+ T cell count <500 cells/μL, and even after 18 months of ART maintained the CD4+ T cell levels below that threshold, were classified as INR [6]. Thus, 13 ART-treated patients (11 males and 2 females) were classified as INR, and the remaining 31 patients (22 males and 9 females) were defined as IR.
2.3. Plasma and PBMC Isolation
A total of 4 mL of blood was collected from all ART-treated patients in EDTA tubes. Plasma was separated in cryovials with a protease inhibitor and stored at −80 °C until the cytokine measurement. Peripheral blood mononuclear cells (PBMC) were separated by Ficoll-Paque Plus density gradient centrifugation and washed twice with PBS 1x followed by resuspension in FACS buffer (3% BSA, 0.01% NaN3—sodium azide, PBS 1×). Cell viability (>95% on average) was determined by the Trypan blue (0.4%) exclusion test.
2.4. Immunophenotyping
Combinations of different fluorescent monoclonal antibodies were used to stain PBMCs for 20 min at room temperature, protected from light. Then, PBMCs were washed with FACS buffer, fixed with PBS-formaldehyde 1%, and analyzed by flow cytometry using a FACSAria III cytometer (BD Biosciences). For each sample, 100,000 events were acquired and gated (Supplementary Figure S1) to detect the following T lymphocyte subsets as follows: activated CD4+ T cells (CD4+ CD38+ HLA-DR+); activated CD8+ T cells (CD8+ CD38+ HLA-DR+); RTE CD4+ T cells (CD4+ CD45RA+ CD31+); naïve CD4+ T cells (CD4+ CD45RA+ CD62L+); central memory CD4+ T cells (CD4+ CD45RA- CD62L+); effector memory CD4+ T cells (CD4+ CD45RA- CD62L-); and effector CD4+ T cells (CD4+ CD45RA+ CD62L-). Immunofluorescent monoclonal antibodies APC-CD4 (EDU-2), BB515-CD4 (RPA-T4), PE-CD31 (WM59), PercpCy5.5-CD45RA (HI100), APC-CD62L (DREG-56), PECy7-CD8 (RPA-T8), PE-CD38 (HIT2), and FITC-HLA-DR (G46-6) were obtained from BD Biosciences and BioAlbra. The acquired data were analyzed using the FlowJo software, version 10.
2.5. Cytokines Measurement
Plasma IL-2, IL-6, IL-10, and TNF-α protein levels were measured by the Cytometric Bead Array (CBA) Human Th1/Th2 Cytokine Kit II and the manufacturer’s instructions (BD Biosciences) were followed by using an Accuri C6 cytometer (BD Biosciences). CBA data were analyzed using the FCAP Array software.
2.6. Statistical Analyses
Categorical (sociodemographic and clinical) variables were evaluated by Fisher’s exact test for association with INR status. The Shapiro–Wilk test was used to check the normal distribution. Therefore, variables that followed a normal distribution were compared among groups by Student’s t-test for independence and displayed as mean ± SD. The Mann–Whitney test was used to compare the groups for variables that did not follow a normal distribution, which displayed values as the median and interquartile range (IQR). The Cochran-Armitage test was performed to assess the trend in HIV-infected patients’ distribution between the INR and IR groups according to their pre-treatment CD4+ T cell count. To analyze CD4+ T cell count over ART time between the groups, the Wald-type test was used, and then a Wilcoxon signed-rank test adjusted by Bonferroni was performed for post hoc pairwise comparisons. The statistical significance level (α) was set at 0.05 for all tests. All statistical analyses were carried out using the R program (version 4.2.0) and GraphPad Prism (version 8.0.1).
3. Results
3.1. Clinical Data Analyses
We observed that age at ART start showed a significant difference between the two groups (p = 0.041), with means of 41.8 ± 3.0 years old for the INR group and 33.7 ± 2.1 for the IR group. We also analyzed sex, body mass, pre-treatment PVL (plasma viral load), time to start ART post-diagnosis, ART regimens, and their changes. However, there were no statistical differences among the groups for all these variables (Table 1).

Table 1.
Clinical characteristics of HIV-positive patients according to their immunological response during ART.
Regarding pre-treatment CD4+ T cell count, there was a statistically significant difference between the two groups. INR group showed a pre-treatment CD4+ T cell count average of 153.9 cells/µL, while the IR group showed 554.5 cells/µL (p < 0.001), demonstrating that IRs started ART with higher CD4+ T cell levels. The same could be observed concerning the pre-treatment CD4/CD8 ratio (p = 0.010) and pre-treatment CD4% (p < 0.001), which were significantly higher in the IR group. Additionally, we also demonstrated that there was a statistically significant difference in pre-treatment CD8 percentages among the groups (INR: 65.4 ± 8.4 and IR: 47.1 ± 4.8; p = 0.008). This statistical pattern was maintained after 18 months of ART, where the CD4+ T cell count (p < 0.001), the CD4/CD8 ratio (p < 0.001), and CD4% (p < 0.001) continued significantly higher in the IR group, while CD8% (p = 0.001) remained higher in the INR group, having a significant influence on immunological recovery during ART (see Table 1 for more details).
Corroborating with the data found about the CD4+ T lymphocyte count, we observed that the lower the pre-treatment in CD4+ T cell levels, the greater the trend of ART-treated patients being INRs (Z = 3.486; p < 0.001) (Figure 1). Most INRs in our study (>60%) showed a CD4+ T lymphocyte count ≤200 cells/µL in the pre-ART period, while there were few patients (<10%) in the IR group with this pre-ART CD4+ T cell count. In addition, the pairwise comparison analyses with CD4+ T cell count along therapy time (pre-ART, 6 m of ART, 12 m of ART, and 18 m of ART) showed a significant difference in CD4+ T cell gain between the IR and INR groups (WTS = 37.252; p < 0.001) (Figure 2). CD4+ T lymphocyte count recovery was higher in the IR group compared to the INR group, especially in the last 6 months of ART, where the difference among the groups was greater. It is possible to observe that after 12 months of therapy, the IR group continued increasing CD4+ T lymphocyte levels, while in the INR group there was a decline in this process, suggesting an exhaustion in CD4+ T cell gain (Figure 2).
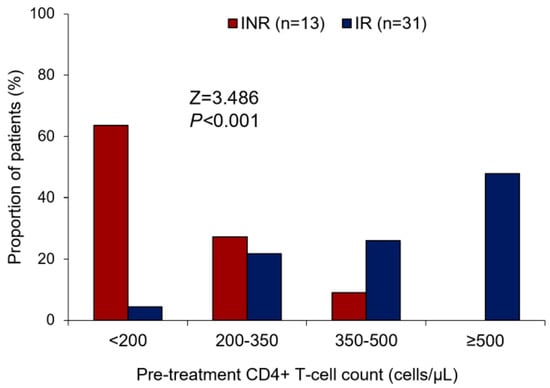
Figure 1.
Bar plot showing the comparison of the INR and IR groups about the pre-treatment of CD4+ T cell count stratification. Cochran–Armitage test for trend: Z = 3.486; p < 0.001. INR—immunological non-responders. IR—immunological responders.
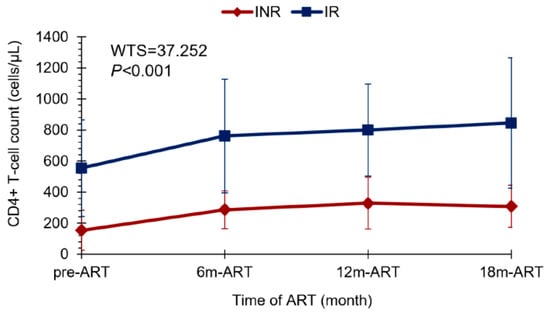
Figure 2.
Line plot showing the CD4+ T cell gain profile between the INR and IR groups throughout ART time: pre-treatment, at 6 months, 12 months, and 18 months of ART. Wald-type test: WTS = 37.252; p < 0.001. ART—antiretroviral therapy. INR—immunological non-responders. IR—immunological responders.
In this study, the coinfections did not influence immunological recovery in our population (see Supplementary Table S1 for more details).
3.2. Thymic Output and T Cell Subsets
The thymic function analysis was performed by quantifying RTE CD4+ T cells (CD4+ CD45RA+ CD31+, Figure 3A) and naïve CD4+ T cells (CD4+/CD45RA+ CD62L+, Figure 4C). RTE percentage was lower in the INR group (19.5 ± 6.3) compared to the IR group (29.9 ± 11.5) with a statistically significant difference (p = 0.038, Figure 3B), demonstrating the influence of these cells on immune reconstitution.
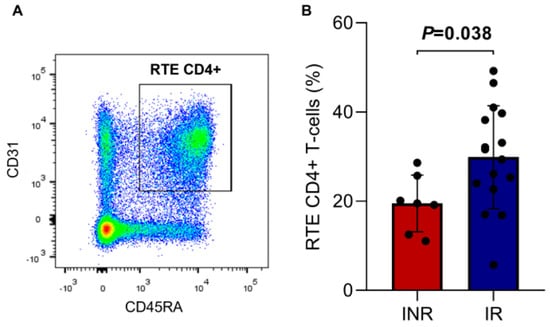
Figure 3.
(A) Representative dot plot showing the gating strategy for RTE CD4+ T cells (CD4+/CD45RA+CD31+). (B) Percentage of RTE CD4+ T cells in the INR and IR groups. Means, standard deviation, and p-value (according to the t-test) are shown. INR—immunological non-responders. IR—immunological responders. RTE—recent thymic emigrants.
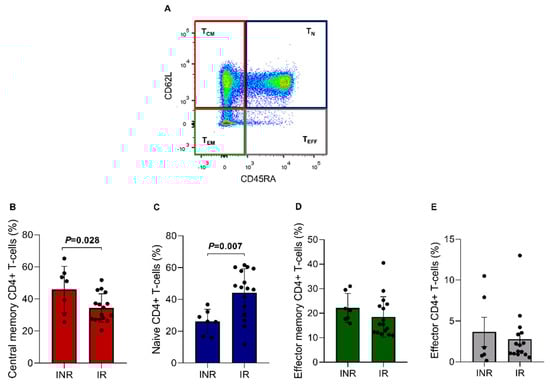
Figure 4.
CD4+ T lymphocytes subsets in the INR and IR groups. (A) Lymphocytes were gated on CD4+ T cells and then on CD45RA and CD62. (B) TCM = central memory CD4+ T cells (CD45RA- CD62L+); (C) TN = naïve CD4+ T cells (CD45RA+ CD62L+); (D) TEM = effector memory CD4+ T cells (CD45RA- CD62L-); and (E) TEFF = effector CD4+ T cells (CD45RA+ CD62L-). Means, standard deviation, and p-values (according to the t-test) are shown. INR—immunological non-responders. IR—immunological responders.
The ART-treated groups were also analyzed regarding CD4+ T cell subsets through the CD45RA and CD62L markers (Figure 4A), consisting of central memory CD4+ T cells (TCM = 40.1%), naïve CD4+ T cells (TN = 35.2%), effector memory CD4+ T cells (TEM = 20.3%), and effector CD4+ T cells (TEFF = 3.2%). A statistically significant difference was found between the two groups regarding TCM cells. For this analysis, the INR group showed a higher TCM percentage than the IR group (IR = 34.4 ± 8.9% vs. INR = 45.9 ± 14.5%; p = 0.028, Figure 4B). Furthermore, it was also possible to observe that the TN fraction percentage was significantly lower in the INR group (IR = 44.3 ± 15.0% vs. INR = 26.1 ± 7.7%; p = 0.007; Figure 4C). This result corroborates with the RTE CD4+ T cell %, which was also lower in the same group, suggesting a reduced thymic function in INR patients. No significant differences were found between the groups for the other CD4+ T cell subsets (Figure 4D,E).
3.3. Immune Activation
The analysis of the immune activation profile (HLA-DR+ CD38+, Figure 5A) showed an increased activation profile in the INR group compared to the IR group, mainly through the expression of HLA-DR (IR = 4.9 ± 2.7 vs. INR = 12.9 ± 6.2; p = 0.007) and both markers (IR = 1.1 ± 0.5 vs. INR = 2.6 ± 1.1; p = 0.004) on the surface of the CD4+ T cells (Figure 5B). Although the CD8+ T cells % was statistically different among the ART-treated groups (IR = 34.5 vs. INR = 46.4, p = 0.001, Table 1), a similar percentage of activated CD8+ T cells was found between the INR and IR groups with reduced activation levels of CD8+ T cells (Figure 5C).
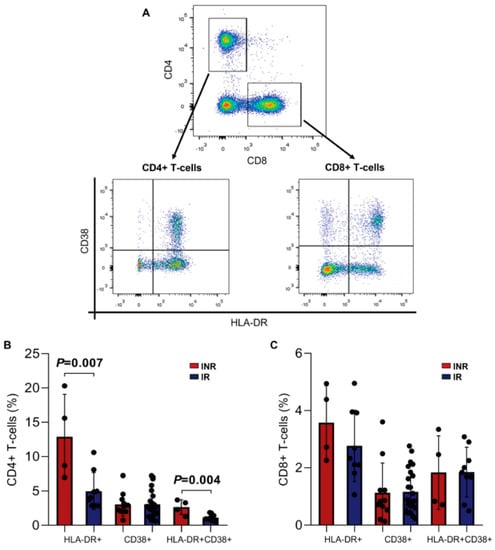
Figure 5.
Immune activation of CD4+ and CD8+ T cells in the INR and IR groups. (A) Representative dot plots showing the gating strategy for activated CD4+ (CD4+/CD38+ and/or HLA-DR+) and CD8+ (CD8+/CD38+ and/or HLA-DR+) T-lymphocytes. (B) Percentage of HLA-DR+, CD38+, and both in CD4+ T cells. (C) Percentage of HLA-DR+, CD38+, and both in CD8+ T cells. Means, standard deviation, and p-values (according to the t-test) are shown. INR—immunological non-responders. IR—immunological responders.
3.4. Plasma Cytokines Levels
We also performed the quantification of the plasma levels of pro-inflammatory and anti-inflammatory cytokines (TNF-α, IL-2, IL-6, IL-10) to evaluate the Th1 and Th2 profiles, respectively. Regarding that, no statistical differences were found between the INR and IR groups for these proteins (Figure 6A–D), showing similar cytokine production during ART.
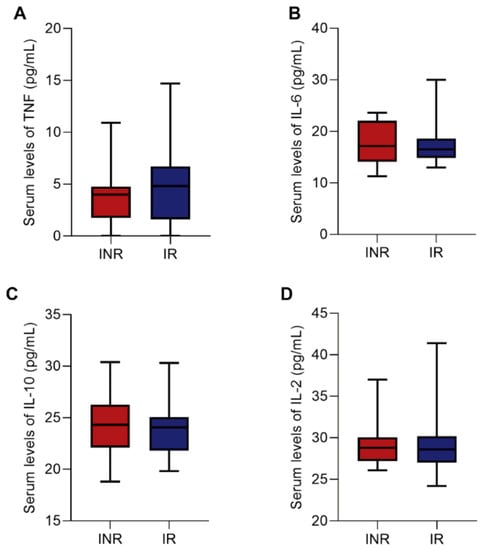
Figure 6.
Box plots showing the plasma levels of TNF (A), IL-6 (B), IL-10 (C), and IL-2 (D) cytokines between the INR and IR groups. Medians and interquartile range are shown. Mann–Whitney test was used to compare INR and IR groups. INR—immunological non-responders. IR—immunological responders.
4. Discussion
The reconstitution of CD4+ T lymphocytes in patients undergoing ART occurs gradually and persistently over the years, providing a better quality of life to these HIV-infected individuals [7]. However, despite the efficacy of ART, some individuals, even after achieving suppressed viral replication for a long time, maintain a low concentration of CD4+ T cells. Consequently, these individuals remain susceptible to HIV-related complications and death [6,24]. Therefore, the present study evaluated clinical factors involved in immune recovery, as well as thymic function, immune activation, T lymphocytes, and cytokine profiles, to analyze their influence on CD4+ T cell reconstitution in ART-treated patients.
Some factors have been reported to influence immunological recovery during ART, mainly the pre-treatment CD4+ T cell count [25,26]. We observed that low CD4+ T lymphocyte levels at the beginning of ART were associated with poor immune reconstitution, corroborating with other studies [27,28,29]. In our analysis, most individuals in the INR group had a pre-treatment CD4+ T lymphocyte count ≤200 cells/µL, demonstrating that they gained fewer CD4+ T cells, which persisted lower than IRs over ART time, even after complete and prolonged PVL suppression, suggesting some exhaustion in the immune system. These results are supported by the fact that individuals who start ART with CD4+ T cell baseline ≥500 cells/µL have a decreased risk of AIDS progression and a higher probability of maintaining viral suppression for a long time and achieving adequate immunological recovery when compared to those with pre-CD4+ T cell counts ≤200 cells/µL [30,31,32,33]. Furthermore, immune reconstitution is less evident in HIV-positive patients who started ART with reduced CD4+ T cell levels [20,34].
The lower output of RTE cells (CD45 + CD31+%) and naïve CD4+ T cells (CD45RA+CD62L+%) found in the INR group can be explained by the thymic exhaustion presented in these patients. During ART, the greatest increase in CD4+ T cell count occurs in the first six months of therapy, as demonstrated in our analysis and corroborated by other studies [35,36,37]. The following phases consist of slightly slower gains and are mainly the result of thymopoiesis [7]. It is known that the thymus presents maximum activity during childhood, generating a wide repertoire of T lymphocytes that would be sufficient throughout life. With aging, the functional thymic tissue is replaced by adipose tissue, and the organ undergoes an involution process that results in decreased T cell production and maturation [38,39]. However, under massive T cell depletion, the thymic function is again required in adulthood, such as in HIV infection [16,40]. HIV can infect, among other cells, thymocytes and, consequently, affect the process of thymopoiesis [41]. Thus, long periods of HIV infection without ART can lead to thymic exhaustion and inefficient immune recovery. This fact demonstrates the importance of early treatment initiation, as recommended by the WHO [42]. Furthermore, thymic exhaustion is also related to exacerbated immune activation since the HIV-induced proliferation of activated thymocytes is capable of promoting inflammatory activity that can cause increased immune activation and damage to functional tissue [43,44].
In this context, we also observed an association of age at the ART beginning with immunological recovery failure, corroborating with other authors [45,46]. In our study, the INR group consisted of older patients than those in the IR group. They showed lower thymic output, which may be a result of late diagnosis and initiation of treatment and immunosenescence, a physiological process that occurs naturally with aging [47,48]. Moreover, aging is also linked to increased immune activation, another important mechanism involved in impaired immune reconstitution [7,49,50].
Exacerbated immune activation is a predictor of disease progression as effectively as the plasma viral load, and it has been associated with persistently reduced CD4+ T cell levels during ART [34,51]. Our study also demonstrated that there were higher levels of immune activation markers, mainly HLA-DR, on CD4+ T lymphocytes’ surfaces in the INR group compared to the IR group. Naturally, HIV-1-infected individuals have persistent immune activation and inflammation, especially when they are not under treatment [52,53]. In the presence of ART and its consequent reduction in viral load, the activation of CD8+ T cells decreases [54,55], and it is possible to observe the same pattern in both groups. However, the increased immune activation found in INRs may be a result of high cell death levels. As previously demonstrated by our group in a similar population, the INR group showed elevated peripheral CD4+ T cell death by pyroptosis compared to the IR group [18]. Pyroptosis is a highly inflammatory cell death via caspase-1, which promotes the release of pro-inflammatory cytokines such as IL-1β and IL-18 [56]. Together, these molecules are responsible for attracting more cells to death, resulting in a vicious cycle of cell depletion [57,58]. IL-1β also plays an important role by activating memory T cells and stimulating their immune functions [59,60]. This may explain the percentage difference found between the INR and IR groups regarding central memory CD4+ T cells in our study.
Other cytokines play an important role in HIV-1 infection. The balance of pro- and anti-inflammatory cytokine production is responsible for influencing levels of viral replication and the homeostatic balance of T cells [61]. In the context of immune recovery, some studies have reported that patients with lower T cell counts could benefit from increased IL-2, promoting cell proliferation events [62]. In addition, high levels of IL-6, TNF-α, and IL-10 found in these patients can affect T cell exhaustion, proliferation, and immune activation [63,64,65]. However, in our study, it was not possible to observe statistically significant differences in the cytokine levels evaluated between the groups.
In addition to the factors already mentioned, different therapeutic regimens can also influence immune recovery. Some studies have reported faster viral suppression and better CD4+ T cell gain in patients whose ART regimens contain dolutegravir (DTG, an integrase inhibitor) instead of efavirenz (EFZ, a non-nucleoside reverse transcriptase inhibitor) [4,66]. In our study, most of the ART-treated patients (79.5%) used the first-line regimen recommended by the World Health Organization (WHO) [42,67] (TDF + 3TC + EFZ or DTG), and there was no statistical difference regarding immunological recovery.
In conclusion, our data propose that reduced thymic function and increased immune activation play a key role in poor CD4+ T lymphocyte reconstitution. These results help to better understand the impaired immunological recovery in HIV-positive patients under ART. Moreover, it could provide data that may contribute to the development of new therapeutic strategies, focusing on decreasing immune activation and increasing thymic function, providing a better outcome for these patients, known as INRs.
Supplementary Materials
The following supporting information can be downloaded at: https://www.mdpi.com/article/10.3390/v15020440/s1, Table S1: Coinfections serology status of HIV-positive patients during ART. Figure S1: Representative flow cytometry plots illustrating the gating strategy for T-lymphocytes. Two initial gating were performed to identify single cells by forward scatter height and area (FSC-H and FSC-A, (A)) and side scatter height and area (SSC-H and SSC-A, (B)). Lymphocytes were then selected from singles cells based on SSC-A and FSC-A (C). Cells expressing CD4+ were selected to further analyses (D).
Author Contributions
M.C.D.S.G. and W.H.V.C.-S. were responsible for the study design, immunologic analyses, and writing of the manuscript. J.L.A.-S. was responsible for the study design and immunologic analyses. M.C.A.B.-d.-C. and F.O.S. were responsible for the cytometry analyses. R.L.G. was responsible for the study design. All authors were involved with the manuscript review and editing. M.C.D.S.G. and W.H.V.C.-S. authorship section to this work and should be considered as co-first authors. All authors have read and agreed to the published version of the manuscript.
Funding
FACEPE (APQ-0599-2.02/14), UFPE (PROPG and PROPESQI) and CAPES (BEX 7715-15-3) supported this study.
Institutional Review Board Statement
This study was conducted according to the guidelines of the Declaration of Helsinki and approved by the Ethics Committee of Instituto de Medicina Integral Professor Fernando Figueira (protocol code: 3629-13; 13 November 2013).
Informed Consent Statement
Informed consent was obtained from all subjects involved in this study.
Data Availability Statement
The data that support the findings of this study are available from the corresponding author upon reasonable request.
Conflicts of Interest
The authors declare no conflict of interest in this study.
References
- UNAIDS. In Danger: Global AIDS Update 2022. Joint United Nations Programme on HIV/AIDS. 2022. Available online: https://www.unaids.org/en/resources/documents/2022/in-danger-global-aids-update (accessed on 1 November 2022).
- Fauci, A.S. 25 years of HIV. Nature 2008, 453, 289–290. [Google Scholar] [CrossRef] [PubMed]
- Fauci, A.S.; Lane, H.C. Four Decades of HIV/AIDS—Much Accomplished, Much to Do. N. Engl. J. Med. 2020, 383, 1969–1973. [Google Scholar] [CrossRef]
- Yang, X.; Su, B.; Zhang, X.; Liu, Y.; Wu, H.; Zhang, T. Incomplete immune reconstitution in HIV/AIDS patients on antiretroviral therapy: Challenges of immunological non-responders. J. Leukoc. Biol. 2020, 107, 597–612. [Google Scholar] [CrossRef]
- Pau, A.K.; George, J.M. Antiretroviral Therapy: Current Drugs. Infect. Dis. Clin. N. Am. 2014, 28, 371–402. [Google Scholar] [CrossRef]
- Cenderello, G.; De Maria, A. Discordant responses to cART in HIV-1 patients in the era of high potency antiretroviral drugs: Clinical evaluation, classification, management prospects. Expert Rev. Anti-Infect. Ther. 2015, 14, 29–40. [Google Scholar] [CrossRef]
- Corbeau, P.; Reynes, J. Immune reconstitution under antiretroviral therapy: The new challenge in HIV-1 infection. Blood 2011, 117, 5582–5590. [Google Scholar] [CrossRef]
- Gaardbo, J.C.; Hartling, H.J.; Gerstoft, J.; Nielsen, S.D. Incomplete Immune Recovery in HIV Infection: Mechanisms, Relevance for Clinical Care, and Possible Solutions. J. Immunol. Res. 2012, 2012, 670957. [Google Scholar] [CrossRef]
- Bono, V.; Augello, M.; Tincati, C.; Marchetti, G. Failure of CD4+ T-Cell Recovery upon Virally-Effective CART: An Enduring Gap in the Understanding of HIV+ Immunological Non-Responders. New Microbiol. 2022, 45, 155–172. [Google Scholar] [PubMed]
- Pinzone, M.R.; Di Rosa, M.; Cacopardo, B.; Nunnari, G. HIV RNA Suppression and Immune Restoration: Can We Do Better? J. Immunol. Res. 2012, 2012, 515962. [Google Scholar] [CrossRef] [PubMed]
- Pido-Lopez, J.; Imami, N.; Aspinall, R. Both age and gender affect thymic output: More recent thymic migrants in females than males as they age. Clin. Exp. Immunol. 2001, 125, 409–413. [Google Scholar] [CrossRef]
- Li, T.; Wu, N.; Dai, Y.; Qiu, Z.; Han, Y.; Xie, J.; Zhu, T.; Li, Y. Reduced Thymic Output Is a Major Mechanism of Immune Reconstitution Failure in HIV-Infected Patients After Long-term Antiretroviral Therapy. Clin. Infect. Dis. 2011, 53, 944–951. [Google Scholar] [CrossRef] [PubMed]
- Carvalho-Silva, W.H.V.; Andrade-Santos, J.L.; Guedes, M.C.D.S.; Guimarães, R.L. Genetics and immunological recovery with antiretroviral treatment for HIV. Pharmacogenomics 2020, 21, 979–983. [Google Scholar] [CrossRef] [PubMed]
- Andrade-Santos, J.L.; Carvalho-Silva, W.H.V.; Coelho, A.V.C.; Souto, F.O.; Crovella, S.; Brandão, L.A.C.; Guimarães, R.L. IL18 gene polymorphism and its influence on CD4+ T-cell recovery in HIV-positive patients receiving antiretroviral therapy. Infect. Genet. Evol. 2019, 75, 103997. [Google Scholar] [CrossRef] [PubMed]
- Garrido, M.; Mozos, A.; Martínez, A.; García, F.; Serafín, A.; Morente, V.; Caballero, M.; Gil, C.; Fumero, E.; Miró, J.M.; et al. HIV-1 Upregulates Intercellular Adhesion Molecule-1 Gene Expression in Lymphoid Tissue of Patients With Chronic HIV-1 Infection. J. Acquir. Immune Defic. Syndr. 2007, 46, 268–274. [Google Scholar] [CrossRef] [PubMed]
- Ye, D.E.K.A.A.P.K.P.; Kirschner, D.; Kourtis, A. The Thymus During HIV Disease: Role in Pathogenesis and in Immune Recovery. Curr. HIV Res. 2004, 2, 177–183. [Google Scholar] [CrossRef]
- Guo, F.-P.; Li, Y.-J.; Qiu, Z.-F.; Lv, W.; Han, Y.; Xie, J.; Li, Y.-L.; Song, X.-J.; Du, S.-S.; Mehraj, V.; et al. Baseline Naive CD4+ T-cell Level Predicting Immune Reconstitution in Treated HIV-infected Late Presenters. Chin. Med. J. 2016, 129, 2683–2690. [Google Scholar] [CrossRef]
- Carvalho-Silva, W.H.V.; Andrade-Santos, J.L.; Souto, F.O.; Coelho, A.V.C.; Crovella, S.; Guimarães, R.L. Immunological recovery failure in cART-treated HIV-positive patients is associated with reduced thymic output and RTE CD4+ T cell death by pyroptosis. J. Leukoc. Biol. 2020, 107, 85–94. [Google Scholar] [CrossRef]
- Aiuti, F.; Mezzaroma, I. Failure to reconstitute CD4+ T-cells despite suppression of HIV replication under HAART. Aids Rev. 2006, 8, 88–97. [Google Scholar]
- He, S.; Zhang, Z.; Fu, Y.; Qin, C.; Li, S.; Han, X.; Xu, J.; Liu, J.; Jiang, Y.; Shang, H. Thymic Function Is Most Severely Impaired in Chronic HIV-1 Infection, but Individuals with Faster Disease Progression during Early HIV-1 Infection Expressed Lower Levels of RTEs. JAIDS 2015, 70, 472–478. [Google Scholar] [CrossRef]
- Dries, L.V.D.; Claassen, M.A.; Groothuismink, Z.M.; van Gorp, E.; Boonstra, A. Immune activation in prolonged cART-suppressed HIV patients is comparable to that of healthy controls. Virology 2017, 509, 133–139. [Google Scholar] [CrossRef]
- Lederman, M.M.; Calabrese, L.; Funderburg, N.T.; Clagett, B.; Medvik, K.; Bonilla, H.; Gripshover, B.; Salata, R.A.; Taege, A.; Lisgaris, M.; et al. Immunologic Failure Despite Suppressive Antiretroviral Therapy Is Related to Activation and Turnover of Memory CD4 Cells. J. Infect. Dis. 2011, 204, 1217–1226. [Google Scholar] [CrossRef]
- Robbins, G.K.; Spritzler, J.G.; Chan, E.S.; Asmuth, D.M.; Gandhi, R.T.; Rodriguez, B.; Skowron, G.; Skolnik, P.R.; Shafer, R.W.; Pollard, R.B.; et al. Incomplete Reconstitution of T Cell Subsets on Combination Antiretroviral Therapy in the AIDS Clinical Trials Group Protocol 384. Clin. Infect. Dis. 2009, 48, 350–361. [Google Scholar] [CrossRef]
- Jevtović, D.; Salemović, D.; Ranin, J.; Pešić, I.; Žerjav, S.; Djurković-Djaković, O. The dissociation between virological and immunological responses to HAART. Biomed. Pharmacother. 2005, 59, 446–451. [Google Scholar] [CrossRef]
- Nanzigu, S.; Kiguba, R.; Kabanda, J.; Jackson, M.; Waako, P.; Kityo, C.; Makumbi, F. Poor immunological recovery among severely immunosuppressed antiretroviral therapy-naïve Ugandans. HIV/AIDS Res. Palliat. Care 2013, 5, 309–319. [Google Scholar] [CrossRef] [PubMed]
- Vivancos-Gallego, M.J.; Okhai, H.; Perez-Elías, M.J.; Gomez-Ayerbe, C.; Moreno-Zamora, A.; Casado, J.L.; Quereda, C.; Sanz, J.M.; Sanchez-Conde, M.; Serrano-Villar, S.; et al. CD4+:CD8+ T-cell Ratio Changes in People with HIV Receiving Antiretroviral Treatment. Antivir. Ther. 2021, 25, 91–100. [Google Scholar] [CrossRef] [PubMed]
- Lange, C.G.; Valdez, H.; Medvik, K.; Asaad, R.; Lederman, M.M. CD4+ T-Lymphocyte Nadir and the Effect of Highly Active Antiretroviral Therapy on Phenotypic and Functional Immune Restoration in HIV-1 Infection. Clin. Immunol. 2002, 102, 154–161. [Google Scholar] [CrossRef]
- D’Amico, R.; Yang, Y.; Mildvan, N.; Evans, S.R.; Schnizlein-Bick, C.T.; Hafner, R.; Webb, N.; Basar, M.; Zackin, R.; Jacobson, M.A. Lower CD4+ T Lymphocyte Nadirs May Indicate Limited Immune Reconstitution in HIV-1 Infected Individuals on Potent Antiretroviral Therapy: Analysis of Immunophenotypic Marker Results of AACTG 5067. J. Clin. Immunol. 2005, 25, 106–115. [Google Scholar] [CrossRef] [PubMed]
- Massanella, M.; Negredo, E.; Clotet, B.; Blanco, J. Immunodiscordant responses to HAART–Mechanisms and consequences. Expert Rev. Clin. Immunol. 2013, 9, 1135–1149. [Google Scholar] [CrossRef]
- Song, A.; Liu, X.; Huang, X.; Meyers, K.; Oh, D.-Y.; Hou, J.; Xia, W.; Su, B.; Wang, N.; Lu, X.; et al. From CD4-Based Initiation to Treating All HIV-Infected Adults Immediately: An Evidence-Based Meta-analysis. Front. Immunol. 2018, 9, 212. [Google Scholar] [CrossRef]
- Benveniste, O.; Flahault, A.; Rollot, F.; Elbim, C.; Estaquier, J.; Pédron, B.; Duval, X.; Dereuddre-Bosquet, N.; Clayette, P.; Sterkers, G.; et al. Mechanisms Involved in the Low-Level Regeneration of CD4+Cells in HIV-1–Infected Patients Receiving Highly Active Antiretroviral Therapy Who Have Prolonged Undetectable Plasma Viral Loads. J. Infect. Dis. 2005, 191, 1670–1679. [Google Scholar] [CrossRef]
- Darraj, M.; Shafer, L.A.; Chan, S.; Kasper, K.; Keynan, Y. Rapid CD4 decline prior to antiretroviral therapy predicts subsequent failure to reconstitute despite HIV viral suppression. J. Infect. Public Health 2018, 11, 265–269. [Google Scholar] [CrossRef]
- Muscatello, A.; Nozza, S.; Fabbiani, M.; De Benedetto, I.; Ripa, M.; Dell’Acqua, R.; Antinori, A.; Pinnetti, C.; Calcagno, A.; Ferrara, M.; et al. Enhanced Immunological Recovery With Early Start of Antiretroviral Therapy During Acute or Early HIV Infection–Results of Italian Network of ACuTe HIV InfectiON (INACTION) Retrospective Study. Pathog. Immun. 2020, 5, 8–33. [Google Scholar] [CrossRef] [PubMed]
- Okoye, A.A.; Picker, L.J. CD4+T-cell depletion in HIV infection: Mechanisms of immunological failure. Immunol. Rev. 2013, 254, 54–64. [Google Scholar] [CrossRef]
- Kelley, C.F.; Kitchen, C.M.R.; Hunt, P.W.; Rodriguez, B.; Hecht, F.M.; Kitahata, M.; Crane, H.M.; Willig, J.; Mugavero, M.; Saag, M.; et al. Incomplete Peripheral CD4+Cell Count Restoration in HIV-Infected Patients Receiving Long-Term Antiretroviral Treatment. Clin. Infect. Dis. 2009, 48, 787–794. [Google Scholar] [CrossRef]
- Autran, B.; Carcelain, G.; Li, T.S.; Blanc, C.; Mathez, D.; Tubiana, R.; Katlama, C.; Debré, P.; Leibowitch, J. Positive Effects of Combined Antiretroviral Therapy on CD4 + T Cell Homeostasis and Function in Advanced HIV Disease. Science 1997, 277, 112–116. [Google Scholar] [CrossRef] [PubMed]
- Michael, C.G.; Kirk, O.; Mathiesen, L.; Nielsen, S.D. The Naive CD4+ Count in HIV-1-infected Patients at Time of Initiation of Highly Active Antiretroviral Therapy is Strongly Associated with the Level of Immunological Recovery. Scand. J. Infect. Dis. 2002, 34, 45–49. [Google Scholar] [CrossRef]
- Saule, P.; Trauet, J.; Dutriez, V.; Lekeux, V.; Dessaint, J.-P.; Labalette, M. Accumulation of memory T cells from childhood to old age: Central and effector memory cells in CD4+ versus effector memory and terminally differentiated memory cells in CD8+ compartment. Mech. Ageing Dev. 2006, 127, 274–281. [Google Scholar] [CrossRef]
- Kumar, B.V.; Connors, T.; Farber, D.L. Human T Cell Development, Localization, and Function throughout Life. Immunity 2018, 48, 202–213. [Google Scholar] [CrossRef] [PubMed]
- Kolte, L.; Ryder, L.P.; Albrecht-Beste, E.; Jensen, F.K.; Nielsen, S.D. HIV-infected Patients with a Large Thymus Maintain Higher CD4 Counts in a 5-year Follow-up Study of Patients Treated with Highly Active Antiretroviral Therapy. Scand. J. Immunol. 2009, 70, 608–613. [Google Scholar] [CrossRef] [PubMed]
- Dion, M.-L.; Poulin, J.-F.O.; Bordi, R.; Sylvestre, M.; Corsini, R.; Kettaf, N.; Dalloul, A.; Boulassel, M.-R.; Debré, P.; Routy, J.-P.; et al. HIV Infection Rapidly Induces and Maintains a Substantial Suppression of Thymocyte Proliferation T Cell Receptor Excision Circles (TRECs), Molecular Markers of Distinct T Cell Receptor Rearrangements Occurring at Different Stages of Thymocyte Develop. Immunity 2004, 21, 757–768. [Google Scholar] [CrossRef] [PubMed]
- World Health Organization (WHO). Consolidated Guidelines on the Use of Antiretroviral Drugs for Treating and Preventing HIV Infection: Recommendations for a Public Health Approach; World Health Organization WHO: Geneva, Switzerland, 2016. [Google Scholar] [CrossRef]
- Manjati, T.; Nkambule, B.; Ipp, H.; Africa, S.; Hospital, T.; Africa, S.; Sciences, M. Immune Activation Is Associated with Decreased Thymic Function in Asymptomatic, Untreated HIV- Infected Individuals Research Design. S. Afr. J. HIV Med. 2016, 17, 1–6. [Google Scholar] [CrossRef] [PubMed]
- Bandera, A.; Ferrario, G.; Saresella, M.; Marventano, I.; Soria, A.; Zanini, F.; Sabbatini, F.; Airoldi, M.; Marchetti, G.; Franzetti, F.; et al. CD4+ T Cell Depletion, Immune Activation and Increased Production of Regulatory T Cells in the Thymus of HIV-Infected Individuals. PLoS ONE 2010, 5, e10788. [Google Scholar] [CrossRef] [PubMed]
- Hunt, P.W.; Deeks, S.G.; Rodriguez, B.; Valdez, H.; Shade, S.B.; Abrams, D.I.; Kitahata, M.M.; Krone, M.; Neilands, T.B.; Brand, R.J.; et al. Continued CD4 cell count increases in HIV-infected adults experiencing 4 years of viral suppression on antiretroviral therapy. Aids 2003, 17, 1907–1915. [Google Scholar] [CrossRef] [PubMed]
- Kaufmann, G.R.; Bloch, M.; Finlayson, R.; Zaunders, J.; Smith, D.; Cooper, D.A. The extent of HIV-1-related immunodeficiency and age predict the long-term CD4 T lymphocyte response to potent antiretroviral therapy. Aids 2002, 16, 359–367. [Google Scholar] [CrossRef] [PubMed]
- Wang, Y.; Dong, C.; Han, Y.; Gu, Z.; Sun, C. Immunosenescence, aging and successful aging. Front. Immunol. 2022, 13, 942796. [Google Scholar] [CrossRef]
- Rodrigues, L.P.; Teixeira, V.R.; Alencar-Silva, T.; Simonassi-Paiva, B.; Pereira, R.W.; Pogue, R.; Carvalho, J.L. Hallmarks of aging and immunosenescence: Connecting the dots. Cytokine Growth Factor Rev. 2021, 59, 9–21. [Google Scholar] [CrossRef]
- Desai, A.; Grolleau-Julius, A.; Yung, R. Leukocyte function in the aging immune system. J. Leukoc. Biol. 2010, 87, 1001–1009. [Google Scholar] [CrossRef]
- Cobos Jiménez, V.; Wit, F.W.N.M.; Joerink, M.; Maurer, I.; Harskamp, A.M.; Schouten, J.; Prins, M.; Van Leeuwen, E.M.M.; Booiman, T.; Deeks, S.G.; et al. T-Cell Activation Independently Associates with Immune Senescence in Long-Term Antiretroviral Drug-Treated HIV-1-Infected Individuals. Univ. New South Wales 2016, 214, 216–225. [Google Scholar]
- Nakanjako, D.; Ssewanyana, I.; Mayanja-Kizza, H.; Kiragga, A.; Colebunders, R.; Manabe, Y.C.; Nabatanzi, R.; Kamya, M.R.; Cao, H. High T-cell immune activation and immune exhaustion among individuals with suboptimal CD4 recovery after 4 years of antiretroviral therapy in an African cohort. BMC Infect. Dis. 2011, 11, 43. [Google Scholar] [CrossRef]
- Deeks, S.G.; Kitchen, C.M.R.; Liu, L.; Guo, H.; Gascon, R.; Narváez, A.B.; Hunt, P.; Martin, J.N.; Kahn, J.O.; Levy, J.; et al. Immune activation set point during early HIV infection predicts subsequent CD4+ T-cell changes independent of viral load. Blood 2004, 104, 942–947. [Google Scholar] [CrossRef]
- Hatano, H. Immune activation and HIV persistence. Curr. Opin. HIV AIDS 2013, 8, 211–216. [Google Scholar] [CrossRef]
- Lok, J.J.; Hunt, P.W.; Collier, A.C.; Benson, C.A.; Witt, M.D.; Luque, A.E.; Deeks, S.G.; Bosch, R.J. The impact of age on the prognostic capacity of CD8+ T-cell activation during suppressive antiretroviral therapy. Aids 2013, 27, 2101–2110. [Google Scholar] [CrossRef]
- Warren, J.; Clutton, G.; Goonetilleke, N. Harnessing CD8+ T Cells Under HIV Antiretroviral Therapy. Front. Immunol. 2019, 10, 291. [Google Scholar] [CrossRef]
- Boucher, D.; Chen, K.W.; Schroder, K. Burn the house, save the day: Pyroptosis in pathogen restriction. Inflammasome 2015, 2, 1–6. [Google Scholar] [CrossRef]
- Doitsh, G.; Greene, W.C. Dissecting How CD4 T Cells Are Lost During HIV Infection. Cell Host Microbe 2016, 19, 280–291. [Google Scholar] [CrossRef]
- Galloway, N.L.; Doitsh, G.; Monroe, K.M.; Yang, Z.; Muñoz-Arias, I.; Levy, D.N.; Greene, W.C. Cell-to-Cell Transmission of HIV-1 Is Required to Trigger Pyroptotic Death of Lymphoid-Tissue-Derived CD4 T Cells. Cell Rep. 2015, 12, 1555–1563. [Google Scholar] [CrossRef]
- Jain, A.; Song, R.; Wakeland, E.K.; Pasare, C. T cell-intrinsic IL-1R signaling licenses effector cytokine production by memory CD4 T cells. Nat. Commun. 2018, 9, 3185. [Google Scholar] [CrossRef]
- Ben-Sasson, S.Z.; Hu-Li, J.; Quiel, J.; Cauchetaux, S.; Ratner, M.; Shapira, I.; Dinarello, C.A.; Paul, W.E. IL-1 acts directly on CD4 T cells to enhance their antigen-driven expansion and differentiation. Proc. Natl. Acad. Sci. USA 2009, 106, 7119–7124. [Google Scholar] [CrossRef] [PubMed]
- Osuji, F.N.; Onyenekwe, C.C.; Ahaneku, J.E.; Ukibe, N.R. The effects of highly active antiretroviral therapy on the serum levels of pro-inflammatory and anti-inflammatory cytokines in HIV infected subjects. J. Biomed. Sci. 2018, 25, 88. [Google Scholar] [CrossRef] [PubMed]
- De Paoli, P. Immunological Effects of Interleukin-2 Therapy in Human Immunodeficiency Virus-Positive Subjects. Clin. Diagn. Lab. Immunol. 2001, 8, 671–677. [Google Scholar] [CrossRef] [PubMed]
- Shive, C.L.; Freeman, M.L.; Younes, S.-A.; Kowal, C.M.; Canaday, D.H.; Rodriguez, B.; Lederman, M.M.; Anthony, D.D. Markers of T Cell Exhaustion and Senescence and Their Relationship to Plasma TGF-β Levels in Treated HIV+ Immune Non-responders. Front. Immunol. 2021, 12, 638010. [Google Scholar] [CrossRef] [PubMed]
- Srikanth, P.; Castillo, R.C.; Sridharan, G.; John, T.J.; Zachariah, A.; Mathai, D.; Schwartz, D.H. Increase in plasma IL-10 levels and rapid loss of CD4+ T cells among HIV-infected individuals in south India. Int. J. STD AIDS 2000, 11, 49–51. [Google Scholar] [CrossRef] [PubMed]
- da Silva, R.C.; Alves, N.M.P.; Silva, M.L.G.; Agrelli, A.; Coelho, A.V.C.; Guimarães, R.L.; Arraes, L.C.; Crovella, S.; Brandão, L.A.C. Brief Report: Polymorphisms in TNF-α/TNFR1 Pathway Genes Are Associated With CD4+ T-Cell Recovery in HIV-1–Infected Individuals on Antiretroviral Therapy. J. Acquir. Immune Defic. Syndr. 2021, 88, 322–327. [Google Scholar] [CrossRef] [PubMed]
- Blanco, J.; Alejos, B.; Moreno, S. Impact of dolutegravir and efavirenz on immune recovery markers: Results from a randomized clinical trial. Clin. Microbiol. Infect. 2018, 24, 900–907. [Google Scholar] [CrossRef]
- Ministério da Saúde. Protocolo Clínico e Diretrizes Terapêuticas Para Manejo Da Infecção Pelo HIV Em Adultos; Boletim Epidemiológico HIV/Aids; Ministério da Saúde. Secretaria de Vigilância em Saúde. Departamento de Vigilância, Prevenção e Controle das Infecções Sexualmente Transmissíveis, do HIV/Aids e das Hepatites Virais: Brasília, Brasil, 2018; ISBN 9788533426405.
Disclaimer/Publisher’s Note: The statements, opinions and data contained in all publications are solely those of the individual author(s) and contributor(s) and not of MDPI and/or the editor(s). MDPI and/or the editor(s) disclaim responsibility for any injury to people or property resulting from any ideas, methods, instructions or products referred to in the content. |
© 2023 by the authors. Licensee MDPI, Basel, Switzerland. This article is an open access article distributed under the terms and conditions of the Creative Commons Attribution (CC BY) license (https://creativecommons.org/licenses/by/4.0/).