

Identifying Longitudinal CD4:CD8 Ratio Trajectories Indicative of Chronic Renal Disease Risk among People Living with HIV: An Application of Growth Mixture Models
 , ,
, ,
Abstract
1. Introduction
2. Materials and Methods
2.1. Study Setting and Data
2.2. Study Design
2.3. Outcome and Study Covariates
2.4. Statistical Analyses
2.4.1. Growth Mixture Modeling
2.4.2. Decay Model
3. Results
3.1. CD4:CD8 Ratio Trajectories and CKD Status
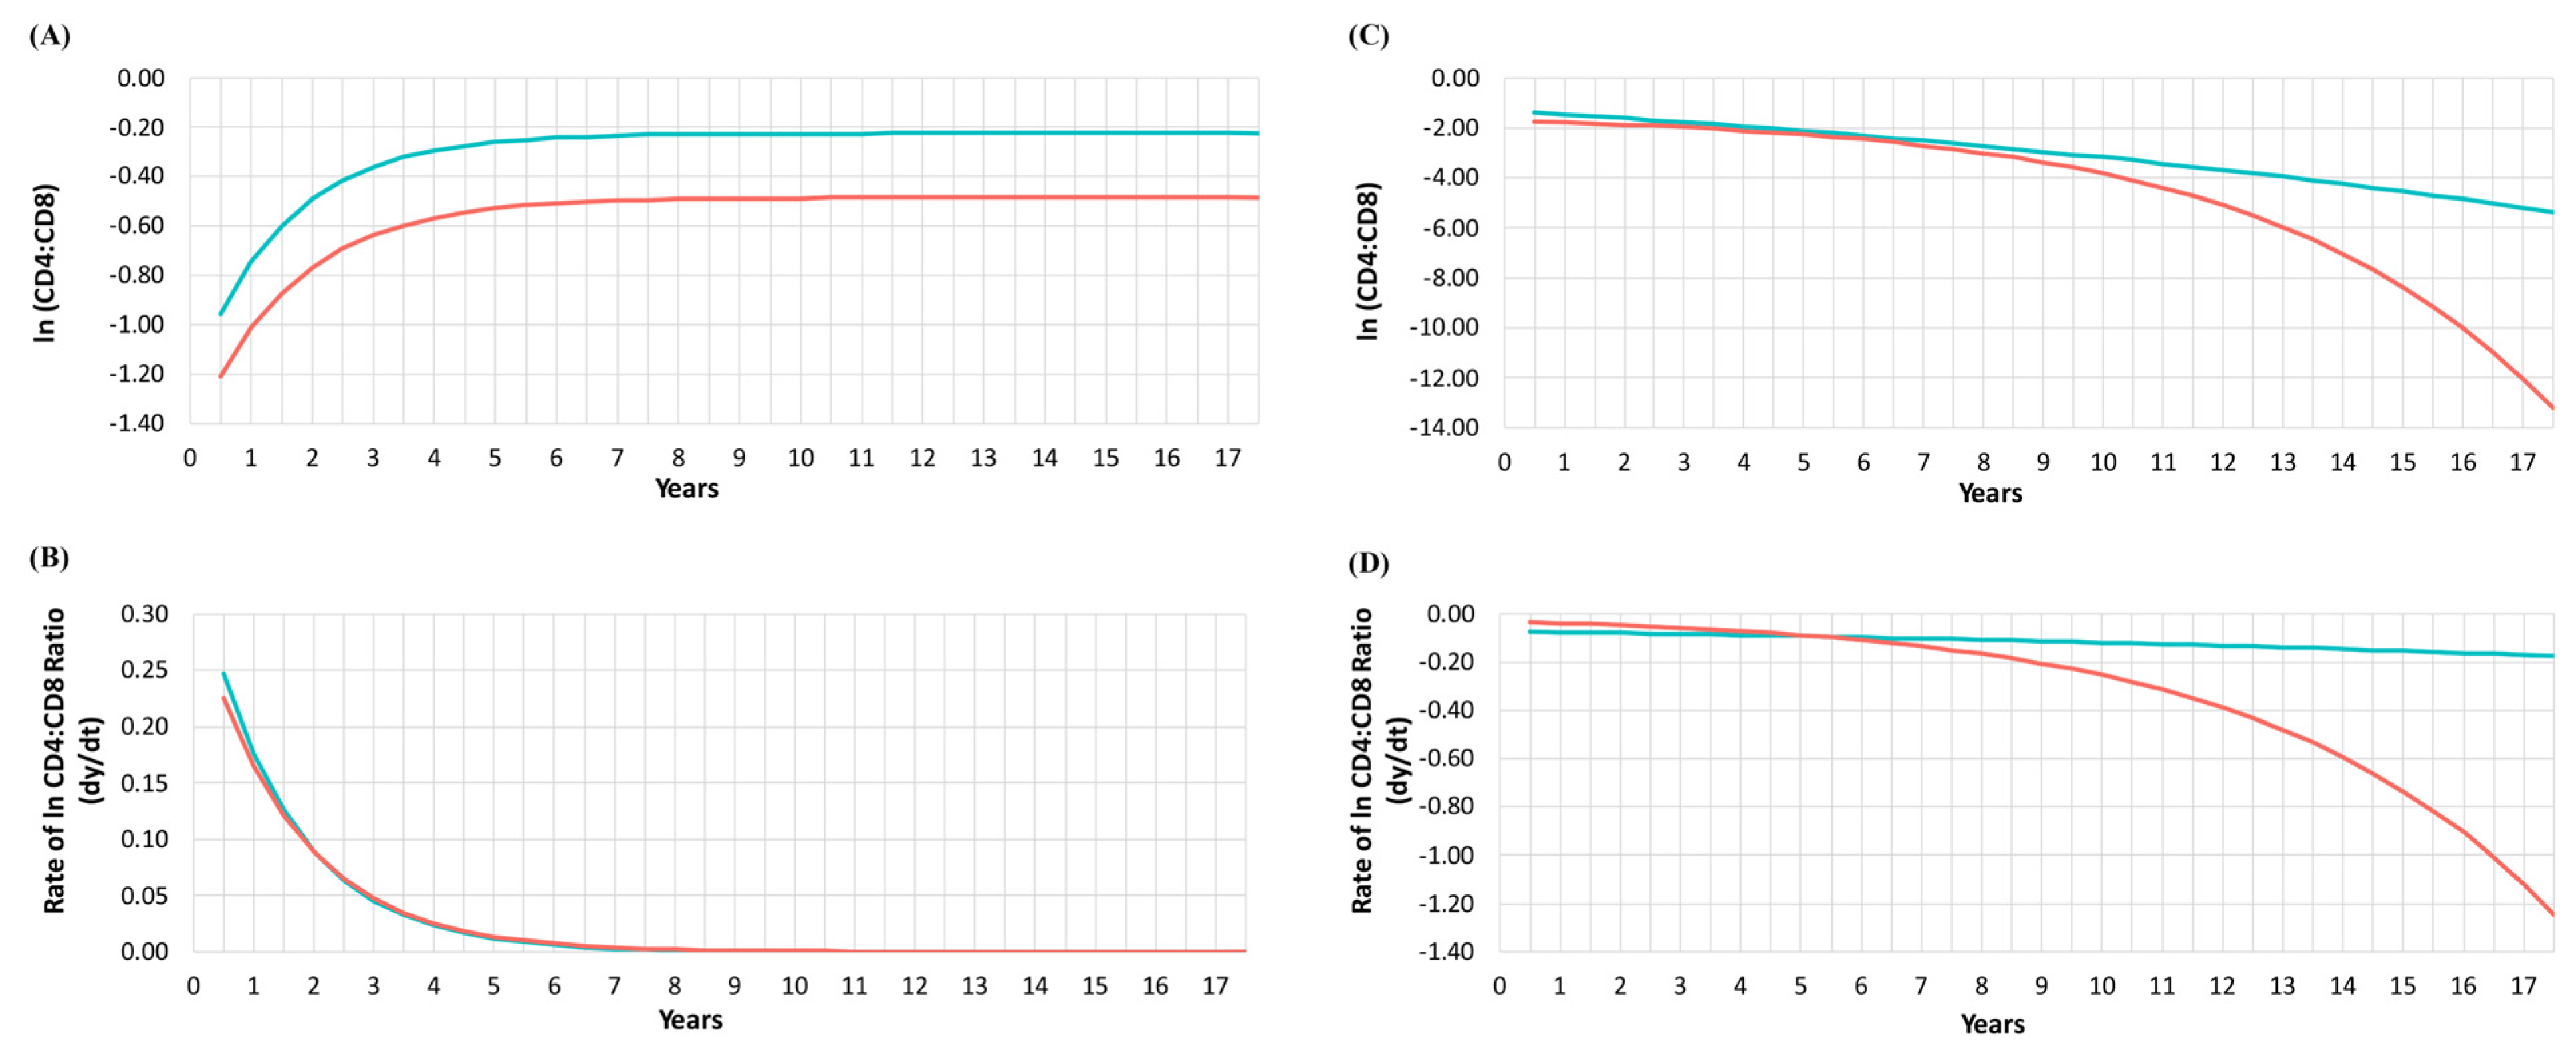
3.2. CD4:CD8 Ratio Decay among Classes and CKD Status
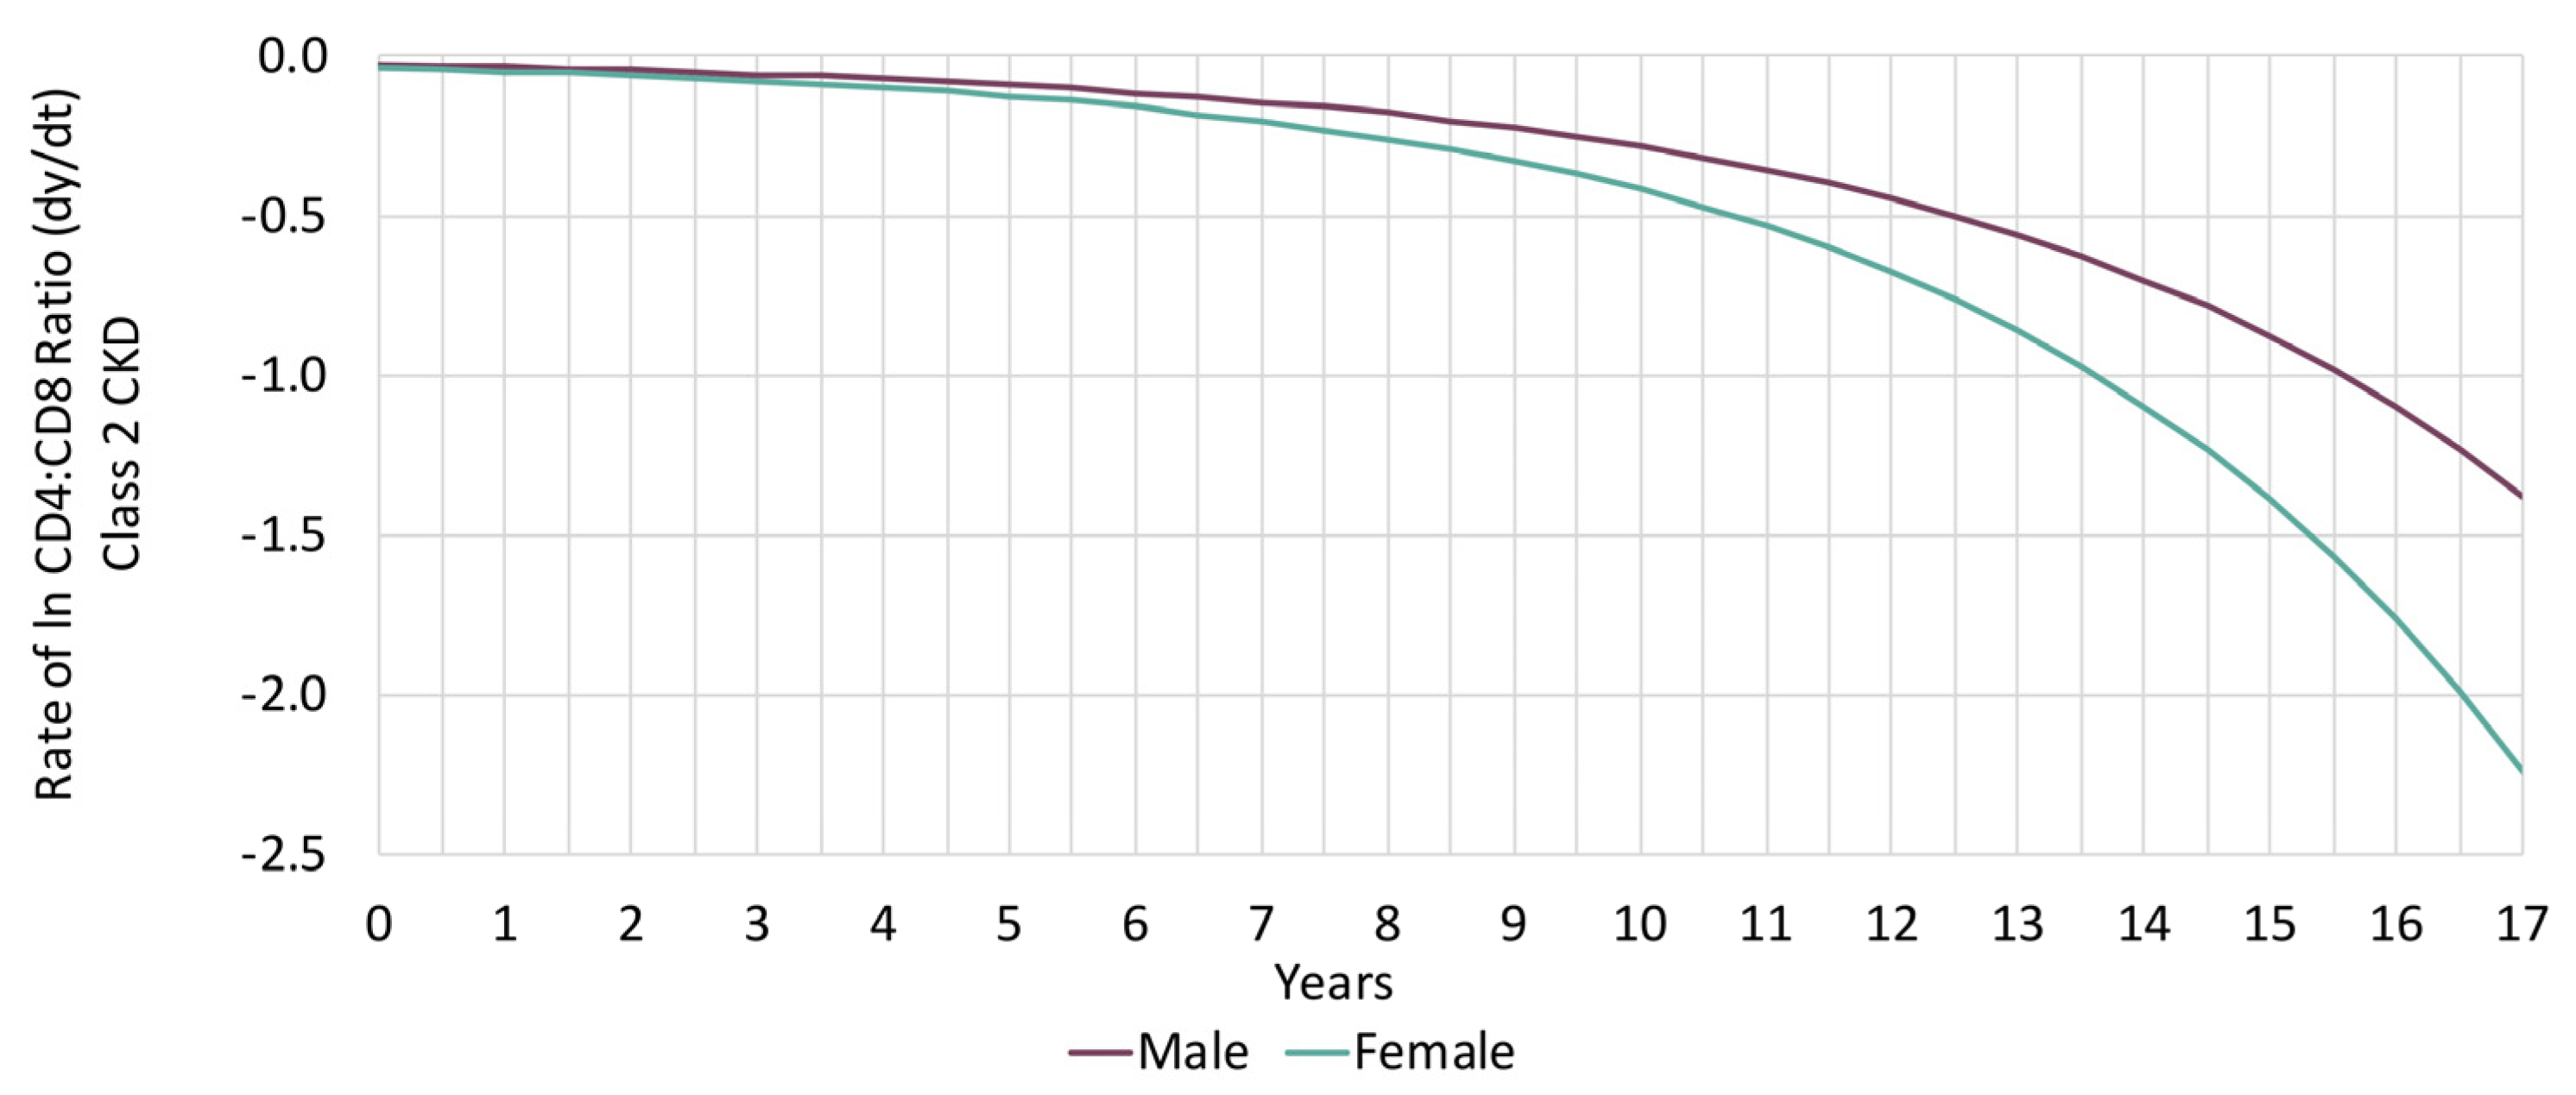
3.3. Sex-Based Analysis
4. Discussion
5. Conclusions
Supplementary Materials
Author Contributions
Funding
Institutional Review Board Statement
Informed Consent Statement
Data Availability Statement
Acknowledgments
Conflicts of Interest
References
- Mussini, C.; Lorenzini, P.; Cozzi-Lepri, A.; Lapadula, G.; Marchetti, G.; Nicastri, E.; Cingolani, A.; Lichtner, M.; Antinori, A.; Gori, A.; et al. CD4/CD8 ratio normalisation and non-AIDS-related events in individuals with HIV who achieve viral load suppression with antiretroviral therapy: An observational cohort study. Lancet HIV 2015, 2, e98–e106. [Google Scholar] [CrossRef]
- Davy-Mendez, T.; Napravnik, S.; Zakharova, O.; Kuruc, J.; Gay, C.; Hicks, C.B.; McGee, K.S.; Eron, J.J. Acute HIV Infection and CD4/CD8 Ratio Normalization After Antiretroviral Therapy Initiation. J. Acquir. Immune. Defic. Syndr. 2018, 79, 510–518. [Google Scholar] [CrossRef] [PubMed]
- Patterson, S.; Cescon, A.; Samji, H.; Chan, K.; Zhang, W.; Raboud, J.; Burchell, A.N.; Cooper, C.; Klein, M.B.; Rourke, S.B.; et al. Life expectancy of HIV-positive individuals on combination antiretroviral therapy in Canada. BMC Infect. Dis. 2015, 15, 274. [Google Scholar] [CrossRef] [PubMed]
- Government of Canada. Social Determinants of Health and Health Inequalities. Available online: https://www.canada.ca/en/public-health/services/health-promotion/population-health/what-determines-health.html (accessed on 10 February 2020).
- Mercer, S.W.; Gunn, J.; Bower, P.; Wyke, S.; Guthrie, B. Managing patients with mental and physical multimorbidity. BMJ 2012, 345, e5559. [Google Scholar] [CrossRef] [PubMed]
- Pereira, B.; Mazzitelli, M.; Milinkovic, A.; Casley, C.; Rubio, J.; Channa, R.; Girometti, N.; Asboe, D.; Pozniak, A.; Boffito, M. Evaluation of a Clinic Dedicated to People Aging with HIV at Chelsea and Westminster Hospital: Results of a 10-Year Experience. AIDS Res. Hum. Retrovir. 2022, 38, 188–197. [Google Scholar] [CrossRef]
- Edelman, E.J.; Rentsch, C.T.; Justice, A.C. Polypharmacy in HIV: Recent insights and future directions. Curr. Opin. HIV AIDS 2020, 15, 126–133. [Google Scholar] [CrossRef]
- Guillot, J.; Rentsch, C.T.; Gordon, K.S.; Justice, A.C.; Bezin, J. Potentially inappropriate medication use by level of polypharmacy among US Veterans 49–64 and 65–70 years old. Pharmacoepidemiol. Drug Saf. 2022, 31, 1056–1074. [Google Scholar] [CrossRef]
- Tsai, A.C.; Burns, B.F. Syndemics of psychosocial problems and HIV risk: A systematic review of empirical tests of the disease interaction concept. Soc. Sci. Med. 2015, 139, 26–35. [Google Scholar] [CrossRef]
- Tsai, A.C.; Mendenhall, E.; Trostle, J.A.; Kawachi, I. Co-occurring epidemics, syndemics, and population health. Lancet 2017, 389, 978–982. [Google Scholar] [CrossRef]
- Heyeres, M.; McCalman, J.; Tsey, K.; Kinchin, I. The Complexity of Health Service Integration: A Review of Reviews. Available online: https://www.ncbi.nlm.nih.gov/pmc/articles/PMC5066319/ (accessed on 12 October 2021).
- World Health Organization. Integrated Health Services—What and Why? Available online: https://www.who.int/healthsystems/service_delivery_techbrief1.pdf (accessed on 5 February 2021).
- Leatt, P.; Pink, G.H.; Guerriere, M. Towards a Canadian model of integrated healthcare. HealthcarePapers 2000, 1, 13–35. [Google Scholar] [CrossRef]
- Park, J.; Zuniga, J.A. Chronic Kidney Disease in Persons Living with HIV: A Systematic Review. J. Assoc. Nurses AIDS Care 2018, 29, 655–666. [Google Scholar] [CrossRef]
- Islam, F.M.; Wu, J.; Jansson, J.; Wilson, D.P. Relative risk of renal disease among people living with HIV: A systematic review and meta-analysis. BMC Public Health 2012, 12, 234. [Google Scholar] [CrossRef]
- Kong, A.M.; Pozen, A.; Anastos, K.; Kelvin, E.A.; Nash, D. Non-HIV Comorbid Conditions and Polypharmacy among People Living with HIV Age 65 or Older Compared with HIV-Negative Individuals Age 65 or Older in the United States: A Retrospective Claims-Based Analysis. AIDS Patient Care STDS 2019, 33, 93–103. [Google Scholar] [CrossRef] [PubMed]
- Nanditha, N.G.A.; Paiero, A.; Tafessu, H.M.; St-Jean, M.; McLinden, T.; Justice, A.C.; Kopec, J.; Montaner, J.S.G.; Hogg, R.S.; Lima, V.D. Excess burden of age-associated comorbidities among people living with HIV in British Columbia, Canada: A population-based cohort study. BMJ Open 2021, 11, e041734. [Google Scholar] [CrossRef] [PubMed]
- Jotwani, V.; Li, Y.; Grunfeld, C.; Choi, A.I.; Shlipak, M.G. Risk factors for ESRD in HIV-infected individuals: Traditional and HIV-related factors. Am. J. Kidney Dis. 2012, 59, 628–635. [Google Scholar] [CrossRef] [PubMed]
- Naicker, S.; Fabian, J. Risk factors for the development of chronic kidney disease with HIV/AIDS. Clin. Nephrol. 2010, 74 (Suppl. S1), S51–S56. [Google Scholar] [CrossRef]
- Ryom, L.; Mocroft, A.; Kirk, O.; Worm, S.W.; Kamara, D.A.; Reiss, P.; Ross, M.; Fux, C.A.; Morlat, P.; Moranne, O.; et al. Association between antiretroviral exposure and renal impairment among HIV-positive persons with normal baseline renal function: The D:A:D study. J. Infect. Dis. 2013, 207, 1359–1369. [Google Scholar] [CrossRef]
- Arribas, J.R.; Thompson, M.; Sax, P.E.; Haas, B.; McDonald, C.; Wohl, D.A.; DeJesus, E.; Clarke, A.E.; Guo, S.; Wang, H.; et al. Brief Report: Randomized, Double-Blind Comparison of Tenofovir Alafenamide (TAF) vs. Tenofovir Disoproxil Fumarate (TDF), Each Coformulated With Elvitegravir, Cobicistat, and Emtricitabine (E/C/F) for Initial HIV-1 Treatment: Week 144 Results. J. Acquir. Immune. Defic. Syndr. 2017, 75, 211–218. [Google Scholar] [CrossRef]
- Scherzer, R.; Estrella, M.; Li, Y.; Choi, A.I.; Deeks, S.G.; Grunfeld, C.; Shlipak, M.G. Association of tenofovir exposure with kidney disease risk in HIV infection. AIDS 2012, 26, 867–875. [Google Scholar] [CrossRef]
- British Columbia Centre for Excellence in HIV/AIDS. Therapeutic Guidelines for Antiretroviral (ARV) Treatment of Adult HIV Infection. Available online: http://bccfe.ca/therapeutic-guidelines/guidelines-antiretroviral-arv-treatment-adult-hiv-infection (accessed on 20 February 2022).
- British Columbia Centre for Excellence in HIV/AIDS. Primary Care Guidelines for the Management of HIV/AIDS in Adults in British Columbia. Available online: http://bccfe.ca/therapeutic-guidelines/primary-care-guidelines (accessed on 20 February 2022).
- University of Liverpool. Antiretroviral Dosing in Adults with Renal Impairment. Available online: https://liverpool-hiv-hep.s3.amazonaws.com/prescribing_resources/pdfs/000/000/036/original/Renal_ARVs_2022_Nov.pdf?1668590201 (accessed on 16 January 2023).
- Swanepoel, C.R.; Atta, M.G.; D’Agati, V.D.; Estrella, M.M.; Fogo, A.B.; Naicker, S.; Post, F.A.; Wearne, N.; Winkler, C.A.; Cheung, M.; et al. Kidney disease in the setting of HIV infection: Conclusions from a Kidney Disease: Improving Global Outcomes (KDIGO) Controversies Conference. Kidney Int. 2018, 93, 545–559. [Google Scholar] [CrossRef]
- Yombi, J.C.; Jones, R.; Pozniak, A.; Hougardy, J.M.; Post, F.A. Monitoring of kidney function in HIV-positive patients. HIV Med. 2015, 16, 457–467. [Google Scholar] [CrossRef] [PubMed]
- Estrella, M.M.; Fine, D.M. Screening for chronic kidney disease in HIV-infected patients. Adv. Chronic Kidney Dis. 2010, 17, 26–35. [Google Scholar] [CrossRef] [PubMed]
- Asboe, D.; Aitken, C.; Boffito, M.; Booth, C.; Cane, P.; Fakoya, A.; Geretti, A.M.; Kelleher, P.; Mackie, N.; Muir, D.; et al. British HIV Association guidelines for the routine investigation and monitoring of adult HIV-1-infected individuals 2011. HIV Med. 2012, 13, 1–44. [Google Scholar] [CrossRef] [PubMed]
- Heron, J.E.; Bagnis, C.I.; Gracey, D.M. Contemporary issues and new challenges in chronic kidney disease amongst people living with HIV. AIDS Res. Ther. 2020, 17, 11. [Google Scholar] [CrossRef]
- Guidelines & Protocols Advisory Committee British Columbia. Chronic Kidney Disease—Identification, Evaluation and Management of Adult Patients. Available online: https://www2.gov.bc.ca/gov/content/health/practitioner-professional-resources/bc-guidelines/chronic-kidney-disease#risk-factors-screening (accessed on 12 October 2021).
- Wyatt, C.M. Kidney Disease and HIV Infection. Top. Antivir. Med. 2017, 25, 13–16. [Google Scholar]
- Levey, A.S.; Perrone, R.D.; Madias, N.E. Serum creatinine and renal function. Annu. Rev. Med. 1988, 39, 465–490. [Google Scholar] [CrossRef]
- Gupta, S.K.; Kitch, D.; Tierney, C.; Melbourne, K.; Ha, B.; McComsey, G.A.; AIDS Clinical Trials Group Study A5224s Team. Markers of renal disease and function are associated with systemic inflammation in HIV infection. HIV Med. 2015, 16, 591–598. [Google Scholar] [CrossRef]
- Amdur, R.L.; Feldman, H.I.; Gupta, J.; Yang, W.; Kanetsky, P.; Shlipak, M.; Rahman, M.; Lash, J.P.; Townsend, R.R.; Ojo, A.; et al. Inflammation and Progression of CKD: The CRIC Study. Clin. J. Am. Soc. Nephrol. 2016, 11, 1546–1556. [Google Scholar] [CrossRef]
- Stavropoulou, E.; Kantartzi, K.; Tsigalou, C.; Aftzoglou, K.; Voidarou, C.; Konstantinidis, T.; Chifiriuc, M.C.; Thodis, E.; Bezirtzoglou, E. Microbiome, Immunosenescence, and Chronic Kidney Disease. Front. Med. 2021, 8, 661203. [Google Scholar] [CrossRef]
- Serrano-Villar, S.; Perez-Elias, M.J.; Dronda, F.; Casado, J.L.; Moreno, A.; Royuela, A.; Perez-Molina, J.A.; Sainz, T.; Navas, E.; Hermida, J.M.; et al. Increased risk of serious non-AIDS-related events in HIV-infected subjects on antiretroviral therapy associated with a low CD4/CD8 ratio. PLoS ONE 2014, 9, e85798. [Google Scholar] [CrossRef]
- Bruno, G.; Saracino, A.; Monno, L.; Angarano, G. The Revival of an “Old” Marker: CD4/CD8 Ratio. AIDS Rev. 2017, 19, 81–88. [Google Scholar] [PubMed]
- Serrano-Villar, S.; Sainz, T.; Lee, S.A.; Hunt, P.W.; Sinclair, E.; Shacklett, B.L.; Ferre, A.L.; Hayes, T.L.; Somsouk, M.; Hsue, P.Y.; et al. HIV-infected individuals with low CD4/CD8 ratio despite effective antiretroviral therapy exhibit altered T cell subsets, heightened CD8+ T cell activation, and increased risk of non-AIDS morbidity and mortality. PLoS Pathog. 2014, 10, e1004078. [Google Scholar] [CrossRef] [PubMed]
- Han, W.M.; Apornpong, T.; Kerr, S.J.; Hiransuthikul, A.; Gatechompol, S.; Do, T.; Ruxrungtham, K.; Avihingsanon, A. CD4/CD8 ratio normalization rates and low ratio as prognostic marker for non-AIDS defining events among long-term virologically suppressed people living with HIV. AIDS Res. Ther. 2018, 15, 13. [Google Scholar] [CrossRef]
- Duffau, P.; Ozanne, A.; Bonnet, F.; Lazaro, E.; Cazanave, C.; Blanco, P.; Riviere, E.; Desclaux, A.; Hyernard, C.; Gensous, N.; et al. Multimorbidity, age-related comorbidities and mortality: Association of activation, senescence and inflammation markers in HIV adults. AIDS 2018, 32, 1651–1660. [Google Scholar] [CrossRef] [PubMed]
- Castilho, J.L.; Bian, A.; Jenkins, C.A.; Shepherd, B.E.; Sigel, K.; Gill, M.J.; Kitahata, M.M.; Silverberg, M.J.; Mayor, A.M.; Coburn, S.B.; et al. CD4/CD8 Ratio and Cancer Risk among Adults with HIV. J. Natl. Cancer Inst. 2022, 114, 854–862. [Google Scholar] [CrossRef]
- Novak, R.M.; Armon, C.; Battalora, L.; Buchacz, K.; Li, J.; Ward, D.; Carlson, K.; Palella, F.J., Jr. Aging, trends in CD4+/CD8+ cell ratio, and clinical outcomes with persistent HIV suppression in a dynamic cohort of ambulatory HIV patients. AIDS 2022, 36, 815–827. [Google Scholar] [CrossRef]
- Passos, D.F.; Bremm, J.M.; da Silveira, L.L.; Jantsch, M.H.; da Silva, J.L.G.; Disconzi, E.; Rezer, J.F.P.; Schwarzbold, A.V.; Marques, A.C.F.; Schetinger, M.R.C.; et al. CD4/CD8 ratio, comorbidities, and aging in treated HIV infected individuals on viral suppression. J. Med. Virol. 2020, 92, 3254–3264. [Google Scholar] [CrossRef]
- Castilho, J.L.; Shepherd, B.E.; Koethe, J.; Turner, M.; Bebawy, S.; Logan, J.; Rogers, W.B.; Raffanti, S.; Sterling, T.R. CD4+/CD8+ ratio, age, and risk of serious noncommunicable diseases in HIV-infected adults on antiretroviral therapy. AIDS 2016, 30, 899–908. [Google Scholar] [CrossRef]
- Saracino, A.; Bruno, G.; Scudeller, L.; Volpe, A.; Caricato, P.; Ladisa, N.; Monno, L.; Angarano, G. Chronic inflammation in a long-term cohort of HIV-infected patients according to the normalization of the CD4:CD8 ratio. AIDS Res. Hum. Retrovir. 2014, 30, 1178–1184. [Google Scholar] [CrossRef]
- Taylor, J.M.; Fahey, J.L.; Detels, R.; Giorgi, J.V. CD4 percentage, CD4 number, and CD4:CD8 ratio in HIV infection: Which to choose and how to use. J. Acquir. Immune. Defic. Syndr. 1989, 2, 114–124. [Google Scholar]
- Sainz, T.; Serrano-Villar, S.; Diaz, L.; Gonzalez Tome, M.I.; Gurbindo, M.D.; de Jose, M.I.; Mellado, M.J.; Ramos, J.T.; Zamora, J.; Moreno, S.; et al. The CD4/CD8 ratio as a marker T-cell activation, senescence and activation/exhaustion in treated HIV-infected children and young adults. AIDS 2013, 27, 1513–1516. [Google Scholar] [CrossRef] [PubMed]
- Serrano-Villar, S.; Gutierrez, C.; Vallejo, A.; Hernandez-Novoa, B.; Diaz, L.; Abad Fernandez, M.; Madrid, N.; Dronda, F.; Zamora, J.; Munoz-Fernandez, M.A.; et al. The CD4/CD8 ratio in HIV-infected subjects is independently associated with T-cell activation despite long-term viral suppression. J. Infect. 2013, 66, 57–66. [Google Scholar] [CrossRef] [PubMed]
- Trickey, A.; May, M.T.; Schommers, P.; Tate, J.; Ingle, S.M.; Guest, J.L.; Gill, M.J.; Zangerle, R.; Saag, M.; Reiss, P.; et al. CD4:CD8 Ratio and CD8 Count as Prognostic Markers for Mortality in Human Immunodeficiency Virus-Infected Patients on Antiretroviral Therapy: The Antiretroviral Therapy Cohort Collaboration (ART-CC). Clin. Infect. Dis. 2017, 65, 959–966. [Google Scholar] [CrossRef] [PubMed]
- El-Masri, M.M.; Fox-Wasylyshyn, S.M. Methodological issues associated with using different cut-off points to categorize outcome variables. Can. J. Nurs. Res. 2006, 38, 162–172. [Google Scholar]
- Kwon, J.Y.; Sawatzky, R.; Baumbusch, J.; Lauck, S.; Ratner, P.A. Growth mixture models: A case example of the longitudinal analysis of patient-reported outcomes data captured by a clinical registry. BMC Med. Res. Methodol. 2021, 21, 79. [Google Scholar] [CrossRef]
- Heath, K.; Samji, H.; Nosyk, B.; Colley, G.; Gilbert, M.; Hogg, R.S.; Montaner, J.S.; STOP HIV/AIDS Study Group. Cohort profile: Seek and treat for the optimal prevention of HIV/AIDS in British Columbia (STOP HIV/AIDS BC). Int. J. Epidemiol. 2014, 43, 1073–1081. [Google Scholar] [CrossRef]
- British Columbia Centre for Disease Control. HIV/AIDS Information System (HAISYS); British Columbia Centre for Disease Control: Vancouver, BC, Canada; Available online: http://www.bccdc.ca/about/accountability/data-access-requests/public-health-data (accessed on 12 October 2021).
- British Columbia Centre for Disease Control Public Health Laboratory. HIV Laboratory Testing Datasets (Tests: ELISA, Western blot, NAAT, p24, Culture); British Columbia Centre for Disease Control Public Health Laboratory: Vancouver, BC, Canada.
- British Columbia Centre for Excellence in HIV/AIDS (BCCfE). Drug Treatment Program. Available online: http://cfenet.ubc.ca/drug-treatment-program (accessed on 12 October 2021).
- British Columbia Ministry of Health [creator] (2016):. Medical Services Plan (MSP) Payment Information File; Consolidation File (MSP Registration & Premium Billing); Home & Community Care (Continuing Care); Mental Health; PharmaNet. Available online: http://www2.gov.bc.ca/gov/content/health/conducting-health-research-evaluation/data-access-health-data-central. (accessed on 12 October 2021).
- British Columbia Vital Statistics Agency. Vital Statistics; British Columbia Vital Statistics Agency: Vancouver, BC, Canada, 2016. [Google Scholar]
- Canadian Institute for Health Information. Discharge Abstract Database (Hospital Separations); Canadian Institute for Health Information: Ottawa, ON, Canada, 2016. [Google Scholar]
- Chronic Disease Information Working Group. BC Chronic Disease and Selected Procedure Case Definitions, Case Definition Chronic Kidney Disease (Global Burden of Disease) Version 2018. Available online: http://www.bccdc.ca/resource-gallery/Documents/Chronic-Disease-Dashboard/chronic-kidney-disease.pdf (accessed on 12 October 2021).
- Patterson, S.; Cescon, A.; Samji, H.; Cui, Z.; Yip, B.; Lepik, K.J.; Moore, D.; Lima, V.D.; Nosyk, B.; Harrigan, P.R.; et al. Cohort Profile: HAART Observational Medical Evaluation and Research (HOMER) cohort. Int. J. Epidemiol. 2015, 44, 58–67. [Google Scholar] [CrossRef]
- Piske, M.; Zhou, H.; Min, J.E.; Hongdilokkul, N.; Pearce, L.A.; Homayra, F.; Socias, M.E.; McGowan, G.; Nosyk, B. The cascade of care for opioid use disorder: A retrospective study in British Columbia, Canada. Addiction 2020, 115, 1482–1493. [Google Scholar] [CrossRef]
- Lima, V.D.; Sierra-Madero, J.; Wu, Z.; Singer, J.; Wood, E.; Hull, M.W.; Richard Harrigan, P.; Montaner, J.S. Comparing the efficacy of efavirenz and boosted lopinavir using viremia copy-years. J. Int. AIDS Soc. 2014, 17, 18617. [Google Scholar] [CrossRef]
- Ram, N.; Grimm, K.J. Growth Mixture Modeling: A Method for Identifying Differences in Longitudinal Change among Unobserved Groups. Int. J. Behav. Dev. 2009, 33, 565–576. [Google Scholar] [CrossRef]
- Jung, T.; Wickrama, K.A.S. An Introduction to Latent Class Growth Analysis and Growth Mixture Modeling: Latent Trajectory Classes. Soc. Personal. Psychol. Compass 2008, 2, 302–317. [Google Scholar] [CrossRef]
- Nylund, K.L.; Asparouhov, T.; Muthén, B.O. Deciding on the number of classes in latent class analysis and growth mixture modeling: A Monte Carlo simulation study. Struct. Equ. Model. Multidiscip. J. 2007, 14, 535–569. [Google Scholar] [CrossRef]
- Peugh, J.; Fan, X. How well does growth mixture modeling identify heterogeneous growth trajectories? A simulation study examining GMM’s performance characteristics. Struct. Equ. Model. Multidiscip. J. 2012, 19, 204–226. [Google Scholar] [CrossRef]
- Pinheiro, J.; Bates, D. Mixed-Effects Models in S and S-PLUS; Springer: New York, NY, USA, 2000. [Google Scholar]
- McCullagh, P.; Nelder, J.A. Generalized Linear Models, 2nd ed.; Springer-Science+Business Media, B.V.: Dordrecht, The Netherlands, 1989. [Google Scholar]
- Gazzola, L.; Tincati, C.; Bellistri, G.M.; Monforte, A.; Marchetti, G. The absence of CD4+ T cell count recovery despite receipt of virologically suppressive highly active antiretroviral therapy: Clinical risk, immunological gaps, and therapeutic options. Clin. Infect. Dis. 2009, 48, 328–337. [Google Scholar] [CrossRef]
- Piccoli, G.B.; Alrukhaimi, M.; Liu, Z.H.; Zakharova, E.; Levin, A.; World Kidney Day Steering Committee. What we do and do not know about women and kidney diseases; questions unanswered and answers unquestioned: Reflection on World Kidney Day and International Woman’s Day. BMC Nephrol. 2018, 19, 66. [Google Scholar] [CrossRef] [PubMed]
- Ashuntantang, G.E.; Garovic, V.D.; Heilberg, I.P.; Lightstone, L. Kidneys and women’s health: Key challenges and considerations. Nat. Rev. Nephrol. 2018, 14, 203–210. [Google Scholar] [CrossRef]
- Seidu, S.; Barrat, J.; Khunti, K. Clinical update: The important role of dual kidney function testing (ACR and eGFR) in primary care: Identification of risk and management in type 2 diabetes. Prim. Care Diabetes 2020, 14, 370–375. [Google Scholar] [CrossRef] [PubMed]
- Alaini, A.; Malhotra, D.; Rondon-Berrios, H.; Argyropoulos, C.P.; Khitan, Z.J.; Raj, D.S.C.; Rohrscheib, M.; Shapiro, J.I.; Tzamaloukas, A.H. Establishing the presence or absence of chronic kidney disease: Uses and limitations of formulas estimating the glomerular filtration rate. World J. Methodol. 2017, 7, 73–92. [Google Scholar] [CrossRef] [PubMed]
- Botev, R.; Mallie, J.P.; Wetzels, J.F.; Couchoud, C.; Schuck, O. The clinician and estimation of glomerular filtration rate by creatinine-based formulas: Current limitations and quo vadis. Clin. J. Am. Soc. Nephrol. 2011, 6, 937–950. [Google Scholar] [CrossRef]
- Castilho, J.L.; Turner, M.; Shepherd, B.E.; Koethe, J.R.; Furukawa, S.S.; Bofill, C.E.; Raffanti, S.; Sterling, T.R. CD4/CD8 Ratio and CD4 Nadir Predict Mortality Following Noncommunicable Disease Diagnosis in Adults Living with HIV. AIDS Res. Hum. Retrovir. 2019, 35, 960–967. [Google Scholar] [CrossRef]
- Qin, F.; Lv, Q.; Hong, W.; Wei, D.; Huang, K.; Lan, K.; Chen, R.; Liu, J.; Liang, B.; Liang, H.; et al. Association between CD4/CD8 Ratio Recovery and Chronic Kidney Disease among Human Immunodeficiency Virus-Infected Patients Receiving Antiretroviral Therapy: A 17-Year Observational Cohort Study. Front. Microbiol. 2022, 13, 827689. [Google Scholar] [CrossRef] [PubMed]
- Serrano-Villar, S.; Deeks, S.G. CD4/CD8 ratio: An emerging biomarker for HIV. Lancet HIV 2015, 2, e76–e77. [Google Scholar] [CrossRef] [PubMed]
- Hoekstra, T.; Barbosa-Leiker, C.; Koppes, L.L.J.; Twisk, J.W.R. Developmental trajectories of body mass index throughout the life course: An application of Latent Class Growth (Mixture) Modelling. Longitud. Life Course Stud. 2011, 2, 319–330. [Google Scholar] [CrossRef]
- Brummel, S.S.; Van Dyke, R.B.; Patel, K.; Purswani, M.; Seage, G.R.; Yao, T.J.; Hazra, R.; Karalius, B.; Williams, P.L.; Pediatric HIV/AIDS Cohort Study. Analyzing Longitudinally Collected Viral Load Measurements in Youth with Perinatally Acquired HIV Infection: Problems and Possible Remedies. Am. J. Epidemiol. 2022, 191, 1820–1830. [Google Scholar] [CrossRef]


| Overall N = 4863 | Did Not Develop CKD N = 4553 | Developed CKD N = 310 | ||
|---|---|---|---|---|
| Risk factors | N (%) | N (row %) | N (row %) | p-value |
| Sex | 0.0010 | |||
| Female | 867 (17.8) | 789 (91.0) | 78 (9.0) | |
| Male | 3996 (82.2) | 3764 (94.2) | 232 (5.8) | |
| SUD | <0.0001 | |||
| No | 2784 (57.3) | 2674 (96.0) | 110 (4.0) | |
| Yes | 1685 (34.7) | 1495 (88.7) | 190 (11.3) | |
| Unknown | 394 (8.1) | 384 (97.5) | 10 (2.5) | |
| ART naïve | 0.0009 | |||
| Yes | 4359 (89.6) | 4064 (93.2) | 295 (6.8) | |
| No | 504 (10.4) | 489 (97.0) | 15 (3.0) | |
| Year of baseline date | <0.0001 | |||
| 2000–2004 | 1026 (21.1) | 876 (85.4) | 150 (14.6) | |
| 2005–2010 | 2012 (41.4) | 1884 (93.6) | 128 (6.4) | |
| 2011–2016 | 1825 (37.5) | 1793 (98.2) | 32 (1.8) | |
| Hypertension during follow-up | <0.0001 | |||
| No | 4241 (87.2) | 3996 (94.2) | 245 (5.8) | |
| Yes | 622 (12.8) | 557 (89.5) | 65 (10.5) | |
| Diabetes during follow-up | <0.0001 | |||
| No | 4476 (92.0) | 4209 (94.0) | 267 (6.0) | |
| Yes | 387 (8.0) | 344 (88.9) | 43 (11.1) | |
| CVD during follow-up | <0.0001 | |||
| No | 4528 (93.1) | 4271 (94.3) | 257 (5.7) | |
| Yes | 335 (6.9) | 282 (84.2) | 53 (15.8) | |
| Hypertension duration | <0.0001 | |||
| No disease | 4241 (87.2) | 3996 (94.2) | 245 (5.8) | |
| <median duration (4.8 years) | 311 (6.4) | 271 (87.1) | 40 (12.9) | |
| ≥median duration (4.8 years) | 311 (6.4) | 286 (92.0) | 25 (8.0) | |
| Diabetes duration | <0.0001 | |||
| No disease | 4476 (92.0) | 4209 (94.0) | 267 (6.0) | |
| <median duration (4.2 years) | 193 (4.0) | 170 (88.1) | 23 (11.9) | |
| ≥median duration (4.2 years) | 194 (4.0) | 174 (89.7) | 20 (10.3) | |
| CVD duration | <0.0001 | |||
| No disease | 4528 (93.1) | 4271 (94.3) | 257 (5.7) | |
| <median duration (3.2 years) | 167 (3.4) | 133 (79.6) | 34 (20.4) | |
| ≥median duration (3.2 years) | 168 (3.5) | 149 (88.7) | 19 (11.3) | |
| Median (Q1, Q3) | Median (Q1, Q3) | Median (Q1, Q3) | p-value | |
| Age at baseline (year) | 41 (34, 49) | 41 (34, 49) | 43 (36, 52) | 0.0010 |
| Age at the end of follow-up (year) | 49 (41, 56) | 49 (41, 56) | 49 (41, 57) | 0.6241 |
| CD4 Nadir (cells/µL) | 250 (110, 410) | 260 (120, 420) | 110 (40, 200) | <0.0001 |
| CD4 Nadir within one year prior to the end (cells/µL) | 480 (300, 670) | 500 (320, 680) | 210 (80, 387) | <0.0001 |
| Baseline viral load (log10 copies/mL) | 4.7 (3.7, 5.0) | 4.6 (3.6, 5.0) | 5.0 (4.4, 5.0) | <0.0001 |
| AUVLC (log10 copy-years/mL) | 12.5(6.9, 19.5) | 12.6 (7.0, 19.6) | 11.9 (5.6, 17.5) | 0.0054 |
| Follow-up time (year) | 6.4 (3.6, 9.9) | 6.6 (3.7, 10.0) | 4.5 (2.4, 8.1) | <0.0001 |
| Proportion of time on TDF | 0.7 (0.1, 0.9) | 0.7 (0.2, 1.0) | 0.3 (0, 0.8) | <0.0001 |
| Proportion of time on PI | 0.2 (0, 0.8) | 0.2 (0, 0.8) | 0.5 (0, 0.9) | <0.0001 |
| Proportion of time on NNRTI | 0.0 (0, 0.8) | 0.0 (0, 0.8) | 0.0 (0, 0.6) | 0.2729 |
| Number of Participants | Number of Participants Who Did Not Developed CKD | Number of Participants Who Developed CKD | CKD Rate, 95% CI (per 1000 Person-Years) | Rate Ratio (95% CI) | |
|---|---|---|---|---|---|
| Two-class linear model (unconditional) | |||||
| Class 1 | 4725 | 4442 | 283 | 8.49 (7.55–9.53) | Reference |
| Class 2 | 138 | 111 | 27 | 32.70 (22.43–47.69) | 3.85 (2.60–5.72) |
| Two-class linear model (time-invariant covariates) | |||||
| Class 1 | 4547 | 4303 | 244 | 7.36 (6.49–8.34) | Reference |
| Class 2 | 316 | 250 | 66 | 64.16 (50.41–81.67) | 8.72 (6.64–11.44) |
| Class 1 | Class 2 | |||||
|---|---|---|---|---|---|---|
| CKD No (n = 4303) | CKD Yes (n = 244) | CKD No (n = 250) | CKD Yes (n = 66) | |||
| Risk factors | N (row %) | N (row %) | p-Value | N (row %) | N (row %) | p-value |
| Sex | 0.0090 | 0.2790 | ||||
| Female | 726 (92.7) | 57 (7.3) | 63 (75.0) | 21 (25.0) | ||
| Male | 3577 (95.0) | 187 (5.0) | 187 (80.6) | 45 (19.4) | ||
| SUD | <0.0001 | 0.0084 | ||||
| No | 2567 (96.5) | 94 (3.5) | 107 (87.0) | 16 (13.0) | ||
| Yes | 1362 (90.6) | 141 (9.4) | 133 (73.1) | 46–49 * | ||
| Unknown | 374 (97.7) | 9 (2.3) | 10 (90.9) | <5 ** | ||
| ARV naïve | 0.0138 | 0.0129 | ||||
| Yes | 3843 (94.4) | 230 (5.6) | 221 (77.3) | 62–64 * | ||
| No | 460 (97.0) | 14 (3.0) | 29 (96.7) | <5 ** | ||
| Year of baseline date | <0.0001 | <0.0001 | ||||
| 2000–2004 | 808 (87.5) | 115 (12.5) | 68 (66.0) | 35 (34.0) | ||
| 2005–2010 | 1814 (94.5) | 106 (5.5) | 70 (76.1) | 22 (23.9) | ||
| 2011–2016 | 1681 (98.7) | 23 (1.3) | 112 (92.6) | 9 (7.4) | ||
| Hypertension duration | <0.0001 | 0.9990 | ||||
| No disease | 3764 (95.3) | 184 (4.7) | 232 (79.2) | 61 (20.8) | ||
| <median duration (4.8 years) | 256 (87.7) | 36 (12.3) | 15 (78.9) | <5 ** | ||
| ≥median duration (4.8 years) | 283 (92.2) | 24 (7.8) | <5 (75.0) | <5 ** | ||
| Diabetes duration | <0.0001 | 0.3850 | ||||
| No disease | 3970 (95.1) | 205 (4.9) | 239 (79.4) | 62 (20.6) | ||
| <median duration (4.2 years) | 160 (88.9) | 20 (11.1) | 10 (76.9) | <5 ** | ||
| ≥median duration (4.2 years) | 173 (90.1) | 19 (9.9) | 1 (50.0) | <5 ** | ||
| CVD duration | <0.0001 | 0.5507 | ||||
| No disease | 4031 (95.4) | 195 (4.6) | 240 (79.5) | 62 (20.5) | ||
| <median duration (3.2 years) | 126 (80.3) | 31 (19.7) | 6–9 | <5 ** | ||
| ≥median duration (3.2 years) | 146 (89.0) | 18 (11.0) | <5 ** | <5 ** | ||
| Median (Q1, Q3) | Median (Q1, Q3) | p-Value | Median (Q1, Q3) | Median (Q1, Q3) | p-value | |
| Age at baseline | 41 (34–49) | 44 (37–53) | <0.0001 | 43 (34–49) | 38 (31–45) | 0.0048 |
| CD4 Nadir within one year prior to the end (cells/µL) | 520 (360–690) | 270 (150–440) | <0.0001 | 70 (20–130) | 30 (10–60) | <0.0001 |
| AUVLC (log10 copy-years/mL) | 12.7 (7.4–19.8) | 12.2 (6.0–17.9) | 0.0587 | 8.9 (3.6–16.0) | 8.7 (3.8–15.4) | 0.9469 |
| Follow-up time (year) | 6.9 (4.0–10.2) | 5.8 (2.9–8.5) | <0.0001 | 2.5 (1.4–4.9) | 2.5 (1.1–3.9) | 0.3473 |
| Proportion of time on TDF | 0.7 (0.2–1.0) | 0.4 (0–0.9) | <0.0001 | 0.2 (0–0.6) | 0.2 (0–0.4) | 0.0286 |
| Proportion of time on PI | 0.2 (0–0.8) | 0.6 (0–0.9) | <0.0001 | 0.2 (0–0.5) | 0.2 (0–0.5) | 0.6681 |
| Proportion of time on NNRTI | 0.1 (0–0.8) | 0.04 (0–0.8) | 0.5783 | 0 (0–0.2) | 0 (0–0.2) | 0.1088 |
| Sex | Number of Participants | Number of Participants Who Developed CKS | CKD Rate, 95% CI (per 1000 Person-Years) | Rate Ratio (95% CI) |
|---|---|---|---|---|
| Male | 3996 | 232 | 8.28 (7.28–9.41) | Ref |
| Female | 867 | 78 | 12.68 (10.16–15.83) | 1.53 (1.19–1.98) |
Disclaimer/Publisher’s Note: The statements, opinions and data contained in all publications are solely those of the individual author(s) and contributor(s) and not of MDPI and/or the editor(s). MDPI and/or the editor(s) disclaim responsibility for any injury to people or property resulting from any ideas, methods, instructions or products referred to in the content. |
© 2023 by the authors. Licensee MDPI, Basel, Switzerland. This article is an open access article distributed under the terms and conditions of the Creative Commons Attribution (CC BY) license (https://creativecommons.org/licenses/by/4.0/).
Share and Cite
Fonseca-Cuevas, A.; Newsome, P.; Wang, L.; Chen, M.Y.; Richardson, C.G.; Hull, M.; McLinden, T.; Guillemi, S.; Barrios, R.; Montaner, J.S.G.; et al. Identifying Longitudinal CD4:CD8 Ratio Trajectories Indicative of Chronic Renal Disease Risk among People Living with HIV: An Application of Growth Mixture Models. Viruses 2023, 15, 385. https://doi.org/10.3390/v15020385
Fonseca-Cuevas A, Newsome P, Wang L, Chen MY, Richardson CG, Hull M, McLinden T, Guillemi S, Barrios R, Montaner JSG, et al. Identifying Longitudinal CD4:CD8 Ratio Trajectories Indicative of Chronic Renal Disease Risk among People Living with HIV: An Application of Growth Mixture Models. Viruses. 2023; 15(2):385. https://doi.org/10.3390/v15020385
Chicago/Turabian StyleFonseca-Cuevas, Alejandra, Patrick Newsome, Lu Wang, Michelle Y. Chen, Chris G. Richardson, Mark Hull, Taylor McLinden, Silvia Guillemi, Rolando Barrios, Julio S. G. Montaner, and et al. 2023. "Identifying Longitudinal CD4:CD8 Ratio Trajectories Indicative of Chronic Renal Disease Risk among People Living with HIV: An Application of Growth Mixture Models" Viruses 15, no. 2: 385. https://doi.org/10.3390/v15020385
APA StyleFonseca-Cuevas, A., Newsome, P., Wang, L., Chen, M. Y., Richardson, C. G., Hull, M., McLinden, T., Guillemi, S., Barrios, R., Montaner, J. S. G., & Lima, V. D. (2023). Identifying Longitudinal CD4:CD8 Ratio Trajectories Indicative of Chronic Renal Disease Risk among People Living with HIV: An Application of Growth Mixture Models. Viruses, 15(2), 385. https://doi.org/10.3390/v15020385