
Analyses of S Protein Homology Using the Genomes of SARS-CoV-2 Specimens Unveil Missing Links in the Temporal Order of Mutations in Its Variants


Abstract
:1. Introduction
2. Materials and Methods
2.1. Data Acquisition
2.2. Data Processing
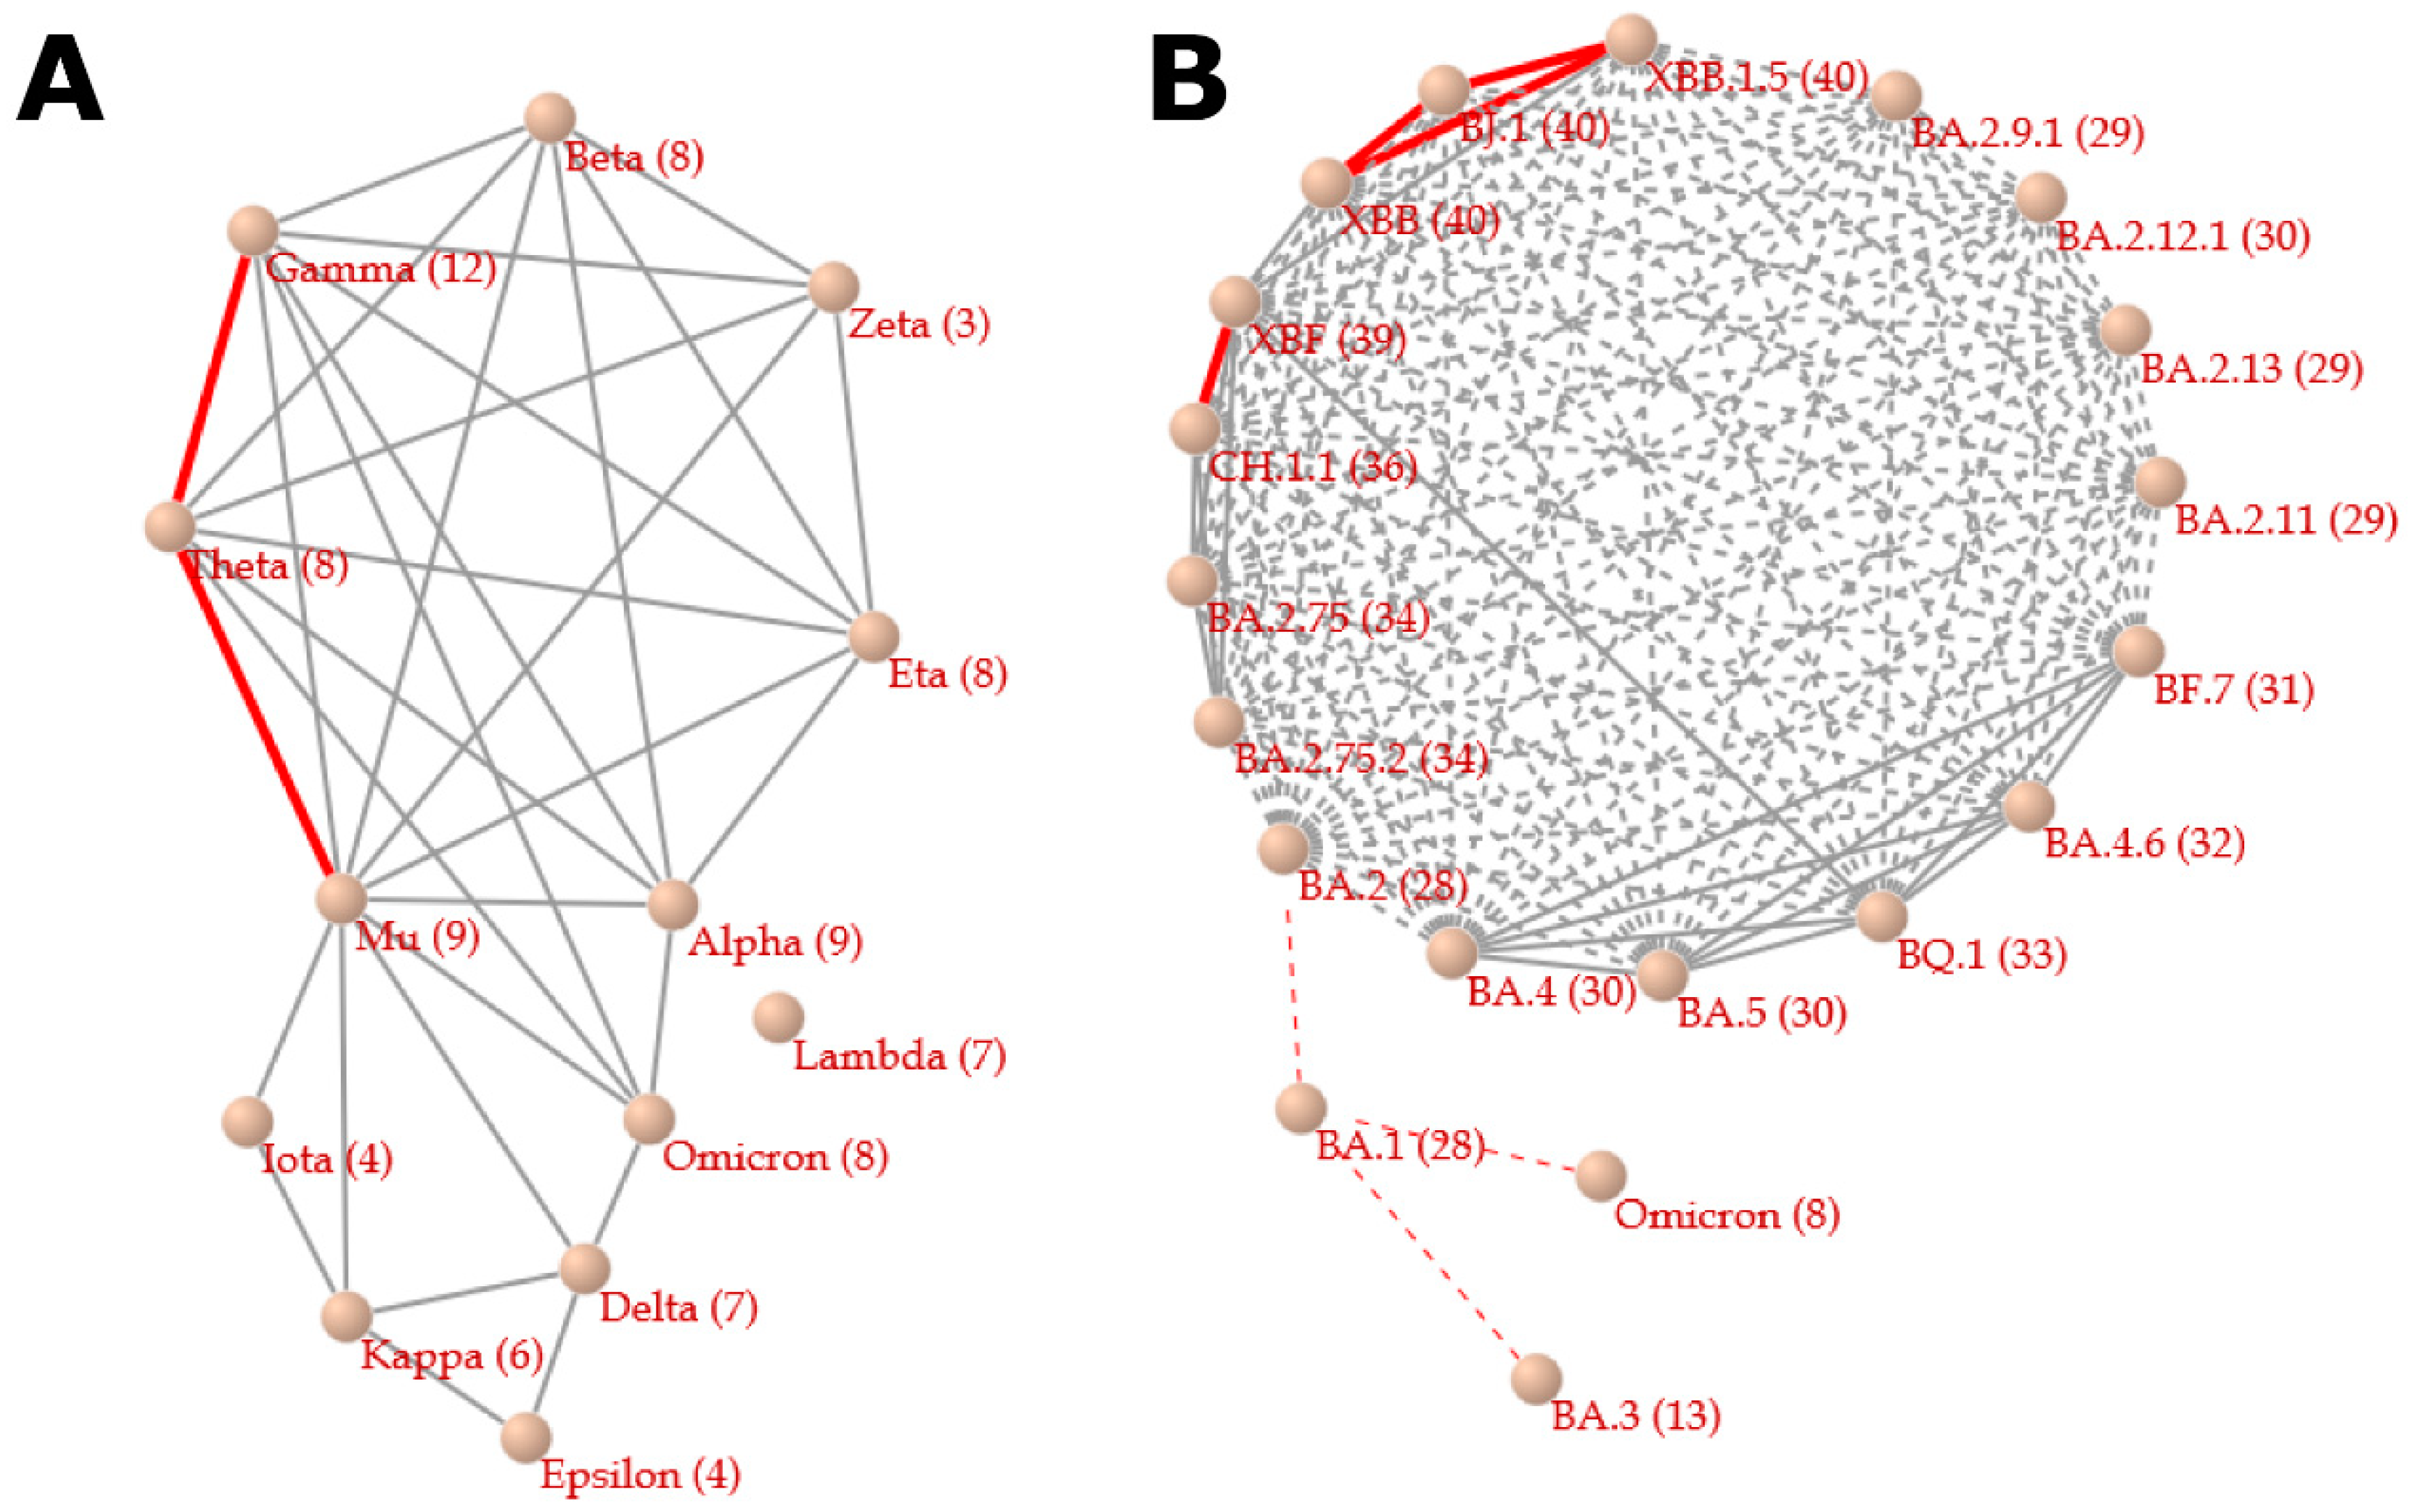
2.3. Correlation Network between Variants
2.4. Correlation Network between Mutations
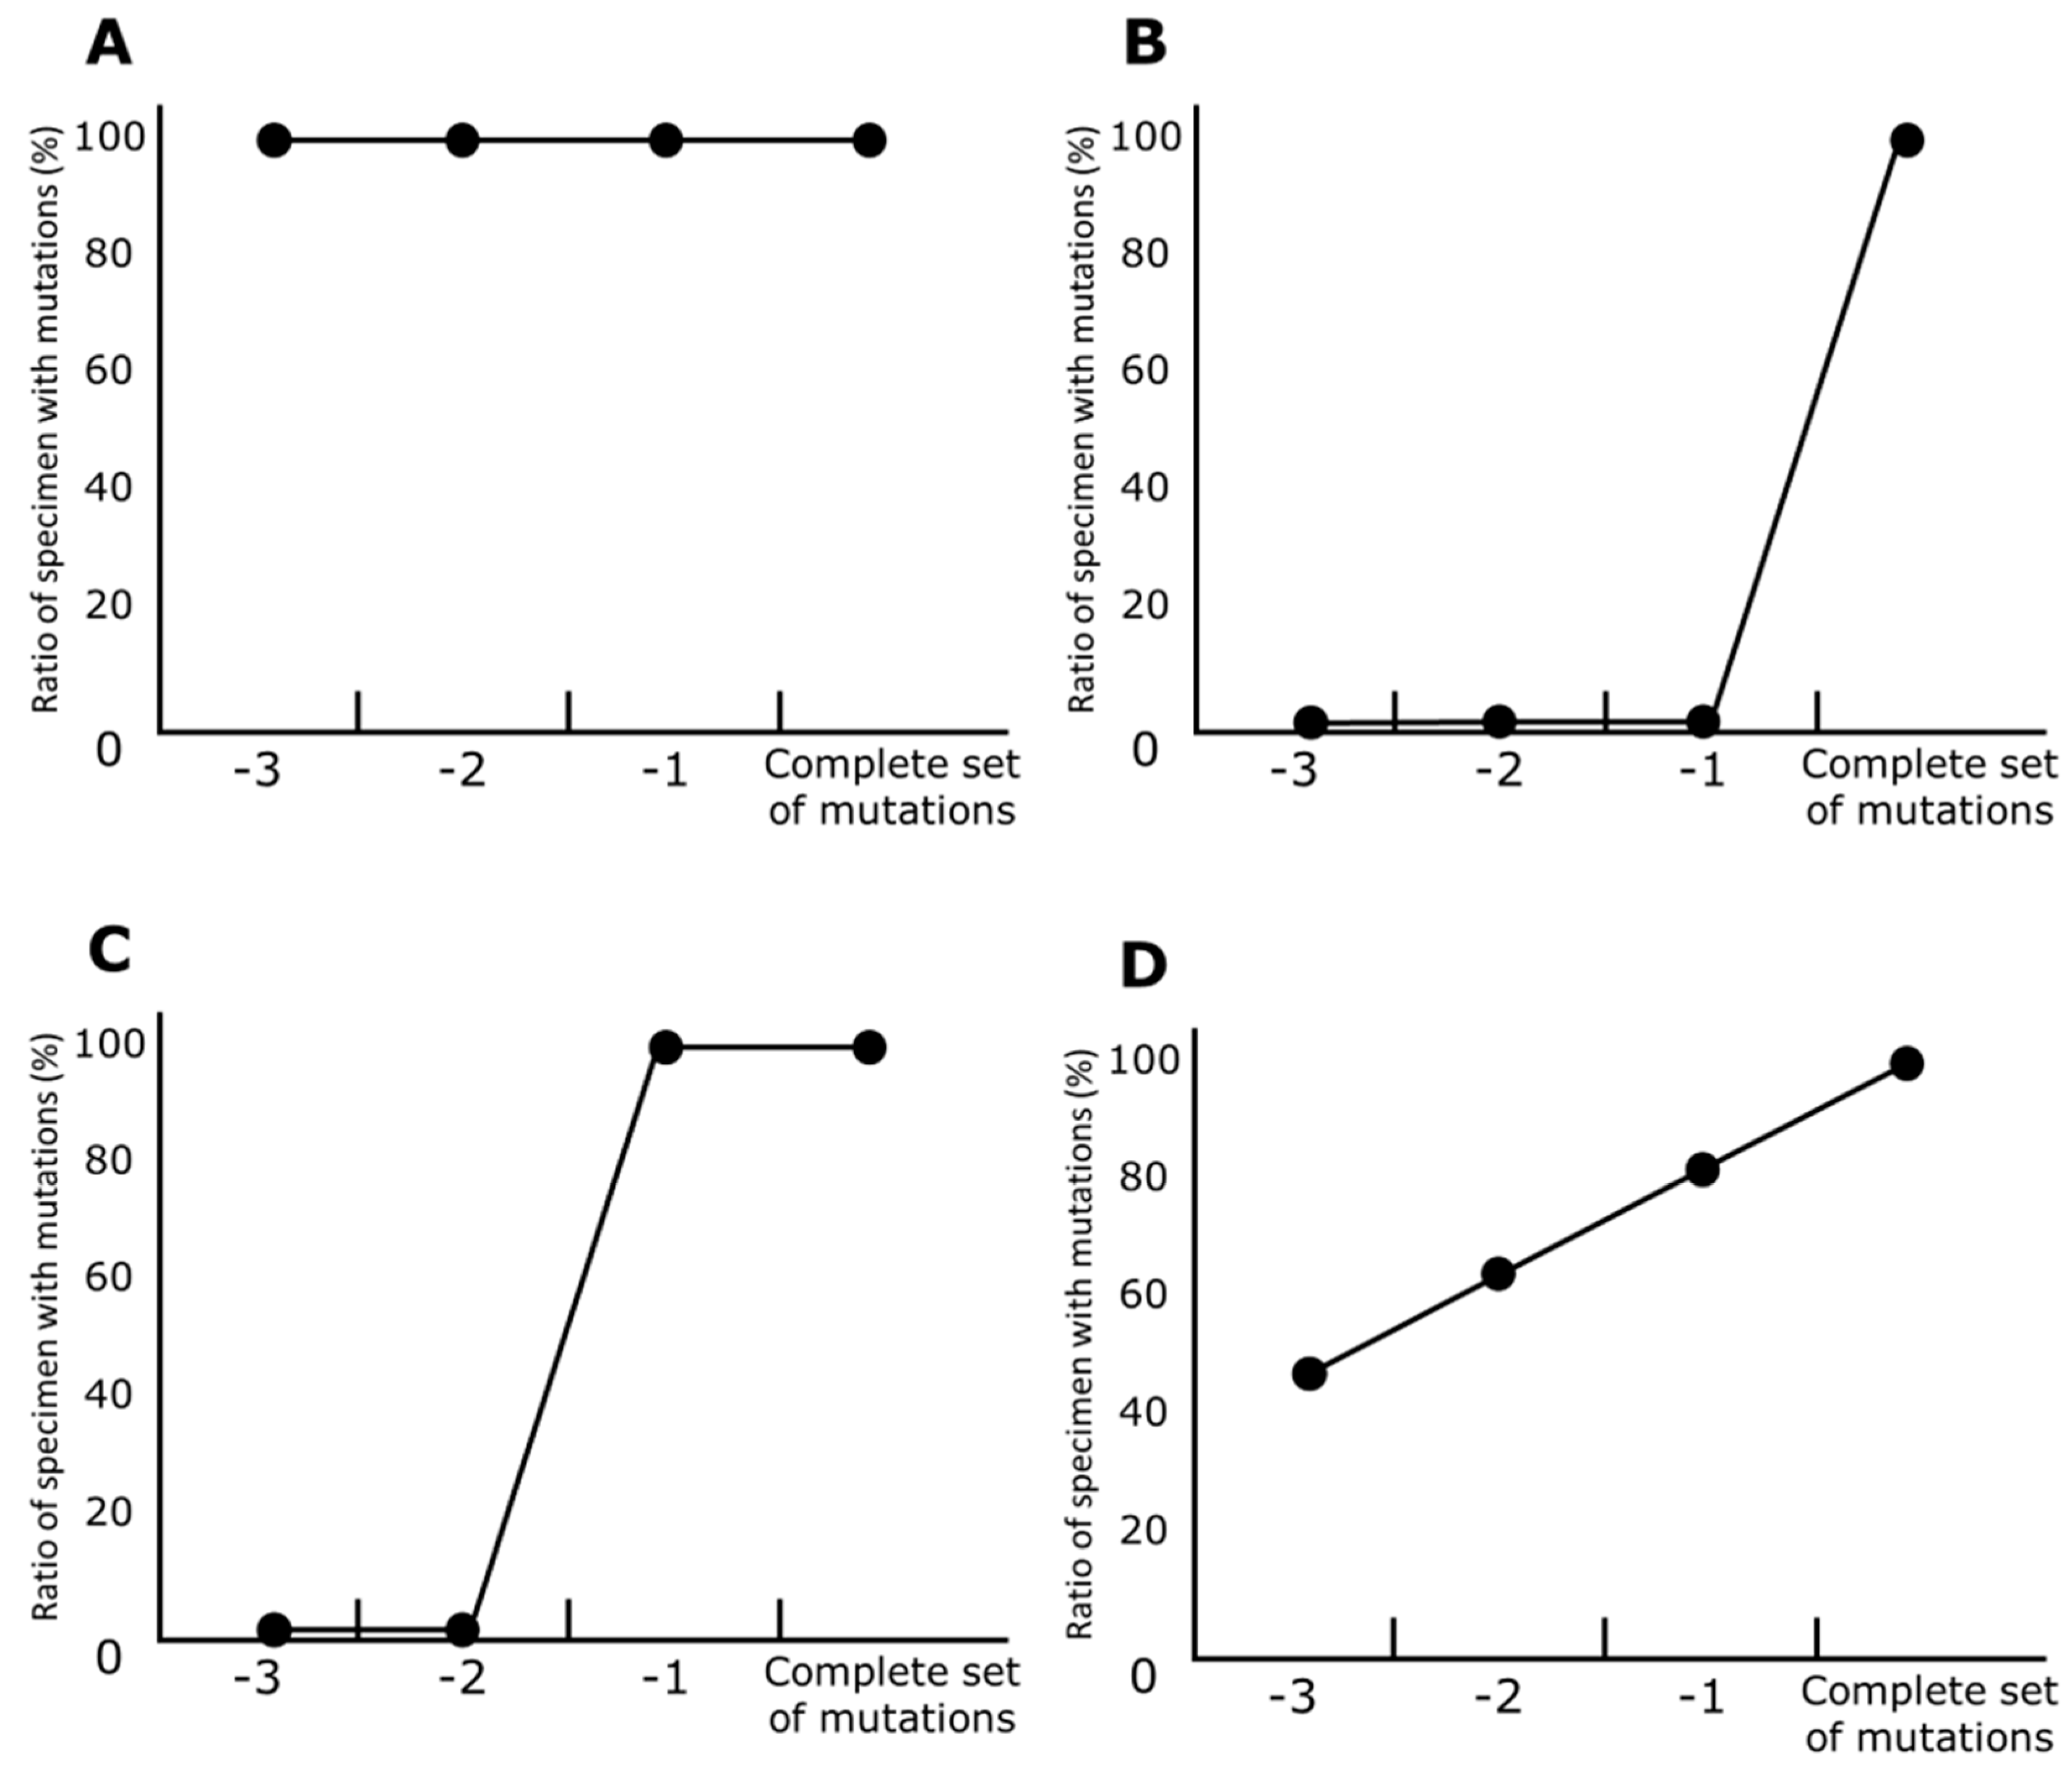
2.5. Line Charts of Prevariant Mutation
- First, specimens carrying a complete set of mutations in a particular variant (e.g., in the Alpha variant, 9 mutations) are selected. In these specimens, the ratio of any mutations was one (100%).
- Specimens that contain all mutations except any single mutation are selected (e.g., in Alpha, 8 mutations). The ratio of specimens that contain a particular mutation to all the selected specimens is calculated for each mutation. If a mutation is the last one to be harbored before a variant’s development, the ratio of the mutation is zero (0%).
- The previous step is repeated until the set of mutations is not discriminable from those in other variants. For example, 4 mutations (i.e., A570D, T716I, S982A, and D1118H) are carried only by Alpha, and, in contrast, the other 5 of Alpha’s mutations are also harbored in the other variants. Therefore, 6 or more mutations are valid for the calculation for Alpha.
2.6. Release of Networks and Line Charts from the Vcorn Database
3. Results
3.1. Relationships between Variants
3.2. Relationships Associated with Convergent Evolution between Mutations
3.3. Prevariant Mutations
3.3.1. Alpha
3.3.2. Beta
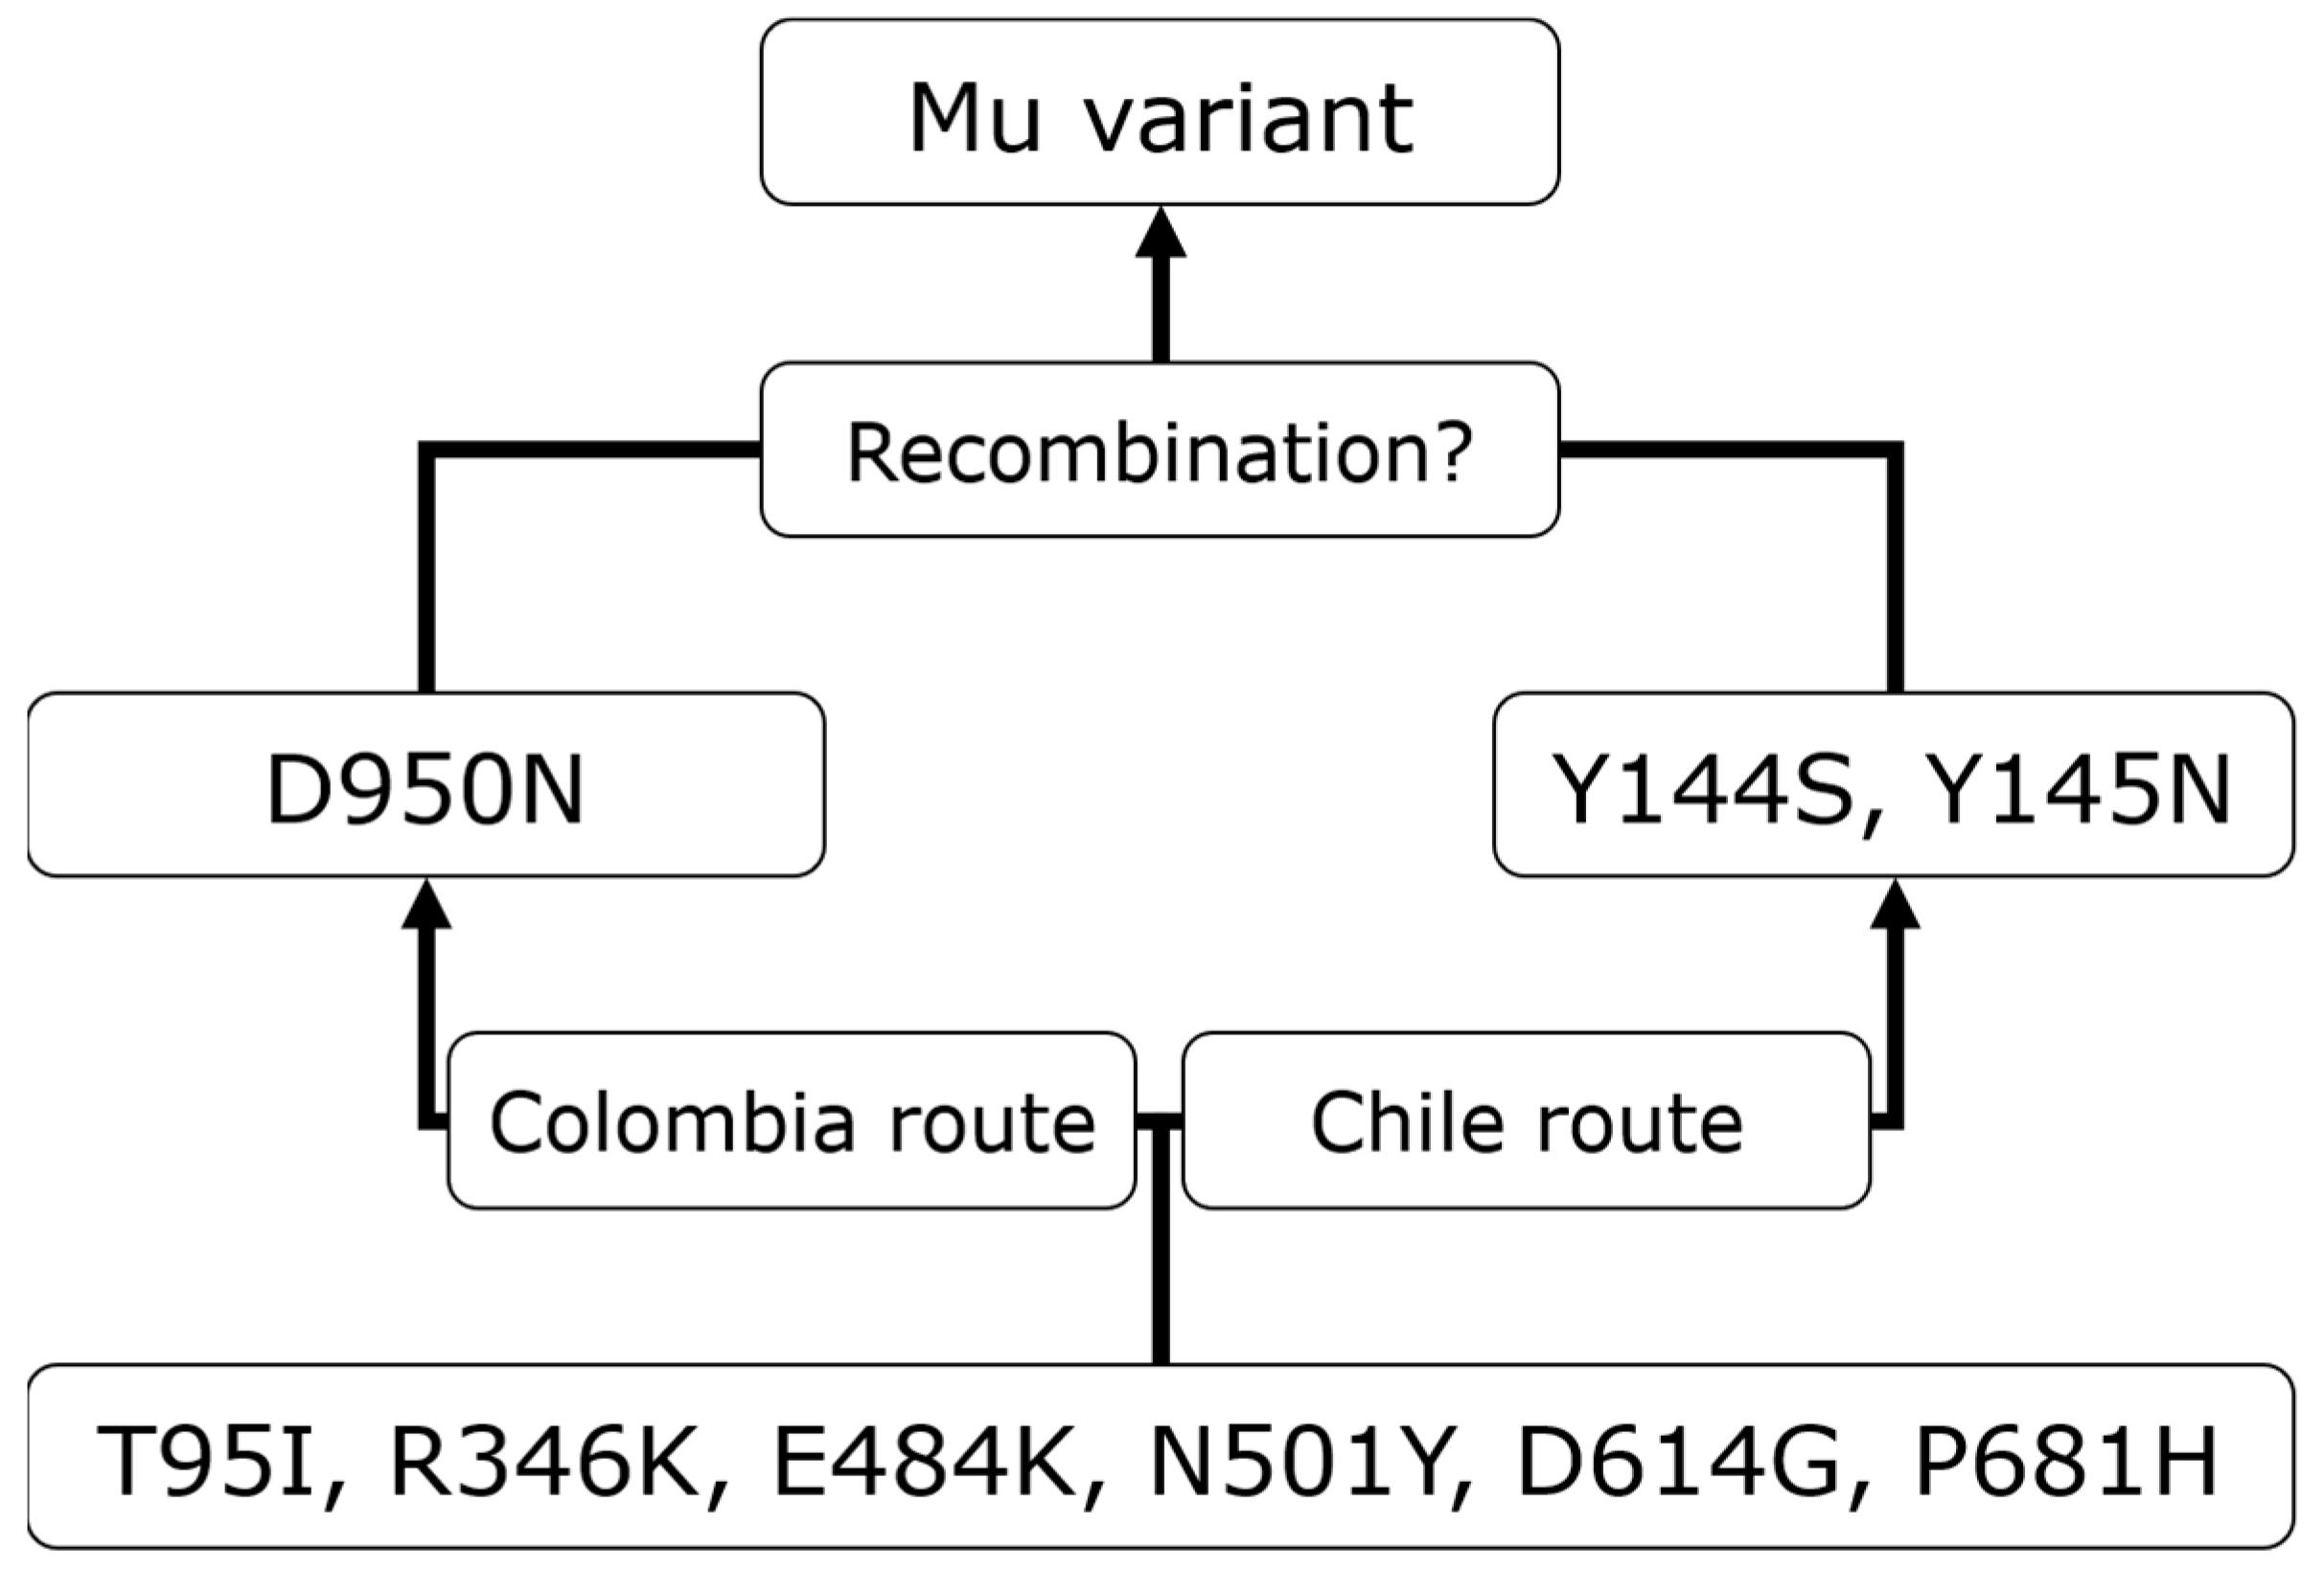
3.3.3. Mu
3.3.4. Gamma
3.3.5. Delta
3.3.6. Omicron
3.4. Mu’s Prevariant Mutation by Nation
4. Discussion
5. Conclusions
Author Contributions
Funding
Institutional Review Board Statement
Informed Consent Statement
Data Availability Statement
Acknowledgments
Conflicts of Interest
References
- Rambaut, A.; Holmes, E.C.; O’Toole, Á.; Hill, V.; McCrone, J.T.; Ruis, C.; du Plessis, L.; Pybus, O.G. A dynamic nomenclature proposal for SARS-CoV-2 lineages to assist genomic epidemiology. Nat. Microbiol. 2020, 5, 1403–1407. [Google Scholar] [CrossRef] [PubMed]
- O’Toole, Á.; Scher, E.; Underwood, A.; Jackson, B.; Hill, V.; McCrone, J.T.; Colquhoun, R.; Ruis, C.; Abu-Dahab, K.; Taylor, B.; et al. Assignment of epidemiological lineages in an emerging pandemic using the pangolin tool. Virus Evol. 2021, 7, veab064. [Google Scholar] [CrossRef] [PubMed]
- Khare, S.; Gurry, C.; Freitas, L.; Schultz, M.B.; Bach, G.; Diallo, A.; Akite, N.; Ho, J.; Lee, R.T.; Yeo, W.; et al. GISAID’s role in pandemic response. China CDC Wkly. 2021, 3, 1049–1051. [Google Scholar] [CrossRef] [PubMed]
- Hadfield, J.; Megill, C.; Bell, S.M.; Huddleston, J.; Potter, B.; Callender, C.; Sagulenko, P.; Bedford, T.; Neher, R.A. Nextstrain: Real-time tracking of pathogen evolution. Bioinformatics 2018, 34, 4121–4123. [Google Scholar] [CrossRef] [PubMed]
- Bansal, K.; Kumar, S. Mutational cascade of SARS-CoV-2 leading to evolution and emergence of omicron variant. Virus Res. 2022, 315, 198765. [Google Scholar] [CrossRef] [PubMed]
- Mustafa, Z.; Kalbacher, H.; Burster, T. Occurrence of a novel cleavage site for cathepsin G adjacent to the polybasic sequence within the proteolytically sensitive activation loop of the SARS-CoV-2 Omicron variant: The amino acid substitution N679K and P681H of the spike protein. PLoS ONE 2022, 17, e0264723. [Google Scholar] [CrossRef] [PubMed]
- O’Toole, Á.; Hill, V.; Pybus, O.G.; Watts, A.; Bogoch, I.I.; Khan, K.; Messina, J.P.; Tegally, H.; Lessells, R.R.; Giandhari, J.; et al. Tracking the international spread of SARS-CoV-2 lineages B.1.1.7 and B.1.351/501Y-V2 with grinch. Wellcome Open Res. 2021, 6, 121. [Google Scholar] [CrossRef] [PubMed]
- Hughes, L.; Gangavarapu, K.; Latif, A.A.; Mullen, J.; Alkuzweny, M.; Hufbauer, E.; Tsueng, G.; Haag, E.; Zeller, M.; Aceves, C.; et al. Outbreak.info genomic reports: Scalable and dynamic surveillance of SARS-CoV-2 variants and mutations. Nat. Methods 2023, 20, 512–522. [Google Scholar]
- Ogata, Y.; Kitayama, R. A database for retrieving information on SARS-CoV-2 S protein mutations based on correlation network analysis. BMC Genom. Data 2022, 23, 34. [Google Scholar] [CrossRef] [PubMed]
- Mrvar, A.; Batagelj, V. Analysis and visualization of large networks with program package Pajek. Complex Adapt. Syst. Model. 2016, 4, 6. [Google Scholar] [CrossRef]
- Voskarides, K. SARS-CoV-2: Tracing the origin, tracking the evolution. BMC Med. Gen. 2022, 15, 62. [Google Scholar] [CrossRef] [PubMed]
- Darling, T.L.; Ying, B.; Whitener, B.; VanBlargan, L.A.; Bricker, T.L.; Liang, C.; Joshi, A.; Bamunuarachchi, G.; Seehra, K.; Schmitz, A.J.; et al. mRNA-1273 and Ad26.COV2.S vaccines protect against the B.1.621 variant of SARS-CoV-2. Med 2022, 3, 309–324.e6. [Google Scholar] [CrossRef] [PubMed]
- Furusawa, Y.; Kiso, M.; Iida, S.; Uraki, R.; Hirata, Y.; Imai, M.; Suzuki, T.; Yamayoshi, S.; Kawaoka, Y. In SARS-CoV-2 delta variants, Spike-P681R and D950N promote membrane fusion, Spike-P681R enhances spike cleavage, but neither substitution affects pathogenicity in hamsters. EBioMedicine 2023, 91, 104561. [Google Scholar] [CrossRef] [PubMed]
- Oliveira, G.S.; Silva-Flannery, L.; Silva, J.F.; Siza, C.; Esteves, R.J.; Marston, B.J.; Morgan, J.; Plucinski, M.; Roca, T.P.; Silva, A.M.P.; et al. Active surveillance and early detection of community transmission of SARS-CoV-2 Mu variant (B.1.621) in the Brazilian Amazon. J. Med. Virol. 2022, 94, 3410–3415. [Google Scholar] [CrossRef] [PubMed]


| Nation Name | WHO 2023-04-12 | NCBI 2023-03-01 | GISAID 2023-01-17 |
|---|---|---|---|
| United States | 102,873,924 | 3,275,120 | 4,463,651 |
| United Kingdom | 24,330,379 | 2,249,734 | 2,919,535 |
| Germany | 38,368,891 | 512,215 | 836,315 |
| Denmark | 3,409,630 | 403,025 | 619,871 |
| France | 38,791,479 | 48,596 | 563,393 |
| Japan | 33,523,927 | 8557 | 512,329 |
| Canada | 4,634,277 | 241 | 492,655 |
| India | 44,768,172 | 4396 | 261,507 |
| Sweden | 2,702,703 | 203 | 231,635 |
| Austria | 6,046,956 | 300 | 220,750 |
| Spain | 13,798,747 | 1190 | 186,336 |
| Brazil | 37,319,254 | 16,392 | 185,932 |
| Belgium | 4,782,863 | 32 | 169,910 |
| Australia | 11,153,745 | 13,356 | 160,828 |
| Switzerland | 4,399,085 | 152,642 | 160,353 |
| Italy | 25,715,384 | 1547 | 157,212 |
| Netherlands | 8,610,372 | 1590 | 155,330 |
| Israel | 4,817,255 | 134 | 146,466 |
| South Korea | 30,918,060 | 413 | 110,902 |
| Turkey | 17,004,677 | 204 | 101,482 |
| Ireland | 1,708,435 | 19 | 99,966 |
| Mexico | 7,553,646 | 15,981 | 81,908 |
| Slovenia | 1,342,156 | 0 | 81,120 |
| Poland | 6,504,340 | 1219 | 74,754 |
| Norway | 1,481,760 | 6 | 74,212 |
| Czech Republic | 4,636,282 | 29 | 51,963 |
| Luxembourg | 319,959 | 1 | 50,289 |
| South Africa | 4,072,533 | 5405 | 46,343 |
| Finland | 1,468,123 | 52 | 44,775 |
| Slovakia | 1,865,828 | 36,222 | 44,681 |
| Indonesia | 6,752,606 | 76 | 44,100 |
| Portugal | 5,577,825 | 33 | 42,133 |
| Croatia | 1,271,276 | 1 | 41,765 |
| Lithuania | 1,316,086 | 0 | 40,477 |
| Chile | 5,272,767 | 818 | 39,882 |
| Malaysia | 5,052,337 | 434 | 35,404 |
| Thailand | 4,728,967 | 5467 | 35,118 |
| Russia | 22,727,542 | 565 | 30,453 |
| New Zealand | 2,217,047 | 16,636 | 28,620 |
| Singapore | 2,298,689 | 11 | 28,126 |
| Philippines | 4,083,678 | 109 | 25,685 |
| Greece | 5,972,760 | 98 | 23,839 |
| Colombia | 6,363,058 | 367 | 23,235 |
| Bulgaria | 1,301,475 | 2 | 20,389 |
| Romania | 3,380,891 | 109 | 17,851 |
| Reunion | 494,595 | 0 | 17,784 |
| Latvia | 977,172 | 0 | 17,567 |
| Hong Kong | - | 2518 | 16,781 |
| Estonia | 617,247 | 1681 | 14,913 |
| Puerto Rico | 1,110,017 | 3345 | 13,382 |
| Iceland | 209,191 | 25,459 | 12,903 |
| Kenya | 342,992 | 8178 | 12,334 |
| Argentina | 10,044,957 | 254 | 11,981 |
| Bahrain | 696,614 | 12,130 | 10,304 |
| Ecuador | 1,059,529 | 7 | 8920 |
| Costa Rica | 1,226,315 | 0 | 8750 |
| Vietnam | 11,527,745 | 2525 | 8173 |
| Nigeria | 266,675 | 3161 | 7906 |
| Canary Islands | - | 0 | 7599 |
| Bangladesh | 2,038,091 | 1853 | 7528 |
| Peru | 4,492,891 | 755 | 6637 |
| Panama | 1,033,781 | 0 | 6536 |
| Qatar | 502,436 | 24 | 6161 |
| Senegal | 88,978 | 0 | 5961 |
| Pakistan | 1,580,021 | 1524 | 5806 |
| Mauritius | 298,099 | 0 | 5776 |
| French Guiana | 98,041 | 0 | 5469 |
| Botswana | 329,837 | 0 | 5176 |
| Brunei | 284,632 | 0 | 4861 |
| Ghana | 171,527 | 297 | 4636 |
| Papua New Guinea | 46,837 | 0 | 4492 |
| Trinidad and Tobago | 191,007 | 0 | 4391 |
| Iran | 7,597,982 | 1709 | 4266 |
| China | 99,239,252 | 695 | 4209 |
| Cambodia | 138,726 | 2 | 3854 |
| Martinique | 229,479 | 0 | 3795 |
| Guatemala | 1,244,812 | 10 | 3733 |
| Aruba | 44,114 | 0 | 3613 |
| Sri Lanka | 672,092 | 6 | 3564 |
| Nepal | 1,001,951 | 19 | 3523 |
| Egypt | 515,913 | 1191 | 3202 |
| Gibraltar | 20,550 | 0 | 3029 |
| Paraguay | 735,759 | 298 | 2896 |
| Cyprus | 655,664 | 0 | 2690 |
| Sint Maarten | 11,030 | 0 | 2673 |
| United Arab Emirates | 1,058,979 | 0 | 2630 |
| Georgia | 1,836,791 | 21 | 2607 |
| Taiwan | 10,239,690 | 380 | 2602 |
| Lebanon | 1,235,177 | 931 | 2575 |
| Jamaica | 154,602 | 438 | 2446 |
| Guadeloupe | 202,163 | 0 | 2437 |
| Curacao | 45,798 | 0 | 2128 |
| Democratic Republic of the Congo | 95,944 | 0 | 2091 |
| Liechtenstein | 21,460 | 1804 | 1952 |
| Bonaire | 11,885 | 0 | 1913 |
| Zambia | 343,415 | 1 | 1891 |
| Namibia | 171,222 | 1 | 1886 |
| Dominican Republic | 660,937 | 386 | 1762 |
| Morocco | 1,272,733 | 22 | 1750 |
| Tunisia | 1,152,033 | 278 | 1732 |
| Kosovo | 273,764 | 0 | 1710 |
| Cuba | 1,112,853 | 2 | 1600 |
| Seychelles | 50,937 | 1031 | 1551 |
| Jordan | 1,746,997 | 28 | 1549 |
| Kazakhstan | 1,501,450 | 360 | 1514 |
| Bosnia and Herzegovina | 402,636 | 0 | 1513 |
| Gambia | 12,622 | 467 | 1493 |
| Uganda | 170,515 | 116 | 1428 |
| Malawi | 88,620 | 289 | 1379 |
| Angola | 105,353 | 0 | 1325 |
| Cameroon | 124,834 | 131 | 1322 |
| Maldives | 185,894 | 0 | 1292 |
| Mayotte | 42,008 | 0 | 1258 |
| Iraq | 2,465,545 | 669 | 1222 |
| Ukraine | 5,484,936 | 0 | 1202 |
| Kuwait | 665,527 | 15 | 1182 |
| Benin | 28,014 | 265 | 1176 |
| Saudi Arabia | 836,442 | 1092 | 1168 |
| Suriname | 82,495 | 1 | 1124 |
| Mozambique | 233,334 | 0 | 1098 |
| Serbia | 2,524,670 | 153 | 1093 |
| Eswatini | 74,520 | 0 | 1051 |
| Belize | 70,782 | 4 | 1030 |
| Venezuela | 552,398 | 40 | 1024 |
| Variant | Mutation Number | Statistical Significance * | Mutation List |
|---|---|---|---|
| Alpha | 8 | *** | V143fs, I68fs |
| Alpha | 7 | *** | V143fs, I68fs |
| Beta | 7 | * | T240fs |
| Beta | 6 | * | T240fs, D215G |
| Beta | 5 | ** | E484K, T240fs, N501Y |
| Delta | 6 | * | D950N, E156fs |
| Epsilon | 3 | * | W152C |
| Eta | 7 | * | Q52R |
| Eta | 6 | * | V143fs, Q52R |
| Mu | 8 | *** | D950N, Y144S |
| Mu | 7 | *** | Y145N, Y144S |
| Omicron | 7 | *** | S373P, T478K |
| Omicron | 6 | ** | S373P, T478K |
| Omicron | 5 | * | S373P, T478K |
Disclaimer/Publisher’s Note: The statements, opinions and data contained in all publications are solely those of the individual author(s) and contributor(s) and not of MDPI and/or the editor(s). MDPI and/or the editor(s) disclaim responsibility for any injury to people or property resulting from any ideas, methods, instructions or products referred to in the content. |
© 2023 by the authors. Licensee MDPI, Basel, Switzerland. This article is an open access article distributed under the terms and conditions of the Creative Commons Attribution (CC BY) license (https://creativecommons.org/licenses/by/4.0/).
Share and Cite
Kitayama, R.; Ogata, Y. Analyses of S Protein Homology Using the Genomes of SARS-CoV-2 Specimens Unveil Missing Links in the Temporal Order of Mutations in Its Variants. Viruses 2023, 15, 2182. https://doi.org/10.3390/v15112182
Kitayama R, Ogata Y. Analyses of S Protein Homology Using the Genomes of SARS-CoV-2 Specimens Unveil Missing Links in the Temporal Order of Mutations in Its Variants. Viruses. 2023; 15(11):2182. https://doi.org/10.3390/v15112182
Chicago/Turabian StyleKitayama, Ruri, and Yoshiyuki Ogata. 2023. "Analyses of S Protein Homology Using the Genomes of SARS-CoV-2 Specimens Unveil Missing Links in the Temporal Order of Mutations in Its Variants" Viruses 15, no. 11: 2182. https://doi.org/10.3390/v15112182
APA StyleKitayama, R., & Ogata, Y. (2023). Analyses of S Protein Homology Using the Genomes of SARS-CoV-2 Specimens Unveil Missing Links in the Temporal Order of Mutations in Its Variants. Viruses, 15(11), 2182. https://doi.org/10.3390/v15112182