Article

Increased Ifng and Il10 Expression Correlate with Disease in Rodent Models Experimentally Infected with Modoc Virus

1
Department of Microbiology, Immunology, and Pathology, College of Veterinary Medicine, Colorado State University, Fort Collins, CO 80523, USA
2
School of Biological Sciences, College of Natural and Health Sciences, University of Northern Colorado, Greeley, CO 80524, USA
*
Author to whom correspondence should be addressed.
Viruses 2022, 14(5), 1026; https://doi.org/10.3390/v14051026
Submission received: 12 March 2022 / Revised: 6 May 2022 / Accepted: 9 May 2022 / Published: 11 May 2022
(This article belongs to the Special Issue Flaviviruses and Flavivirus Vaccines)

Abstract

:
Flaviviruses present an ongoing threat to global public health, although the factors that contribute to the disease remain incompletely understood. We examined an acute Modoc virus (MODV) infection of two rodent models. Viral RNA was detected in the kidneys, spleen, liver, brain, urine, and sera of experimentally infected deer mice, a reservoir host of MODV, and Syrian hamsters, a known disease model. As expected, clinical outcomes differed between species, and the levels of viral RNA recovered from various tissues demonstrated signs of differential replication and tissue tropism. Multivariate analysis indicated significance in the profile of expressed genes between species when analyzed across tissues and over time (p = 0.02). Between-subject effects with corrected models revealed a significance specific to the expression of Ifng (p = 0.01). the expression of Ifng was elevated in hamsters as compared to deer mice in brain tissues at all timepoints. As the over-expression of Ifng has been shown to correlate with decreased vascular integrity, the findings presented here offer a potential mechanism for viral dissemination into the CNS. The expression of IL10 also differed significantly between species at certain timepoints in brain tissues; however, it is uncertain how increased expression of this cytokine may influence the outcome of MODV-induced pathology.

1. Introduction

Modoc virus (MODV) is a rodent-borne flavivirus isolated from deer mice (Peromyscus maniculatus) in North America [1]. As with all members of the Flavivirus genus, MODV is enveloped and contains a positive-sense RNA genome that encodes three structural (envelope, E; capsid, C; pre-membrane/membrane, prM) and seven non-structural (NS1, NS2A, NS2B, NS3, NS4A, NS4B, NS5) proteins. A 5′ methyl cap protects the viral genome from host cell recognition and provides ribosomal localization, while non-coding elements at the 3′ end contribute to viral infectivity and transmission, replication, and host pathogenesis [2,3,4]. Unlike most medically relevant flaviviruses, which have arthropod vectors, MODV was exclusively isolated from Peromyscus spp. in nature and fails to replicate in invertebrate cell lines [1,5,6,7]. Thus, MODV belongs to a distinct cluster of flaviviruses with no known vector (NKV) [8]. To date, only a few instances of human disease caused by NKV flaviviruses have been documented [9,10]. Nevertheless, MODV may provide an alternative model for flavivirus research, because it can be manipulated at biosafety level-2 (BSL-2) and can recapitulate human-like flavivirus disease in Syrian golden hamsters (Mesocricetus auratus) [11,12].
Flaviviruses are globally distributed and can elicit a range of clinical pathologies. Although most human infections are subclinical and self-resolving, instances of severe disease may result in multiple-organ failures, autoimmune disorders, malformations in fetal development, hemorrhagic fevers, or meningoencephalitis with permanent neurologic sequelae [13,14]. The increasing spread of vector-borne flaviviruses in recent decades has evoked renewed concern for the burden of these viruses on global public health [15,16]. For example, dengue virus (DENV) is believed to infect more than 390 m individuals annually, leading to clinical disease in approximately 96 million [8,17]. Likewise, West Nile virus (WNV), Japanese encephalitis virus (JEV), yellow fever virus (YFV), and Zika virus (ZIKV) continue to threaten individuals worldwide, with a conservative estimate of annual infections approaching 4 billion [18,19,20,21,22]. The issue of exposure is further compounded by ongoing climate variability, which may extend the realized niche for vectors such as ticks and mosquitoes, which carry and transmit flaviviruses [23,24,25,26]. Combined with the relative lack of flavivirus vaccines and FDA-approved antiviral therapies, there is a need for continued research [17].
As a confirmed and putative reservoir host of several human pathogens, deer mice offer a unique model system for examining the immune processes that control infection while preventing disease [27]. In contrast, Syrian golden hamsters are frequently used as models that recapitulate human-like disease from many pathogens without the need for genetic manipulation or chemical immunocompromise that is necessary in mouse models [28,29]. Indeed, both models have been used to study facets of MODV ecology and infection and have revealed clues regarding the tropism and subsequent pathology of MODV in vivo [5,12,30,31,32,33]. For example, MODV can induce a poliomyelitis-like syndrome in hamsters but not in deer mice that are experimentally infected through the same route [11,32]. Despite this, no studies have attempted to examine the presence of differentially expressed immune genes during MODV infection in these animals to date. Therefore, this research used MODV to directly compare viral replication kinetics, tissue tropism, and immune gene expression between deer mice and hamsters during acute experimental infection. It was discovered that MODV RNA could be recovered in greater amounts from the liver and spleen of deer mice. In contrast, higher levels of viral RNA were detected in the brain, sera, urine, and kidneys of hamsters, particularly beginning at day 4 post-infection. Examining the gene expression of five important immune cytokines (Ifng, Tnf, Il6, Il10 and Tgfb) revealed notable variability in the detectable levels of these transcripts in each model species. Although these cytokines represent only a small subset of the signals involved in an antiviral response, they were selected for their ability to coordinate important facets of the immune system and for their previous implication in various flavivirus-induced pathologies [34,35,36]. Additionally, the IFN-stimulated gene (ISG) Oas1b was chosen as a proxy to gauge the type I interferon (IFN-α/β) response to MODV. Despite the ability of many flaviviruses to antagonize IFN signaling; it was found that both rodents were able to express transcripts of Oas1b, albeit at significantly different levels in certain tissues and at different timepoints.

2. Materials and Methods

2.1. Experimental Infections

Deer mice were supplied from an established colony at the University of Northern Colorado, whereas Syrian hamsters were purchased from Envigo Laboratories. In total, 36 rodents (18 of each species, 50/50 mixed sexes), ranging from 10 to 16 weeks of age, were intraperitoneally inoculated with 0.3 mL of MODV M544 (ATCC, Manassas, VA, USA; passaged once in Vero E6 cells) at an infectious dose of ~104.2 TCID50. Similarly, 12 negative controls (6 of each species, 50/50 mixed sexes) were intraperitoneally sham inoculated with 0.3 mL of 1× DPBS (pH = 7.3). Following inoculation, all animals were housed individually, monitored daily, and euthanized immediately following the development of signs of morbidity (not including minor changes in behavior (e.g., lethargy) or weight loss). Animals challenged with virus were serially euthanized in groups of three on days 1, 2, 4, 6, 8, and 10 post-infection (p.i.). Negative controls were euthanized in groups of two on days 1, 6, and 10 p.i. Necropsies were performed immediately following euthanasia and included the collection of urine (extracted directly from the bladder), blood sera (collected via cardiac exsanguination), kidneys, liver, spleen, and brain. All collected tissues were frozen immediately in liquid nitrogen baths and stored at −80 °C until further use.

2.2. Viral RNA Extraction and RT-qPCR

Organ samples were prepared for viral RNA extraction by first homogenizing 30 mg of tissue with zirconia/silica beads in 600 µL of sterile 1× PBS. Homogenates were centrifuged through a QiaShredder column (Qiagen, Germantown, MD, USA) at 14,000× g for 8 min at 4 °C. A total of 140 µL of tissue supernatant, urine, or blood sera were then used for extraction using a QIAmp Viral RNA Mini kit (Qiagen) according to the manufacturer’s protocol. To reverse-transcribe viral RNA, 2 µL of sample were mixed with 5.2 µL of nuclease-free water and 2.8 µL of MODV-specific primers at a final concentration of 280 nM (Table 1). RNA and primers were incubated at 94 °C for 1 min and then placed in an ice bath for 3 min before the addition of 0.5 µL Episcript RT enzyme (Lucigen, Radnor, PA, USA), 2 µL 10 × RT buffer, 2 µL of DTT, 1 µL dNTPs at 10 mM, 0.5 µL RNase inhibitor (New England BioLabs, Ipswich, MA, USA), and 4 µL nuclease-free water. First-strand cDNA synthesis was performed by incubating the reaction mixture at 45 °C for 1.5 h followed by 5 min at 85 °C to inactivate the RT.
Viral cDNA from collected tissues was examined using RT-qPCR and the same MODV-specific primers referenced above. In brief, 2 µL of cDNA were combined with 10 µL of PerfeCTa SYBR FastMix (Quantabio, Beverly, MA, USA), 2 µL of primers (each at a working concentration of 3 µM), and 6 µL of nuclease-free water. Cycling was conducted on a CFX384 Touch (BioRad, Hercules, CA, USA) with the following conditions: initial denaturation at 95 °C for 10 min followed by 40 cycles at 95 °C for 15 s and 60 °C for 1 min. To compare relative quantities of recovered virus, 1:10 serial dilutions of stock MODV cDNA (prepared using the same protocol as above) were used to generate four standard curves, from which the means were used to represent the tissue culture infective dose 50 (TCID50) “equivalent titer” of recovered viral RNA.

2.3. Cellular RNA Extraction and Gene Expression Analysis

Tissues collected from MODV-infected and control animals were used to examine the relative expression of select immune genes on days 1, 6, and 10 p.i. In brief, 30 mg of tissue from each organ of interest (kidney, liver, spleen and brain) were first homogenized using zirconia/silica beads in a solution of TRK lysis buffer from an E.Z.N.A Total RNA kit (Omega Bio-Tek, Norcross, GA, USA) with the addition of 20 µL/mL of β-mercaptoethanol. Suspensions were then transferred to a QiaShredder column and centrifuged at 14,000× g for 8 min at 4 °C to further mechanically lyse cells and pellet cellular debris. Supernatants were carefully removed and subjected to RNA extraction using the above kit according to the manufacturer’s protocol. Prior to cDNA synthesis, all samples were treated to remove genomic DNA using a PerfeCTa DNase I kit (Quantabio, Beverly, MA, USA) according to the manufacturer’s protocol. First-strand cDNA was synthesized by mixing the entire DNase-treated reaction with 4 µL of qScript cDNA SuperMix (Quantabio) and 5 µL of nuclease-free water, followed by incubation at 25 °C for 10 min, 42 °C for 30 min, and then 85 °C for 5 min.
Analysis of relative immune gene expression was conducted by combining 2 µL of template cDNA (diluted to 10 ng/µL) with 5 µL of SsoAdvanced SYBR Supermix (BioRad), 2 µL of forward and reverse primers, each at 2 µM, and 1 µL of nuclease-free water. All primers (Table 1 and Table 2) were used at a final concentration of 200 nM except for hamster primers Il6 and Ifng, which were used at final concentrations of 400 nM and 100 nM, respectively. Primers for the Oas1b gene were designed using homologous sequences found in regions of the Oas1b coding transcripts from deer mice, golden hamsters, and laboratory house mouse (Mus musculus). To determine primer efficiencies, standard curves were first generated using the mean Ct values from duplicate runs of samples in a 1:10 dilution series. The slope values from these curves were then used to determine efficiency using the following equation: efficiency (%) = (10^(−1/slope value)−1) × 100.
All samples were run in duplicate on a CFX384 Touch thermocycler with the following cycle conditions: initial denaturation at 95 °C for 10 min followed by 40 cycles at 95 °C for 15 s and 60 °C for 1 min. Melt curve analyses were included with each assay to verify single product amplification. Additionally, a no-template control (NTC) was included with each assay. Relative gene expression was calculated with mean Ct values using the comparative Ct method (i.e., ΔΔCt) as proposed by Livak and Schmittgen, whereby immune genes were first normalized against the constitutively expressed β-actin gene (ΔCt) and then calibrated against the ΔCt of mock-infected controls (ΔΔCt) [40]. Finally, relative gene expression was depicted as the mean fold change (2−ΔΔCt) ± standard error of the mean (SEM) between infected and mock-infected animals at each of the previously described collection timepoints. Samples that did not generate a Ct value were given a default value of 40.
Table 2. Sequence data and amplification efficiency for Mesocricetus auratus primers.
Target Sequence (5′ to 3′)bpR2Eff. (%)AccessionReference
β-ActinF
R
GCTACAGCTTCACCACCACA
TCTCCAGGGAGGAAGAGGAT
1231.000102.4XM_013120404.2[37]
Oas1bF
R
CAGTATGCCCTGGAGCTGC
GTACTTGGTGACCAGTTCC
1110.999103.5XM_013119795.2This study
IfngF
R
TGTTGCTCTGCCTCACTCAGG
AAGACGAGGTCCCCTCCATTC
1301.000104.2AF034482.1[41]
TnfF
R
TGAGCCATCGTGCCAATG
AGCCCGTCTGCTGGTATCAC
790.99897.7XM_005086799.3[41]
TgfbF
R
TGTGTGCGGCAGCTGTACA
TGGGCTCGTGAATCCACTTC
631.000100.7XM_013125593.2[29]
IL6F
R
CCTGAAAGCACTTGAAGAATTCC
GGTATGCTAAGGCACAGCACACT
781.000112.4XM_005087110.2[29]
IL10F
R
GGTTGCCAAACCTTATCAGAAATG
TTCACCTGTTCCACAGCCTTG
1941.00099.5XM_021232886.1[41]
MODV-NS5F
R
CCAGGACAAGTCATGTGGTAGC
TCCCAAAGATGTTCCTCACCTT
1010.998107.5NC_003635.1[39]

2.4. Statistical Analysis

A log10 transformation was first applied to all relative gene expression values prior to any downstream statistical analysis. Following transformations, SPSS v25.0 (IBM, Armonk, NY, USA) was used to conduct a MANOVA to determine significant differences in the expression values of immune genes between species among select tissues at distinct collection timepoints. Additionally, separate MANOVA tests were conducted for each species to examine differences in gene expression profiles within groups when tissues and collection timepoints were held as fixed factors. Independent samples’ t-tests were conducted using PRISM v8.3.1 (GraphPad, La Jolla, CA, USA) to determine whether the expression of genes differed significantly between species within a particular tissue and specific collection timepoint. Finally, Mann–Whitney tests were conducted in PRISM to determine whether viral loads differed significantly between species in particular tissues over time. For all analyses, significant differences between groups were evaluated with α = 0.05.

3. Results

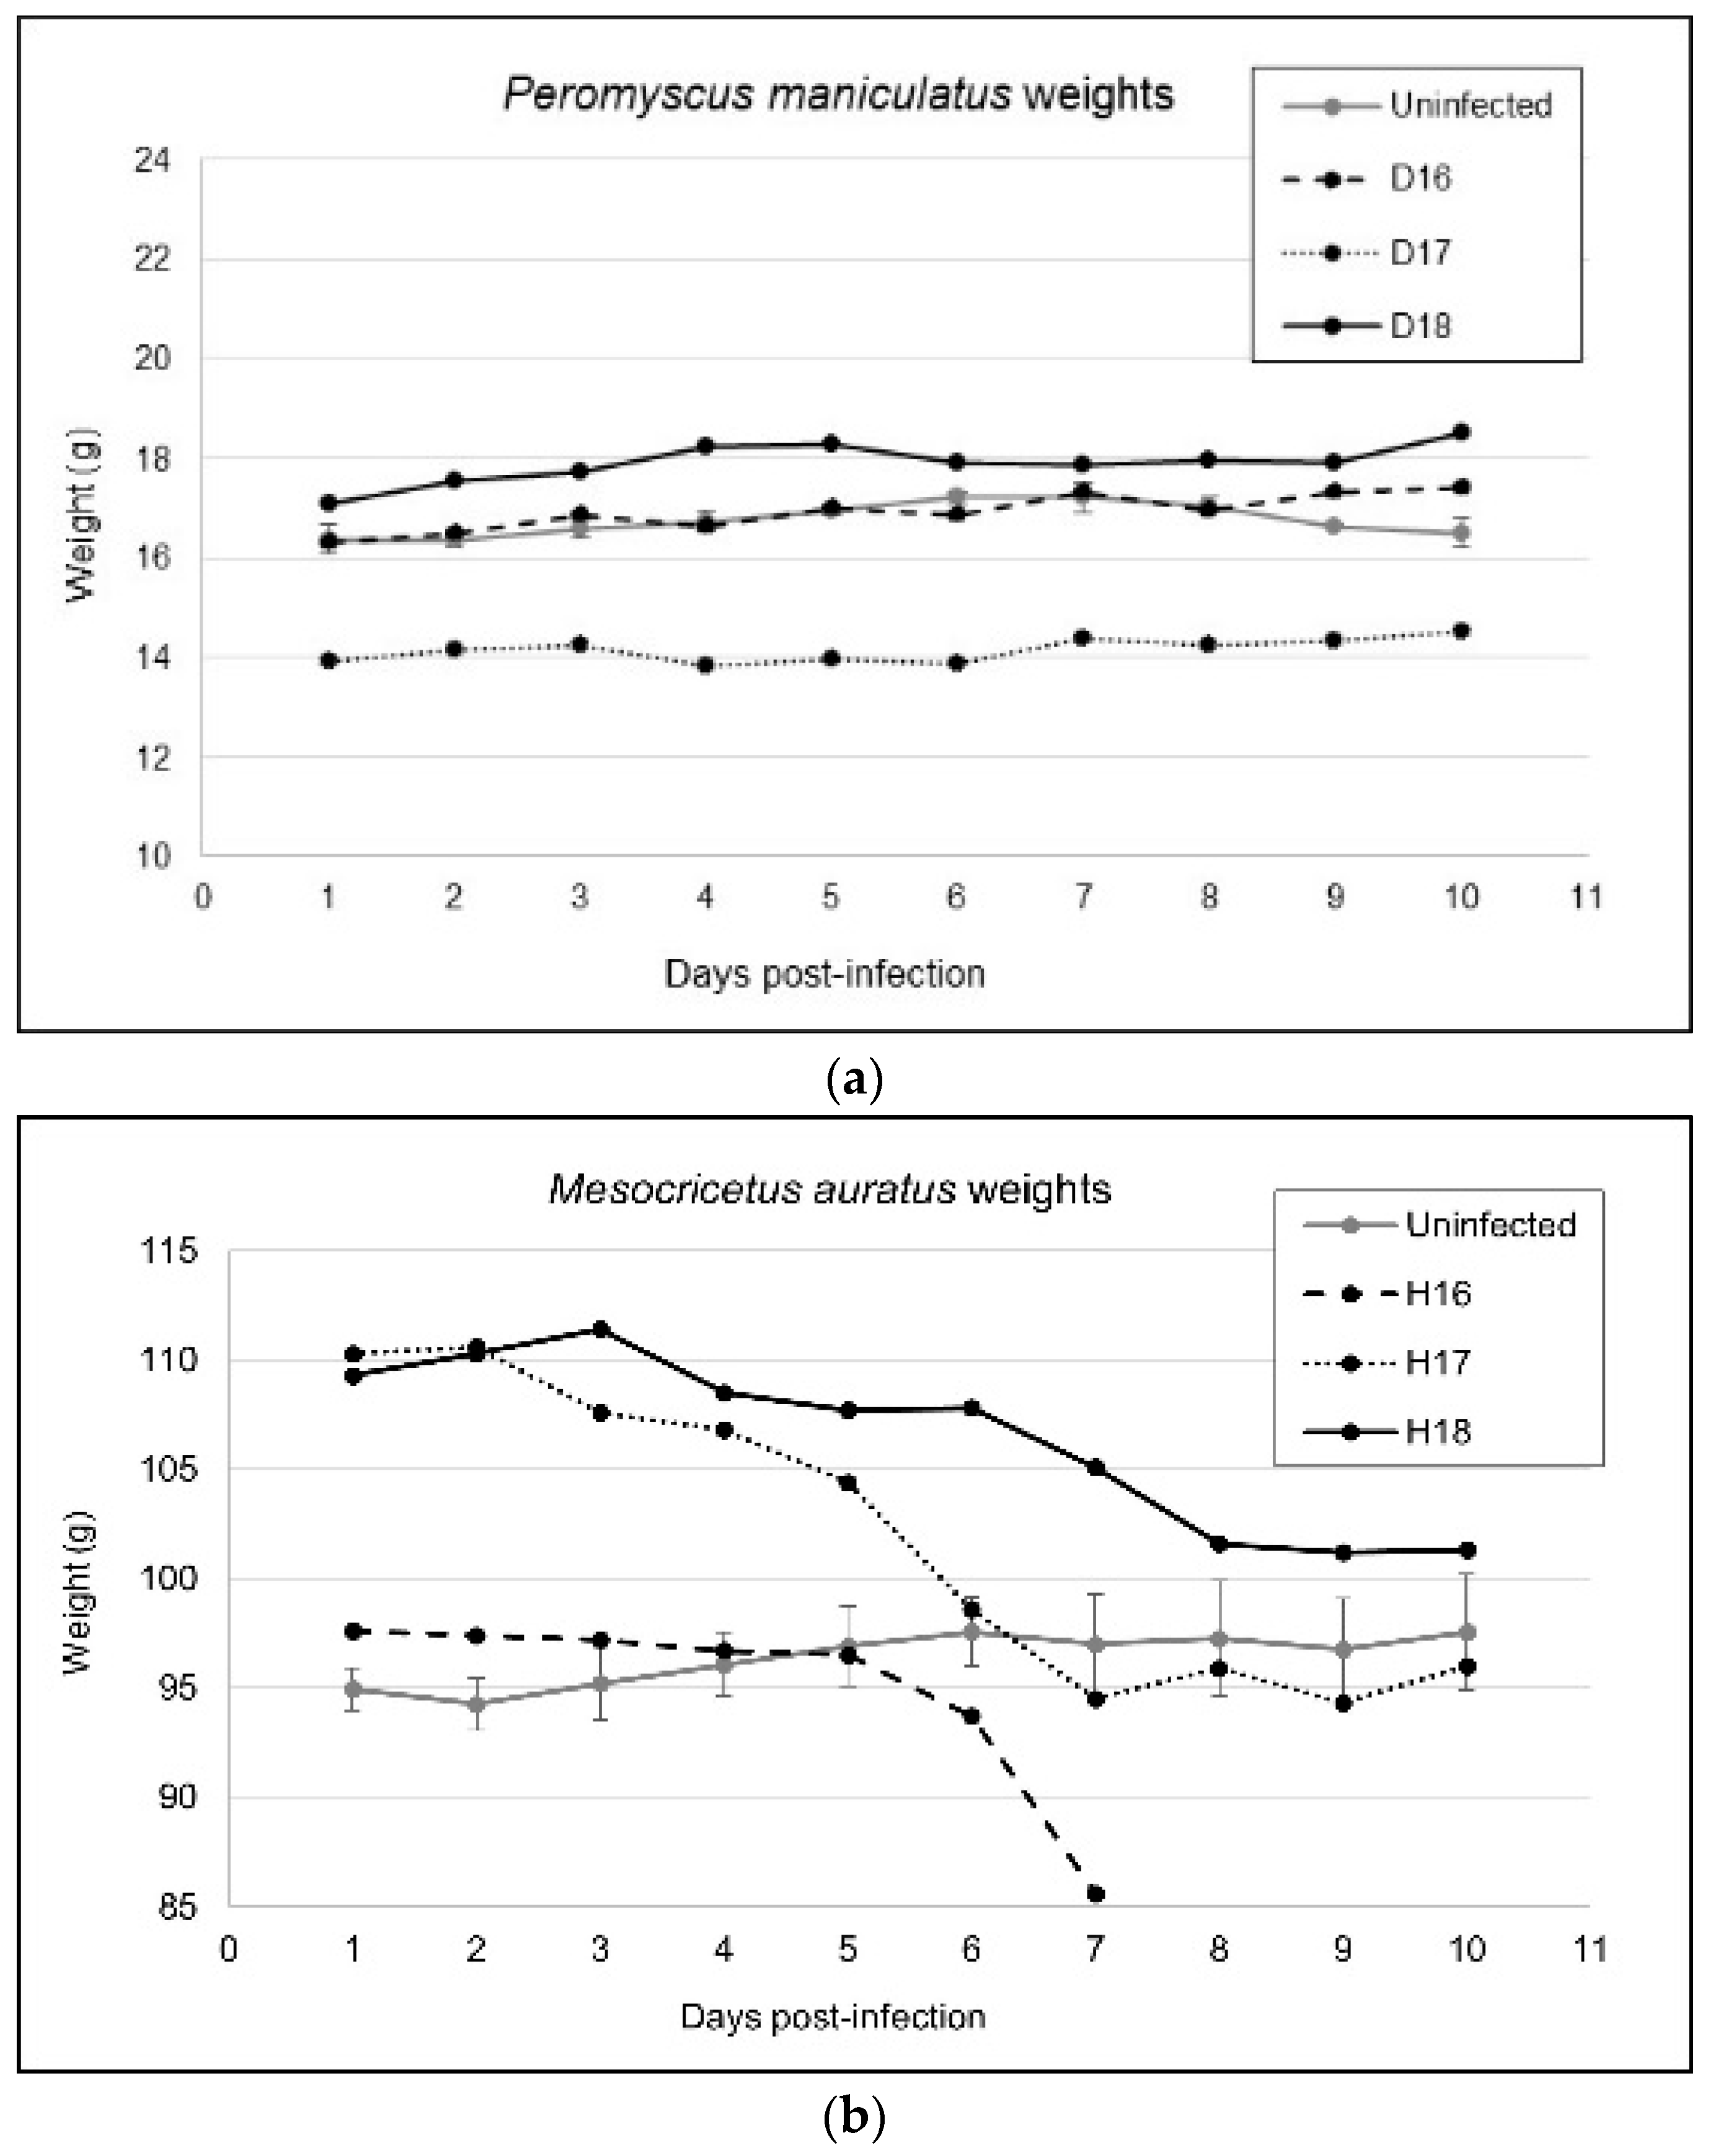
3.1. Variable Clinical Outcomes of MODV Infection

Both deer mice and hamsters are susceptible to MODV; however, the clinical outcomes of acute infection differ considerably. Over the 10-day experimental period, deer mice exhibited no overt signs of disease (e.g., ruffled fur or piloerection, fluid discharge from the nose, mouth or eyes, hematuria, muscle weakness or tremors, weight loss, or other peculiar changes in behavior). Likewise, there were no notable indications of gross organ pathology upon necropsy of any of the infected individuals.
In contrast, hamsters began to exhibit lethargy and weight loss as early as day 2 p.i. (Figure 1). Gross organ pathologies became apparent beginning day 4 p.i., with nearly all infected individuals demonstrating splenomegaly and mild to moderate thoracic hemorrhage at the time of necropsy. Past this timepoint, all males presented with severe epididymitis and orchitis upon necropsy. On day 7, one female (H16) was euthanized early due to apparent limb paralysis, tachypnea, nasal hemorrhage, and incontinence. Two more hamsters developed similar signs of disease with neurologic involvement by day 8 p.i. and were euthanized immediately (which coincided with the predetermine necropsy schedule). By day 10 p.i., the remaining hamsters demonstrated extreme lethargy, slow/weak reflexes in the front limbs, splenomegaly, orchitis, and extreme weight loss. In total, 12/18 (67%) infected hamsters demonstrated some form of gross anatomical pathology or clinical manifestation of disease within the 10-day experimental period. None of the uninfected controls from either rodent species presented with signs of illness throughout the experimental period.

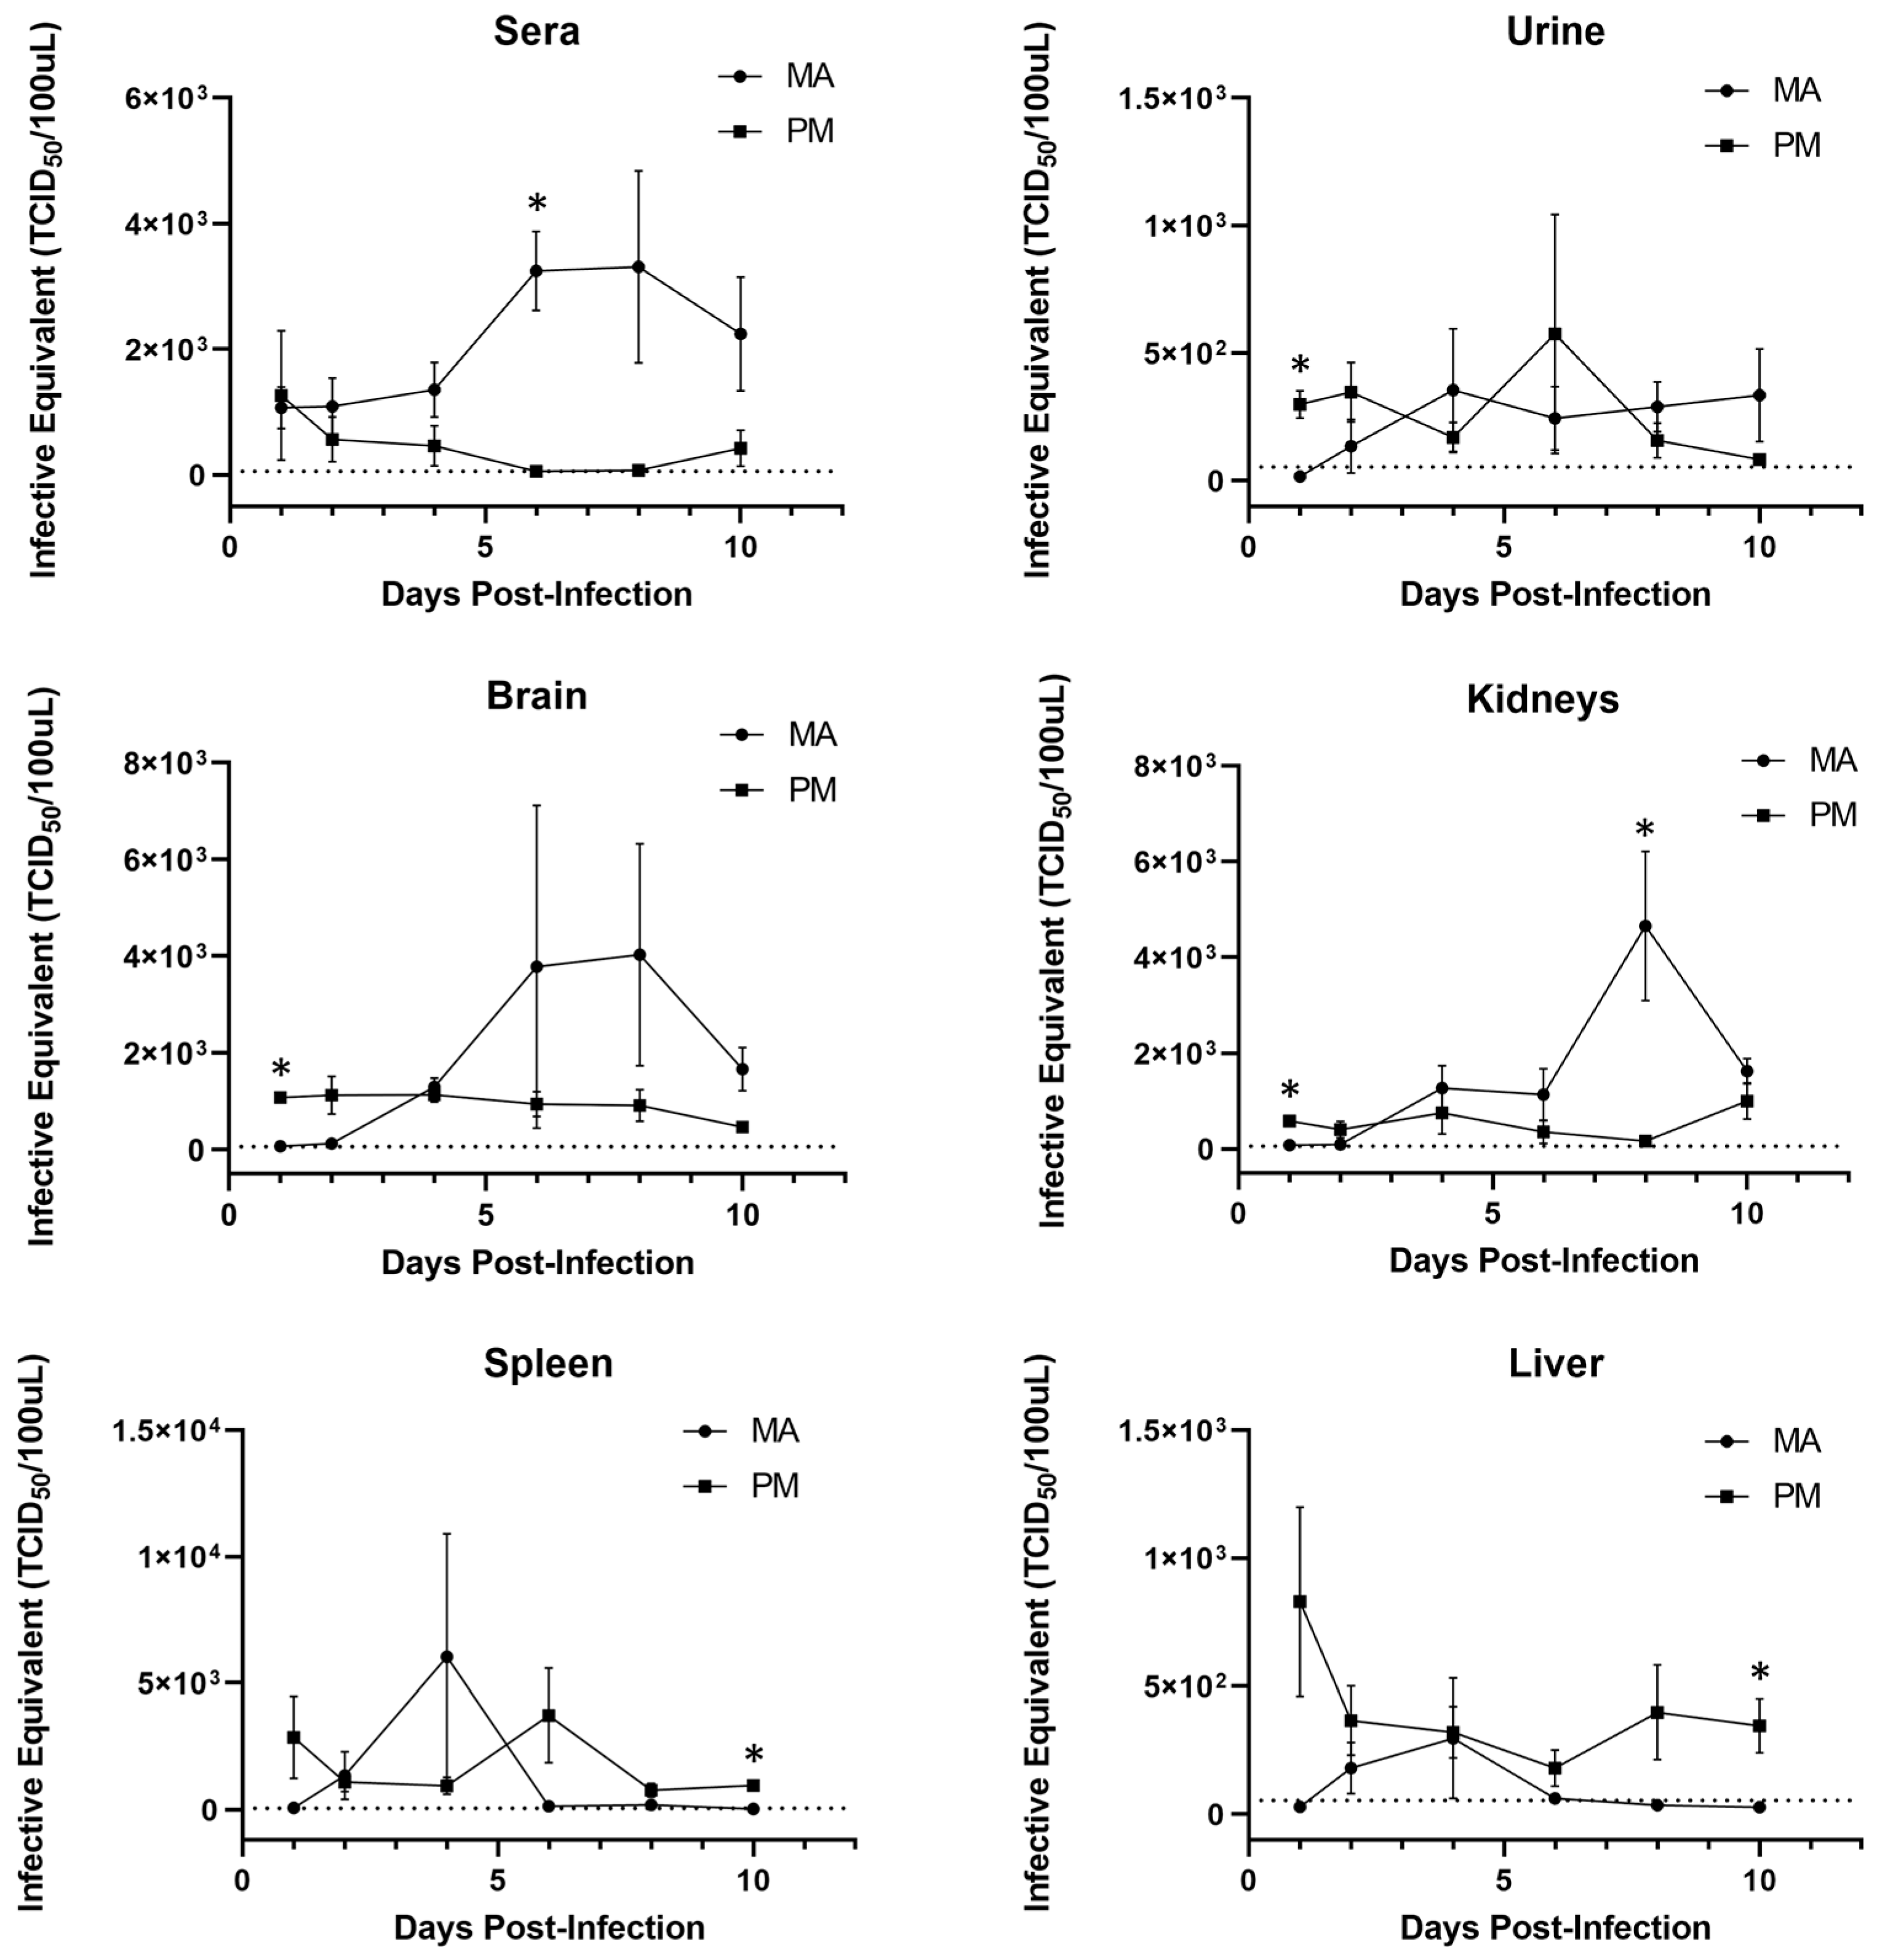
3.2. Viral Replication Kinetics

To assess differences in viral replication kinetics between deer mice and hamsters, RT-qPCR was used to quantify the levels of MODV RNA expressed in select tissues and fluids over time (Figure 2). It was determined that MODV RNA is generally recovered at higher levels in the spleens and livers of deer mice as compared to the urine, sera, brains, and kidneys of hamsters during an acute infection period. Interestingly, in all examined tissues and fluids, MODV RNA levels began to increase by day 4 p.i. in hamsters, and decreased at the same timepoint in deer mice (except in spleens and livers, where a transient increase in viral RNA occurred on days 4 and 6, respectively). Despite these observed trends, the variance in recovered viral RNA between individuals, especially hamsters, was quite high. This finding may be reflective of minor genetic nuances between individuals and support the need for additional replicates at each timepoint in future studies.

3.3. Differential Transcript Expression

The differential expression of Ifng, Tnf, Il6, Il10, and Tgfb during acute MODV infection in both hamsters and deer mice was examined using RT-qPCR. Following the transformation of relative gene expression values, a Shapiro–Wilk test for normality confirmed that all values were normally distributed in deer mice (p ≥ 0.11), except for one instance (Tgfb in liver tissues; p = 0.04). Similarly, all values in hamsters were found to be normally distributed (p ≥ 0.09) except for Ifng expression in the spleen (p = 0.02) and brain (p = 0.21) as well as the expression of Il10 in the brain (p = 0.04). To determine whether the observed levels of transcript expression were statistically meaningful, multivariate analysis of variance (MANOVA) models were used to examine transcript expression profiles in each species, first separately and then together. A significant difference in the complete profile of cytokine transcripts expressed between tissues over time was found for each species (deer mice, p = 0.01; hamsters, p = 0.01). In deer mice, between-subjects effects with corrected models revealed significant differential expression of Ifng, Tnf, and Tgfb when both tissue and collection timepoint were treated as cofactors. In hamsters, Ifng, Tnf, Il6, and Il10 were found to exhibit significant differential expression, but Tgfb was not. When a single MANOVA compared the profiles of transcript expression between species, collection timepoints, and tissues, a significant difference was also found in the relative expression of all transcripts over time between tissues and species (p = 0.02). In this analysis, only the expression of Ifng differed significantly (p = 0.01). Despite the trends observed regarding expression of Il10 in brain tissues, levels of Il10 in this study are significant when only tissue and species or tissue and timepoint of collection are treated as fixed factors in multivariate analysis (p ≤ 0.01). Nevertheless, these findings confirm that infection by MODV elicits a unique immune response in each rodent model when the titer and route of viral challenge is standardized. In line with this, there is preliminary support of the idea that the regional cytokine milieu may influence the outcome of both local and systemic disease pathology or resistance.
Independent samples’ t-tests were used to compare the mean level of transcript expression between species in specific tissues at specific timepoints (Figure 3). The patterns of expression between tissues generally corresponded with the detected MODV levels. For example, Ifng expression was initially higher for deer mice in the spleen and liver, both of which contained marginally higher levels of viral RNA. Similarly, the expression of Ifng in the kidneys (past day 1) and brains of infected hamsters mirrored elevated levels of viral RNA recovered from those tissues. Indeed, one would expect to recover antiviral transcripts such as Ifng concomitant with higher viral loads; however, these trends may be tissue-dependent, as suggested by the examination of one particular hamster, which demonstrated much higher levels of both viral RNA and Ifng on day 6 in the kidneys but only high levels of viral RNA (and the lowest expression of Ifng among all bio-replicates) in the brain at this same timepoint. In some instances, transcript expression significantly differed between species; however, these cases only occurred in certain tissues and at specific timepoints.

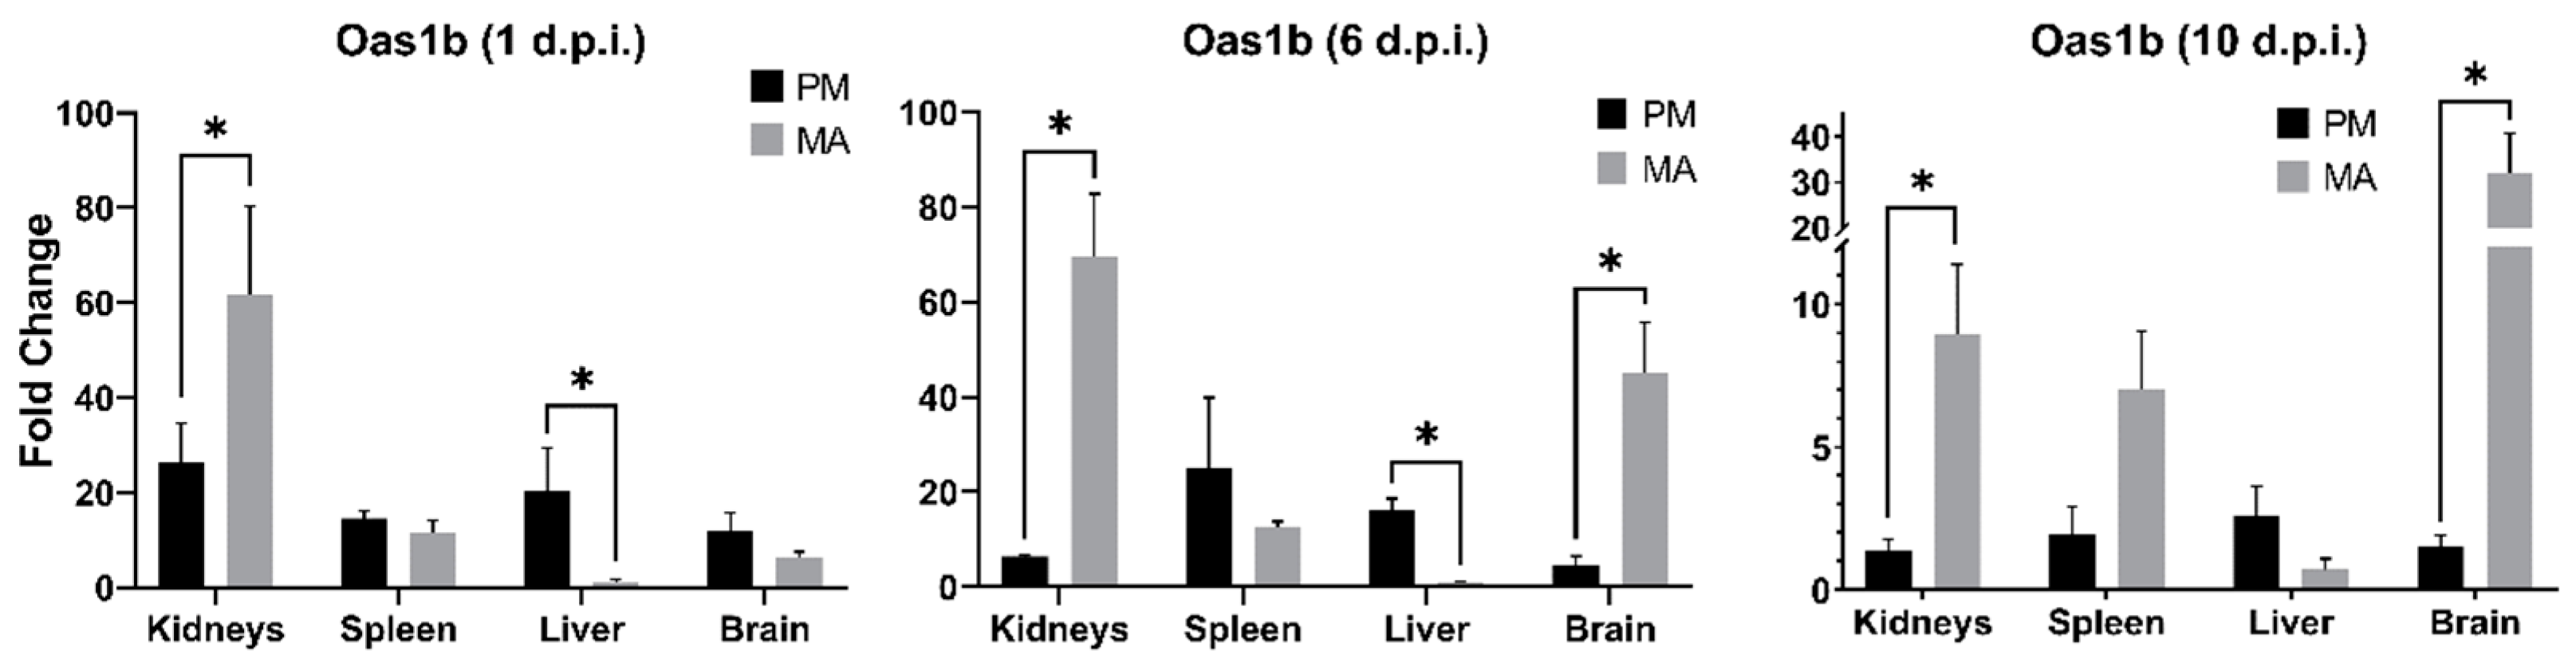
3.4. Oas1b Expression

RT-qPCR was additionally used to examine the expression levels of the interferon-stimulated gene (ISG) Oas1b. Using a three-factor analysis of variance (ANOVA), it was discovered that expression of Oas1b significantly differed between deer mice and hamsters in select tissues at distinct timepoints (p = 0.03). Namely, expression in hamster kidneys at all timepoints, as well as in brain tissues at days 6 and 10 p.i., was much higher than those of deer mice at the same timepoints (Figure 4). In contrast, expression in deer mouse livers was significantly higher on days 1 and 6, but not on day 10 p.i.

4. Discussion

This study used a comparative design to investigate MODV replication kinetics, tissue tropism, and cytokine response in contrasting rodent models. Deer mice, reservoir hosts of MODV, showed no signs of disease during experimental infection. This corroborates previous research and confirms that, even in a higher-titer challenge, deer mice can resist disease [31,32]. In contrast, over two-thirds of infected hamsters exhibited disease reminiscent of past studies [11,12]. Adams et al. describe an experiment in which hamsters developed bilateral hindlimb paralysis by day 6 p.i. [12]. Leyssen et al. discovered that MODV-infected hamsters develop a similar neurologic disease to encephalitic flaviviruses (e.g., WNV or JEV), by day 10 p.i. [11]. These findings all support the use of hamsters and deer mice as comparative models and may provide the impetus to further explore the differential expression of immune genes to better understand mechanisms of disease resistance.
Regarding tissue tropism, past investigations suggest that MODV differentially replicates in the spleen, lungs, and salivary-submaxillary glands of deer mice, and in the kidneys and brain of hamsters [11,12,30,31,32,39]. The results presented here broadly corroborate previous works and further demonstrate the relatively higher recovery of viral RNA from the livers and sera of deer mice and hamsters, respectively. More specifically, sera levels were similar at the first sampling timepoint but began to diverge by day 4 post-infection. By day 6, peak levels of viral RNA were reached in hamster sera, which differed significantly from those found in deer mice. Taken together, these findings may offer clues concerning the pathogenic progression of MODV. For example, increased viremia in hamsters may better facilitate viral dissemination into the central nervous system (CNS). It has been demonstrated that other flaviviruses may infiltrate the CNS via cytokine-mediated breakdown of the blood–brain barrier (BBB) or via the translocation of viral particles into the brain parenchyma across the infected epithelium [42]. However, it is important to acknowledge that any observed levels of viral RNA do not necessarily imply the presence of infectious virus; therefore, further investigation will be required.
For this study, a small subset of antiviral genes was chosen for examination based on their previous implication during flavivirus infection [34,43,44,45]. Of particular interest, we found that transcripts of Ifng in the brains of infected hamsters were elevated above those in deer mice on all days sampled. Extreme differences were observed by day 6 and were significant by day 10 p.i. These trends were surprising to observe given that levels of viral RNA were initially higher in deer mouse brain tissues. Ifng is a multifunctional, pleiotropic cytokine critical for the control of pathogens [46]. It has been cited as one of the most potent activators of classical macrophages, induces nitric oxide production, and stimulates the upregulation of MHC class I and II, each of which aid in the response against viruses [46]. Despite its antiviral role, some research suggests that over- or under-expression may lead to deleterious clinical outcomes [47]. For example, intact Ifng signaling is required to promote the protective roles of innate γδ T cells and primary dendritic cells against WNV infection [48]. Nevertheless, the extreme upregulation of Ifng may lead to the overexpression of intercellular adhesion molecule-1 (ICAM-1), a putative binding receptor for many flaviviruses, including WNV [49].
Unlike Ifng, interleukin-10 (Il10) is canonically regarded as immunomodulatory or suppressive [50]. Although the exact mechanisms of its function are not fully understood, Il10 may mollify inflammation by interfering with the production of pro-inflammatory cytokines or chemokines concomitant with the downregulation of MHC II expression [50]. It is, therefore, curious that the expression of Il10 transcripts in the brain of infected hamsters far exceeds those in deer mice at all timepoints sampled. Indeed, previous research has correlated Il10 with both protective and adverse outcomes of flavivirus infection [51]. These dichotomous outcomes may be serotype-specific, as some research has shown Il10 to be elevated during infection with DENV-2 while demonstrating active downregulation in response to DENV-1, 3, and 4 [52]. Moreover, multiple studies have suggested that the excessive production of Il10 could inhibit the protective effects of T cells [53,54,55]. Further investigation will be required to elucidate the role of Il10 in this particular model system; however, it is interesting to find that high expression levels are correlated with neuropathologic outcomes in hamsters.
In addition to shaping the cytokine profile of the immune response, many flaviviruses antagonize type I IFN (IFN-α/β) signaling at multiple levels and may subsequently inhibit the expression of intracellular, antiviral effector proteins [56,57]. Due to the paucity of available sequences for deer mouse and hamster type I IFN transcripts, we chose to examine the expression of Oas1b as a representative IFN-stimulated gene (ISG). Canonically, Oas (oligoadenylate-synthetase) proteins exert their antiviral effect by activating latent cytosolic ribonuclease L (RNAse L), an enzyme that acts to degrade viral transcripts. Although Oas1b lacks this enzymatic activity, and therefore exerts antiviral activity through other, incompletely understood mechanisms, it has nevertheless been demonstrated to be protective against some flavivirus infections [58,59,60,61]. It was interesting to find that significantly higher expression of Oas1b occurred in the livers of infected deer mice as opposed to the kidneys and brains of infected hamsters (Figure 4). These patterns roughly coincide with the apparent tropism of MODV toward these tissues, as determined by the quantities of viral transcripts recovered from each species; however, the same patterns of expression were not observed in the spleens of infected animals. Given these outcomes, MODV does not appear to antagonize the ISG response in a manner characteristic of some other flaviviruses [62]. Moreover, the high expression of Oas1b by 24 h p.i. confirms that both species are capable of recognizing MODV molecular patterns and initiating the expression of ISGs within a comparable timeframe to other well-studied flaviviruses [63].
It is unclear how the patterns of Tnf, Il6, and Tgfb influence MODV replication in either deer mouse or hamster tissues. For example, expression of Tnf differed significantly between deer mice and hamsters on day 1 in the kidneys and brain, as well as day 6 in the kidneys and spleen, but at no other timepoints in any tissues. The expression of IL6 differed significantly only at day 10 in the kidneys while Tgfb differed only at day 6 in the kidneys. On one hand, the relative lack of variable expression of these three cytokines suggests negligible roles under the parameters of this experiment; however, the occasional instances of statistical significance may warrant further investigation. Future studies should include an immunohistopathologic inspection of infected tissues, comprehensive transcriptomic profiles, and assays that quantify translational end products of the cytokines examined [50]. In addition, increasing cohort sample sizes would likely help to further elucidate the observed trends outlined in the work presented here.
In conclusion, this study contributes to a growing body of knowledge examining the contribution of select immune genes in correlation with diverse clinical outcomes of viral pathogenesis. Specifically, we highlight the potential importance of two cytokines, Ifng and Il10, in the development of flavivirus-induced neurologic disease.

Author Contributions

Conceptualization, T.J.S., D.P. and A.C.H.; methodology, T.J.S., D.P. and A.C.H.; investigation, T.J.S. and D.P.; writing—original draft preparation, T.J.S.; writing—review and editing, N.H., T.S. and A.C.H.; funding acquisition, T.J.S., D.P., T.S. and A.C.H. All authors have read and agreed to the published version of the manuscript.

Funding

This research was supported by internal grants acquired through the University of Northern Colorado. The funders had no role in the design of the study; in the collection, analyses, or interpretation of data; in the writing of the manuscript, or in the decision to publish the results.

Institutional Review Board Statement

The animal study protocol was approved by the Institutional Review Board (or Ethics Committee) of the University of Northern Colorado (Protocol 1603C-AH-DmH-19).

Informed Consent Statement

Not applicable.

Conflicts of Interest

The authors declare no conflict of interest.

References

  1. Johnson, H.N. Ecological implications of antigenically related mammalian viruses for which arthropod vectors are unknown and avian associated soft tick viruses. Jpn. J. Med. Sci. Biol. 1967, 20, 160–166. [Google Scholar] [PubMed]
  2. Leyssen, P.; Charlier, N.; Lemey, P.; Billoir, F.; Vandamme, A.M.; de Clercq, E.; de Lamballerie, X.; Neyts, J. Complete genome sequence, taxonomic assignment, and comparative analysis of the untranslated regions of the Modoc virus, a flavivirus with no known vector. Virology 2002, 293, 125–140. [Google Scholar] [CrossRef] [PubMed] [Green Version]
  3. Bidet, K.; Garcia-Blanco, M.A. Flaviviral RNAs: Weapons and targets in the war between virus and host. Biochem. J. 2014, 462, 215–230. [Google Scholar] [CrossRef] [PubMed]
  4. de Borba, L.; Villordo, S.M.; Marsico, F.L.; Carballeda, J.M.; Filomatori, C.V.; Gebhard, L.G.; Pallares, H.M.; Lequime, S.; Lambrechts, L.; Vargas, I.S.; et al. RNA Structure Duplication in the Dengue Virus 3′ UTR: Redundancy or Host Specificity? MBio 2019, 10, e02506-18. [Google Scholar] [CrossRef] [Green Version]
  5. Johnson, H.N. Long-term persistence of Modoc virus in hamster-kidney cells. In vivo and in vitro demonstration. Am. J. Trop. Med. Hyg. 1970, 19, 537–539. [Google Scholar] [CrossRef]
  6. Saiyasombat, R.; Carrillo-Tripp, J.; Miller, W.A.; Bredenbeek, P.J.; Blitvich, B.J. Substitution of the premembrane and envelope protein genes of Modoc virus with the homologous sequences of West Nile virus generates a chimeric virus that replicates in vertebrate but not mosquito cells. Virol. J. 2014, 11, 150. [Google Scholar] [CrossRef] [Green Version]
  7. Tumban, E.; Maes, N.E.; Schirtzinger, E.E.; Young, K.I.; Hanson, C.T.; Whitehead, S.S.; Hanley, K.A. Replacement of conserved or variable sequences of the mosquito-borne dengue virus 3′ UTR with homologous sequences from Modoc virus does not change infectivity for mosquitoes. J. Gen. Virol. 2013, 94, 783–788. [Google Scholar] [CrossRef] [Green Version]
  8. Kuno, G.; Chang, G.J.; Tsuchiya, K.R.; Karabatsos, N.; Cropp, C.B. Phylogeny of the genus Flavivirus. J. Virol. 1998, 72, 73–83. [Google Scholar] [CrossRef] [Green Version]
  9. Davis, J.W.; Hardy, J.L. In vitro studies with Modoc virus in Vero cells: Plaque assay and kinetics of growth, neutralization, and thermal inactivation. Appl. Microbiol. 1973, 26, 344–348. [Google Scholar] [CrossRef]
  10. Sulkin, S.E.; Burns, K.F.; Shelton, D.F.; Wallis, C. Bat salivary gland virus: Infections of man and monkey. Tex. Rep. Biol. Med. 1962, 20, 113–127. [Google Scholar]
  11. Leyssen, P.; Croes, R.; Rau, P.; Heiland, S.; Verbeken, E.; Sciot, R.; Paeshuyse, J.; Charlier, N.; De Clercq, E.; Meyding-Lamade, U.; et al. Acute encephalitis, a poliomyelitis-like syndrome and neurological sequelae in a hamster model for flavivirus infections. Brain Pathol. 2003, 13, 279–290. [Google Scholar] [CrossRef] [PubMed]
  12. Adams, A.P.; Da Rosa, A.P.T.; Nunes, M.R.; Xiao, S.Y.; Tesh, R.B. Pathogenesis of Modoc virus (Flaviviridae; Flavivirus) in persistently infected hamsters. Am. J. Trop. Med. Hyg. 2013, 88, 455–460. [Google Scholar] [CrossRef] [PubMed] [Green Version]
  13. Simmonds, P.; Becher, P.; Bukh, J.; Gould, E.A.; Meyers, G.; Monath, T.; Muerhoff, S.; Pletnev, A.; Rico-Hesse, R.; Smith, D.B.; et al. ICTV Virus Taxonomy Profile: Flaviviridae. J. Gen. Virol. 2017, 98, 2–3. [Google Scholar] [CrossRef] [PubMed]
  14. Brett, D.; Lindenbach, H.-J.T.; Charles, M. Rice: Flaviviridae: The Viruses and Their Replication. In Fields Virology, 5th ed.; Howley, D.M., Ka, P.M., Eds.; Lippincott-Raven: Philadelphia, PA, USA, 2007. [Google Scholar]
  15. Guzman, A.; Isturiz, R.E. Update on the global spread of dengue. Int. J. Antimicrob. Agents. 2010, 36, S40–S42. [Google Scholar] [CrossRef] [PubMed]
  16. Vorou, R. Zika virus, vectors, reservoirs, amplifying hosts, and their potential to spread worldwide: What we know and what we should investigate urgently. Int. J. Infect. Dis. 2016, 48, 85–90. [Google Scholar] [CrossRef] [PubMed] [Green Version]
  17. Collins, M.H.; Metz, S.W. Progress and Works in Progress: Update on Flavivirus Vaccine Development. Clin. Ther. 2017, 39, 1519–1536. [Google Scholar] [CrossRef] [PubMed] [Green Version]
  18. Centers for Disease Control and Prevention. West Nile Virus Disease Cases Reported to CDC by State of Residence, 1999–2017. 2017. Available online: https://www.cdc.gov/westnile/resources/pdfs/data/West-Nile-virus-disease-cases-reported-to-CDC-by-state_1999-2017.pdf (accessed on 1 May 2018).
  19. Centers for Disease Control and Prevention. CDC: Zika Virus Case Count in the US; Centers for Disease Control and Prevention: Atlanta, GA, USA, 2018.
  20. World Health Organization. Japanese Encephalitis; World Health Organization: Geneva, Switzerland, 2015; Volume 2016.
  21. World Health Organization. Yellow Fever; World Health Organization: Geneva, Switzerland, 2016.
  22. World Health Organization. Dengue and Severe Dengue; World Health Organization: Geneva, Switzerland, 2016.
  23. Bhatt, S.; Gething, P.W.; Brady, O.J.; Messina, J.P.; Farlow, A.W.; Moyes, C.L.; Drake, J.M.; Brownstein, J.S.; Hoen, A.G.; Sankoh, O.; et al. The global distribution and burden of dengue. Nature 2013, 496, 504–507. [Google Scholar] [CrossRef]
  24. Monaghan, A.J.; Sampson, K.M.; Steinhoff, D.F.; Ernst, K.C.; Ebi, K.L.; Jones, B.; Hayden, M.H. The potential impacts of 21st century climatic and population changes on human exposure to the virus vector mosquito Aedes aegypti. Clim. Chang. 2016, 146, 487–500. [Google Scholar] [CrossRef]
  25. Guzman, M.G.; Harris, E. Dengue. Lancet 2015, 385, 453–465. [Google Scholar] [CrossRef]
  26. Kraemer, M.U.G.; Reiner, R.C., Jr.; Brady, O.J.; Messina, J.P.; Gilbert, M.; Pigott, D.M.; Yi, D.; Johnson, K.; Earl, L.; Marczak, L.B.; et al. Past and future spread of the arbovirus vectors Aedes aegypti and Aedes albopictus. Nat. Microbiol. 2019, 4, 854–863. [Google Scholar] [CrossRef]
  27. Barbour, A.G. Infection resistance and tolerance in Peromyscus spp., natural reservoirs of microbes that are virulent for humans. Semin. Cell Dev. Biol. 2017, 61, 115–122. [Google Scholar] [CrossRef] [PubMed] [Green Version]
  28. Wahl-Jensen, V.; Bollinger, L.; Safronetz, D.; de Kok-Mercado, F.; Scott, D.P.; Ebihara, H. Use of the Syrian hamster as a new model of ebola virus disease and other viral hemorrhagic fevers. Viruses 2012, 4, 3754–3784. [Google Scholar] [CrossRef] [PubMed] [Green Version]
  29. Zivcec, M.; Safronetz, D.; Haddock, E.; Feldmann, H.; Ebihara, H. Validation of assays to monitor immune responses in the Syrian golden hamster (Mesocricetus auratus). J. Immunol. Methods 2011, 368, 24–35. [Google Scholar] [CrossRef] [PubMed]
  30. Davis, J.W.; Hardy, J.L. Characterization of persistent Modoc viral infections in Syrian hamsters. Infect. Immun. 1974, 10, 328–334. [Google Scholar] [CrossRef] [Green Version]
  31. Davis, J.W.; Hardy, J.L.; Reeves, W.C. Modoc viral infections in the deer mouse Peromyscus maniculatus. Infect. Immun. 1974, 10, 1362–1369. [Google Scholar] [CrossRef] [Green Version]
  32. Fairbrother, A.; Yuill, T.M. Experimental infection and horizontal transmission of Modoc virus in deer mice (Peromyscus maniculatus). J. Wildl. Dis. 1987, 23, 179–185. [Google Scholar] [CrossRef] [Green Version]
  33. Leyssen, P.; Paeshuyse, J.; Charlier, N.; Van Lommel, A.; Drosten, C.; De Clercq, E.; Neyts, J. Impact of direct virus-induced neuronal dysfunction and immunological damage on the progression of flavivirus (Modoc) encephalitis in a murine model. J. Neurovirol. 2003, 9, 69–78. [Google Scholar] [CrossRef]
  34. Bozza, F.A.; Cruz, O.G.; Zagne, S.M.; Azeredo, E.L.; Nogueira, R.M.; Assis, E.F.; Bozza, P.T.; Kubelka, C.F. Multiplex cytokine profile from dengue patients: MIP-1beta and IFN-gamma as predictive factors for severity. BMC Infect. Dis. 2008, 8, 86. [Google Scholar] [CrossRef] [Green Version]
  35. Uddin, M.J.; Suen, W.W.; Bosco-Lauth, A.; Hartwig, A.E.; Hall, R.A.; Bowen, R.A.; Bielefeldt-Ohmann, H. Kinetics of the West Nile virus induced transcripts of selected cytokines and Toll-like receptors in equine peripheral blood mononuclear cells. Vet. Res. 2016, 47, 61. [Google Scholar] [CrossRef] [Green Version]
  36. Winter, P.M.; Dung, N.M.; Loan, H.T.; Kneen, R.; Wills, B.; Thu, L.T.; House, D.; White, N.J.; Farrar, J.J.; Hart, C.A.; et al. Proinflammatory cytokines and chemokines in humans with Japanese encephalitis. J. Infect. Dis. 2004, 190, 1618–1626. [Google Scholar] [CrossRef] [Green Version]
  37. Mallarino, R.; Linden, T.A.; Linnen, C.R.; Hoekstra, H.E. The role of isoforms in the evolution of cryptic coloration in Peromyscus mice. Mol. Ecol. 2017, 26, 245–258. [Google Scholar] [CrossRef]
  38. Schountz, T.; Acuna-Retamar, M.; Feinstein, S.; Prescott, J.; Torres-Perez, F.; Podell, B.; Peters, S.; Ye, C.; Black, W.C.t.; Hjelle, B. Kinetics of immune responses in deer mice experimentally infected with Sin Nombre virus. J. Virol. 2012, 86, 10015–10027. [Google Scholar] [CrossRef] [PubMed] [Green Version]
  39. Leyssen, P.; Van Lommel, A.; Drosten, C.; Schmitz, H.; De Clercq, E.; Neyts, J. A novel model for the study of the therapy of flavivirus infections using the Modoc virus. Virology 2001, 279, 27–37. [Google Scholar] [CrossRef] [PubMed] [Green Version]
  40. Livak, K.J.; Schmittgen, T.D. Analysis of relative gene expression data using real-time quantitative PCR and the 2(-Delta Delta C(T)) Method. Methods 2001, 25, 402–408. [Google Scholar] [CrossRef] [PubMed]
  41. Espitia, C.M.; Saldarriaga, O.A.; Travi, B.L.; Osorio, E.Y.; Hernandez, A.; Band, M.; Patel, M.J.; Medina, A.A.; Cappello, M.; Pekosz, A.; et al. Transcriptional profiling of the spleen in progressive visceral leishmaniasis reveals mixed expression of type 1 and type 2 cytokine-responsive genes. BMC Immunol. 2014, 15, 38. [Google Scholar] [CrossRef] [Green Version]
  42. Nagata, N.; Iwata-Yoshikawa, N.; Hayasaka, D.; Sato, Y.; Kojima, A.; Kariwa, H.; Takashima, I.; Takasaki, T.; Kurane, I.; Sata, T.; et al. The pathogenesis of 3 neurotropic flaviviruses in a mouse model depends on the route of neuroinvasion after viremia. J. Neuropathol. Exp. Neurol. 2015, 74, 250–260. [Google Scholar] [CrossRef] [Green Version]
  43. Cruz Hernandez, S.I.; Puerta-Guardo, H.N.; Flores Aguilar, H.; Gonzalez Mateos, S.; Lopez Martinez, I.; Ortiz-Navarrete, V.; Ludert, J.E.; Angel, R.M. Primary dengue virus infections induce differential cytokine production in Mexican patients. Mem. Inst. Oswaldo. Cruz. 2016, 111, 161–167. [Google Scholar] [CrossRef]
  44. Garcia, M.N.; Hause, A.M.; Walker, C.M.; Orange, J.S.; Hasbun, R.; Murray, K.O. Evaluation of prolonged fatigue post-West Nile virus infection and association of fatigue with elevated antiviral and proinflammatory cytokines. Viral. Immunol. 2014, 27, 327–333. [Google Scholar] [CrossRef] [Green Version]
  45. Kuczera, D.; Assolini, J.P.; Tomiotto-Pellissier, F.; Pavanelli, W.R.; Silveira, G.F. Highlights for Dengue Immunopathogenesis: Antibody-Dependent Enhancement, Cytokine Storm, and Beyond. J. Interferon Cytokine Res. 2018, 38, 69–80. [Google Scholar] [CrossRef]
  46. Billiau, A.; Matthys, P. Interferon-gamma: A historical perspective. Cytokine Growth Factor Rev. 2009, 20, 97–113. [Google Scholar] [CrossRef]
  47. Kang, S.; Brown, H.M.; Hwang, S. Direct Antiviral Mechanisms of Interferon-Gamma. Immune. Netw. 2018, 18, e33. [Google Scholar] [CrossRef] [PubMed]
  48. Shrestha, B.; Wang, T.; Samuel, M.A.; Whitby, K.; Craft, J.; Fikrig, E.; Diamond, M.S. Gamma interferon plays a crucial early antiviral role in protection against West Nile virus infection. J. Virol. 2006, 80, 5338–5348. [Google Scholar] [CrossRef] [PubMed] [Green Version]
  49. Garcia-Nicolas, O.; Lewandowska, M.; Ricklin, M.E.; Summerfield, A. Monocyte-Derived Dendritic Cells as Model to Evaluate Species Tropism of Mosquito-Borne Flaviviruses. Front. Cell Infect. Microbiol. 2019, 9, 5. [Google Scholar] [CrossRef] [PubMed] [Green Version]
  50. Rouse, B.T.; Sehrawat, S. Immunity and immunopathology to viruses: What decides the outcome? Nat. Rev. Immunol. 2010, 10, 514–526. [Google Scholar] [CrossRef]
  51. Tsai, T.T.; Chuang, Y.J.; Lin, Y.S.; Wan, S.W.; Chen, C.L.; Lin, C.F. An emerging role for the anti-inflammatory cytokine interleukin-10 in dengue virus infection. J. Biomed. Sci. 2013, 20, 40. [Google Scholar] [CrossRef] [Green Version]
  52. Bhatt, R.S.; Kothari, S.T.; Gohil, D.J.; D’Souza, M.; Chowdhary, A.S. Novel evidence of microglial immune response in impairment of Dengue infection of CNS. Immunobiology 2015, 220, 1170–1176. [Google Scholar] [CrossRef]
  53. Brooks, D.G.; Trifilo, M.J.; Edelmann, K.H.; Teyton, L.; McGavern, D.B.; Oldstone, M.B. Interleukin-10 determines viral clearance or persistence in vivo. Nat. Med. 2006, 12, 1301–1309. [Google Scholar] [CrossRef]
  54. Brockman, M.A.; Kwon, D.S.; Tighe, D.P.; Pavlik, D.F.; Rosato, P.C.; Sela, J.; Porichis, F.; Le Gall, S.; Waring, M.T.; Moss, K.; et al. IL-10 is up-regulated in multiple cell types during viremic HIV infection and reversibly inhibits virus-specific T cells. Blood 2009, 114, 346–356. [Google Scholar] [CrossRef] [Green Version]
  55. Cavalcanti, Y.V.; Brelaz, M.C.; Neves, J.K.; Ferraz, J.C.; Pereira, V.R. Role of TNF-Alpha, IFN-Gamma, and IL-10 in the Development of Pulmonary Tuberculosis. Pulm. Med. 2012, 2012, 745483. [Google Scholar] [CrossRef]
  56. Best, S.M. The Many Faces of the Flavivirus NS5 Protein in Antagonism of Type I Interferon Signaling. J. Virol. 2017, 91, e01970-16. [Google Scholar] [CrossRef] [Green Version]
  57. Munoz-Jordan, J.L.; Fredericksen, B.L. How flaviviruses activate and suppress the interferon response. Viruses 2010, 2, 676–691. [Google Scholar] [CrossRef]
  58. Brinton, M.A. Genetic resistance to flaviviruses. Monoclon. Antib. Immunodiagn. Immunother. 2014, 33, 183–185. [Google Scholar] [CrossRef] [PubMed] [Green Version]
  59. Graham, J.B.; Thomas, S.; Swarts, J.; McMillan, A.A.; Ferris, M.T.; Suthar, M.S.; Treuting, P.M.; Ireton, R.; Michael, G., Jr.; Lund, J.M. Genetic diversity in the collaborative cross model recapitulates human West Nile virus disease outcomes. mBio 2015, 6, e00493-15. [Google Scholar] [CrossRef] [PubMed] [Green Version]
  60. Mashimo, T.; Lucas, M.; Simon-Chazottes, D.; Frenkiel, M.P.; Montagutelli, X.; Ceccaldi, P.E.; Deubel, V.; Guenet, J.L.; Despres, P. A nonsense mutation in the gene encoding 2’–5’-oligoadenylate synthetase/L1 isoform is associated with West Nile virus susceptibility in laboratory mice. Proc. Natl. Acad. Sci. USA 2002, 99, 11311–11316. [Google Scholar] [CrossRef] [PubMed] [Green Version]
  61. Perelygin, A.A.; Scherbik, S.V.; Zhulin, I.B.; Stockman, B.M.; Li, Y.; Brinton, M.A. Positional cloning of the murine flavivirus resistance gene. Proc. Natl. Acad. Sci. USA 2002, 99, 9322–9327. [Google Scholar] [CrossRef] [PubMed] [Green Version]
  62. Scherbik, S.V.; Stockman, B.M.; Brinton, M.A. Differential expression of interferon (IFN) regulatory factors and IFN-stimulated genes at early times after West Nile virus infection of mouse embryo fibroblasts. J. Virol. 2007, 81, 12005–12018. [Google Scholar] [CrossRef] [Green Version]
  63. Fredericksen, B.L.; Gale, M., Jr. West Nile virus evades activation of interferon regulatory factor 3 through RIG-I-dependent and -independent pathways without antagonizing host defense signaling. J. Virol. 2006, 80, 2913–2923. [Google Scholar] [CrossRef] [Green Version]
Figure 1. Weight gain or loss in (a) Peromyscus maniculatus and (b) Mesocricetus auratus over the experimental period. Each datapoint represents the weight for a particular infected individual at that timepoint or the mean (+/− SEM) weight of two mock-infected individuals at the same timepoint.
Viruses 14 01026 g001
Figure 2. Viral RNA detected in select tissues and fluids of Peromyscus maniculatus (PM, squares) and Mesocricetus auratus (MA, circles). Viral RNA quantified via RT-qPCR was translated into TCID50 equivalent titers. Datapoints represent the mean (+/− SEM) viral load recovered from infected replicates at each timepoint (n = 3). Asterisks (*) represent a significant difference in RNA loads between each species at a particular timepoint, as determined by Mann–Whitney tests. Dotted lines represent the limit of detection at an infective equivalent of approximately 101.7 TCID50.
Viruses 14 01026 g002
Figure 3. Cytokine gene expression levels as detected by RT-qPCR in select tissues from Peromyscus maniculatus (PM) and Mesocricetus auratus (MA). Each timepoint reflects the mean relative expression levels from infected replicates (n = 3) of each species. Bars with asterisks (*) denote a significant difference in the expression levels between species at that collection timepoint (uncorrected for multiple tests).
Viruses 14 01026 g003
Figure 4. Expression levels of Oas1b in Peromyscus maniculatus (PM) and Mesocricetus auratus (MA) tissues as detected by RT-qPCR. Each timepoint reflects the mean relative expression levels from infected replicates (n = 3) of each species. Bars with asterisks (*) denote a significant difference in relative expression between species (uncorrected for multiple tests).
Viruses 14 01026 g004
Table 1. Sequence data and amplification efficiency for Peromyscus maniculatus primers.
Target Sequence (5′ to 3′)bpR2Eff. (%)AccessionReference
β-ActinF
R
GCTACAGCTTCACCACCACA
TCTCCAGGGAGGAAGAGGAT
1231.000102.0XM_006998174.2[37]
Oas1bF
R
CAGTATGCCCTGGAGCTGC
GTACTTGGTGACCAGTTCC
1110.99898.3XM_006970848.1This study
IfngF
R
ACAGCAGTGAGGAGAAACGG
GACAGGCGGTACATCACTCC
1150.97094.7AY289494.1This study
TnfF
R
GGGCTGTACCTCGTCTACTC
ACAGGAGGTTGACTTTGTCC
1210.999100.4XM_006995235.2This study
TgfbF
R
CGTGGAACTCTACCAGAAATACAGC
TCAAAAGACAACCACTCAGGCG
960.99995.6XM_006988036.2[38]
IL6F
R
CCATCCAACTCATCCTGAAAGC
CCACAGATTGGTACACATAGGCAC
1010.99996.1AY256518.1[38]
IL10F
R
CAGACCTACACGCTTCGAG
CCCAGGTAACCCTTAAAGTCC
1280.999111.2XM_006995328.2This study
MODV-NS5F
R
CCAGGACAAGTCATGTGGTAGC
TCCCAAAGATGTTCCTCACCTT
1010.998107.5NC_003635.1[39]
Publisher’s Note: MDPI stays neutral with regard to jurisdictional claims in published maps and institutional affiliations.

