
Global Evolutionary History and Dynamics of Dengue Viruses Inferred from Whole Genome Sequences

 ,
,  ,
,  ,
, 

Abstract
:1. Introduction
2. Materials and Methods
2.1. Sequence Dataset
2.2. Virus Isolates, Viral RNA Extraction and Sequencing
2.3. Bayesian Evolutionary Analyses
2.4. Maximum Likelihood Phylogenetic Analyses
2.5. Selection Pressure Analysis
3. Results
3.1. Bayesian Evolutionary Analysis and TMRCA
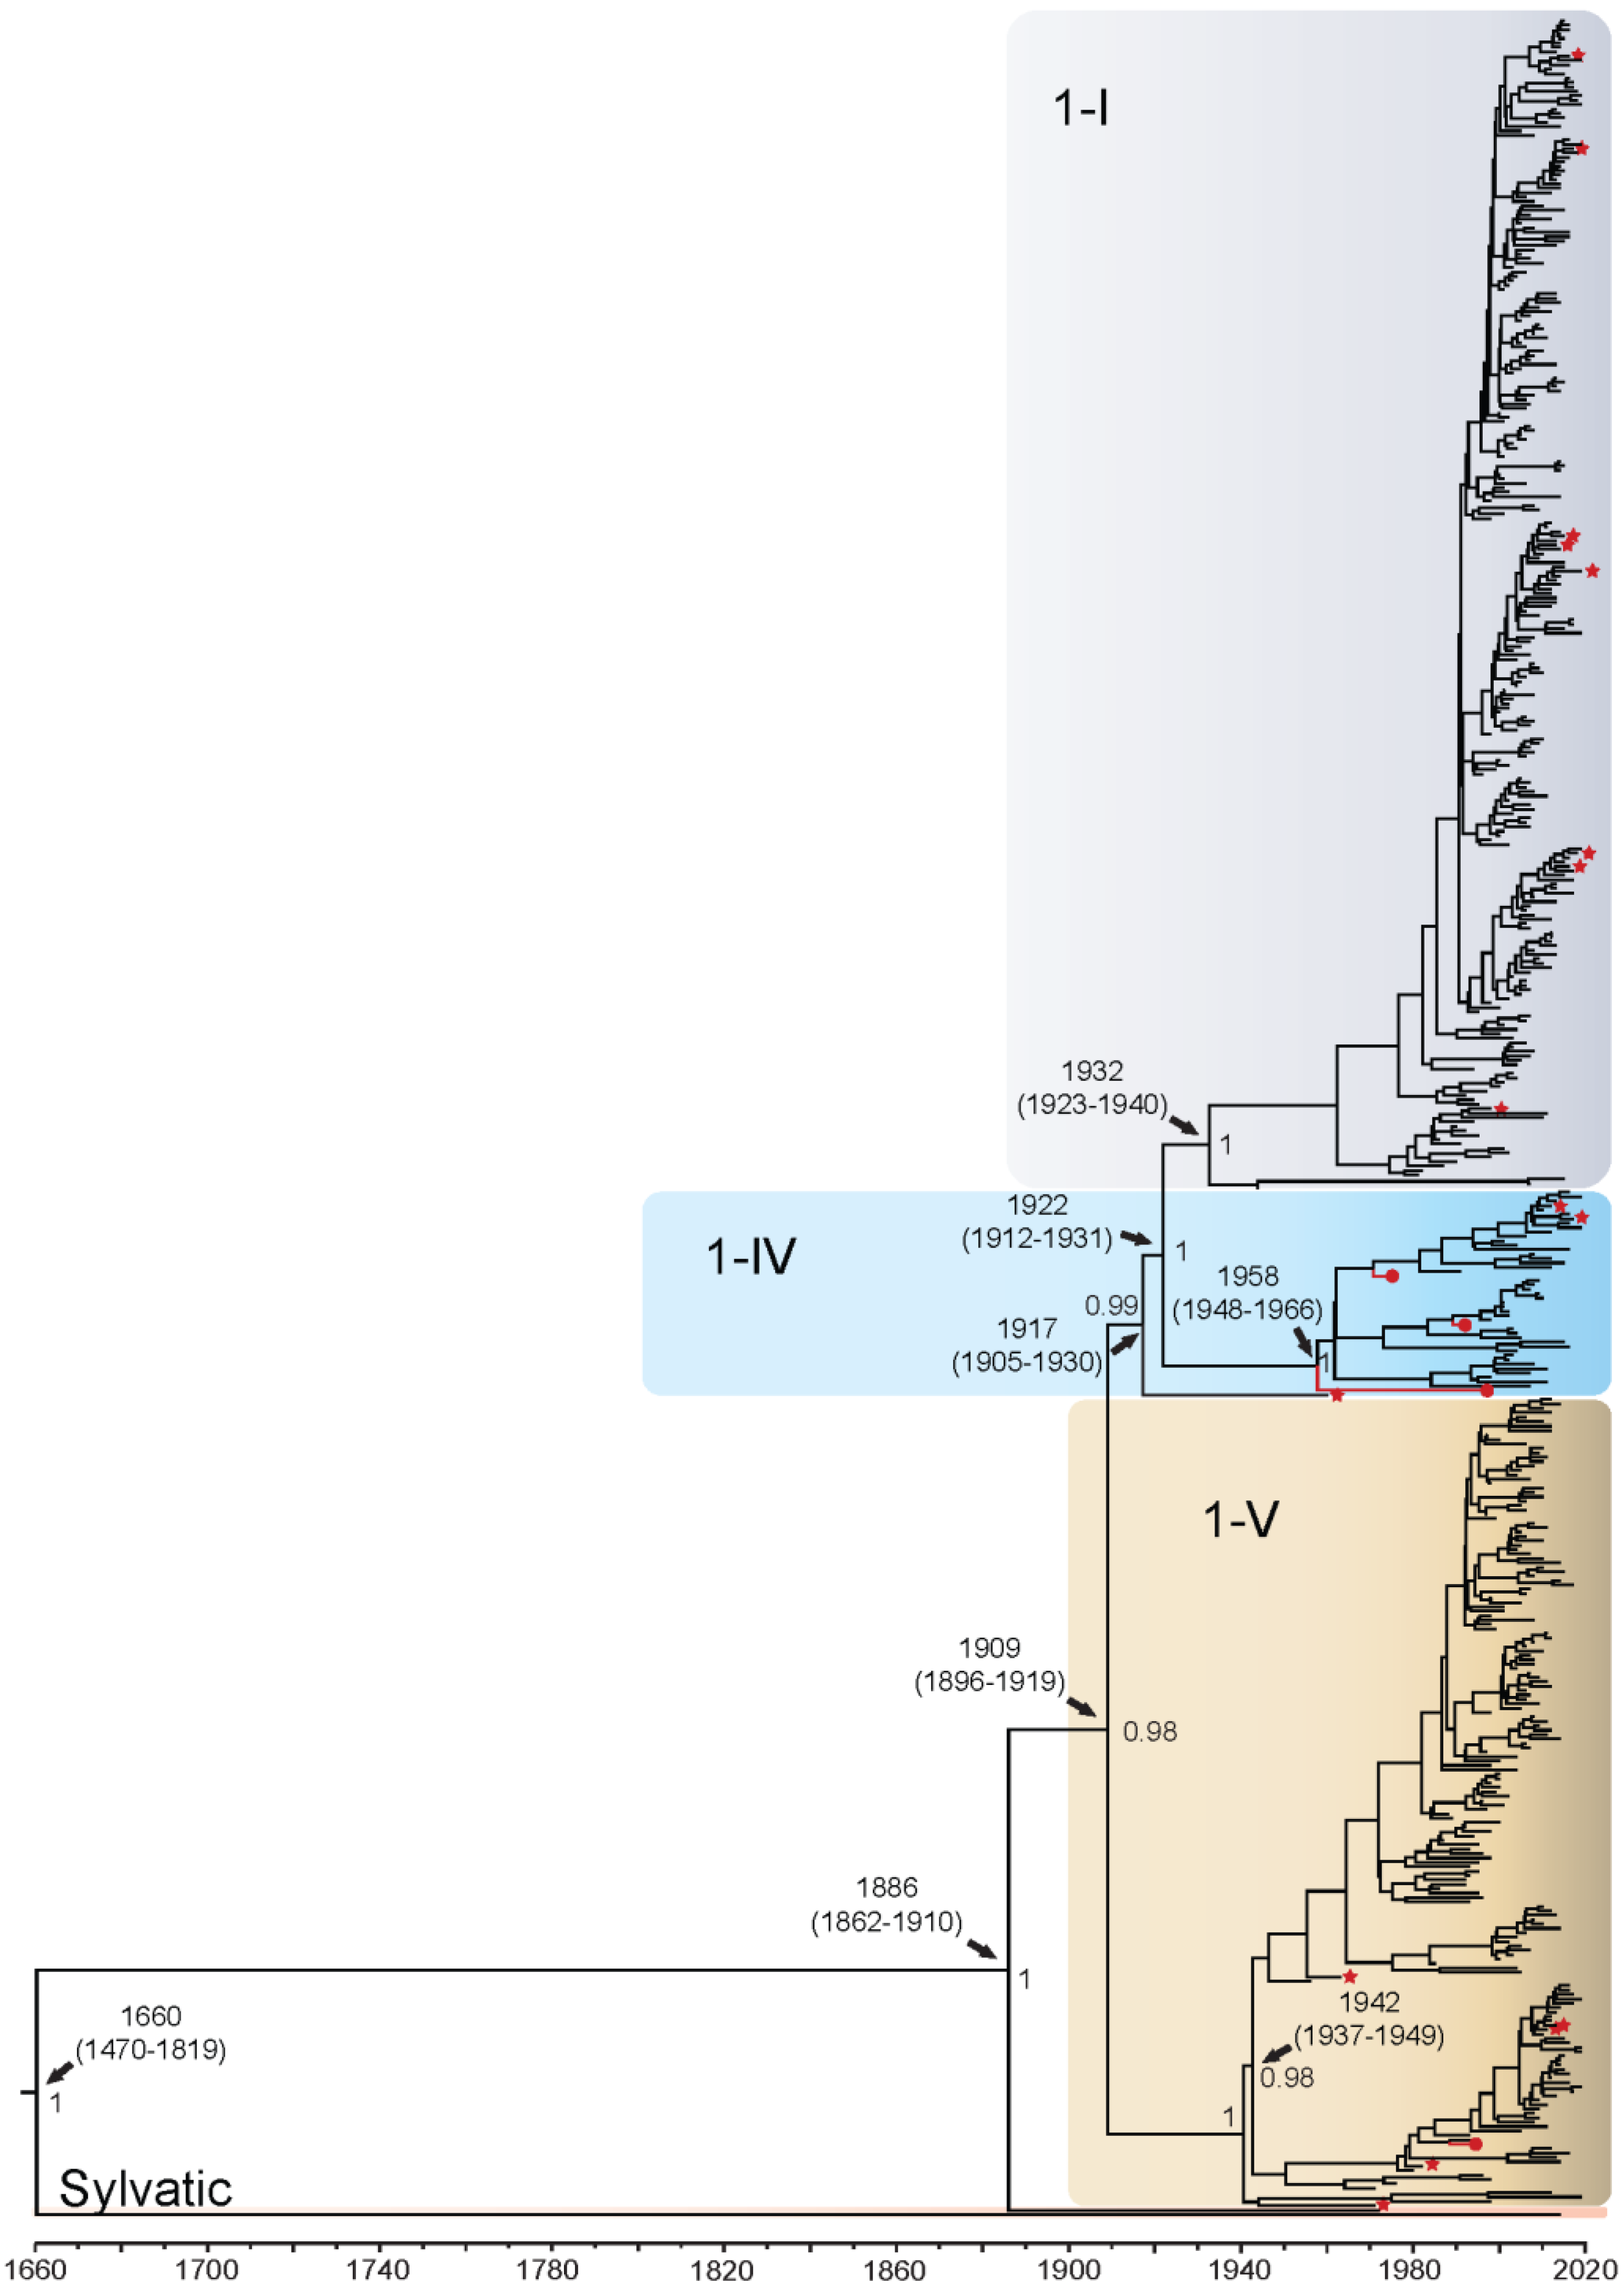
3.1.1. DENV1
3.1.2. DENV2
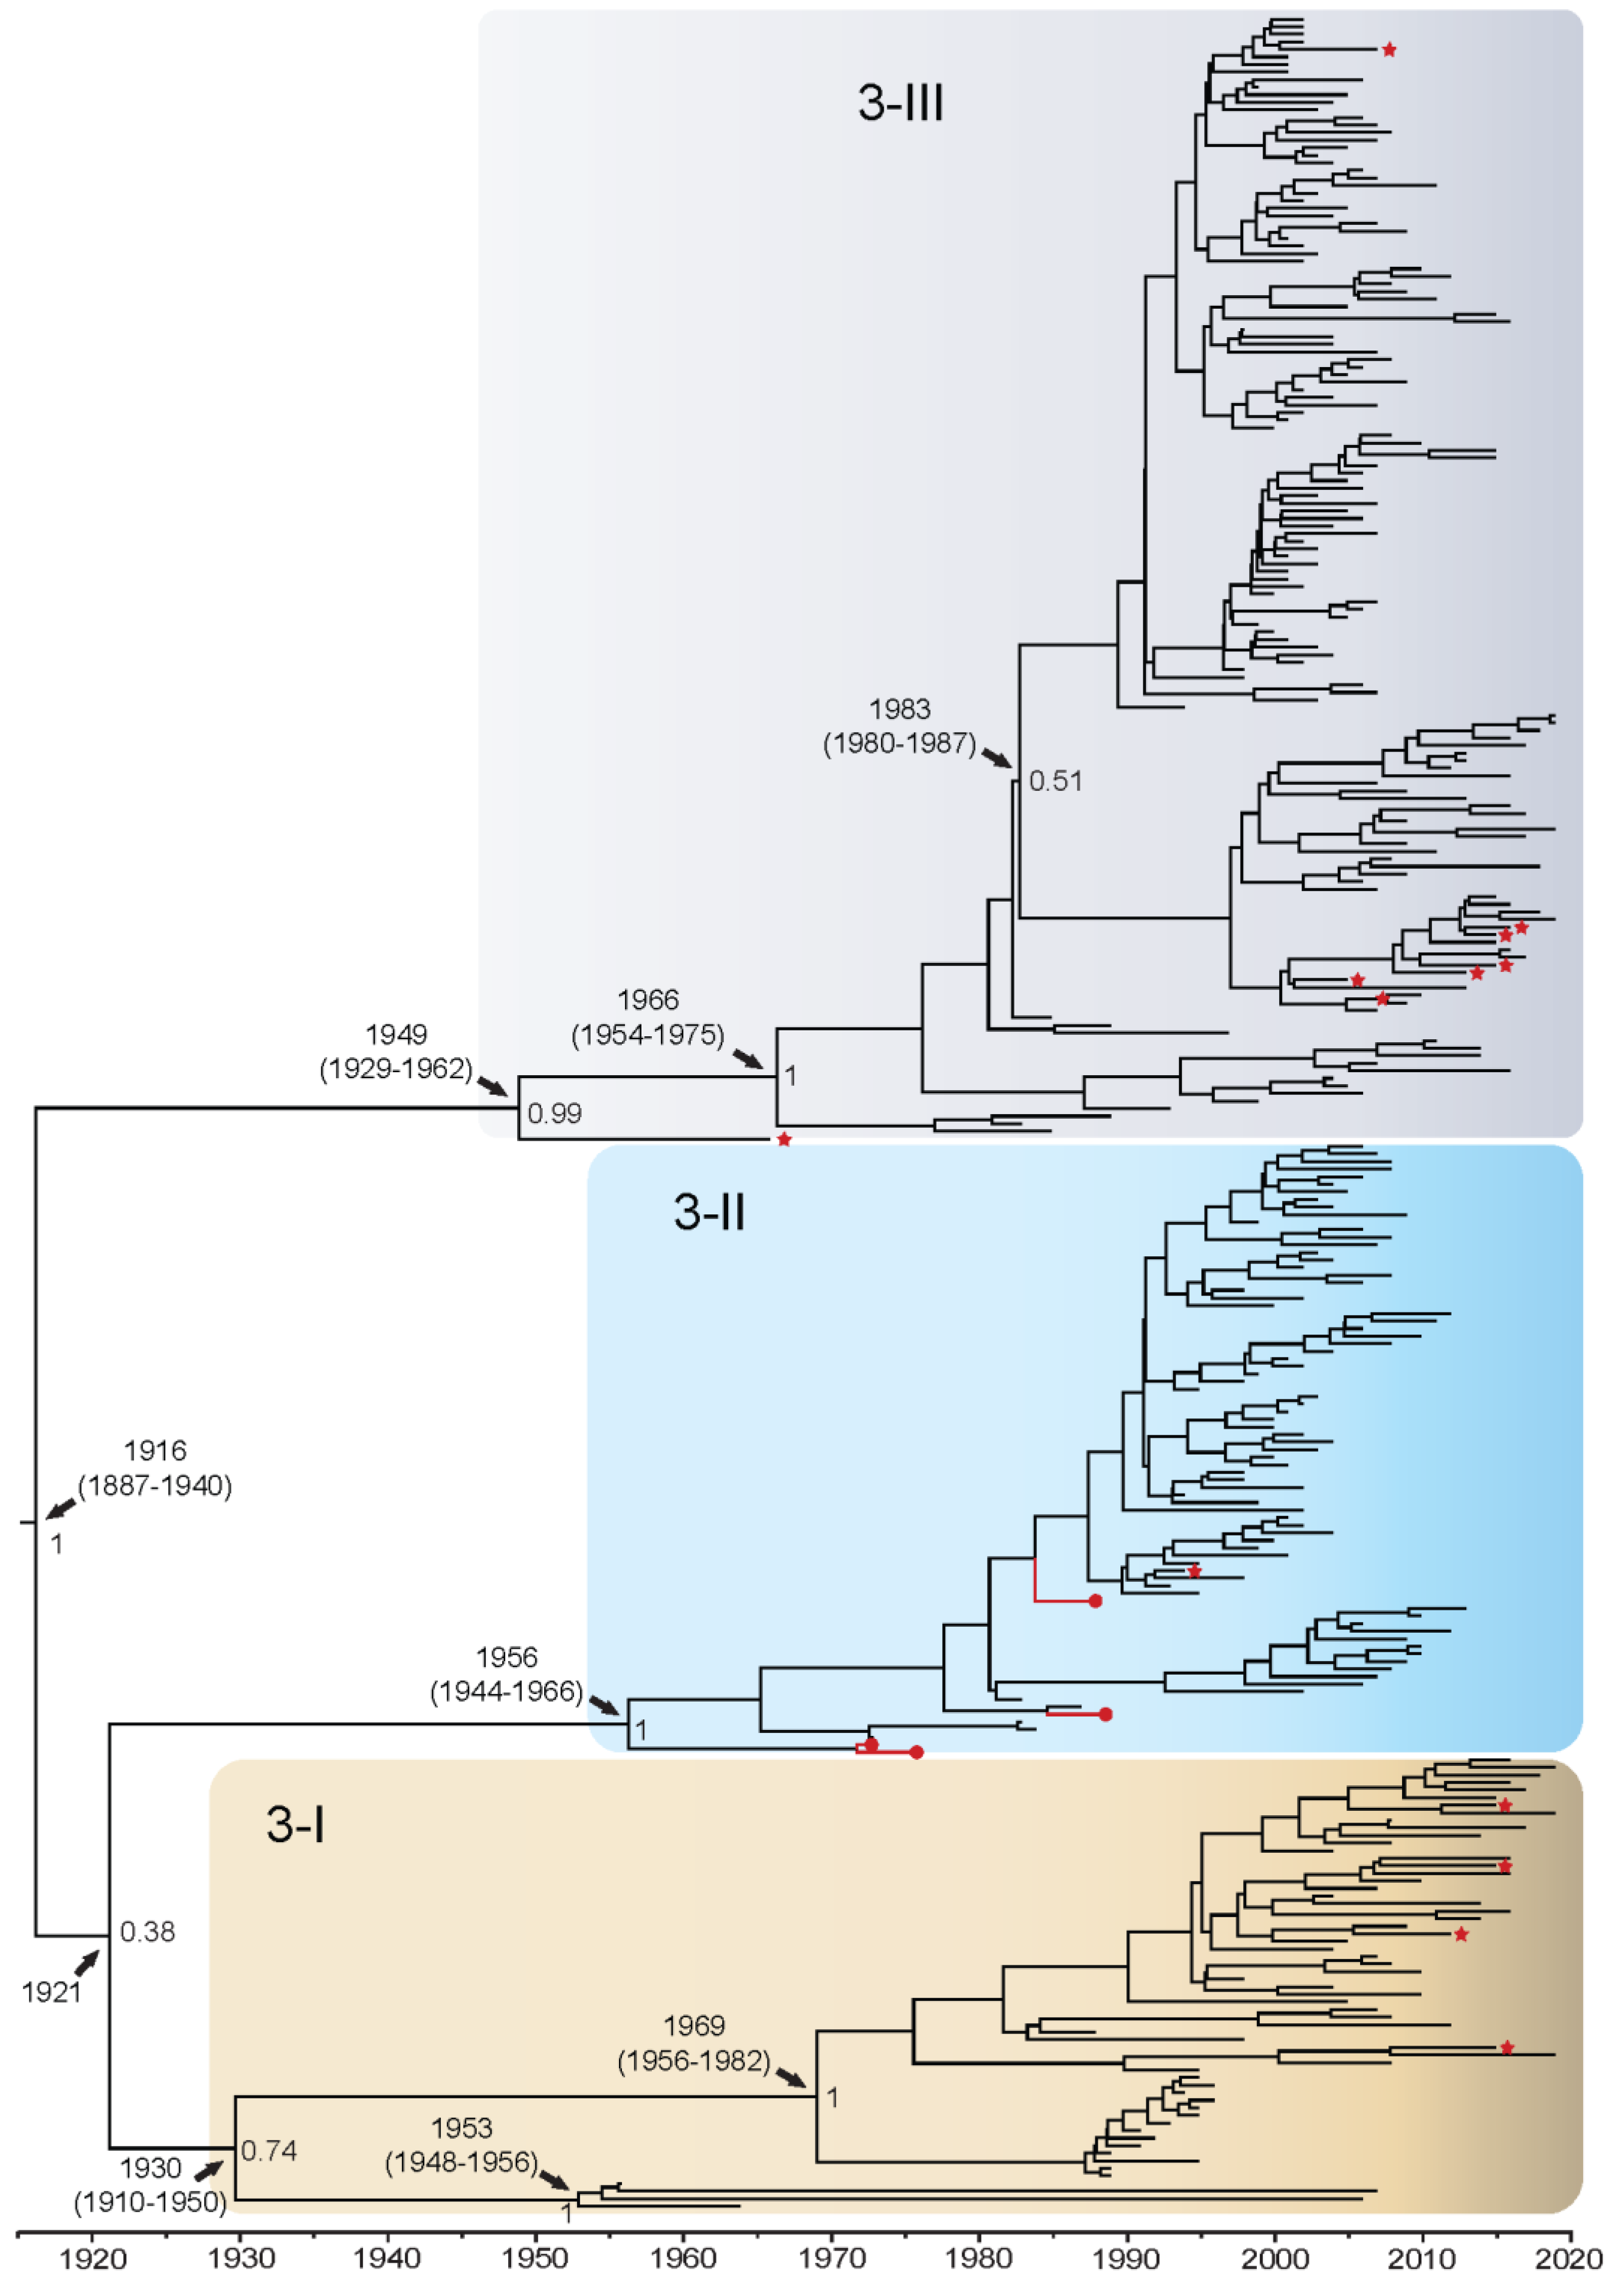
3.1.3. DENV3
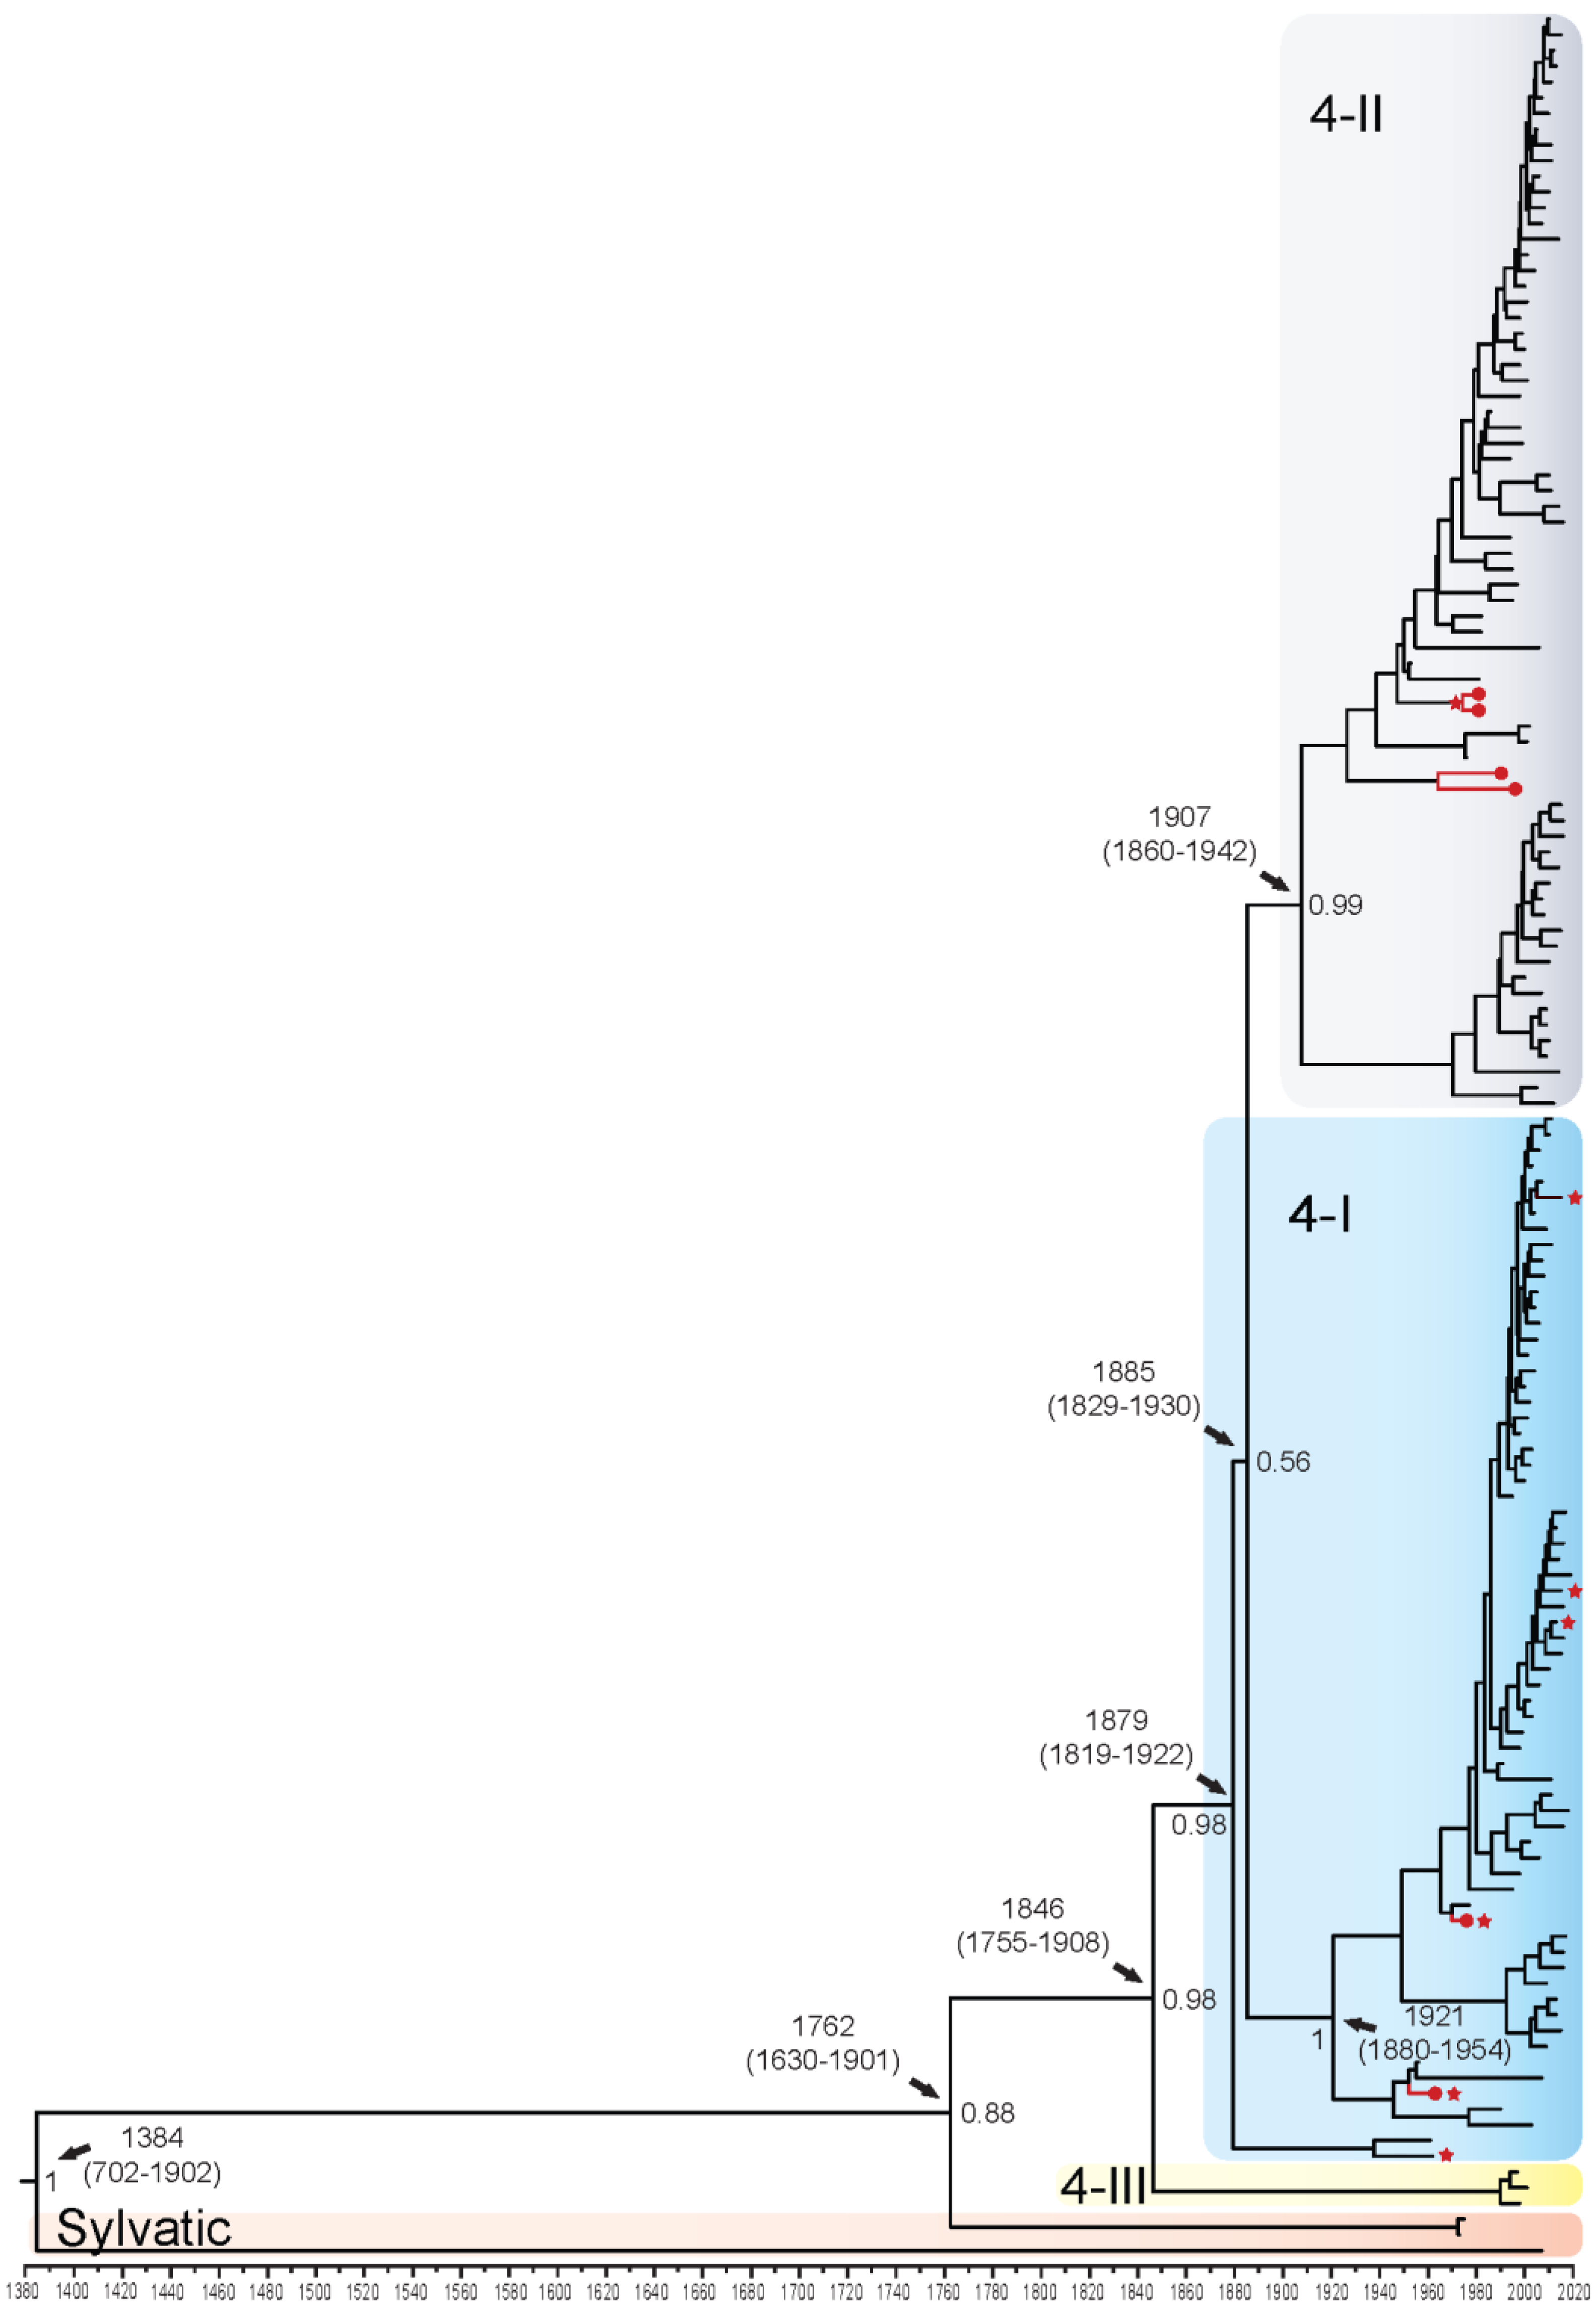
3.1.4. DENV4
3.1.5. Genotype and Clade Diversification
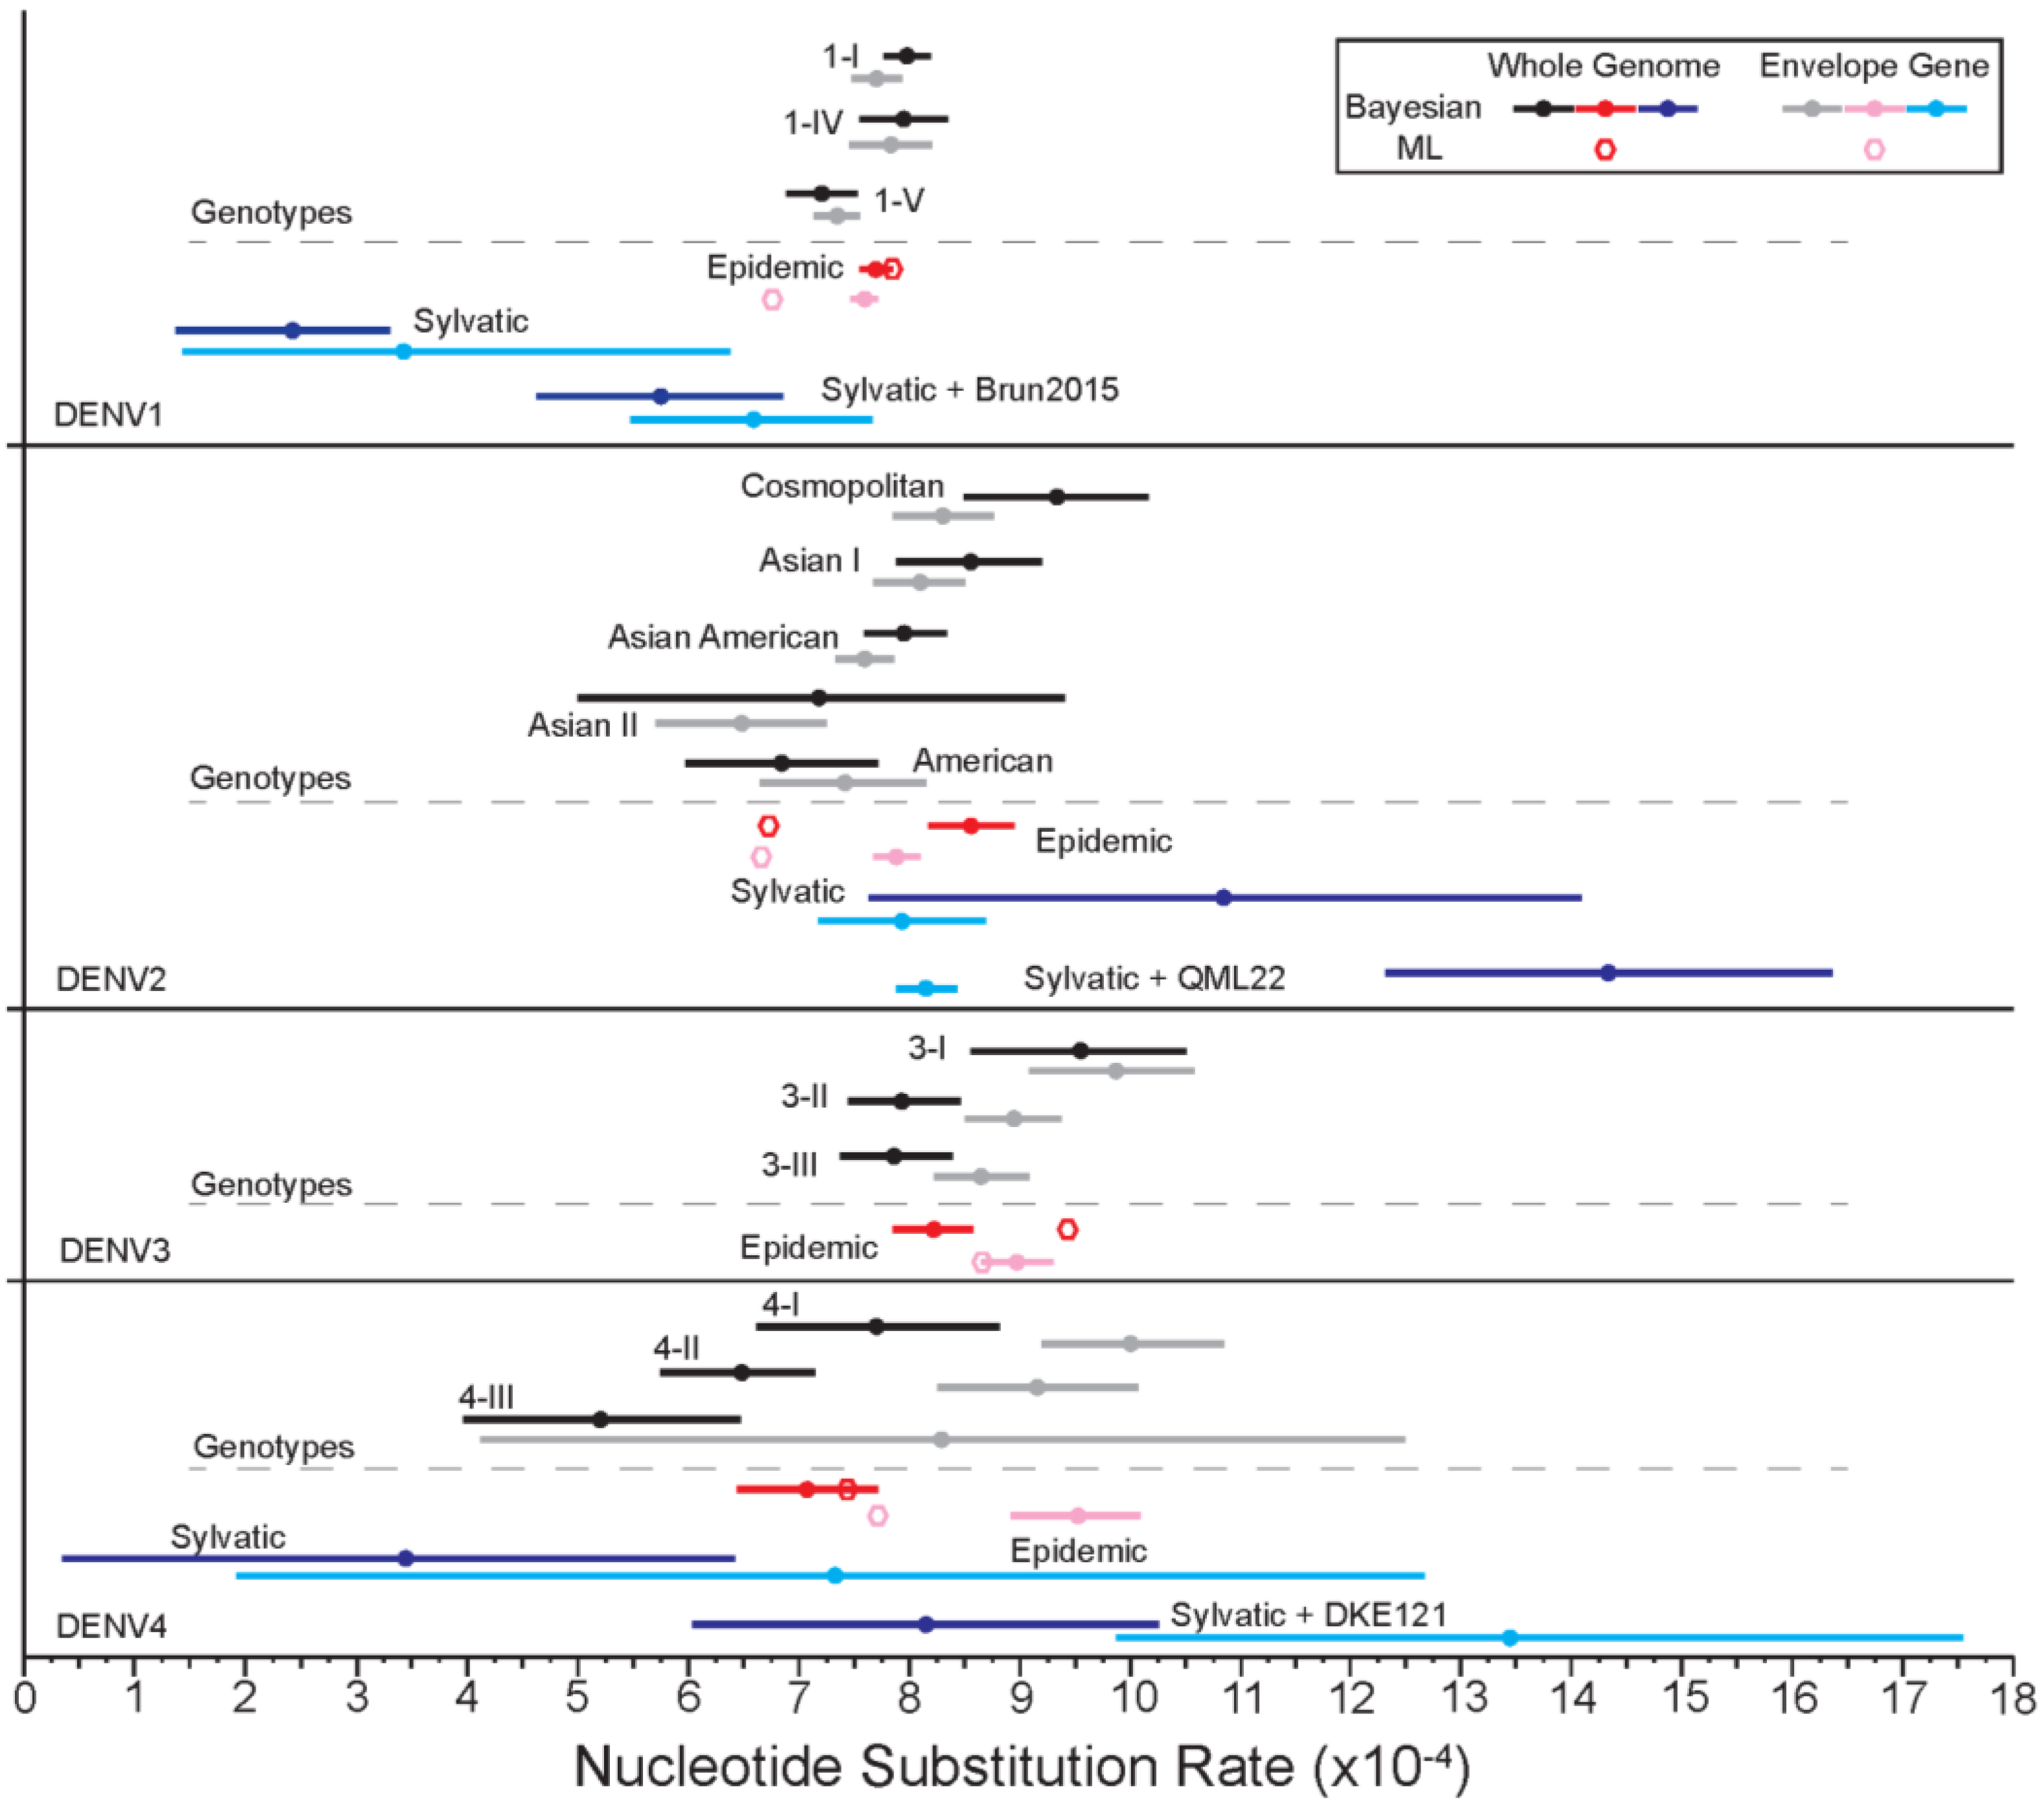
3.1.6. Evolutionary Rates
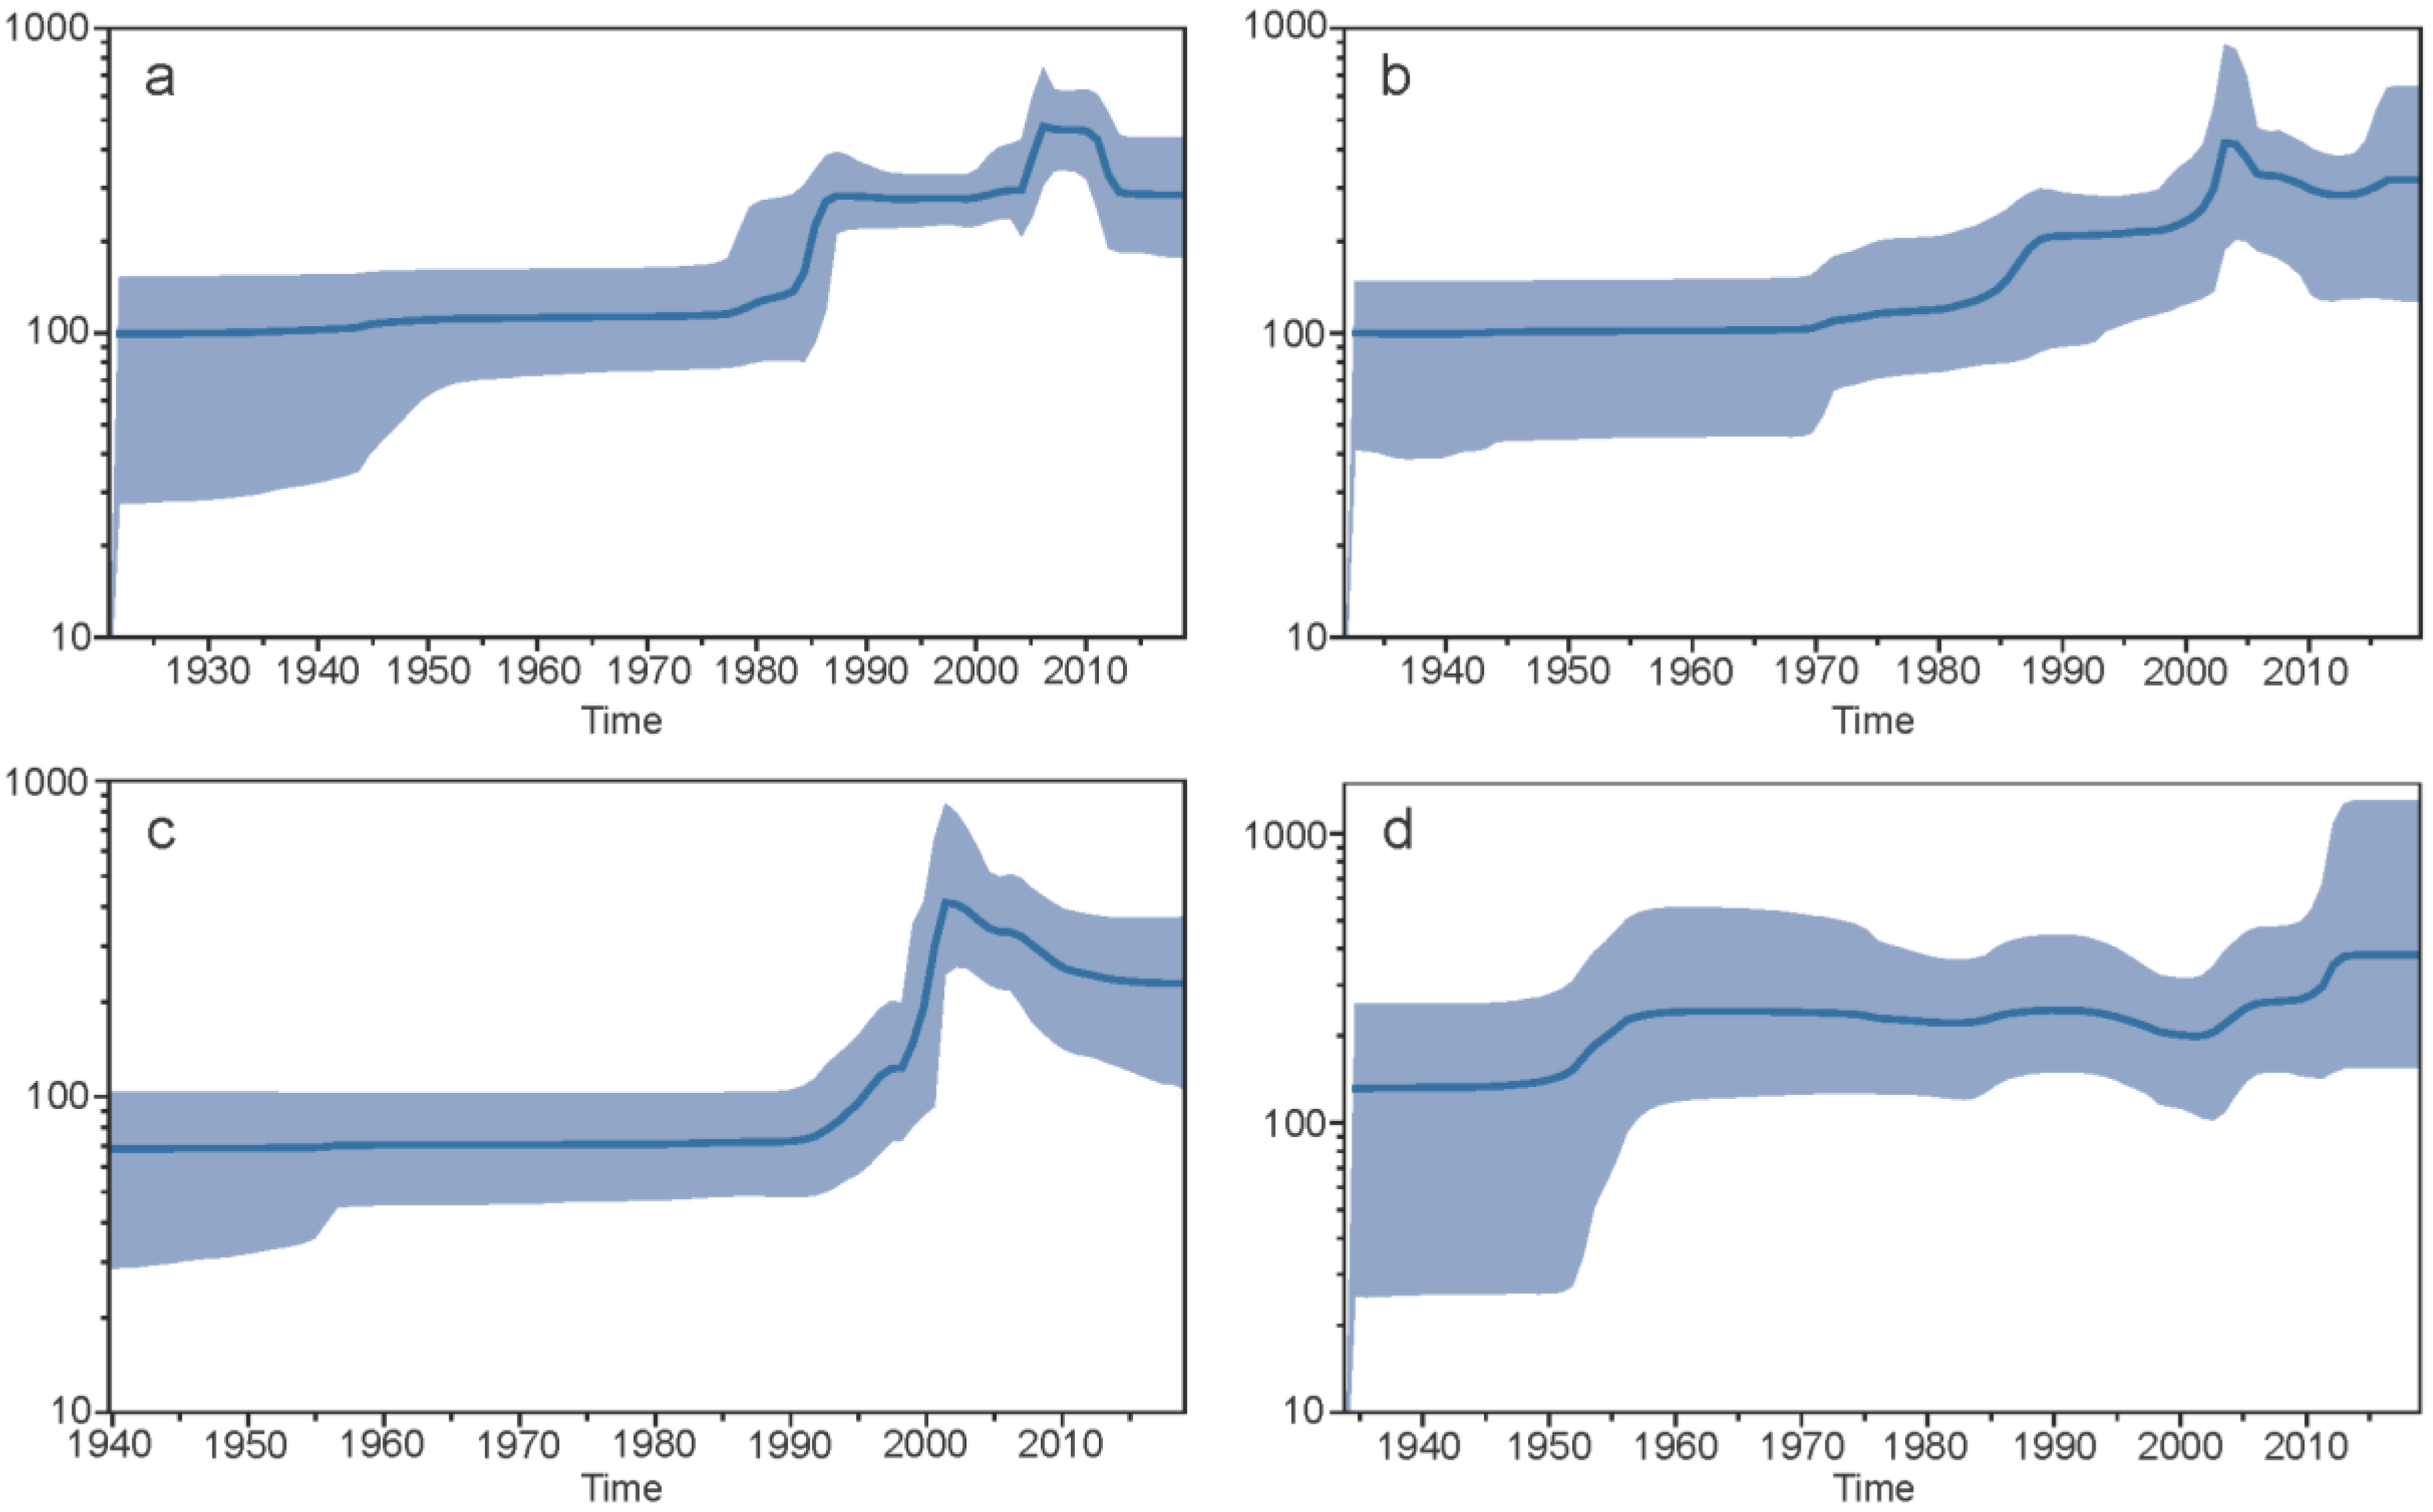
3.1.7. Demographic Histories
3.2. Selection Pressure Analysis
3.2.1. Site Specific Selection
3.2.2. Branch Specific Selection
4. Discussion
Supplementary Materials
Author Contributions
Funding
Institutional Review Board Statement
Informed Consent Statement
Data Availability Statement
Acknowledgments
Conflicts of Interest
References
- Lourenco, J.; Tennant, W.; Faria, N.R.; Walker, A.; Gupta, S.; Recker, M. Challenges in dengue research: A computational perspective. Evol. Appl. 2018, 11, 516–533. [Google Scholar] [CrossRef] [PubMed] [Green Version]
- World Health Organization. Dengue and Sever Dengue Fact Sheet. Available online: https://www.who.int/news-room/fact-sheets/detail/dengue-and-severe-dengue (accessed on 20 April 2020).
- Bhatt, S.; Gething, P.W.; Brady, O.J.; Messina, J.P.; Farlow, A.W.; Moyes, C.L.; Drake, J.M.; Brownstein, J.S.; Hoen, A.G.; Sankoh, O.; et al. The global distribution and burden of dengue. Nature 2013, 496, 504–507. [Google Scholar] [CrossRef] [PubMed]
- World Mosquito Program. Dengue. Available online: https://www.worldmosquitoprogram.org/en/learn/mosquito-borne-diseases/dengue#:~:text=Each%20year%2C%20an%20estimated%20390,That’s%20each%20year (accessed on 26 March 2021).
- Bell, S.M.; Katzelnick, L.; Bedford, T. Dengue genetic divergence generates within-serotype antigenic variation, but serotypes dominate evolutionary dynamics. eLife 2019, 8, e42496. [Google Scholar] [CrossRef] [PubMed]
- World Health Organization. Global Strategy for Dengue Prevention and Control 2012–2020. Available online: https://apps.who.int/iris/handle/10665/75303 (accessed on 23 September 2020).
- Knipe, D.M.; Howley, P.M. Fields Virology, 6th ed.; Wolters Kluwer/Lippincott Williams & Wilkins Health: Philadelphia, PA, USA, 2013; Volume 1. [Google Scholar]
- Gubler, D.J. The global emergence/resurgence of arboviral diseases as public health problems. Arch. Med. Res. 2002, 33, 330–342. [Google Scholar] [CrossRef] [Green Version]
- Messina, J.P.; Brady, O.J.; Golding, N.; Kraemer, M.U.G.; Wint, G.R.W.; Ray, S.E.; Pigott, D.M.; Shearer, F.M.; Johnson, K.; Earl, L.; et al. The current and future global distribution and population at risk of dengue. Nat. Microbiol. 2019, 4, 1508–1515. [Google Scholar] [CrossRef]
- Vasilakis, N.W.; Weaver, S.C. The History and Evolution of Human Dengue Emergence. In Advances in Virus Research; Maramorosch, K.S., Shatkin, A.J., Murphy, F.A., Eds.; Elsevier Science and Technology: San Diego, CA, USA, 2008; Volume 72, pp. 2–55. [Google Scholar]
- Rico-Hesse, R. Molecular evolution and distribution of dengue viruses type 1 and 2 in nature. Virology 1990, 174, 479–493. [Google Scholar] [CrossRef]
- Adams, B.; Holmes, E.C.; Zhang, C.; Mammen, M.P., Jr.; Nimmannitya, S.; Kalayanarooj, S.; Boots, M. Cross-protective immunity can account for the alternating epidemic pattern of dengue virus serotypes circulating in Bangkok. Proc. Natl. Acad. Sci. USA 2006, 103, 14234–14239. [Google Scholar] [CrossRef] [Green Version]
- Nunes, M.R.; Palacios, G.; Faria, N.R.; Sousa, E.C., Jr.; Pantoja, J.A.; Rodrigues, S.G.; Carvalho, V.L.; Medeiros, D.B.; Savji, N.; Baele, G.; et al. Air travel is associated with intracontinental spread of dengue virus serotypes 1-3 in Brazil. PLoS Negl. Trop. Dis. 2014, 8, e2769. [Google Scholar] [CrossRef]
- Holmes, E.C.; Burch, S.S. The causes and consequences of genetic variation in dengue virus. Trends Microbiol. 2000, 8, 74–77. [Google Scholar] [CrossRef]
- Holmes, E.; Twiddy, S. The origin, emergence and evolutionary genetics of dengue virus. Infect. Genet. Evol. 2003, 3, 19–28. [Google Scholar] [CrossRef]
- Cummings, D.A.; Schwartz, I.B.; Billings, L.; Shaw, L.B.; Burke, D.S. Dynamic effects of antibody-dependent enhancement on the fitness of viruses. Proc. Natl. Acad. Sci. USA 2005, 102, 15259–15264. [Google Scholar] [CrossRef] [PubMed] [Green Version]
- Hanley, K.A.; Nelson, J.T.; Schirtzinger, E.E.; Whitehead, S.S.; Hanson, C.T. Superior infectivity for mosquito vectors contributes to competitive displacement among strains of dengue virus. BMC Ecol. 2008, 8, 1–10. [Google Scholar] [CrossRef] [PubMed] [Green Version]
- Lambrechts, L.; Fansiri, T.; Pongsiri, A.; Thaisomboonsuk, B.; Klungthong, C.; Richardson, J.H.; Ponlawat, A.; Jarman, R.G.; Scott, T.W. Dengue-1 virus clade replacement in Thailand associated with enhanced mosquito transmission. J. Virol. 2012, 86, 1853–1861. [Google Scholar] [CrossRef] [PubMed] [Green Version]
- Quiner, C.A.; Parameswaran, P.; Ciota, A.T.; Ehrbar, D.J.; Dodson, B.L.; Schlesinger, S.; Kramer, L.D.; Harris, E. Increased replicative fitness of a dengue virus 2 clade in native mosquitoes: Potential contribution to a clade replacement event in Nicaragua. J. Virol. 2014, 88, 13125–13134. [Google Scholar] [CrossRef] [PubMed] [Green Version]
- Duong, V.; Henn, M.R.; Simmons, C.; Ngan, C.; Bunthin, Y.; Gavotte, L.; Viari, A.; Ong, S.; Huy, R.; Lennon, N.J.; et al. Complex dynamic of dengue virus serotypes 2 and 3 in Cambodia following series of climate disasters. Infect. Genet. Evol. 2013, 15, 77–86. [Google Scholar] [CrossRef]
- Pollett, S.; Melendrez, M.C.; Maljkovic Berry, I.; Duchene, S.; Salje, H.; Cummings, D.A.T.; Jarman, R.G. Understanding dengue virus evolution to support epidemic surveillance and counter-measure development. Infect. Genet. Evol. 2018, 62, 279–295. [Google Scholar] [CrossRef]
- Drake, J.W.; Holland, J.J. Mutation rates among RNA viruses. Proc. Natl. Acad. Sci. USA 1999, 96, 13910–13913. [Google Scholar] [CrossRef] [Green Version]
- Ko, H.Y.; Salem, G.M.; Chang, G.J.; Chao, D.Y. Application of Next-Generation Sequencing to Reveal How Evolutionary Dynamics of Viral Population Shape Dengue Epidemiology. Front. Microbiol. 2020, 11, 1371. [Google Scholar] [CrossRef]
- Tazeen, A.; Afreen, N.; Abdullah, M.; Deeba, F.; Haider, S.H.; Kazim, S.N.; Ali, S.; Naqvi, I.H.; Broor, S.; Ahmed, A.; et al. Occurrence of co-infection with dengue viruses during 2014 in New Delhi, India. Epidemiol. Infect. 2017, 145, 67–77. [Google Scholar] [CrossRef] [Green Version]
- Lequime, S.; Fontaine, A.; Ar Gouilh, M.; Moltini-Conclois, I.; Lambrechts, L. Genetic Drift, Purifying Selection and Vector Genotype Shape Dengue Virus Intra-host Genetic Diversity in Mosquitoes. PLoS Genet. 2016, 12, e1006111. [Google Scholar] [CrossRef] [Green Version]
- Bennett, S.N.; Holmes, E.C.; Chirivella, M.; Rodriguez, D.M.; Beltran, M.; Vorndam, V.; Gubler, D.J.; McMillan, W.O. Selection-driven evolution of emergent dengue virus. Mol. Biol. Evol. 2003, 20, 1650–1658. [Google Scholar] [CrossRef] [PubMed]
- Holmes, E.C. Patterns of intra- and interhost nonsynonymous variation reveal strong purifying selection in dengue virus. J. Virol. 2003, 77, 11296–11298. [Google Scholar] [CrossRef] [PubMed] [Green Version]
- Costa, R.L.; Voloch, C.M.; Schrago, C.G. Comparative evolutionary epidemiology of dengue virus serotypes. Infect. Genet. Evol. 2012, 12, 309–314. [Google Scholar] [CrossRef] [PubMed] [Green Version]
- Ketkar, H.; Herman, D.; Wang, P. Genetic Determinants of the Re-Emergence of Arboviral Diseases. Viruses 2019, 11, 150. [Google Scholar] [CrossRef] [Green Version]
- Hwang, E.H.; Kim, G.; Chung, H.; Oh, H.; Park, J.H.; Hur, G.H.; Hong, J.; Koo, B.S. Molecular evolution of dengue virus types 1 and 4 in Korean travelers. Arch. Virol. 2021, 166, 1103–1112. [Google Scholar] [CrossRef] [PubMed]
- Guan, J.; He, Z.; Qin, M.; Deng, X.; Chen, J.; Duan, S.; Gao, X.; Pan, Y.; Chen, J.; Yang, Y.; et al. Molecular characterization of the viral structural protein genes in the first outbreak of dengue virus type 2 in Hunan Province, inland China in 2018. BMC Infect. Dis 2021, 21, 166. [Google Scholar] [CrossRef]
- Zangmo, S.; Darnal, J.B.; Gyeltshen, S.; Thapa, B.T.; Rodpradit, P.; Chinnawirotpisan, P.; Manasatienkij, W.; Macareo, L.R.; Fernandez, S.; Wangchuk, S.; et al. Molecular epidemiology of dengue fever outbreaks in Bhutan, 2016–2017. PLoS Negl. Trop. Dis. 2020, 14, e0008165. [Google Scholar] [CrossRef] [PubMed] [Green Version]
- Sun, B.; Zhang, X.; Zhang, H.; Liu, H.; Sun, L.; Tan, Q.; Liang, M.; Wu, D.; Liu, D. Genomic epidemiological characteristics of dengue fever in Guangdong province, China from 2013 to 2017. PLoS Negl. Trop. Dis. 2020, 14, e0008049. [Google Scholar] [CrossRef] [Green Version]
- Queiroz, J.; Botelho-Souza, L.F.; Nogueira-Lima, F.S.; Rampazzo, R.C.P.; Krieger, M.A.; Zambenedetti, M.R.; Marchini, F.K.; Borghetti, I.A.; Pereira, D.B.; Salcedo, J.M.V.; et al. Phylogenetic Characterization of Arboviruses in Patients Suffering from Acute Fever in Rondônia, Brazil. Viruses 2020, 12, 889. [Google Scholar] [CrossRef]
- Inizan, C.; O’Connor, O.; Worwor, G.; Cabemaiwai, T.; Grignon, J.C.; Girault, D.; Minier, M.; Prot, M.; Ballan, V.; Pakoa, G.J.; et al. Molecular Characterization of Dengue Type 2 Outbreak in Pacific Islands Countries and Territories, 2017–2020. Viruses 2020, 12, 1081. [Google Scholar] [CrossRef]
- Hernández-García, E.; Muñoz, M.L.; David, R.E.; Pérez-Ramírez, G.; Navarrete-Espinosa, J.; Díaz-Badillo, Á.; Domínguez-de-la-Cruz, E.; Moreno-Galeana, M.; Brito-Carreón, C.A. Epidemiological implications of the genetic diversification of dengue virus (DENV) serotypes and genotypes in Mexico. Infect. Genet. Evol. 2020, 84, 104391. [Google Scholar] [CrossRef] [PubMed]
- Li, W.; Godzik, A. Cd-hit: A fast program for clustering and comparing large sets of protein or nucleotide sequences. Bioinformatics 2006, 22, 1658–1659. [Google Scholar] [CrossRef] [PubMed] [Green Version]
- Fu, L.; Niu, B.; Zhu, Z.; Wu, S.; Li, W. CD-HIT: Accelerated for clustering the next-generation sequencing data. Bioinformatics 2012, 28, 3150–3152. [Google Scholar] [CrossRef] [PubMed]
- Martin, D.P.; Murrell, B.; Golden, M.; Khoosal, A.; Muhire, B. RDP4: Detection and analysis of recombination patterns in virus genomes. Virus Evol. 2015, 1, vev003. [Google Scholar] [CrossRef] [PubMed] [Green Version]
- Edgar, R.C. MUSCLE: Multiple sequence alignment with high accuracy and high throughput. Nucleic Acids Res. 2004, 32, 1792–1797. [Google Scholar] [CrossRef] [Green Version]
- Li, H.; Durbin, R. Fast and accurate short read alignment with Burrows-Wheeler transform. Bioinformatics 2009, 25, 1754–1760. [Google Scholar] [CrossRef] [Green Version]
- Suchard, M.A.; Lemey, P.; Baele, G.; Ayres, D.L.; Drummond, A.J.; Rambaut, A. Bayesian phylogenetic and phylodynamic data integration using BEAST 1.10. Virus Evol. 2018, 4, vey016. [Google Scholar] [CrossRef] [Green Version]
- Drummond, A.J.; Rambaut, A.; Shapiro, B.; Pybus, O.G. Bayesian coalescent inference of past population dynamics from molecular sequences. Mol. Biol. Evol. 2005, 22, 1185–1192. [Google Scholar] [CrossRef] [Green Version]
- Rambaut, A.; Drummond, A.J.; Xie, D.; Baele, G.; Suchard, M.A. Posterior Summarization in Bayesian Phylogenetics Using Tracer 1.7. Syst. Biol. 2018, 67, 901–904. [Google Scholar] [CrossRef] [Green Version]
- Goncalvez, A.P.; Escalante, A.A.; Pujol, F.H.; Ludert, J.E.; Tovar, D.; Salas, R.A.; Liprandi, F. Diversity and evolution of the envelope gene of dengue virus type 1. Virology 2002, 303, 110–119. [Google Scholar] [CrossRef] [Green Version]
- Twiddy, S.S.; Farrar, J.J.; Vinh Chau, N.; Wills, B.; Gould, E.A.; Gritsun, T.; Lloyd, G.; Holmes, E.C. Phylogenetic relationships and differential selection pressures among genotypes of dengue-2 virus. Virology 2002, 298, 63–72. [Google Scholar] [CrossRef] [PubMed] [Green Version]
- Lanciotti, R.S.; Lewis, J.G.; Gubler, D.J.; Trent, D.W. Molecular evolution and epidemiology of dengue-3 viruses. J. Gen. Virol. 1994, 75 Pt 1, 65–75. [Google Scholar] [CrossRef]
- Lanciotti, R.S.; Gubler, D.J.; Trent, D.W. Molecular evolution and phylogeny of dengue-4 viruses. J. Gen. Virol 1997, 78 Pt 9, 2279–2284. [Google Scholar] [CrossRef] [PubMed]
- Guindon, S.; Dufayard, J.F.; Lefort, V.; Anisimova, M.; Hordijk, W.; Gascuel, O. New algorithms and methods to estimate maximum-likelihood phylogenies: Assessing the performance of PhyML 3.0. Syst. Biol. 2010, 59, 307–321. [Google Scholar] [CrossRef] [Green Version]
- Lefort, V.; Longueville, J.E.; Gascuel, O. SMS: Smart Model Selection in PhyML. Mol. Biol. Evol. 2017, 34, 2422–2424. [Google Scholar] [CrossRef] [PubMed] [Green Version]
- Rambaut, A.; Lam, T.T.; Max Carvalho, L.; Pybus, O.G. Exploring the temporal structure of heterochronous sequences using TempEst (formerly Path-O-Gen). Virus Evol. 2016, 2, vew007. [Google Scholar] [CrossRef] [Green Version]
- Kosakovsky Pond, S.L.; Poon, A.F.Y.; Velazquez, R.; Weaver, S.; Hepler, N.L.; Murrell, B.; Shank, S.D.; Magalis, B.R.; Bouvier, D.; Nekrutenko, A.; et al. HyPhy 2.5-A Customizable Platform for Evolutionary Hypothesis Testing Using Phylogenies. Mol. Biol. Evol. 2020, 37, 295–299. [Google Scholar] [CrossRef]
- Weaver, S.; Shank, S.D.; Spielman, S.J.; Li, M.; Muse, S.V.; Kosakovsky Pond, S.L. Datamonkey 2.0: A Modern Web Application for Characterizing Selective and Other Evolutionary Processes. Mol. Biol. Evol. 2018, 35, 773–777. [Google Scholar] [CrossRef] [Green Version]
- Kosakovsky Pond, S.L.; Frost, S.D. Not so different after all: A comparison of methods for detecting amino acid sites under selection. Mol. Biol. Evol. 2005, 22, 1208–1222. [Google Scholar] [CrossRef] [Green Version]
- Smith, M.D.; Wertheim, J.O.; Weaver, S.; Murrell, B.; Scheffler, K.; Kosakovsky Pond, S.L. Less is more: An adaptive branch-site random effects model for efficient detection of episodic diversifying selection. Mol. Biol. Evol. 2015, 32, 1342–1353. [Google Scholar] [CrossRef] [Green Version]
- Murrell, B.; Wertheim, J.O.; Moola, S.; Weighill, T.; Scheffler, K.; Kosakovsky Pond, S.L. Detecting individual sites subject to episodic diversifying selection. PLoS Genet. 2012, 8, e1002764. [Google Scholar] [CrossRef] [PubMed] [Green Version]
- Murrell, B.; Moola, S.; Mabona, A.; Weighill, T.; Sheward, D.; Kosakovsky Pond, S.L.; Scheffler, K. FUBAR: A fast, unconstrained bayesian approximation for inferring selection. Mol. Biol. Evol. 2013, 30, 1196–1205. [Google Scholar] [CrossRef] [PubMed] [Green Version]
- Shihada, S.; Emmerich, P.; Thome-Bolduan, C.; Jansen, S.; Gunther, S.; Frank, C.; Schmidt-Chanasit, J.; Cadar, D. Genetic Diversity and New Lineages of Dengue Virus Serotypes 3 and 4 in Returning Travelers, Germany, 2006–2015. Emerg. Infect. Dis. 2017, 23, 272–275. [Google Scholar] [CrossRef] [Green Version]
- Rodriguez-Roche, R.; Villegas, E.; Cook, S.; Poh Kim, P.A.; Hinojosa, Y.; Rosario, D.; Villalobos, I.; Bendezu, H.; Hibberd, M.L.; Guzman, M.G. Population structure of the dengue viruses, Aragua, Venezuela, 2006–2007. Insights into dengue evolution under hyperendemic transmission. Infect. Genet. Evol. 2012, 12, 332–344. [Google Scholar] [CrossRef] [PubMed] [Green Version]
- Schreiber, M.J.; Holmes, E.C.; Ong, S.H.; Soh, H.S.; Liu, W.; Tanner, L.; Aw, P.P.; Tan, H.C.; Ng, L.C.; Leo, Y.S.; et al. Genomic epidemiology of a dengue virus epidemic in urban Singapore. J. Virol. 2009, 83, 4163–4173. [Google Scholar] [CrossRef] [Green Version]
- Liu, W.; Pickering, P.; Duchene, S.; Holmes, E.C.; Aaskov, J.G. Highly Divergent Dengue Virus Type 2 in Traveler Returning from Borneo to Australia. Emerg. Infect. Dis. 2016, 22, 2146–2148. [Google Scholar] [CrossRef] [Green Version]
- Messina, J.P.; Brady, O.J.; Scott, T.W.; Zou, C.; Pigott, D.M.; Duda, K.A.; Bhatt, S.; Katzelnick, L.; Howes, R.E.; Battle, K.E.; et al. Global spread of dengue virus types: Mapping the 70 year history. Trends Microbiol. 2014, 22, 138–146. [Google Scholar] [CrossRef] [Green Version]
- Wash, R.; Soria, C.D. True Blood: Dengue virus evolution. Nat. Rev. Microbiol. 2015, 13, 662. [Google Scholar] [CrossRef]
- Katzelnick, L.C.; Coello Escotto, A.; Huang, T.A.; Garcia-Carreras, B.; Chowdhury, N.; Maljkovic Berry, I.; Chavez, C.; Buchy, P.; Duong, V.; Dussart, P.; et al. Antigenic evolutin of dengue viruses over 20 years. Science 2021, 374, 999–1004. [Google Scholar] [CrossRef]
- Perera, R.; Kuhn, R.J. Structural proteomics of dengue virus. Curr. Opin. Microbiol. 2008, 11, 369–377. [Google Scholar] [CrossRef] [Green Version]
- Maddipati, V.C.; Mittal, L.; Mantipally, M.; Asthana, S.; Bhattacharyya, S.; Gundla, R. A Review on the Progress and Prospects of Dengue Drug Discovery Targeting NS5 RNA- Dependent RNA Polymerase. Curr. Pharm. Des. 2020, 26, 4386–4409. [Google Scholar] [CrossRef] [PubMed]


| Accession Number | QUT Reference Number | Serotype | Country of Origin | Year Collected |
|---|---|---|---|---|
| OK469341 | QUT 1070 | DENV1 | Singapore | 1992 |
| OK469342 | QUT 1100 | DENV1 | Malaysia | 1997 |
| OK469343 | QUT 1462 | DENV1 | Pakistan | 1994 |
| OK469344 | QUT 1501 | DENV1 | Fiji | 1975 |
| OK469345 | QUT 0605 | DENV2 | Myanmar | 1985 |
| OK469346 | QUT 0792 | DENV2 | Jamaica | 1981 |
| OK469347 | QUT 0868 | DENV2 | Palau | 1988 |
| OK469348 | QUT 0870 | DENV2 | Myanmar | 1976 |
| OK469349 | QUT 0871 | DENV2 | Samoa | 1972 |
| OK469350 | QUT 1357 | DENV2 | Thailand | 1990 |
| OK469351 | QUT 1453 | DENV2 | Myanmar | 1995 |
| OK469352 | QUT 1537 | DENV2 | Singapore | 1993 |
| OK469353 | QUT 0325 | DENV3 | Thailand | 1988 |
| OK469354 | QUT 0327 | DENV3 | Thailand | 1989 |
| OK469355 | QUT 0874 | DENV3 | Myanmar | 1973 |
| OK469356 | QUT 0875 | DENV3 | Myanmar | 1976 |
| OK469357 | QUT 0789 | DENV4 | Puerto Rico | 1963 |
| OK469358 | QUT 0876 | DENV4 | Myanmar | 1976 |
| OK469359 | QUT 0877 | DENV4 | Kiribati | 1980 |
| OK469360 | QUT 0878 | DENV4 | Niue | 1980 |
| OK469361 | QUT 1525 | DENV4 | Singapore | 1990 |
| OK469362 | QUT 1541 | DENV4 | Singapore | 1995 |
| DENV1 | DENV2 | DENV3 | DENV4 | ||||||||||||||||||
|---|---|---|---|---|---|---|---|---|---|---|---|---|---|---|---|---|---|---|---|---|---|
| Epi + S | Epi | 1-I | 1-IV | 1-V | Epi + S | Epi | AA | A I | A II | Am | C | Sylv | Epi | 3-I | 3-II | 3-III | Epi + S | Epi | 4-I | 4-II | |
| C | - | - | - | - | - | - | - | - | - | - | - | - | - | - | - | - | - | - | - | - | - |
| prM | - | - | - | - | - | - | - | - | - | 28 | - | - | - | - | - | - | - | - | - | - | - |
| E | - | - | - | - | - | - | 226 | - | - | 124 | - | - | - | - | - | 81 | 132 | - | - | - | - |
| NS1 | 324 | 324 | - | - | - | - | - | 164 | - | - | - | - | - | 93 | - | - | - | 290 | 290 | - | - |
| NS2A | - | - | - | - | - | 174 | 37 | 174 | - | - | - | 162 | - | - | - | 210 | - | - | - | - | |
| 174 | |||||||||||||||||||||
| NS2B | - | - | - | - | - | - | - | - | - | - | - | - | - | - | - | - | - | - | - | - | - |
| NS3 | - | 185 | - | - | - | 14 | 14 | 14 | - | - | - | - | - | - | - | - | - | - | - | - | - |
| NS4A | - | - | - | - | - | - | - | - | 12 | - | - | - | - | - | - | - | - | - | - | - | - |
| NS4B | - | - | - | 207 | - | - | - | - | - | - | - | 148 | - | - | - | - | - | - | - | - | - |
| NS5 | 285 | 23 | 626 | 629 | - | 271 | 271 | - | - | - | - | 271 | - | - | - | 200 | - | 51 | 51 | - | - |
| 669 | 253 | 647 | 558 | 401 | |||||||||||||||||
| 265 | 833 | 558 | |||||||||||||||||||
| 285 | |||||||||||||||||||||
| 669 | |||||||||||||||||||||
| DENV1 | DENV2 | DENV3 | DENV4 | |||||||||||||||
|---|---|---|---|---|---|---|---|---|---|---|---|---|---|---|---|---|---|---|
| Epi + S | Epi | 1-I | 1-V | Epi + S | Epi | A I | A II | C | Sylv | Epi | 3-I | 3-II | 3-III | Epi + S | Epi | 4-I | 4-II | |
| C | 16 | 16 | 16 | 16 | 16 | 16 | ||||||||||||
| 95 | 95 | 95 | 95 | |||||||||||||||
| prM | 2 | 2 | 55 * | 2 | 42 | 42 | 2 | 2 | 2 * | 2 * | ||||||||
| 42 | 42 | 57 * | 42 | |||||||||||||||
| 55 * | ||||||||||||||||||
| 57 * | ||||||||||||||||||
| E | 203 | 203 | 194 | 175 | 175 | 432 | 175 | 175 | 175 | 132 | 132 | 132 | ||||||
| 432 | 203 | 216 | 192 | 194 | 192 | 192 | 216 | 203 | ||||||||||
| 432 | 432 | 216 | 216 | |||||||||||||||
| NS1 | 14 | 14 | 264 | 264 | 232 * | 174 | 232 * | 14 | 14 | 264 | ||||||||
| 264 | 174 | 174 | ||||||||||||||||
| NS2A | 43 | 43 | 43 | 37 | 43 | 43 | 37 | |||||||||||
| NS2B | 60 | 60 | 60 | 127 | 127 | 60 | ||||||||||||
| 127 | 127 | |||||||||||||||||
| NS3 | 88 | 88 | 601 | 88 | 601 * | 601 * | ||||||||||||
| 592 | 592 | 592 | ||||||||||||||||
| 601 | 601 | 601 | ||||||||||||||||
| NS4A | 2 | 2 | 2 | 2 | 2 | |||||||||||||
| NS4B | 100 | 100 | 100 | 112 | 112 | 115 * | 112 | 115 * | 100 | 245 | 144 | 112 | 112 | 112 | ||||
| 144 | 245 | 112 | ||||||||||||||||
| 144 | ||||||||||||||||||
| 245 | ||||||||||||||||||
| NS5 | 174 | 174 | 174 | 700 | 96 | 749 | 284 * | 78 * | 5 | 174 | 638 | 649 * | 5 | 5 | 5 | |||
| 700 | 700 | 849 * | 849 * | 638 | 78 * | 749 | 649 * | 700 | 96 | 96 | ||||||||
| 749 | 284 * | 638 | ||||||||||||||||
| 749 | ||||||||||||||||||
Publisher’s Note: MDPI stays neutral with regard to jurisdictional claims in published maps and institutional affiliations. |
© 2022 by the authors. Licensee MDPI, Basel, Switzerland. This article is an open access article distributed under the terms and conditions of the Creative Commons Attribution (CC BY) license (https://creativecommons.org/licenses/by/4.0/).
Share and Cite
Stica, C.J.; Barrero, R.A.; Murray, R.Z.; Devine, G.J.; Phillips, M.J.; Frentiu, F.D. Global Evolutionary History and Dynamics of Dengue Viruses Inferred from Whole Genome Sequences. Viruses 2022, 14, 703. https://doi.org/10.3390/v14040703
Stica CJ, Barrero RA, Murray RZ, Devine GJ, Phillips MJ, Frentiu FD. Global Evolutionary History and Dynamics of Dengue Viruses Inferred from Whole Genome Sequences. Viruses. 2022; 14(4):703. https://doi.org/10.3390/v14040703
Chicago/Turabian StyleStica, Caleb J., Roberto A. Barrero, Rachael Z. Murray, Gregor J. Devine, Matthew J. Phillips, and Francesca D. Frentiu. 2022. "Global Evolutionary History and Dynamics of Dengue Viruses Inferred from Whole Genome Sequences" Viruses 14, no. 4: 703. https://doi.org/10.3390/v14040703
APA StyleStica, C. J., Barrero, R. A., Murray, R. Z., Devine, G. J., Phillips, M. J., & Frentiu, F. D. (2022). Global Evolutionary History and Dynamics of Dengue Viruses Inferred from Whole Genome Sequences. Viruses, 14(4), 703. https://doi.org/10.3390/v14040703