
Fullerene Derivatives Prevent Packaging of Viral Genomic RNA into HIV-1 Particles by Binding Nucleocapsid Protein

 , ,
, ,  , , ,
, , ,  ,
, 
Abstract
1. Introduction
2. Materials and Methods
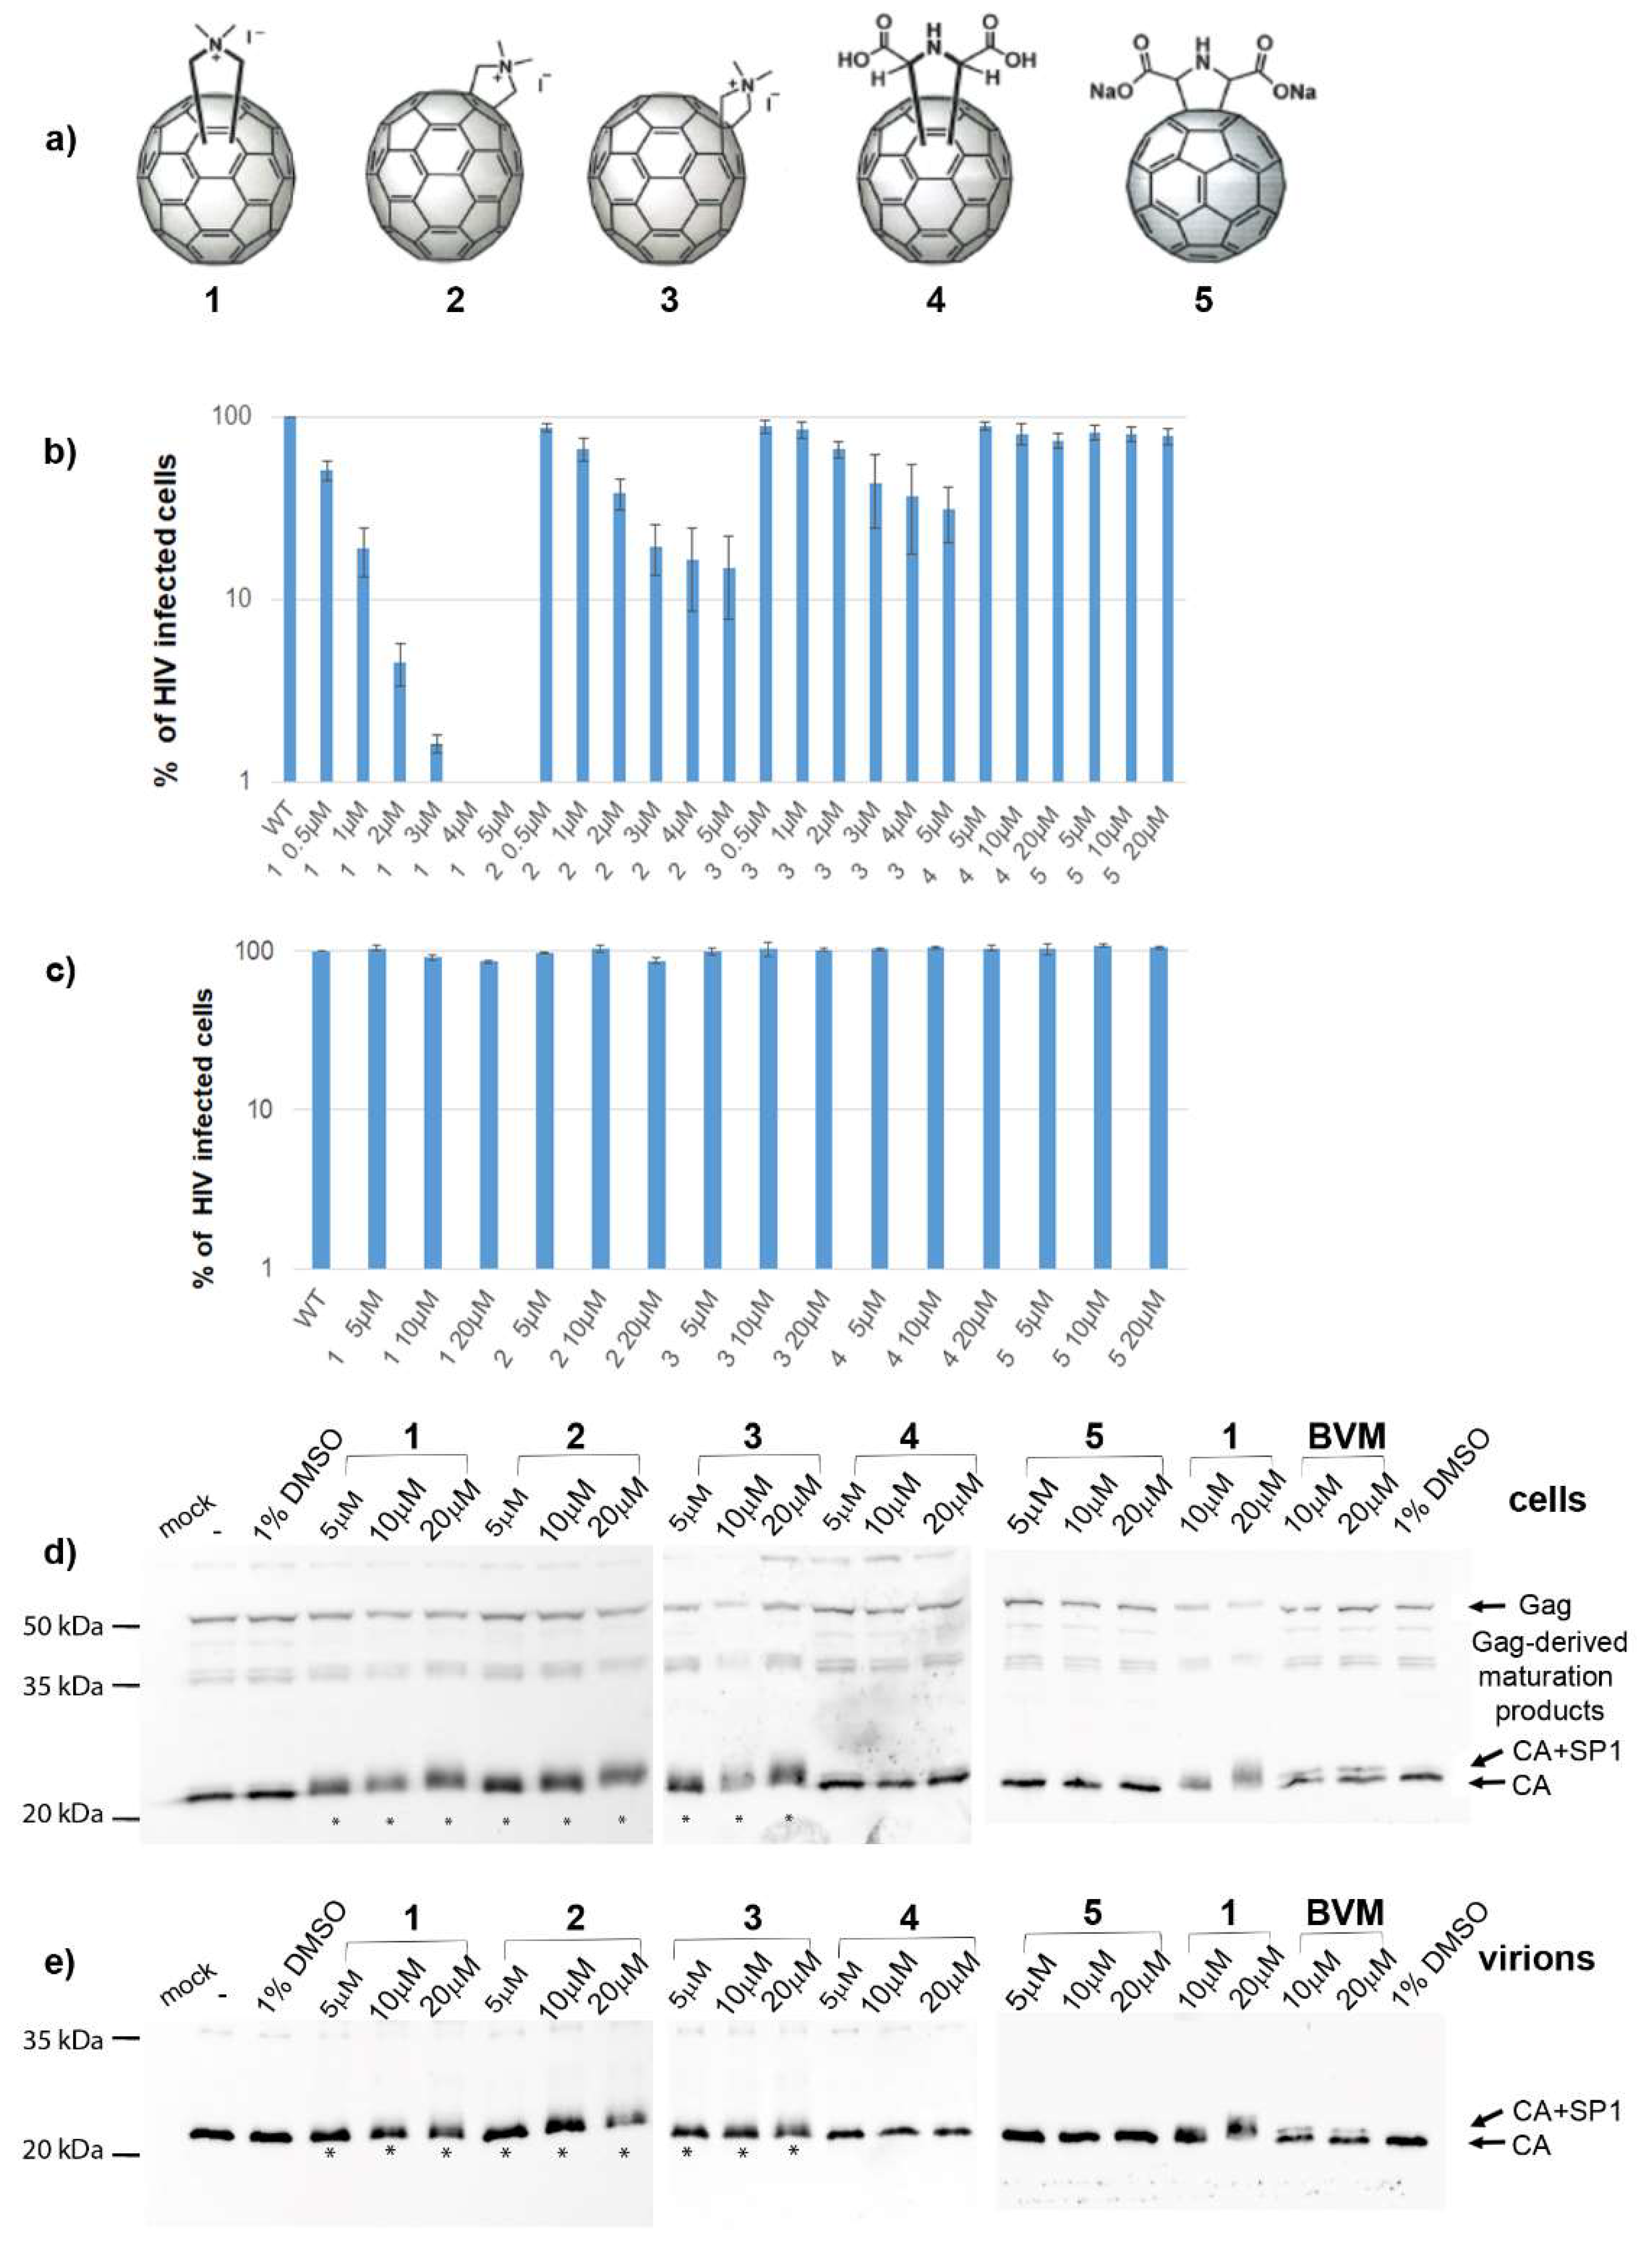
2.1. Synthesis of Fullerenes 1–5
2.2. VSV-G Pseudotyped HIV-1 Particles Production
2.3. Single-Round Infectivity Assay HIV-1
2.4. Flow Cytometry
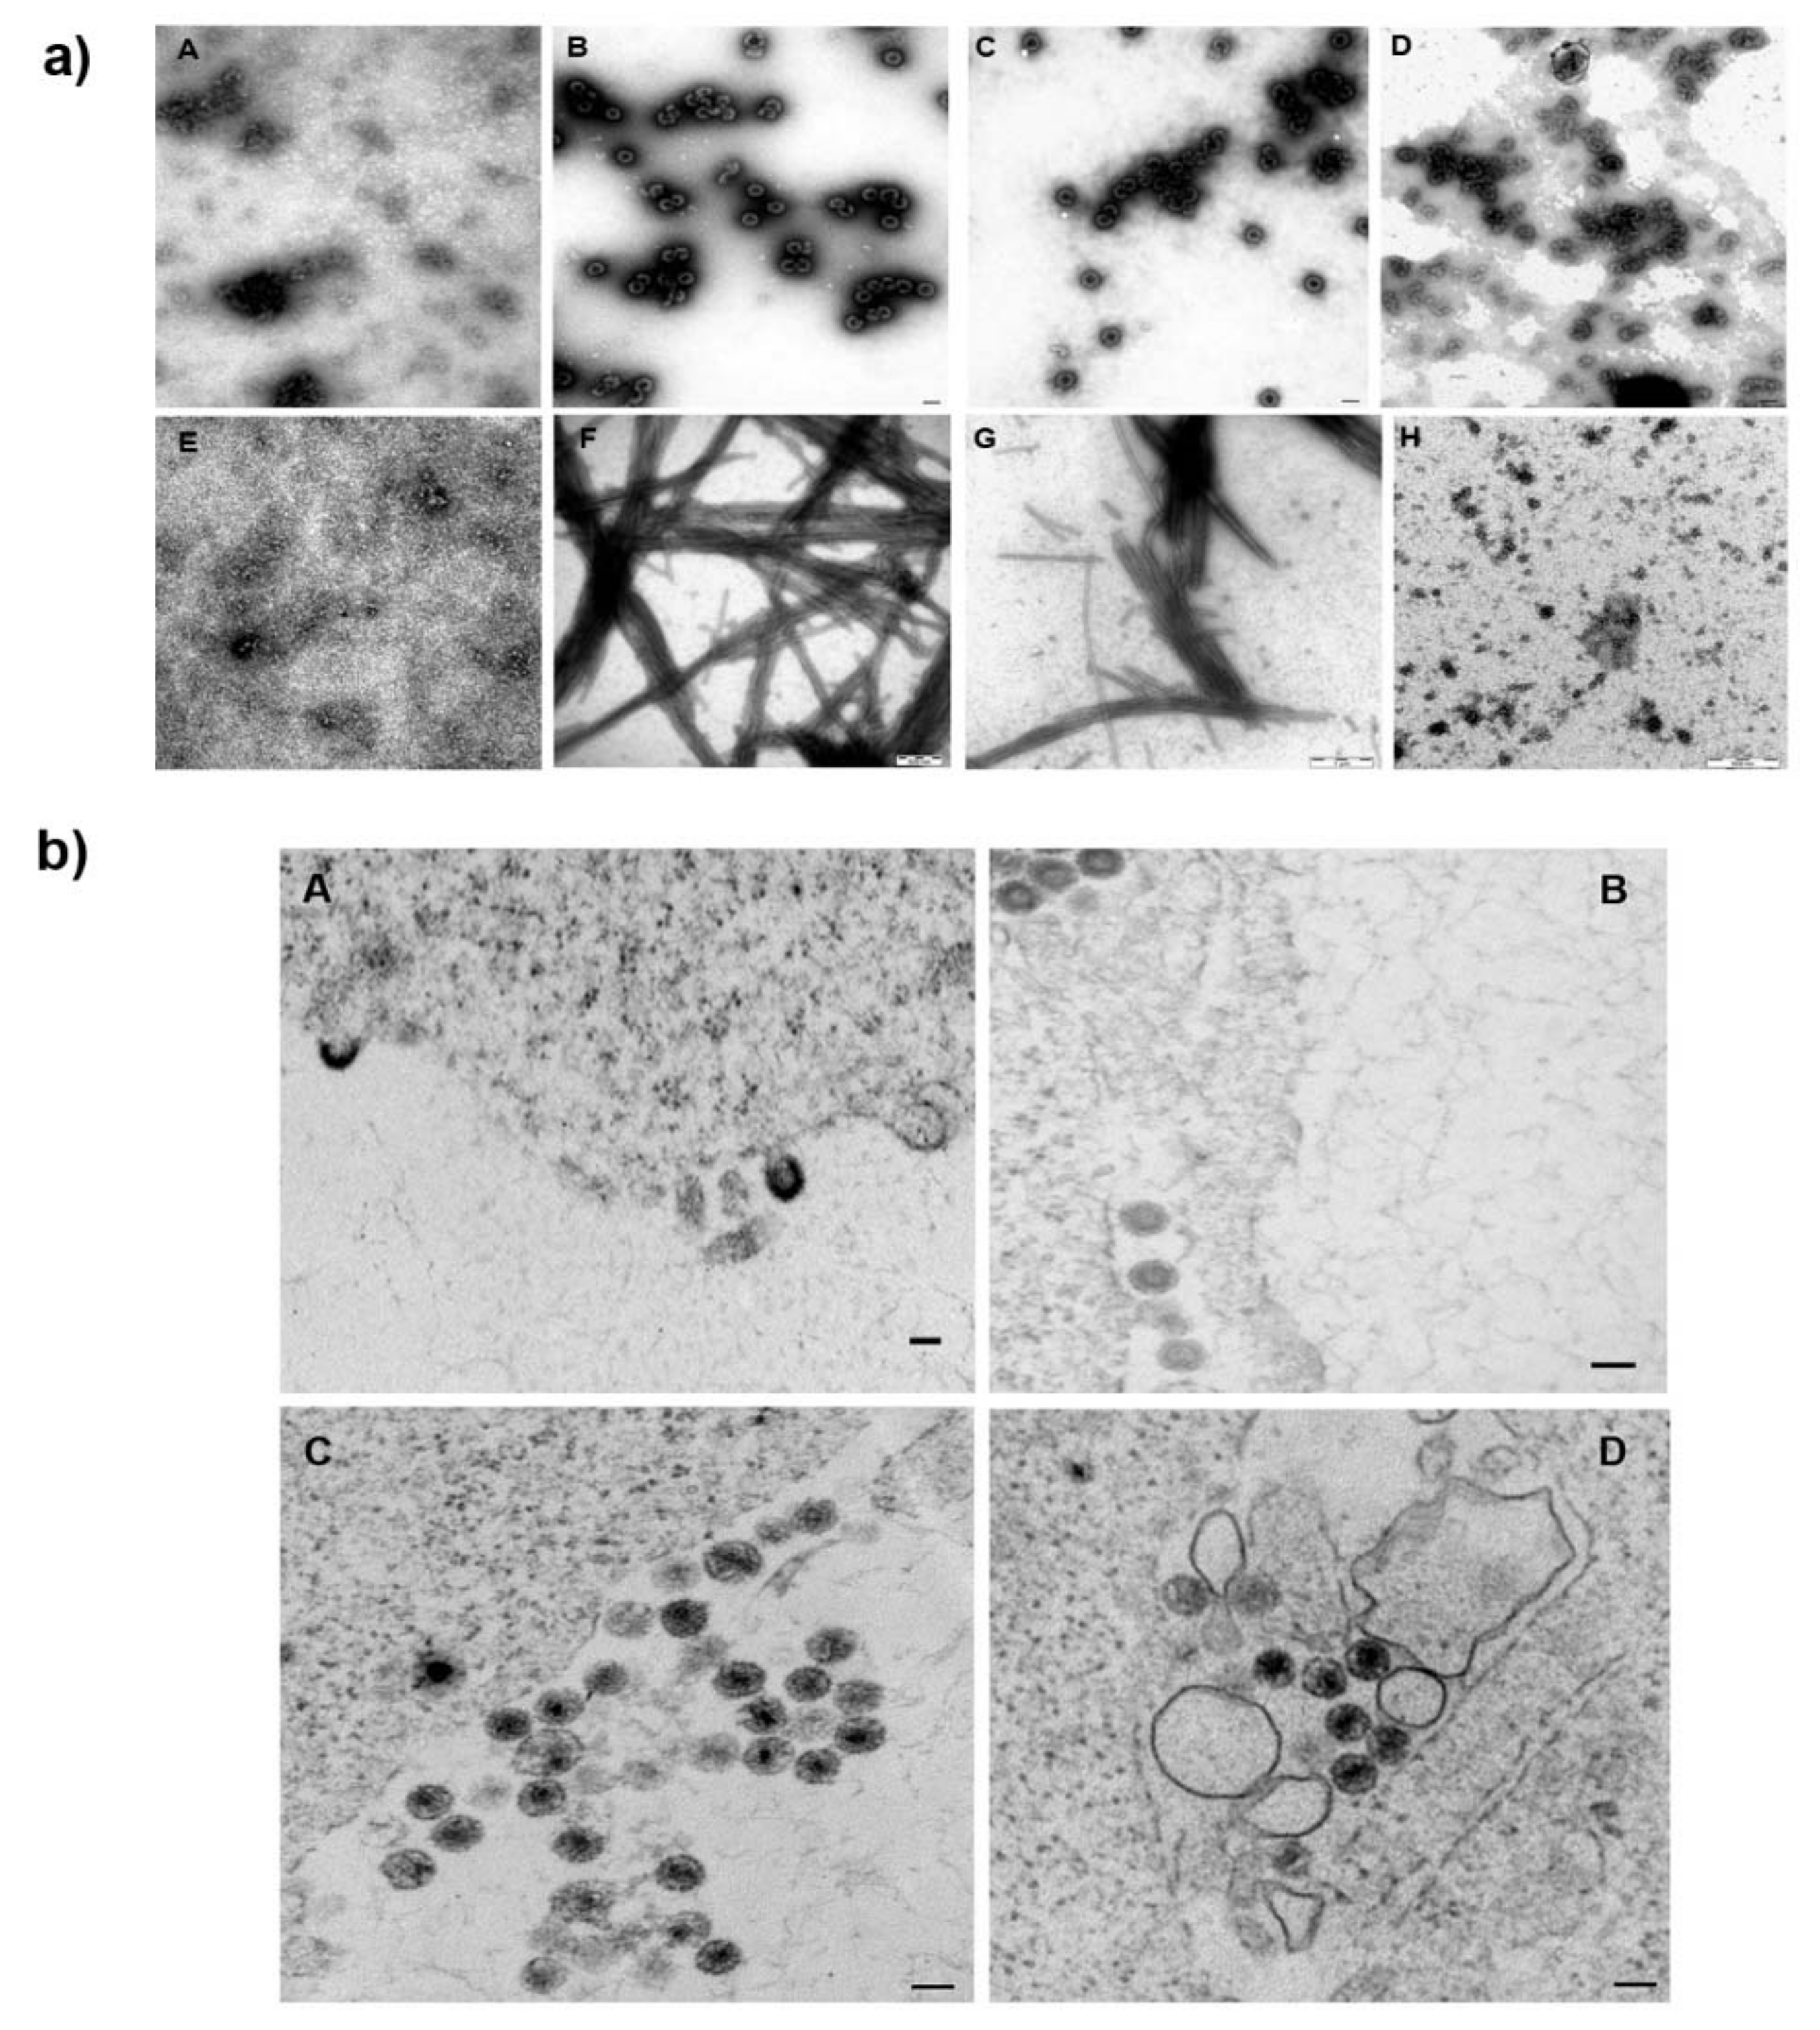
2.5. Transmission Electron Microscopy Analysis
2.6. Quantification of VLP Assembly Efficiency by FAITH
2.7. Western Blot and Semi-Quantitative Western Blot
2.8. Pulse-Chase Experiment
2.9. qPCR Analysis of Reverse Transcription Proceeding
2.10. qPCR Analysis of Incorporated gRNA
2.11. Cyclosporine Washout Assay
2.12. The Activity of Reverse Transcriptase
2.13. Thermophoresis
2.14. Electrophoretic Mobility Shift Assay (EMSA)
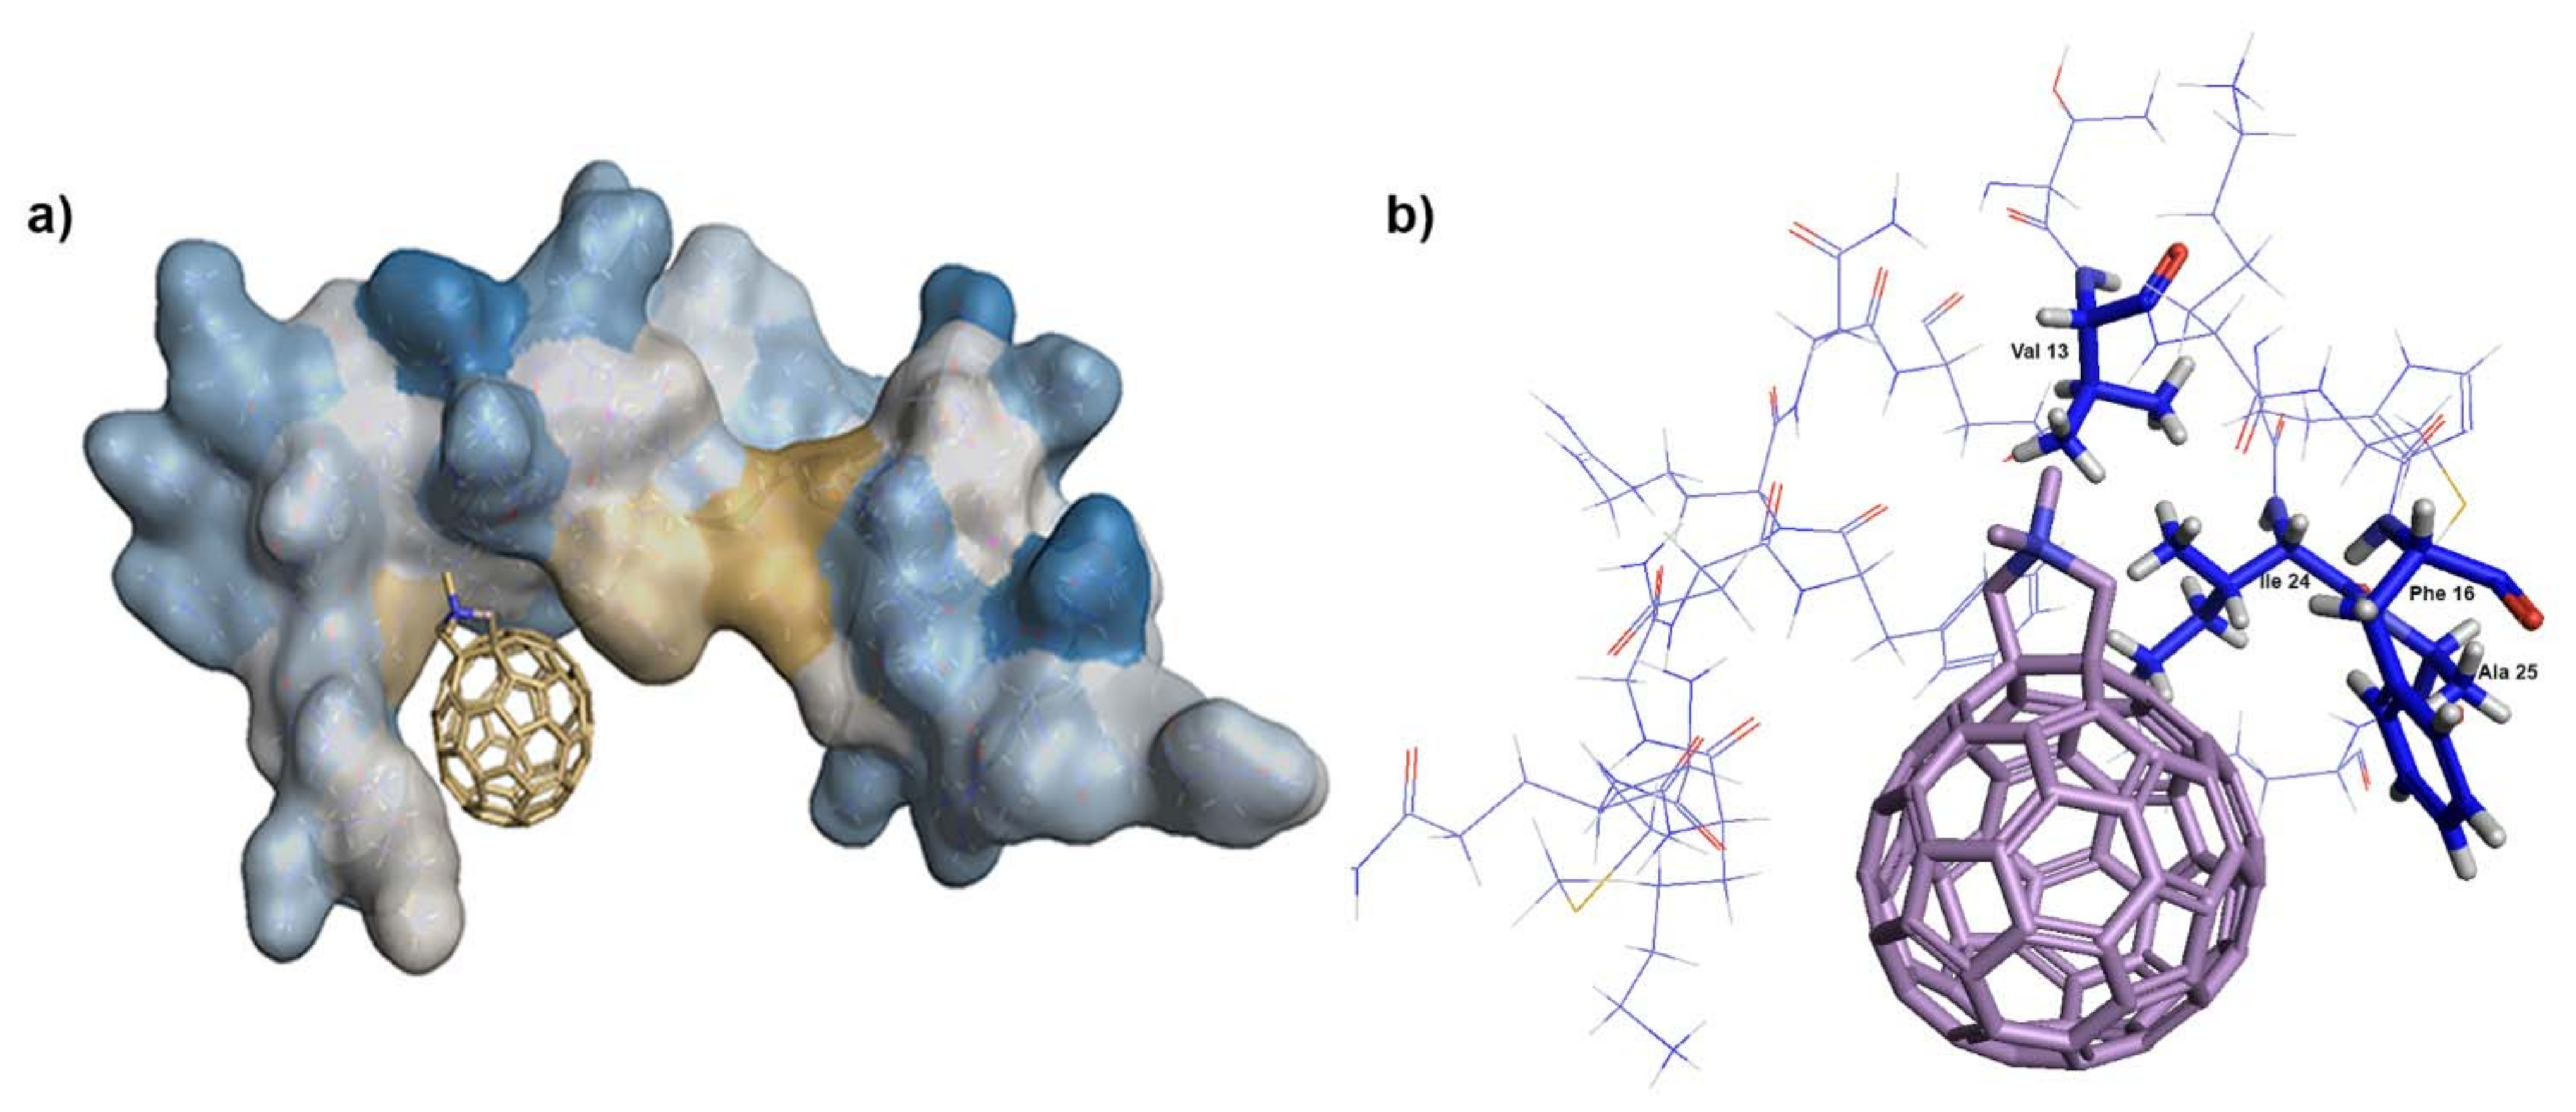
2.15. Docking of N,N-Dimethyl[70] Fulleropyrrolidinium Iodide
3. Results
3.1. Effects of Fullerene Derivatives on HIV-1 Infectivity
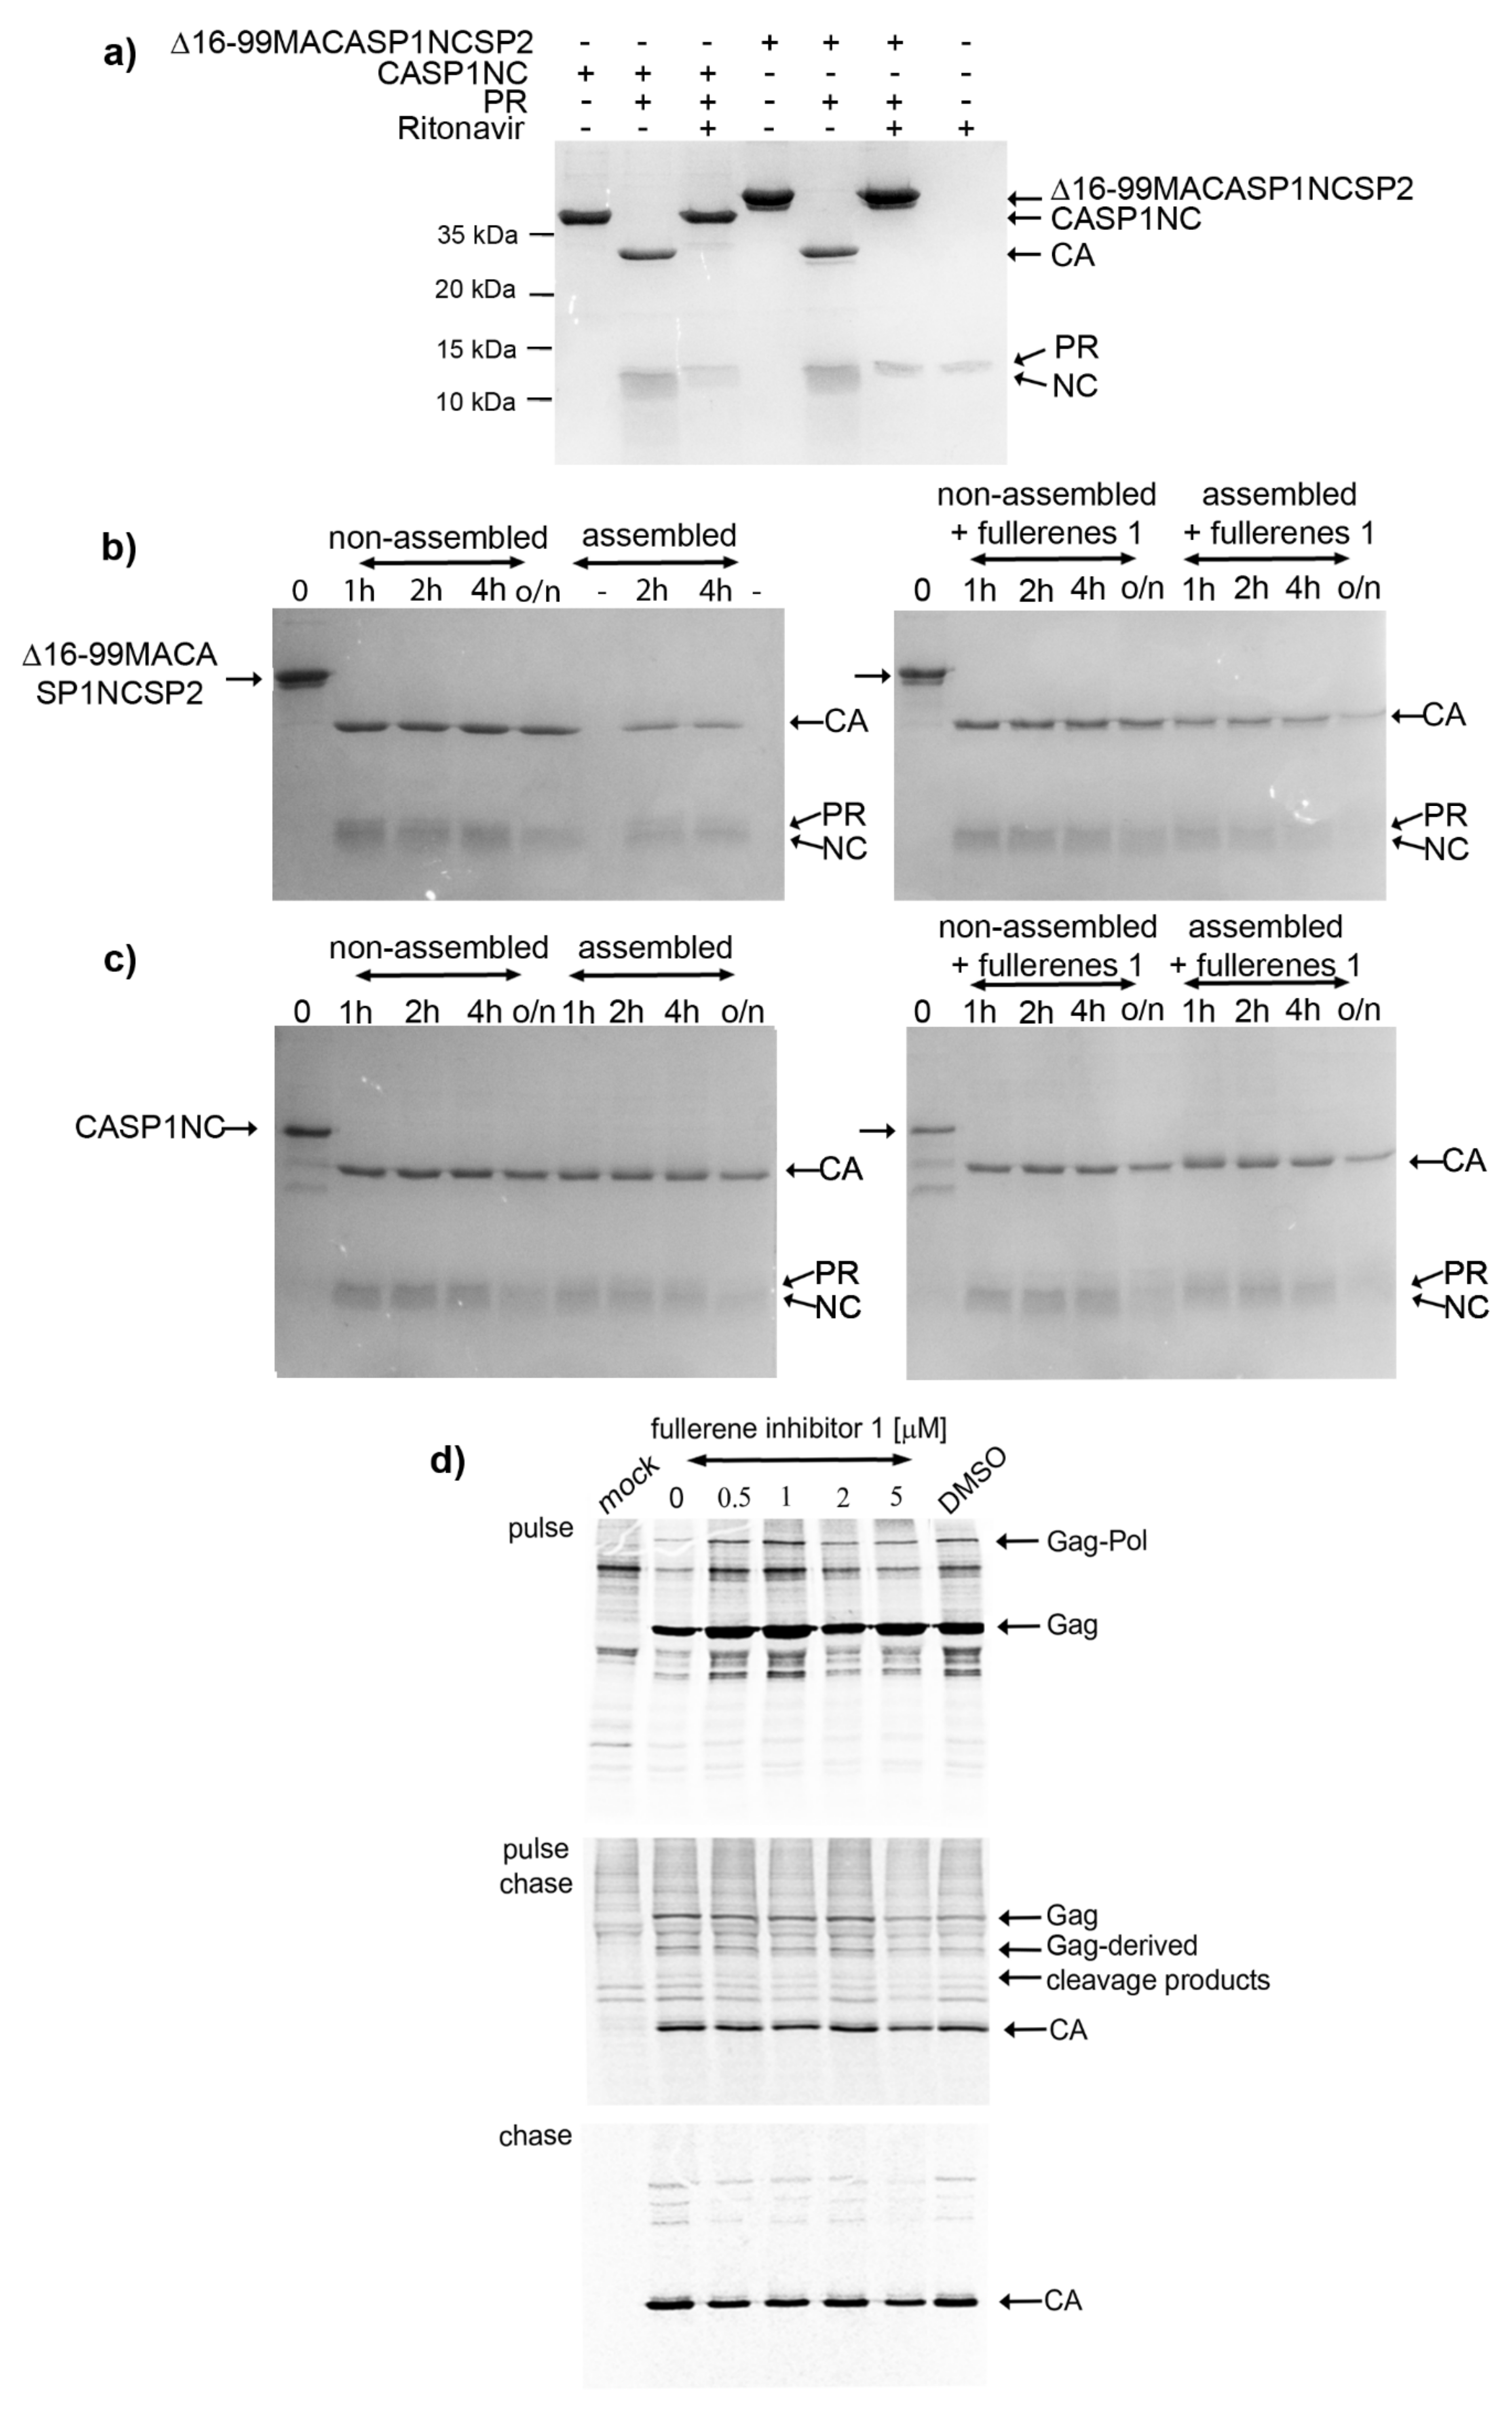
3.2. Effects on HIV-1 Gag Processing and Maturation
3.3. Effect of 1 on the Assembly of HIV Immature and Mature Particles
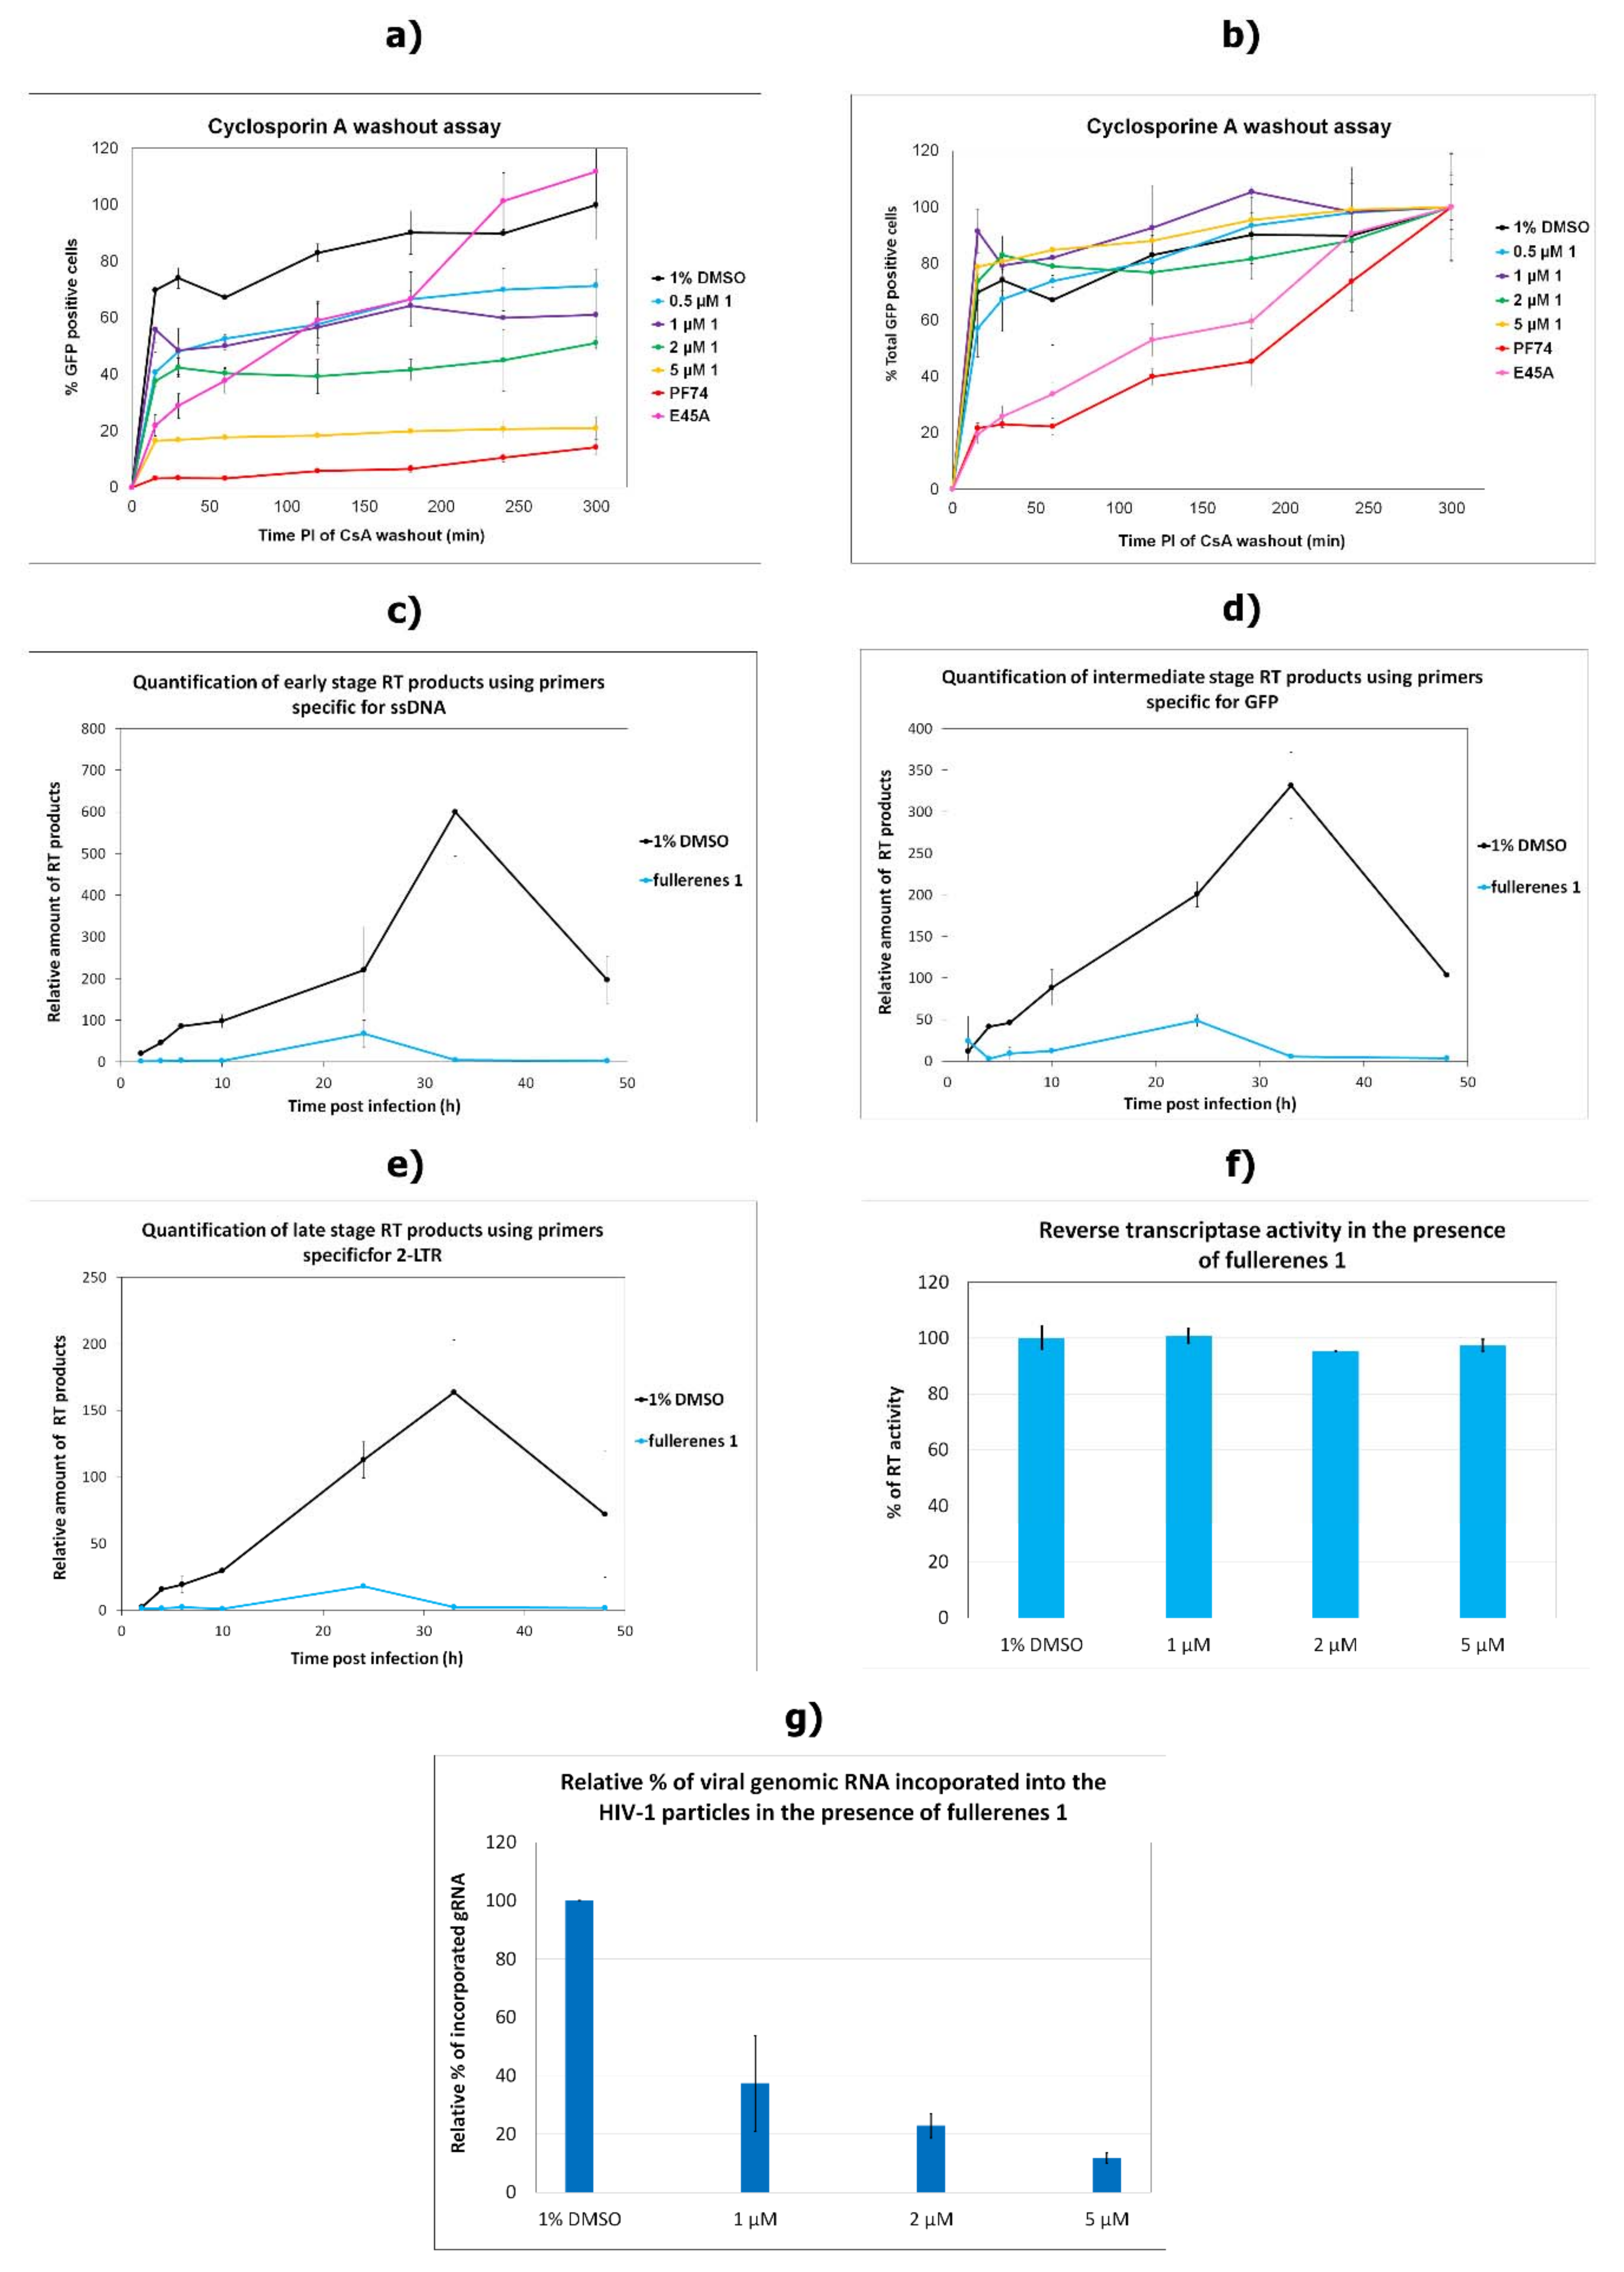
3.4. Effects on the Uncoating and Reverse Transcription
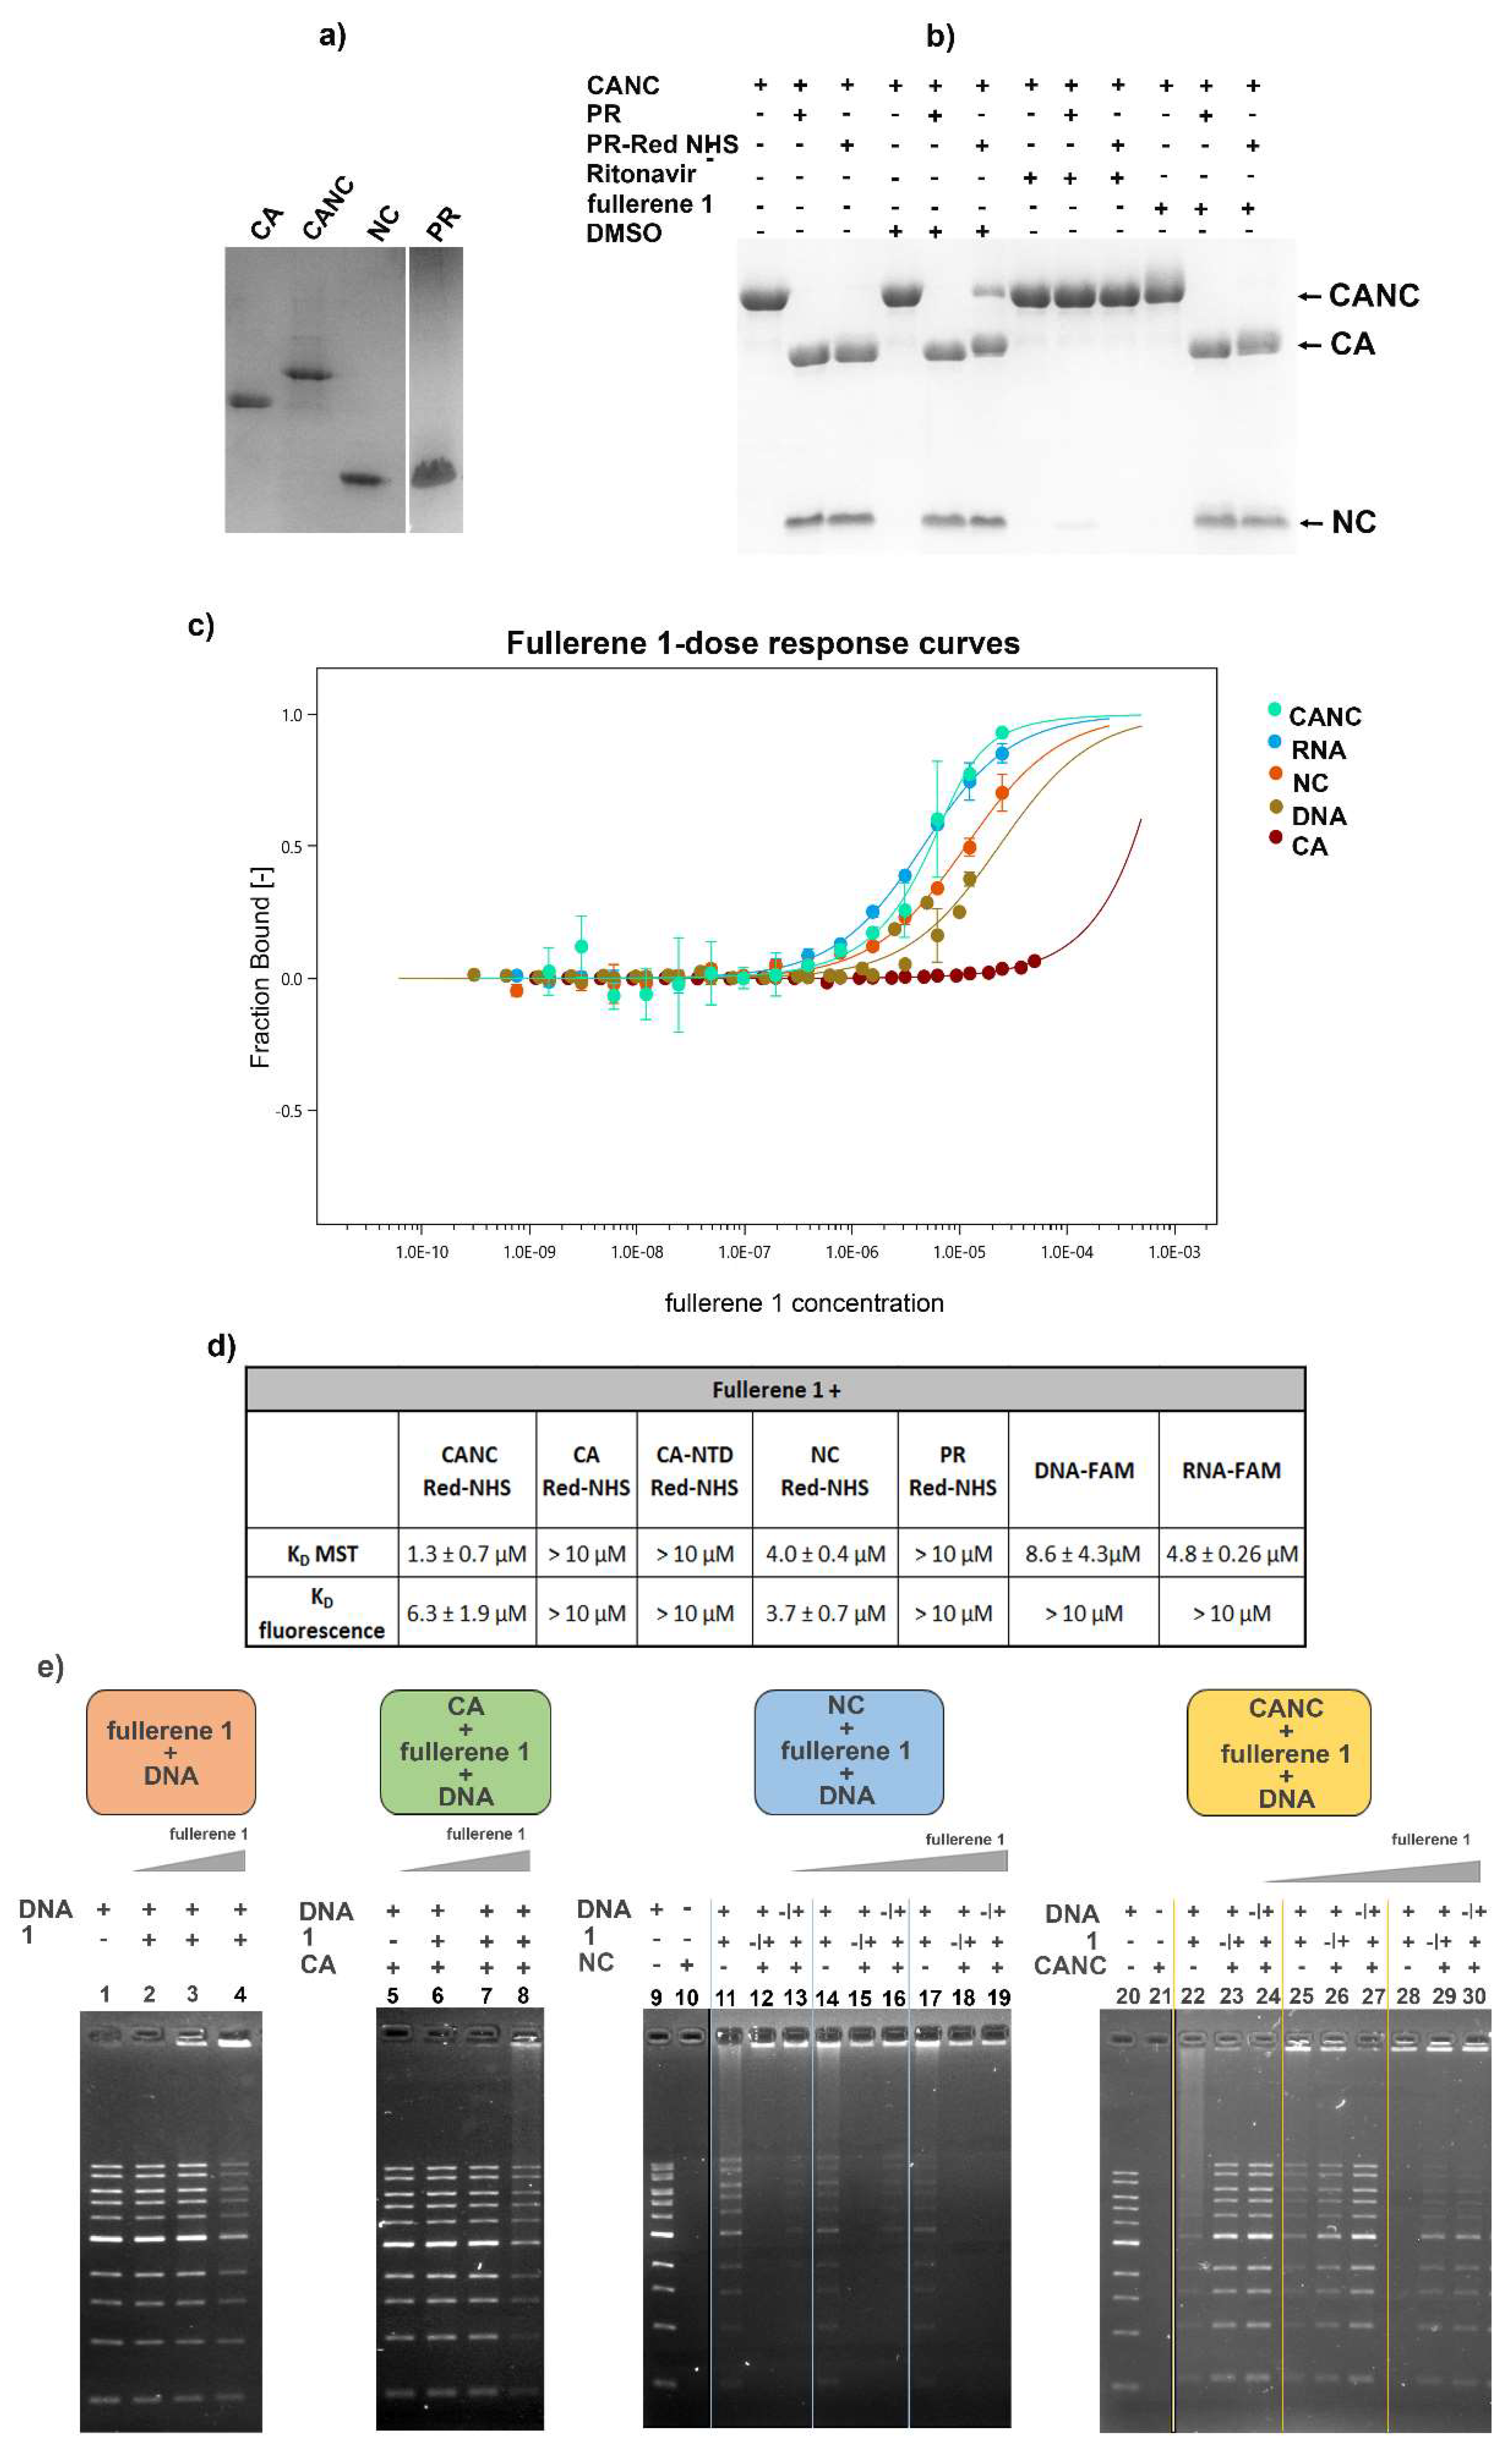
3.5. In Vitro Binding Affinity of Fullerene 1 to HIV-1 Proteins
4. Discussion
Supplementary Materials
Author Contributions
Funding
Institutional Review Board Statement
Informed Consent Statement
Data Availability Statement
Conflicts of Interest
References
- Briggs, J.A.; Simon, M.N.; Gross, I.; Krausslich, H.G.; Fuller, S.D.; Vogt, V.M.; Johnson, M.C. The stoichiometry of Gag protein in HIV-1. Nat. Struct. Mol. Biol. 2004, 11, 672–675. [Google Scholar] [CrossRef] [PubMed]
- Li, S.; Hill, C.P.; Sundquist, W.I.; Finch, J.T. Image reconstructions of helical assemblies of the HIV-1 CA protein. Nature 2000, 407, 409–413. [Google Scholar] [CrossRef] [PubMed]
- Pornillos, O.; Ganser-Pornillos, B.K.; Yeager, M. Atomic-level modelling of the HIV capsid. Nature 2011, 469, 424–427. [Google Scholar] [CrossRef] [PubMed]
- Mattei, S.; Glass, B.; Hagen, W.J.; Krausslich, H.G.; Briggs, J.A. The structure and flexibility of conical HIV-1 capsids determined within intact virions. Science 2016, 354, 1434–1437. [Google Scholar] [CrossRef] [PubMed]
- Ganser, B.K.; Li, S.; Klishko, V.Y.; Finch, J.T.; Sundquist, W.I. Assembly and analysis of conical models for the HIV-1 core. Science 1999, 283, 80–83. [Google Scholar] [CrossRef] [PubMed]
- Campbell, E.M.; Hope, T.J. HIV-1 capsid: The multifaceted key player in HIV-1 infection. Nat. Rev. Microbiol. 2015, 13, 471–483. [Google Scholar] [CrossRef]
- Rasaiyaah, J.; Tan, C.P.; Fletcher, A.J.; Price, A.J.; Blondeau, C.; Hilditch, L.; Jacques, D.A.; Selwood, D.L.; James, L.C.; Noursadeghi, M.; et al. HIV-1 evades innate immune recognition through specific cofactor recruitment. Nature 2013, 503, 402. [Google Scholar] [CrossRef]
- Francis, A.C.; Melikyan, G.B. Single HIV-1 Imaging Reveals Progression of Infection through CA-Dependent Steps of Docking at the Nuclear Pore, Uncoating, and Nuclear Transport. Cell Host Microbe. 2018, 23, 536–548.e536. [Google Scholar] [CrossRef]
- Burdick, R.C.; Delviks-Frankenberry, K.A.; Chen, J.; Janaka, S.K.; Sastri, J.; Hu, W.S.; Pathak, V.K. Dynamics and regulation of nuclear import and nuclear movements of HIV-1 complexes. PLoS Pathog. 2017, 13, e1006570. [Google Scholar] [CrossRef]
- Matreyek, K.A.; Engelman, A. The requirement for nucleoporin NUP153 during human immunodeficiency virus type 1 infection is determined by the viral capsid. J. Virol. 2011, 85, 7818–7827. [Google Scholar] [CrossRef]
- Hilditch, L.; Towers, G.J. A model for cofactor use during HIV-1 reverse transcription and nuclear entry. Curr. Opin. Virol. 2014, 4, 32–36. [Google Scholar] [CrossRef]
- Hulme, A.E.; Perez, O.; Hope, T.J. Complementary assays reveal a relationship between HIV-1 uncoating and reverse transcription. Proc. Natl. Acad. Sci. USA 2011, 108, 9975–9980. [Google Scholar] [CrossRef]
- Mamede, J.I.; Cianci, G.C.; Anderson, M.R.; Hope, T.J. Early cytoplasmic uncoating is associated with infectivity of HIV-1. Proc. Natl. Acad. Sci. USA 2017, 114, E7169–E7178. [Google Scholar] [CrossRef]
- Lukic, Z.; Dharan, A.; Fricke, T.; Diaz-Griffero, F.; Campbell, E.M. HIV-1 uncoating is facilitated by dynein and kinesin 1. J. Virol. 2014, 88, 13613–13625. [Google Scholar] [CrossRef]
- Yang, Y.; Fricke, T.; Diaz-Griffero, F. Inhibition of reverse transcriptase activity increases stability of the HIV-1 core. J. Virol. 2013, 87, 683–687. [Google Scholar] [CrossRef]
- Cosnefroy, O.; Murray, P.J.; Bishop, K.N. HIV-1 capsid uncoating initiates after the first strand transfer of reverse transcription. Retrovirology 2016, 13, 58. [Google Scholar] [CrossRef]
- Novikova, M.; Zhang, Y.; Freed, E.O.; Peng, K. Multiple Roles of HIV-1 Capsid during the Virus Replication Cycle. Virologica. Sinica. 2019, 34, 119–134. [Google Scholar] [CrossRef]
- Mori, M.; Kovalenko, L.; Lyonnais, S.; Antaki, D.; Torbett, B.E.; Botta, M.; Mirambeau, G.; Mely, Y. Nucleocapsid Protein: A Desirable Target for Future Therapies Against HIV-1. Curr. Top. Microbiol. Immunol. 2015, 389, 53–92. [Google Scholar] [CrossRef]
- Thenin-Houssier, S.; Valente, S.T. HIV-1 Capsid Inhibitors as Antiretroviral Agents. Curr. HIV Res. 2016, 14, 270–282. [Google Scholar] [CrossRef]
- Rumlova, M.; Ruml, T. In vitro methods for testing antiviral drugs. Biotechnol. Adv. 2018, 36, 557–576. [Google Scholar] [CrossRef]
- Carnes, S.K.; Sheehan, J.H.; Aiken, C. Inhibitors of the HIV-1 capsid, a target of opportunity. Curr. Opin. HIV AIDS 2018, 13, 359–365. [Google Scholar] [CrossRef]
- Kroto, H.W.; Heath, J.R.; O’Brien, S.C.; Curl, R.F.; Smalley, R.E. C60: Buckminsterfullerene. Nature 1985, 318, 162–163. [Google Scholar] [CrossRef]
- Nakamura, S.; Mashino, T. Water-soluble fullerene derivatives for drug discovery. J. Nippon Med. Sch. 2012, 79, 248–254. [Google Scholar] [CrossRef]
- Castro, E.; Hernandez Garcia, A.; Zavala, G.; Echegoyen, L. Fullerenes in Biology and Medicine. J. Mater. Chem. B 2017, 5, 6523–6535. [Google Scholar] [CrossRef]
- Yasuno, T.; Ohe, T.; Kataoka, H.; Hashimoto, K.; Ishikawa, Y.; Furukawa, K.; Tateishi, Y.; Kobayashi, T.; Takahashi, K.; Nakamura, S.; et al. Fullerene derivatives as dual inhibitors of HIV-1 reverse transcriptase and protease. Bioorg. Med. Chem. Lett. 2021, 31, 127675. [Google Scholar] [CrossRef]
- Bosi, S.; Da Ros, T.; Spalluto, G.; Prato, M. Fullerene derivatives: An attractive tool for biological applications. Eur. J. Med. Chem. 2003, 38, 913–923. [Google Scholar] [CrossRef]
- Kazemzadeh, H.; Mozafari, M. Fullerene-based delivery systems. Drug Discov. Today 2019, 24, 898–905. [Google Scholar] [CrossRef]
- Mashino, T.; Shimotohno, K.; Ikegami, N.; Nishikawa, D.; Okuda, K.; Takahashi, K.; Nakamura, S.; Mochizuki, M. Human immunodeficiency virus-reverse transcriptase inhibition and hepatitis C virus RNA-dependent RNA polymerase inhibition activities of fullerene derivatives. Bioorg. Med. Chem. Lett. 2005, 15, 1107–1109. [Google Scholar] [CrossRef]
- Kataoka, H.; Ohe, T.; Takahashi, K.; Nakamura, S.; Mashino, T. Novel fullerene derivatives as dual inhibitors of Hepatitis C virus NS5B polymerase and NS3/4A protease. Bioorg. Med. Chem. Lett. 2016, 26, 4565–4567. [Google Scholar] [CrossRef] [PubMed]
- Muñoz, A.; Sigwalt, D.; Illescas, B.M.; Luczkowiak, J.; Rodríguez-Pérez, L.; Nierengarten, I.; Holler, M.; Remy, J.-S.; Buffet, K.; Vincent, S.P.; et al. Synthesis of giant globular multivalent glycofullerenes as potent inhibitors in a model of Ebola virus infection. Nat. Chem. 2015, 8, 50. [Google Scholar] [CrossRef]
- Luczkowiak, J.; Muñoz, A.; Sánchez-Navarro, M.; Ribeiro-Viana, R.; Ginieis, A.; Illescas, B.M.; Martín, N.; Delgado, R.; Rojo, J. Glycofullerenes Inhibit Viral Infection. Biomacromolecules 2013, 14, 431–437. [Google Scholar] [CrossRef] [PubMed]
- Yasuno, T.; Ohe, T.; Takahashi, K.; Nakamura, S.; Mashino, T. The human immunodeficiency virus-reverse transcriptase inhibition activity of novel pyridine/pyridinium-type fullerene derivatives. Bioorg. Med. Chem. Lett. 2015, 25, 3226–3229. [Google Scholar] [CrossRef] [PubMed]
- Friedman, S.H.; Decamp, D.L.; Sijbesma, R.P.; Srdanov, G.; Wudl, F.; Kenyon, G.L. Inhibition of the Hiv-1 Protease by Fullerene Derivatives-Model-Building Studies and Experimental-Verification. J. Am. Chem. Soc. 1993, 115, 6506–6509. [Google Scholar] [CrossRef]
- Sijbesma, R.; Srdanov, G.; Wudl, F.; Castoro, J.A.; Wilkins, C.; Friedman, S.H.; Decamp, D.L.; Kenyon, G.L. Synthesis of a Fullerene Derivative for the Inhibition of HIV Enzymes. J. Am. Chem. Soc. 1993, 115, 6510–6512. [Google Scholar] [CrossRef]
- Martinez, Z.S.; Castro, E.; Seong, C.S.; Ceron, M.R.; Echegoyen, L.; Llano, M. Fullerene Derivatives Strongly Inhibit HIV-1 Replication by Affecting Virus Maturation without Impairing Protease Activity. Antimicrob. Agents Chemother. 2016, 60, 5731–5741. [Google Scholar] [CrossRef]
- Castro, E.; Martinez, Z.S.; Seong, C.-S.; Cabrera-Espinoza, A.; Ruiz, M.; Hernandez Garcia, A.; Valdez, F.; Llano, M.; Echegoyen, L. Characterization of New Cationic N,N-Dimethyl[70]fulleropyrrolidinium Iodide Derivatives as Potent HIV-1 Maturation Inhibitors. J. Med. Chem. 2016, 59, 10963–10973. [Google Scholar] [CrossRef]
- Wilson, S.R.; Lu, Q. 1,3-Dipolar Cycloaddition of N-Methylazomethine Ylide to C70. J. Org. Chem. 1995, 60, 6496–6498. [Google Scholar] [CrossRef]
- Tian, C.; Castro, E.; Wang, T.; Betancourt-Solis, G.; Rodriguez, G.; Echegoyen, L. Improved Performance and Stability of Inverted Planar Perovskite Solar Cells Using Fulleropyrrolidine Layers. ACS Appl. Mater. Interfaces 2016, 8, 31426–31432. [Google Scholar] [CrossRef]
- Dostalkova, A.; Skach, K.; Kaufman, F.; Krizova, I.; Hadravova, R.; Flegel, M.; Ruml, T.; Hrabal, R.; Rumlova, M. PF74 and Its Novel Derivatives Stabilize Hexameric Lattice of HIV-1 Mature-like Particles. Molecules 2020, 25, 1895. [Google Scholar] [CrossRef]
- Křížová, I.; Hadravová, R.; Štokrová, J.; Günterová, J.; Doležal, M.; Ruml, T.; Rumlová, M.; Pichová, I. The G-Patch Domain of Mason-Pfizer Monkey Virus Is a Part of Reverse Transcriptase. J. Virol. 2012, 86, 1988–1998. [Google Scholar] [CrossRef]
- Pichalova, R.; Fuzik, T.; Vokata, B.; Rumlova, M.; Llano, M.; Dostalkova, A.; Krizova, I.; Ruml, T.; Ulbrich, P. Conserved cysteines in Mason-Pfizer monkey virus capsid protein are essential for infectious mature particle formation. Virology 2018, 521, 108–117. [Google Scholar] [CrossRef]
- Wildova, M.; Hadravova, R.; Stokrova, J.; Krizova, I.; Ruml, T.; Hunter, E.; Pichova, I.; Rumlova, M. The effect of point mutations within the N-terminal domain of Mason-Pfizer monkey virus capsid protein on virus core assembly and infectivity. Virology 2008, 380, 157–163. [Google Scholar] [CrossRef]
- Barabás, O.; Rumlová, M.; Erdei, A.; Pongrácz, V.; Pichová, I.; Vértessy, B.G. dUTPase and nucleocapsid polypeptides of the Mason-Pfizer monkey virus form a fusion protein in the virion with homotrimeric organization and low catalytic efficiency. J. Bio. Chem. 2003, 278, 38803–38812. [Google Scholar] [CrossRef]
- Mbisa, J.L.; Delviks-Frankenberry, K.A.; Thomas, J.A.; Gorelick, R.J.; Pathak, V.K. Real-time PCR analysis of HIV-1 replication post-entry events. Methods Mol. Biol. 2009, 485, 55–72. [Google Scholar] [CrossRef]
- Dostalkova, A.; Kaufman, F.; Krizova, I.; Kultova, A.; Strohalmova, K.; Hadravova, R.; Ruml, T.; Rumlova, M. Mutations in the basic region of the Mason-Pfizer monkey virus nucleocapsid protein affect reverse transcription, gRNA packaging and the site of viral assembly. J. Virol. 2018, 92, e00106-18. [Google Scholar] [CrossRef]
- Hulme, A.E.; Hope, T.J. The cyclosporin A washout assay to detect HIV-1 uncoating in infected cells. Methods Mol. Biol. 2014, 1087, 37–46. [Google Scholar] [CrossRef]
- Fuzik, T.; Pichalova, R.; Schur, F.K.M.; Strohalmova, K.; Krizova, I.; Hadravova, R.; Rumlova, M.; Briggs, J.A.G.; Ulbrich, P.; Ruml, T. Nucleic Acid Binding by Mason-Pfizer Monkey Virus CA Promotes Virus Assembly and Genome Packaging. J. Virol. 2016, 90, 4593–4603. [Google Scholar] [CrossRef][Green Version]
- Korb, O.; Stützle, T.; Exner, T.E. PLANTS: Application of Ant Colony Optimization to Structure-Based Drug Design. In Proceedings of the Ant Colony Optimization and Swarm Intelligence, Berlin, Heidelberg, 4–7 September 2006; pp. 247–258. [Google Scholar]
- Trott, O.; Olson, A.J. AutoDock Vina: Improving the speed and accuracy of docking with a new scoring function, efficient optimization, and multithreading. J. Comput. Chem. 2010, 31, 455–461. [Google Scholar] [CrossRef]
- Martin, D.E.; Salzwedel, K.; Allaway, G.P. Bevirimat: A novel maturation inhibitor for the treatment of HIV-1 infection. Antivir. Chem. Chemother 2008, 19, 107–113. [Google Scholar] [CrossRef]
- Rumlova, M.; Krizova, I.; Keprova, A.; Hadravova, R.; Dolezal, M.; Strohalmova, K.; Pichova, I.; Hajek, M.; Ruml, T. HIV-1 protease-induced apoptosis. Retrovirology 2014, 11, 37. [Google Scholar] [CrossRef]
- Hadravova, R.; Rumlova, M.; Ruml, T. FAITH-Fast Assembly Inhibitor Test for HIV. Virology 2015, 486, 78–87. [Google Scholar] [CrossRef]
- Dostalkova, A.; Hadravova, R.; Kaufman, F.; Krizova, I.; Skach, K.; Flegel, M.; Hrabal, R.; Ruml, T.; Rumlova, M. A simple, high-throughput stabilization assay to test HIV-1 uncoating inhibitors. Sci. Rep. 2019, 9, 17076. [Google Scholar] [CrossRef]
- Sticht, J.; Humbert, M.; Findlow, S.; Bodem, J.; Müller, B.; Dietrich, U.; Werner, J.; Kräusslich, H.-G. A peptide inhibitor of HIV-1 assembly in vitro. Nat. Struct. Mol. Biol. 2005, 12, 671–677. [Google Scholar] [CrossRef]
- Forshey, B.M.; von Schwedler, U.; Sundquist, W.I.; Aiken, C. Formation of a human immunodeficiency virus type 1 core of optimal stability is crucial for viral replication. J. Virol. 2002, 76, 5667–5677. [Google Scholar] [CrossRef]
- Hulme, A.E.; Kelley, Z.; Okocha, E.A.; Hope, T.J. Identification of Capsid Mutations That Alter the Rate of HIV-1 Uncoating in Infected Cells. J. Virol. 2015, 89, 643. [Google Scholar] [CrossRef]
- Blair, W.S.; Pickford, C.; Irving, S.L.; Brown, D.G.; Anderson, M.; Bazin, R.; Cao, J.; Ciaramella, G.; Isaacson, J.; Jackson, L.; et al. HIV capsid is a tractable target for small molecule therapeutic intervention. PLoS Pathog. 2010, 6, e1001220. [Google Scholar] [CrossRef]
- Shi, J.; Zhou, J.; Shah, V.B.; Aiken, C.; Whitby, K. Small-molecule inhibition of human immunodeficiency virus type 1 infection by virus capsid destabilization. J. Virol. 2011, 85, 542–549. [Google Scholar] [CrossRef]
- Rankovic, S.; Ramalho, R.; Aiken, C.; Rousso, I. PF74 Reinforces the HIV-1 Capsid to Impair Reverse Transcription-Induced Uncoating. J. Virol. 2018, 92, e00845-18. [Google Scholar] [CrossRef]
- Amarasinghe, G.K.; De Guzman, R.N.; Turner, R.B.; Chancellor, K.J.; Wu, Z.R.; Summers, M.F. NMR structure of the HIV-1 nucleocapsid protein bound to stem-loop SL2 of the psi-RNA packaging signal. Implications for genome recognition. J. Mol. Biol. 2000, 301, 491–511. [Google Scholar] [CrossRef]
- De Guzman, R.N.; Wu, Z.R.; Stalling, C.C.; Pappalardo, L.; Borer, P.N.; Summers, M.F. Structure of the HIV-1 nucleocapsid protein bound to the SL3 psi-RNA recognition element. Science 1998, 279, 384–388. [Google Scholar] [CrossRef]


Publisher’s Note: MDPI stays neutral with regard to jurisdictional claims in published maps and institutional affiliations. |
© 2021 by the authors. Licensee MDPI, Basel, Switzerland. This article is an open access article distributed under the terms and conditions of the Creative Commons Attribution (CC BY) license (https://creativecommons.org/licenses/by/4.0/).
Share and Cite
Křížová, I.; Dostálková, A.; Castro, E.; Prchal, J.; Hadravová, R.; Kaufman, F.; Hrabal, R.; Ruml, T.; Llano, M.; Echegoyen, L.; et al. Fullerene Derivatives Prevent Packaging of Viral Genomic RNA into HIV-1 Particles by Binding Nucleocapsid Protein. Viruses 2021, 13, 2451. https://doi.org/10.3390/v13122451
Křížová I, Dostálková A, Castro E, Prchal J, Hadravová R, Kaufman F, Hrabal R, Ruml T, Llano M, Echegoyen L, et al. Fullerene Derivatives Prevent Packaging of Viral Genomic RNA into HIV-1 Particles by Binding Nucleocapsid Protein. Viruses. 2021; 13(12):2451. https://doi.org/10.3390/v13122451
Chicago/Turabian StyleKřížová, Ivana, Alžběta Dostálková, Edison Castro, Jan Prchal, Romana Hadravová, Filip Kaufman, Richard Hrabal, Tomáš Ruml, Manuel Llano, Luis Echegoyen, and et al. 2021. "Fullerene Derivatives Prevent Packaging of Viral Genomic RNA into HIV-1 Particles by Binding Nucleocapsid Protein" Viruses 13, no. 12: 2451. https://doi.org/10.3390/v13122451
APA StyleKřížová, I., Dostálková, A., Castro, E., Prchal, J., Hadravová, R., Kaufman, F., Hrabal, R., Ruml, T., Llano, M., Echegoyen, L., & Rumlová, M. (2021). Fullerene Derivatives Prevent Packaging of Viral Genomic RNA into HIV-1 Particles by Binding Nucleocapsid Protein. Viruses, 13(12), 2451. https://doi.org/10.3390/v13122451