Abstract
Coxsackievirus B3 (CVB3), a member of Picornaviridae family, is an important human pathogen that causes a wide range of diseases, including myocarditis, pancreatitis, and meningitis. Although CVB3 has been well demonstrated to target murine neural progenitor cells (NPCs), gene expression profiles of CVB3-infected human NPCs (hNPCs) has not been fully explored. To characterize the molecular signatures and complexity of CVB3-mediated host cellular responses in hNPCs, we performed QuantSeq 3′ mRNA sequencing. Increased expression levels of viral RNA sensors (RIG-I, MDA5) and interferon-stimulated genes, such as IFN-β, IP-10, ISG15, OAS1, OAS2, Mx2, were detected in response to CVB3 infection, while IFN-γ expression level was significantly downregulated in hNPCs. Consistent with the gene expression profile, CVB3 infection led to enhanced secretion of inflammatory cytokines and chemokines, such as interleukin-6 (IL-6), interleukin-8 (IL-8), and monocyte chemoattractant protein-1 (MCP-1). Furthermore, we show that type I interferon (IFN) treatment in hNPCs leads to significant attenuation of CVB3 RNA copy numbers, whereas, type II IFN (IFN-γ) treatment enhances CVB3 replication and upregulates suppressor of cytokine signaling 1/3 (SOCS) expression levels. Taken together, our results demonstrate the distinct molecular patterns of cellular responses to CVB3 infection in hNPCs and the pro-viral function of IFN-γ via the modulation of SOCS expression.
1. Introduction
Coxsackievirus B3 (CVB3) belongs to Enterovirus genus within the Picornaviridae family of viruses, associated with a wide variety of diseases, ranging from mild flu like symptoms to severe diseases including myocarditis, pancreatitis, and type I diabetes [1]. CVB3 can cause severe morbidity and mortality, particularly in younger patients, and infection during pregnancy can result in susceptibility to spontaneous abortion, fetal myocarditis, and neurodevelopmental defects in neonates [2,3]. In addition, the neonatal central nervous system (CNS) and heart are major targets of CVB3 infection. Previously, Feuer and colleagues have shown, using animal models, that CVB3 preferentially targets neural progenitor cells (NPCs) in the CNS [4,5,6,7,8]. In particular, they suggested that NPCs and neurogenic regions of the CNS may support persistent CVB3 infection and infected mice surviving infection may suffer a chronic depletion of neural stem cells. The effect of CVB3 infection in human neural progenitor cell (hNPC) model, however, remains to be investigated.
CVB3 has evolved many unique mechanisms to evade the innate immune response [1]. Nonetheless, the induction of type I interferon (IFN) signaling is essential for the control of CVB3 infection, as evident from the enhanced virus-induced lethality in type I IFN receptor null mice [9] and the increased susceptibility to CVB3 infection in IFN-β-deficient mice [10]. Both melanoma differentiation-associated gene 5 (MDA5)-and mitochondria antiviral-signaling protein (MAVS)-mediated type I IFN signaling pathways have been implicated in the response to CVB3 infections, and mice deficient in either TIR-domain-containing adapter-inducing interferon-β (TRIF) or MAVS show an enhanced susceptibility to viral infection [11]. CVB3-induced innate immune responses in human neural progenitor cells (hNPCs), however, are currently unknown.
Here, we have characterized CVB3-induced cellular responses in hNPCs, providing a comprehensive measurement of the host gene expression in a post-infection time-dependent manner. Furthermore, our data demonstrate that type I IFN treatment contributes to the attenuation of CVB3 replication, whereas type II IFN enhances CVB3 replication via the upregulation of suppressor of cytokine signaling (SOCS1/3) expression.
2. Materials and Methods
2.1. Cells and Viruses
HeLa cells purchased from American Type Culture Collection (Manassas, VA, USA) were maintained in Dulbecco’s modified Eagle’s medium (DMEM; Corning Mediatech, Corning, NY, USA) supplemented with 10% fetal bovine serum (FBS; Corning) and antibiotics.
The preparation of hNPCs was as described previously [12,13]. Briefly, human embryonic stem cells (hESCs) were grown under standard culture conditions with a feeder layer and transferred to a matrigel-coated plate with mouse embryonic fibroblasts (MEFs) conditioned medium. After two consecutive passages, neural differentiation was induced by replacing the hESC medium with DMEM/F12 supplemented with 2% B27, 100 ng/mL fibroblast growth factor, 100 ng/mL epidermal growth factor and 5 μg/mL heparin. Partially differentiated hESCs were dissociated with accutase and plated on geltrex-coated plates. Homogenous populations of NPCs were obtained after three continuous passages. Matrigel was purchased from BD Biosciences (San Jose, CA, USA) and other reagents were purchased from Invitrogen (Carlsbad, CA, USA).
CVB3 (H3 strain, Woodruff variant) [14] was a generous gift of Jae-Hwan Nam (Catholic University of Korea) and quantified by plaque assay on HeLa cells, as previously described [15].
2.2. Cell Viability Assay
Cells were seeded in 96-well plates. After 24 h, media were changed and CVB3 was infected for various time points. Cell viability was determined using CellTiter-Glo 2.0 luminescence assay (Promega, Madison, WI, USA) following manufacturer’s recommendations.
2.3. Gene Expression Analysis Using QuantSeq 3′ mRNA Sequencing
Total RNA was isolated using Trizol reagent (Invitrogen), as previously reported [13,16]. RNA quality was assessed by Agilent 2100 bioanalyzer using RNA 6000 Nano Chip (Agilent Technologies, Amstelveen, The Netherlands), and RNA quantification was performed using ND-2000 Spectrophotometer (Thermo Fisher Scientific, Waltham, MA, USA). The construction of library was performed using QuantSeq 3′ mRNA-Seq Library Prep Kit (Lexogen, Inc., Vienna, Austria) according to manufacturer’s instructions. In brief, each 500 ng total RNA was prepared for hybridization with the oligo-dT primer containing an Illumina-compatible sequence at the 5′ end. Reverse transcription was performed. After degradation of the RNA template, a second strand synthesis was initiated by a random primer containing an Illumina-compatible linker sequence at the 5′ end. All reaction components were removed using magnetic beads for library purification. Amplification of the library added complete adapter sequences required for cluster generation. The finished library was purified from PCR components and high-throughput sequencing was performed as single-end 75 bp sequencing using NextSeq 500 (Illumina, Inc., San Diego, CA, USA). QuantSeq 3′ mRNA reads were aligned using Bowtie2 [17]. Bowtie2 indices were generated either from the genome assembly sequence, or the representative transcript sequences for alignment to the genome and transcriptome. The alignment file was used to assemble and estimate the abundance of transcripts, and detect the differential expression of genes. Differentially expressed genes (DEGs) were determined based on counts from unique and multiple alignments using coverage in Bedtools [18]. The read count data were processed based on the quantile normalization method using EdgeR [19]. Heatmaps were generated and clustering was performed using custom R scripts. Gene Ontology (GO) and KEGG pathway enrichment analyses were performed using DAVID [20] and PANTHER [21]. Functional GO and network analysis of DEG was performed on plugin ClueGO (2.5) [22] and visualized using the plugin CluePedia (1.5) embedded in Cytoscape (3.6.0) [23]. Principal Component Analysis was performed using custom R scripts. The raw QuantSeq data files were deposited in NCBI’s Gene Expression Omnibus (GEO) and are accessible via the GEO Series accession number GSE136734.
2.4. Real-Time Reverse Transcriptase-Polymerase Chain Reaction (RT-PCR) Assay
QuantSeq results were validated by RT-PCR on specific target genes. First-strand cDNA was synthesized from 0.5 μg of total RNA using ImProm-II Reverse Transcription System (Promega) according to manufacturer’s instructions with the previously described primer sequences [13,24]. QuantStudio 6 Flex Real-time PCR system (Thermo Fisher Scientific) was utilized for cDNA amplification with Power SYBR® Green Master Mix (Applied Biosystems) under the following conditions: 95 °C for 10 min, followed by 40 cycles of 95 °C for 30 s and 60 °C for 1 min. Relative mRNA levels were determined using the comparative Ct method and normalized against β-actin mRNA.
2.5. Plasmid Transfection
HeLa cells were seeded in 12 well plates. The next day, suppressor of cytokine signaling (SOCS)1 or SOCS3 encoding DNA plasmid (Sino biological, Beijing, China) was mixed with polyethylenimine (PEI, Sigma-Aldrich, St. Louis, MO, USA) in Opti-MEM (Thermo Fisher Scientific), and the mixture was incubated for 20 min at room temperature. DNA–PEI mix was then added to the cells.
2.6. Confocal Microscopy
Cells were seeded onto coverslips in 24-well plates and transfected with various plasmids, followed by CVB3 infection at various time points. Cells were washed with PBS, fixed with 4% paraformaldehyde (PFA), and permeabilized with 0.1% Triton X-100, as described previously [12,13]. Cells were then stained with anti-Coxsackievirus B3 antibody (1:1000 dilution; Merck, Kenilworth, NJ, USA), followed by anti-mouse Alexa 594 conjugated antibody (Invitrogen). Coverslips were mounted on glass slides using mounting media containing 4,6-diamidino-2-phenylindole (DAPI) and examined using a confocal microscope (LSM700; Carl Zeiss, Oberkochen, Germany).
2.7. Western Blot Analysis
Cells were lysed with RIPA buffer (Sigma-Aldrich) supplemented with a protease and phosphatase inhibitor cocktail (Roche, Basel, Switzerland) at the specified time points. Lysate proteins were resolved by sodium dodecyl sulfate-polyacrylamide gel electrophoresis (SDS-PAGE) on 10–12% acrylamide gels. Proteins were transferred onto polyvinylidene difluoride membranes and blocked with 5% (w/v) skim milk in Tris-buffered saline (0.2 M Tris, 1.36 M NaCl) supplemented with 0.1% (v/v) Tween-20 (TBS-Tw) for 1 h at room temperature. This was followed by overnight incubation with primary antibodies (Cell Signaling Technology, Danvers, MA, USA) at 4 °C. As a loading control, tubulin or β-actin (Abgent, San Diego, CA, USA) antibody was used. After three washes in TBS-Tw, the membranes were incubated with horseradish peroxidase-conjugated anti-rabbit or anti-mouse IgG secondary antibodies for 1 h at 25 °C. Membranes were washed with TBS-Tw and incubated in Western Lumi Pico solution (ECL solution kit; DoGen, Seoul, Korea). Signals were determined using a Fusion Solo Imaging System (Vilber Lourmat, Collégien, France). Band intensities were quantified by Fusion-Capt analysis software (Vilber Lourmat).
2.8. Cytokine Secretion Measurements by ELISA
Cell-free cultured supernatant was examined for interleukin-6 (IL-6), interleukin-8 (IL-8), monocyte chemoattractant protein-1 (MCP-1) concentrations using ELISA kits (R&D Systems, Minneapolis, MN, USA) following manufacturer’s instructions.
2.9. Statistical Analysis
The statistical comparisons between the different treatments were performed using an unpaired two-tailed Student’s t test or a Mann Whitney test (Graphpad Software, La Jolla, CA, USA) and p < 0.05 was considered statistically significant.
3. Results
3.1. Human Neural Progenitor Cells Are Susceptible to CVB3 Infection
Previous reports have demonstrated that CVB3 preferentially infects murine NPCs in vitro, and that undifferentiated NPCs were more susceptible to CVB3 infection compared to differentiated NPC precursors [4,5,7,8]. Here, we examined the infection patterns of CVB3 in HeLa vs. hNPCs. HeLa cells were infected with CVB3 at an MOI of 1 for specific time points. RT-PCR analysis showed a significant increase of CVB3 RNA copy number in a time-dependent manner in HeLa cells, in comparison to the uninfected control (Figure 1A). On the other hand, IFN-β mRNA expression was robustly suppressed upon CVB3 infection in HeLa cells, a finding consistent with a previous report [25]. Furthermore, cell viability results suggest that significant cell death occurs following CVB3 infection at 24 h post infection (hpi) in HeLa cells (Figure 1B). Interestingly, in hNPCs, CVB3 RNA copy numbers increased significantly in a time-dependent manner but HeLa cells were exhibiting higher levels of CVB3 RNA copy number increase, even at lower MOIs. IFN-β expression, however, was upregulated only in hNPCs in contrast to HeLa cells (Figure 1C). Quantitative comparison of CVB3-induced cytopathic effect in hNPCs was carried out using a luminescence-based cellular viability assay. Results showed that CVB3-infected hNPCs remain viable at 72 hpi, even at high MOIs (Figure 1D).
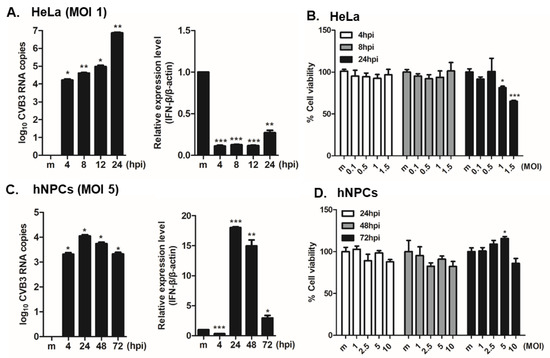
Figure 1.
Coxsackievirus B3 (CVB3) efficiently replicates in human neural progenitor cells (hNPCs) and causes minimal cytotoxicity. HeLa cells and hNPCs were infected with CVB3 at MOI of 1 or 5 for the indicated times. (A,C) RT-PCR was performed to measure CVB3 copy number and IFN-β mRNA levels. The expression of viral RNA copies was calculated in relation to the expression level of β-actin mRNA. *, p < 0.05; **, p < 0.01; ***, p < 0.001, compared with mock-infected cells. (B,D) At the end of the incubation period, cell viability was determined using CellTiter Glo assays. Each value represents the mean ± SEM (n = 4).
3.2. Gene Expression Profiling of CVB3-Infected hNPCs
Alongside microarrays and conventional RNA sequencing, QuantSeq technology provides an additional platform to measure gene expression. To gain insights into the gene expression profiles of CVB3-infected hNPCs, QuantSeq 3′ mRNA sequencing was performed to analyze the transcriptome of CVB3-infected hNPCs at different timepoints. DEGs were identified as genes up- or downregulated with a fold change of ±2 and a p-value < 0.05, compared to the mock control. As summarized by expression plots and Venn diagrams, many commonly upregulated DEGs were detected at 24, 48, and 72 hpi, while very few were detected at 4 hpi (Figure 2A,B). To evaluate the degree of dissimilarity among samples in terms of biological variations and dimensions, we performed three dimensional multidimensional scaling (3D-MDS) analysis (Figure 2C). Overall, 24, 48, and 72 hpi samples were distinctly distributed, while 4 hpi and mock samples were relatively close in proximity, as shown in the 3D-MDS plot. These findings indicate that the gene expression profiles of the mock and 4 hpi samples share a degree of similarity, whereas 24, 48, and 72 hpi samples were distinctly clustered.
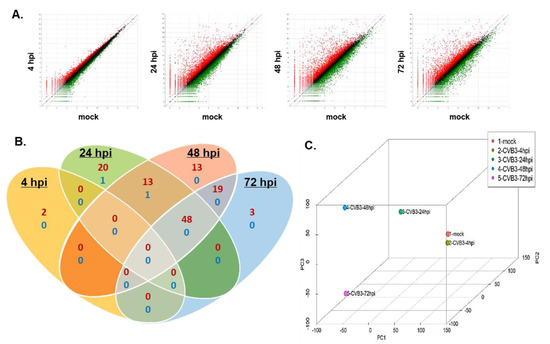
Figure 2.
QuantSeq analysis reveals differential expression patterns of host genes in CVB3-infected hNPCs. hNPCs were infected with CVB3 (MOI 5) and RNA was harvested at 4, 24, 48, and 72 h post infection (hpi). (A) Scatter plot shows the x-axis and y-axis indicating the expression levels of genes from mock-infected and virus-infected groups, respectively. Relatively highly expressed genes in the virus-infected groups (red) and mock-infected groups (green) are depicted. Black dots represent genes that were not classified as differentially expressed. The differentially expressed gene (DEG) count was identified by comparing mock- and virus-infected groups (fold change > 2) (B) Venn diagrams representing the overlap in DEG profiles of CVB3-infected cells. Numbers of upregulated genes (more than 100 folds) are indicated in red and downregulated genes are in blue. (C) Three-dimensional multi-dimensional scaling (3D-MDS) plot of QuantSeq datasets shows that 24, 48, and 72 hpi samples are clustered in locations different from the mock or 4 hpi samples.
In addition, gene ontology-based bioinformatics analysis of targets of DEGs revealed that, compared to mock-infected cells, CVB3-infected cells were differentially enriched in proteins associated with the inflammatory response and immune response (Figure 3A). Table 1 also shows that many of top 30 upregulated DEGs are associated with immune function. A heatmap representing 20 DEGs involved in immune function includes multiple antiviral response genes, such as OAS1, OAS2, IFNB1, Mx1, Mx2, and CXCL10 (Figure 3B). Although expressions of immune-related genes were unchanged or downregulated at 4 hpi, gene expression of anti-viral response genes were highly upregulated at 24 hpi and continued to be increased even at later time points, including 48 and 72 hpi. Interestingly, genes involved in inflammation, such as IL-6, were also found to be among the highly regulated DEGs. Meanwhile, IFNG1 gene expression was found to be significantly downregulated upon CVB3 infection (FC = 0.154 at all timepoints).
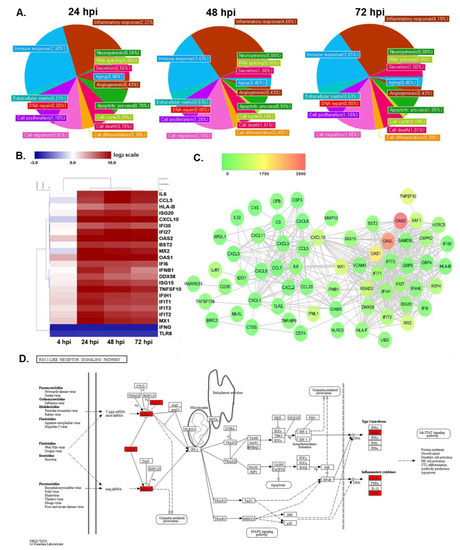
Figure 3.
Comprehensive analysis of gene expression profiles of CVB3-infected hNPCs reveals changes in innate immune response genes. (A) Gene ontology (B) Heatmap indicating the log2 fold change values of differentially expressed genes (DEGs) involved in immune responses in response to CVB3 infection of hNPCs, as determined by QuantSeq analysis. Hierarchical clustering was performed to group genes based on similar expression profiles, as indicated by the dendrograms (left). Up- and downregulated DEGs are indicated in red and blue, respectively. Time points are indicated below the panels. (C) Interferon-stimulated genes–protein interaction networks of DEGs in 48 hpi samples were constructed using Cytoscape. Nodes represent proteins and edges represent interactions between two proteins. Fold changes in the gene expression of the virus-infected groups was overlaid onto the nodes, as indicated by the color key. (D) GG analysis of 48 hpi sample resulted in a list of DEGs involved in RIG-I like receptor signaling pathways. Red, green, and white colors indicate significantly increased, significantly decreased, and unchanged gene expression in mock vs. CVB3-infected cells. DEGs were labelled on the map of RIG-I like receptor signaling pathways obtained from KEGG database with official permission and guidance [26,27,28].

Table 1.
Top 30 up-regulated differentially expressed genes in CVB3-infected hNPCs.
Interferon stimulated genes (ISGs) are anti-viral factors induced by IFNs in response to viral infection. DEGs identified in the previous step were imported into Cytoscape (version 3.3.0) for the identification of ISG-protein network analysis (Figure 3C). The nodes represent DEGs of 48 hpi samples, whose expression levels are depicted with colors corresponding to the fold change values. OAS2 demonstrated the highest expression level in the network and many ISGs are found to interact with each other. In addition, a KEGG pathway enrichment analysis was performed to determine which functional pathways correlated with the gene expression changes observed and identify functional groups that are significantly enriched in response to CVB3 infection. As shown in Figure 3D, CVB3-induced DEGs in hNPCs were associated with retinoic acid-inducible gene I (RIG-I) signaling pathways, specifically upregulating ISG15, RIG-I, LGP2, MDA5, IFN-γ, IL-8, and IP-10.
3.3. Confirmation of Quant-Seq Data Using Quantitative RT-PCR Assay
To validate the QuantSeq results, we used a quantitative RT-PCR assay to analyze the expression levels of the selected upregulated genes. In accordance with the QuantSeq data, CVB3 infection in hNPCs exhibited a statistically significant increase in mRNA expression levels of DDX58 (RIG-I), IFIH1 (MDA5), IFN-β, IP-10, ISG-15, OAS1, OAS2, and Mx2 compared to mock-control cells at 24, 48, and 72 hpi (Figure 4A). We also measured IL-6, IL-8, and MCP-1 secretion levels in the supernatants of CVB3-infected hNPCs by ELISA. Consistent with QuantSeq results, higher levels of cytokine/chemokine were released in a time-dependent manner (Figure 4B). Western blot also revealed enhanced RIG-I and MDA5 expressions following CVB3 infection in hNPCs, however the expression level of MAVS was downregulated upon CVB3 infection, as previously reported [25] (Figure 4C).
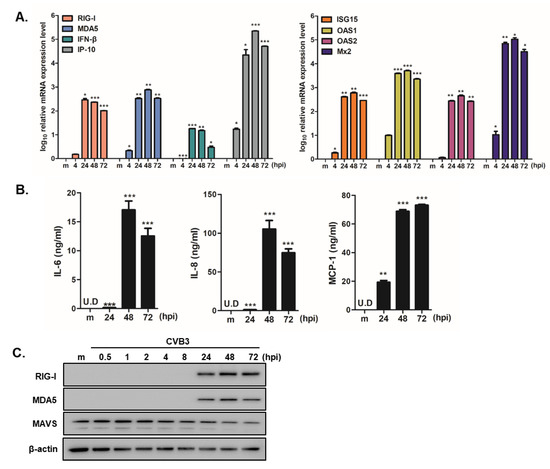
Figure 4.
Interferon signaling and inflammatory responses are induced in CVB3-infected hNPCs. (A) Quantitative RT-PCR analysis was performed to measure RIG-I, MDA5, IFN-β, IP-10, ISG-15, OAS1, OAS2, and Mx2 transcript levels following CVB3 infection (MOI 5) in hNPCs. * p < 0.05; ** p < 0.01; *** p < 0.001, compared with mock-infected cells. (B) The concentration of secreted inflammatory cytokines/chemokines (IL-6, IL-8, MCP-1) in the cultured media was determined by ELISA. * p < 0.05; ** p < 0.01; *** p < 0.001 versus mock-infected control cells (C) The protein levels of RIG-I, MDA5, MAVS, and β-actin were measured by western blotting.
3.4. Type II IFN-Induced SOCS Upregulation Enhances CVB3 vRNA Expression
Given that IFN-β gene was among the most upregulated DEGs, while IFN-γ gene was significantly downregulated in QuantSeq analysis, we investigated the effect of differential IFN signaling and function in CVB3-infected hNPCs. Recombinant human IFNs (IFN-α, IFN-β, IFN-γ, IFN-λ1, and IFN-λ2) were added to the hNPCs. Cells were infected with CVB3 at an MOI of 5 for 8 h and Quantitative RT-PCR assay was performed to determine CVB3 RNA copy number. Figure 5A shows that type I IFN (IFN-α, IFN-β) treatment led to impaired CVB3 replication, while type II IFN treatment led to the opposite effect, causing enhanced viral replication in hNPCs. In addition, IFN-γ treatment exhibited a dose-dependent effect (Figure 5B), while IFN-γ treatment resulted in the time-dependent phosphorylation of Signal transducer and activator of transcription 1 (STAT1) and STAT3 (Figure 5C). Furthermore, specific upregulation of interferon stimulatory factor 1 following IFN-γ treatment was also observed, suggesting that IFN-γ signaling is functional. To determine the possible mechanisms by which IFN-γ signaling leads to enhanced viral replication, we next measured the expression levels of suppressor of cytokine signaling 1/3 (SOCS1/3) upon CVB3 infection in hNPCs. Dose-dependent increase of SOCS1 and SOCS3 gene expression levels following CVB3 infection occurred in hNPCs (Figure 5D). Next, we examined whether SOCS regulates CVB3 replication. Quantitative RT-PCR assay was utilized to quantify the mRNA fold-induction levels of SOCS1, SOCS3, and RIG-I. After confirming the overexpression levels of SOCS1 and SOCS3 (Figure 5E), we determined the transcript level of CVB3 RNA copy number in response to the overexpression. Overexpression of SOCS1 or SOCS3 resulted in a significant increase of CVB3 RNA replication, whereas overexpression of RIG-I resulted in reduced CVB3 RNA copy number (Figure 5F). Additionally, increased CVB3 immunostaining in SOCS1 or SOCS3 overexpressing cells highlight the importance of SOCS expression during a productive viral replication (Figure 5G,H).
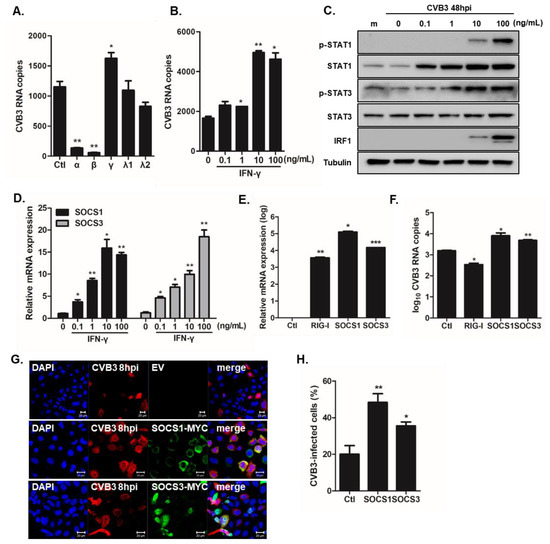
Figure 5.
Type II interferon (IFN) signaling results in enhanced viral replication via upregulation of suppressor of cytokine signaling (SOCS)1 and SOCS3. (A) Recombinant human IFN-α (10 ng/mL), IFN-β (10 ng/mL), IFN-γ (10 ng/mL), IFN-λ1 (100 ng/mL), and IFN-λ2 (100 ng/mL) were added to hNPCs. The next day, cells were infected with CVB3 (MOI 5) and viral RNA expression was measured by RT-PCR. Data are shown as means ± SEM of three independent experiments. (B–D) hNPCs were treated with various doses of IFN-γ overnight, followed by CVB3 infection (MOI 5). (B) CVB3 copy number was determined (C) The protein levels of IFN-γ downstream signaling pathways, such as pSTAT1/STAT1, pSTAT3/STAT3, and interferon regulatory factor 1 (IRF1) were measured by western blotting. (D) RT-PCR was performed to measure relative SOCS1 and SOCS3 mRNA levels. * p < 0.05; ** p < 0.01; *** p < 0.001 versus mock-infected control cells. (E,F) HeLa cells were transfected with empty vector (EV), SOCS1-MYC tag, or SOCS3-MYC tag encoding plasmids for 24 h. The next day, cells were infected with CVB3 (MOI 1) for 8 hpi. Transfection efficiency was confirmed by measuring each gene expression level. Changes in the transcriptional expression of CVB3 vRNA were measured using RT-PCR. Transcript expression levels were calculated in relation to the expression level of β-actin and expressed as a fold-change in comparison to the expression level in EV-transfected control cells. * p < 0.05 versus mock-infected EV-transfected cells. (G,H) HeLa cells were transfected with EV, MYC-SOCS1, or MYC-SOCS3 encoding plasmids for 24 h and infected with CVB3 for 8 h. Cells were immunostained with anti-Coxsackievirus B3 antibody and anti-MYC antibody to detect SOCS proteins. CVB3 is indicated in red and cell nuclei are stained blue. The images are representative of three independent experiments. Scale bar represents 20 μm. CVB3-infected cells were counted and presented as % in the graph.
4. Discussion
Enteroviruses, including Coxsackieviruses (CVs), surprisingly exhibit a tropism for the central nervous system (CNS) and are commonly associated with viral meningitis and encephalitis [3]. The adult CNS contains NPCs with self-renewable, multipotent characteristics for neurogenesis and plasticity [29]. hNPCs give rise to glial and neuronal cell types that produce a diverse array of secreted mediators and receptors, all of which are relevant for the maintenance of the neurogenic niche [30]. Neurotropic viruses can disrupt the survival, proliferation, and maturation of NPCs, and ultimately impair neurogenesis. In particular, the effect of neurotropic virus infection on hNPCs has been well demonstrated through extensive research. Zika virus, in particular, directly infects human neural progenitor cells and results in transcriptional dysregulation and attenuated cell growth, in addition to cytotoxic effects, leading to the abrogation of neurogenesis [31,32,33,34].
Previous studies using mice models have demonstrated the ability of CVB3 to infect proliferating NPCs located in the neonatal subventicular zone and persist in the adult murine CNS [5,7]. Furthermore, the persistence of CVB3 within the murine neurogenic region can lead to the infection of neural stem cells, causing cell death, decrease in brain size, and eventually developmental defects [8]. Since CVB3-induced spontaneous abortions, fetal myocarditis, and neurodevelopmental delays in the newborn can result in fatal outcomes [35], the characterization of CVB3 pathogenesis in the hNPC model is essential.
In this study, we examined comprehensive gene expression profiling of CVB3-infected hNPCs. Our data reveal that hNPCs are susceptible to CVB3 infection, while no minimal cytopathic effect was observed upon CVB3 infection. QuantSeq data indicate that the most highly regulated DEGs were involved in biological pathways associated with RIG-I antiviral innate immunity and inflammatory responses. In contrast to the upregulation of type I IFNs, the IFN-γ gene was downregulated upon CVB3 infection. Furthermore, the treatment of recombinant IFN-γ protein in hNPCs led to the upregulation of SOCS proteins, thus facilitating viral replication.
Cytoplasmic helicase receptors, including retinoic acid-inducible gene I (RIG-I) and melanoma differentiation-associated gene 5 (MDA5), are important mediators of intracellular viral nucleic acid sensing. Each consists of a C-terminal DEXD/H-box RNA-helicase domain and an N-terminal caspase recruitment domain and can induce IFN gene transcription in response to viral RNA. In mice, MDA5, but not RIG-I, seems to play as a predominant receptor for immune protection against CVB3 infection [11]. Meanwhile, our QuantSeq data highlight alterations in expression patterns of host genes during CVB3 infection in hNPCs. Many DEGs involved in both RIG-I and MDA5-mediated antiviral signaling were detected to be upregulated, in addition to DEGs involved in inflammatory pathways. Likewise, an RT-PCR analysis was performed to validate the QuantSeq data, and the transcript levels of interferon stimulated genes, such as of DDX58 (RIG-I), IFIH1 (MDA5), IFN-β, IP-10, ISG-15, OAS1, OAS2, and Mx2 were all upregulated in response to CVB3 infection. Several molecules that increase the inflammatory response in the brain, such as CXCL10 and IL-6, were upregulated in CVB3-infected hNPCs. Interestingly, the significant suppression of IFN-γ gene in CVB3-infected hNPCs proved to be an unexpected finding. IFN-γ, a pleiotropic cytokine, has a central role in regulating NSCs proliferation and quiescence [36,37]. Li et al. previously demonstrated that K3 and K5 proteins of Kaposi’s sarcoma-associated herpesvirus specifically target gamma interferon receptor 1 (IFN-γR1) and induce its ubiquitination, endocytosis, and degradation to downregulate IFN-γR1 surface expression, and, thereby, inhibit IFN-γ action [38]. It is possible that CVB3 also targets IFN-γR1 to downregulate IFN-γ activity in hNPCs.
The SOCS family of proteins is involved in the regulation of both innate and adaptive immunity, including negative regulation of JAK/STAT pathways, dendritic cell activation, T cell differentiation and function [39,40]. Among the eight members of the SOCS family, SOCS1 and SOCS3 have an amino-terminal kinase inhibitory region that inhibits JAK tyrosine kinase activity and a carboxy-terminal SOCS box that recruits the ubiquitin transferase complex [41,42]. This multifaceted structure enables SOCS proteins to possess a wide range of biological functions [43]. Recently, SOCS proteins have gained attention as frequent targets of viral exploitation of the host immune response. Multiple viruses promote their survival by inducing SOCS1 and/or SOCS3 protein expression following infection [44,45,46,47,48,49,50,51,52]. Here, for the first time, we show that IFN-γ activation followed by CVB3 infection can result in the upregulation of SOCS expression in hNPCs and SOCS overexpression facilitates CVB3 replication. Nonetheless, further studies are required to characterize the primary roles and immunomodulatory mechanisms of SOCS proteins during CVB3 infection in particular.
Of note, Huber and colleagues have shown that several wild type CVB3 variants exist and they were different in their capacity to cause myocarditis [14,53,54]. In our study, we used the CVB3 H3 Woodruff variant, which presented high susceptibility for myocardial cells in vitro and lacked tropism for heart in vivo [9]. Interestingly, CVB3 may recombine with other Enterovirus B viruses, like Echo-6, Echo-16, Echo-30, Echo-25, and CVB5 [55]. Thus, in a clinical setting, although the virus may be identified as CVB3, based on the VP1 sequence, it is still possible that the recombinant sequence of a patient may have different properties and the cellular response may be different. Therefore, it will be important to further characterize the pathogenic effect of these recombinant strains in cellular and animal models.
In conclusion, our study provides evidence for the involvement of antiviral and inflammatory pathways during CVB3 infection in hNPCs. Additional in vitro and in vivo studies are necessary for further validation of the role of different IFNs and SOCS proteins, as well as their contribution to the outcome of CVB3-induced neurological diseases. Identifying pathways or markers of viral neurological diseases will shed light on the development of novel therapeutic targets or strategies to prevent or treat enterovirus infections, and ultimately contribute to the alleviation of morbidity and mortality caused by these infections.
Author Contributions
Conceptualization, O.S.S.; methodology, S.-J.O., J.-A.G.; formal analysis, S.-J.O., J.-A.G., J.K.L.; investigation, S.-J.O.; resources, H.P.; writing—original draft preparation, O.S.S.; writing—review and editing, H.P., O.S.S.; visualization, H.P., O.S.S.; supervision, H.P., O.S.S.; project administration, H.P., O.S.S.; funding acquisition, O.S.S. All authors have read and agreed to the published version of the manuscript.
Funding
This research was funded by the Basic Science Research Program of the National Research Foundation of Korea (NRF), by the Ministry of Science, ICT & Future Planning (NRF-2019R1A2C1005961).
Conflicts of Interest
The authors declare no conflict of interest.
References
- Sin, J.; Mangale, V.; Thienphrapa, W.; Gottlieb, R.A.; Feuer, R. Recent progress in understanding coxsackievirus replication, dissemination, and pathogenesis. Virology 2015, 484, 288–304. [Google Scholar] [CrossRef] [PubMed]
- Lee, J.K.; Oh, S.J.; Park, H.; Shin, O.S. Recent Updates on Research Models and Tools to Study Virus-Host Interactions at the Placenta. Viruses 2019, 12, 5. [Google Scholar] [CrossRef] [PubMed]
- Wells, A.I.; Coyne, C.B. Enteroviruses: A Gut-Wrenching Game of Entry, Detection, and Evasion. Viruses 2019, 11, 460. [Google Scholar] [CrossRef] [PubMed]
- Feuer, R.; Mena, I.; Pagarigan, R.R.; Harkins, S.; Hassett, D.E.; Whitton, J.L. Coxsackievirus B3 and the neonatal CNS: The roles of stem cells, developing neurons, and apoptosis in infection, viral dissemination, and disease. Am. J. Pathol. 2003, 163, 1379–1393. [Google Scholar] [CrossRef]
- Feuer, R.; Pagarigan, R.R.; Harkins, S.; Liu, F.; Hunziker, I.P.; Whitton, J.L. Coxsackievirus targets proliferating neuronal progenitor cells in the neonatal CNS. J. Neurosci. 2005, 25, 2434–2444. [Google Scholar] [CrossRef]
- Feuer, R.; Ruller, C.M.; An, N.; Tabor-Godwin, J.M.; Rhoades, R.E.; Maciejewski, S.; Pagarigan, R.R.; Cornell, C.T.; Crocker, S.J.; Kiosses, W.B.; et al. Viral persistence and chronic immunopathology in the adult central nervous system following Coxsackievirus infection during the neonatal period. J. Virol. 2009, 83, 9356–9369. [Google Scholar] [CrossRef]
- Tsueng, G.; Tabor-Godwin, J.M.; Gopal, A.; Ruller, C.M.; Deline, S.; An, N.; Frausto, R.F.; Milner, R.; Crocker, S.J.; Whitton, J.L.; et al. Coxsackievirus preferentially replicates and induces cytopathic effects in undifferentiated neural progenitor cells. J. Virol. 2011, 85, 5718–5732. [Google Scholar] [CrossRef]
- Ruller, C.M.; Tabor-Godwin, J.M.; Van Deren, D.A., Jr.; Robinson, S.M.; Maciejewski, S.; Gluhm, S.; Gilbert, P.E.; An, N.; Gude, N.A.; Sussman, M.A.; et al. Neural stem cell depletion and CNS developmental defects after enteroviral infection. Am. J. Pathol. 2012, 180, 1107–1120. [Google Scholar] [CrossRef]
- Wessely, R.; Klingel, K.; Knowlton, K.U.; Kandolf, R. Cardioselective infection with coxsackievirus B3 requires intact type I interferon signaling: Implications for mortality and early viral replication. Circulation 2001, 103, 756–761. [Google Scholar] [CrossRef]
- Deonarain, R.; Cerullo, D.; Fuse, K.; Liu, P.P.; Fish, E.N. Protective role for interferon-beta in coxsackievirus B3 infection. Circulation 2004, 110, 3540–3543. [Google Scholar] [CrossRef]
- Wang, J.P.; Cerny, A.; Asher, D.R.; Kurt-Jones, E.A.; Bronson, R.T.; Finberg, R.W. MDA5 and MAVS mediate type I interferon responses to coxsackie B virus. J. Virol. 2010, 84, 254–260. [Google Scholar] [CrossRef]
- Kim, J.A.; Seong, R.K.; Kumar, M.; Shin, O.S. Favipiravir and Ribavirin Inhibit Replication of Asian and African Strains of Zika Virus in Different Cell Models. Viruses 2018, 10, 72. [Google Scholar] [CrossRef] [PubMed]
- Kim, J.A.; Seong, R.K.; Son, S.W.; Shin, O.S. Insights into ZIKV-Mediated Innate Immune Responses in Human Dermal Fibroblasts and Epidermal Keratinocytes. J. Investig. Dermatol. 2019, 139, 391–399. [Google Scholar] [CrossRef] [PubMed]
- Knowlton, K.U.; Jeon, E.S.; Berkley, N.; Wessely, R.; Huber, S. A mutation in the puff region of VP2 attenuates the myocarditic phenotype of an infectious cDNA of the Woodruff variant of coxsackievirus B3. J. Virol. 1996, 70, 7811–7818. [Google Scholar] [CrossRef] [PubMed]
- Chung, S.K.; Kim, J.Y.; Kim, I.B.; Park, S.I.; Paek, K.H.; Nam, J.H. Internalization and trafficking mechanisms of coxsackievirus B3 in HeLa cells. Virology 2005, 333, 31–40. [Google Scholar] [CrossRef] [PubMed]
- Seo, S.W.; Park, S.K.; Oh, S.J.; Shin, O.S. TLR4-mediated activation of the ERK pathway following UVA irradiation contributes to increased cytokine and MMP expression in senescent human dermal fibroblasts. PLoS ONE 2018, 13, e0202323. [Google Scholar] [CrossRef] [PubMed]
- Langmead, B.; Salzberg, S.L. Fast gapped-read alignment with Bowtie 2. Nat. Methods 2012, 9, 357–359. [Google Scholar] [CrossRef]
- Quinlan, A.R.; Hall, I.M. BEDTools: A flexible suite of utilities for comparing genomic features. Bioinformatics 2010, 26, 841–842. [Google Scholar] [CrossRef]
- Robinson, M.D.; McCarthy, D.J.; Smyth, G.K. edgeR: A Bioconductor package for differential expression analysis of digital gene expression data. Bioinformatics 2010, 26, 139–140. [Google Scholar] [CrossRef]
- Huang da, W.; Sherman, B.T.; Lempicki, R.A. Systematic and integrative analysis of large gene lists using DAVID bioinformatics resources. Nat. Protoc. 2009, 4, 44–57. [Google Scholar] [CrossRef]
- Mi, H.; Huang, X.; Muruganujan, A.; Tang, H.; Mills, C.; Kang, D.; Thomas, P.D. PANTHER version 11: Expanded annotation data from Gene Ontology and Reactome pathways, and data analysis tool enhancements. Nucleic Acids Res. 2017, 45, D183–D189. [Google Scholar] [CrossRef] [PubMed]
- Shannon, P.; Markiel, A.; Ozier, O.; Baliga, N.S.; Wang, J.T.; Ramage, D.; Amin, N.; Schwikowski, B.; Ideker, T. Cytoscape: A software environment for integrated models of biomolecular interaction networks. Genome Res. 2003, 13, 2498–2504. [Google Scholar] [CrossRef] [PubMed]
- Bindea, G.; Mlecnik, B.; Hackl, H.; Charoentong, P.; Tosolini, M.; Kirilovsky, A.; Fridman, W.H.; Pages, F.; Trajanoski, Z.; Galon, J. ClueGO: A Cytoscape plug-in to decipher functionally grouped gene ontology and pathway annotation networks. Bioinformatics 2009, 25, 1091–1093. [Google Scholar] [CrossRef] [PubMed]
- Oh, S.J.; Lim, S.; Song, M.J.; Ahn, J.H.; Lee, C.H.; Shin, O.S. Whole Transcriptome Analyses Reveal Differential mRNA and microRNA Expression Profiles in Primary Human Dermal Fibroblasts Infected with Clinical or Vaccine Strains of Varicella Zoster Virus. Pathogens 2019, 8, 183. [Google Scholar] [CrossRef]
- Mukherjee, A.; Morosky, S.A.; Delorme-Axford, E.; Dybdahl-Sissoko, N.; Oberste, M.S.; Wang, T.; Coyne, C.B. The coxsackievirus B 3C protease cleaves MAVS and TRIF to attenuate host type I interferon and apoptotic signaling. PLoS Pathog. 2011, 7, e1001311. [Google Scholar] [CrossRef]
- Kanehisa, M.; Goto, S. KEGG: Kyoto encyclopedia of genes and genomes. Nucleic Acids Res. 2000, 28, 27–30. [Google Scholar] [CrossRef]
- Kanehisa, M. Toward understanding the origin and evolution of cellular organisms. Protein Sci. 2019, 28, 1947–1951. [Google Scholar] [CrossRef]
- Kanehisa, M.; Sato, Y.; Furumichi, M.; Morishima, K.; Tanabe, M. New approach for understanding genome variations in KEGG. Nucleic Acids Res. 2019, 47, D590–D595. [Google Scholar] [CrossRef]
- Sanai, N.; Tramontin, A.D.; Quinones-Hinojosa, A.; Barbaro, N.M.; Gupta, N.; Kunwar, S.; Lawton, M.T.; McDermott, M.W.; Parsa, A.T.; Manuel-Garcia Verdugo, J.; et al. Unique astrocyte ribbon in adult human brain contains neural stem cells but lacks chain migration. Nature 2004, 427, 740–744. [Google Scholar] [CrossRef]
- Kokaia, Z.; Martino, G.; Schwartz, M.; Lindvall, O. Cross-talk between neural stem cells and immune cells: The key to better brain repair? Nat. Neurosci. 2012, 15, 1078–1087. [Google Scholar] [CrossRef]
- Lee, J.K.; Shin, O.S. Advances in Zika Virus(-)Host Cell Interaction: Current Knowledge and Future Perspectives. Int. J. Mol. Sci. 2019, 20, 1101. [Google Scholar] [CrossRef] [PubMed]
- Hanners, N.W.; Eitson, J.L.; Usui, N.; Richardson, R.B.; Wexler, E.M.; Konopka, G.; Schoggins, J.W. Western Zika Virus in Human Fetal Neural Progenitors Persists Long Term with Partial Cytopathic and Limited Immunogenic Effects. Cell Rep. 2016, 15, 2315–2322. [Google Scholar] [CrossRef] [PubMed]
- Li, C.; Xu, D.; Ye, Q.; Hong, S.; Jiang, Y.; Liu, X.; Zhang, N.; Shi, L.; Qin, C.F.; Xu, Z. Zika Virus Disrupts Neural Progenitor Development and Leads to Microcephaly in Mice. Cell Stem Cell 2016, 19, 672. [Google Scholar] [CrossRef] [PubMed]
- Devhare, P.; Meyer, K.; Steele, R.; Ray, R.B.; Ray, R. Zika virus infection dysregulates human neural stem cell growth and inhibits differentiation into neuroprogenitor cells. Cell Death Dis. 2017, 8, e3106. [Google Scholar] [CrossRef]
- Ornoy, A.; Tenenbaum, A. Pregnancy outcome following infections by coxsackie, echo, measles, mumps, hepatitis, polio and encephalitis viruses. Reprod. Toxicol. 2006, 21, 446–457. [Google Scholar] [CrossRef]
- Kulkarni, A.; Ganesan, P.; O’Donnell, L.A. Interferon Gamma: Influence on Neural Stem Cell Function in Neurodegenerative and Neuroinflammatory Disease. Clin. Med. Insights Pathol. 2016, 9, 9–19. [Google Scholar] [CrossRef]
- Kulkarni, A.; Scully, T.J.; O’Donnell, L.A. The antiviral cytokine interferon-gamma restricts neural stem/progenitor cell proliferation through activation of STAT1 and modulation of retinoblastoma protein phosphorylation. J. Neurosci. Res. 2017, 95, 1582–1601. [Google Scholar] [CrossRef]
- Li, Q.; Means, R.; Lang, S.; Jung, J.U. Downregulation of gamma interferon receptor 1 by Kaposi’s sarcoma-associated herpesvirus K3 and K5. J. Virol. 2007, 81, 2117–2127. [Google Scholar] [CrossRef]
- Linossi, E.M.; Calleja, D.J.; Nicholson, S.E. Understanding SOCS protein specificity. Growth Factors 2018, 36, 104–117. [Google Scholar] [CrossRef]
- Wong, P.K.; Egan, P.J.; Croker, B.A.; O’Donnell, K.; Sims, N.A.; Drake, S.; Kiu, H.; McManus, E.J.; Alexander, W.S.; Roberts, A.W.; et al. SOCS-3 negatively regulates innate and adaptive immune mechanisms in acute IL-1-dependent inflammatory arthritis. J. Clin. Investig. 2006, 116, 1571–1581. [Google Scholar] [CrossRef]
- Yoshimura, A.; Naka, T.; Kubo, M. SOCS proteins, cytokine signalling and immune regulation. Nat. Rev. Immunol. 2007, 7, 454–465. [Google Scholar] [CrossRef] [PubMed]
- Hilton, D.J.; Richardson, R.T.; Alexander, W.S.; Viney, E.M.; Willson, T.A.; Sprigg, N.S.; Starr, R.; Nicholson, S.E.; Metcalf, D.; Nicola, N.A. Twenty proteins containing a C-terminal SOCS box form five structural classes. Proc. Natl. Acad. Sci. USA 1998, 95, 114–119. [Google Scholar] [CrossRef] [PubMed]
- Akhtar, L.N.; Benveniste, E.N. Viral exploitation of host SOCS protein functions. J. Virol. 2011, 85, 1912. [Google Scholar] [CrossRef] [PubMed]
- Akhtar, L.N.; Qin, H.; Muldowney, M.T.; Yanagisawa, L.L.; Kutsch, O.; Clements, J.E.; Benveniste, E.N. Suppressor of cytokine signaling 3 inhibits antiviral IFN-beta signaling to enhance HIV-1 replication in macrophages. J. Immunol. 2010, 185, 2393–2404. [Google Scholar] [CrossRef]
- Shao, R.X.; Zhang, L.; Hong, Z.; Goto, K.; Cheng, D.; Chen, W.C.; Jilg, N.; Kumthip, K.; Fusco, D.N.; Peng, L.F.; et al. SOCS1 abrogates IFN’s antiviral effect on hepatitis C virus replication. Antivir. Res. 2013, 97, 101–107. [Google Scholar] [CrossRef][Green Version]
- Li, X.; Zhu, Q.; Cao, Q.; Chen, H.; Qian, P. Japanese encephalitis virus upregulates the expression of SOCS3 in mouse brain and Raw264.7 Cells. Viruses 2014, 6, 4280–4293. [Google Scholar] [CrossRef]
- Choi, E.J.; Lee, C.H.; Shin, O.S. Suppressor of Cytokine Signaling 3 Expression Induced by Varicella-Zoster Virus Infection Results in the Modulation of Virus Replication. Scand. J. Immunol. 2015, 82, 337–344. [Google Scholar] [CrossRef]
- Okumura, A.; Rasmussen, A.L.; Halfmann, P.; Feldmann, F.; Yoshimura, A.; Feldmann, H.; Kawaoka, Y.; Harty, R.N.; Katze, M.G. Suppressor of Cytokine Signaling 3 Is an Inducible Host Factor That Regulates Virus Egress during Ebola Virus Infection. J. Virol. 2015, 89, 10399–10406. [Google Scholar] [CrossRef]
- Pauli, E.K.; Schmolke, M.; Wolff, T.; Viemann, D.; Roth, J.; Bode, J.G.; Ludwig, S. Influenza A virus inhibits type I IFN signaling via NF-kappaB-dependent induction of SOCS-3 expression. PLoS Pathog. 2008, 4, e1000196. [Google Scholar] [CrossRef]
- Pothlichet, J.; Chignard, M.; Si-Tahar, M. Cutting edge: Innate immune response triggered by influenza A virus is negatively regulated by SOCS1 and SOCS3 through a RIG-I/IFNAR1-dependent pathway. J. Immunol. 2008, 180, 2034–2038. [Google Scholar] [CrossRef]
- Sun, K.; Salmon, S.; Yajjala, V.K.; Bauer, C.; Metzger, D.W. Expression of suppressor of cytokine signaling 1 (SOCS1) impairs viral clearance and exacerbates lung injury during influenza infection. PLoS Pathog. 2014, 10, e1004560. [Google Scholar] [CrossRef] [PubMed]
- Seong, R.K.; Lee, J.K.; Shin, O.S. Zika Virus-Induction of the Suppressor of Cytokine Signaling 1/3 Contributes to the Modulation of Viral Replication. Pathogens 2020, 9, 163. [Google Scholar] [CrossRef] [PubMed]
- Huber, S.A.; Haisch, C.; Lodge, P.A. Functional diversity in vascular endothelial cells: Role in coxsackievirus tropism. J. Virol. 1990, 64, 4516–4522. [Google Scholar] [CrossRef] [PubMed]
- Van Houten, N.; Bouchard, P.E.; Moraska, A.; Huber, S.A. Selection of an attenuated Coxsackievirus B3 variant, using a monoclonal antibody reactive to myocyte antigen. J. Virol. 1991, 65, 1286–1290. [Google Scholar] [CrossRef] [PubMed]
- Nikolaidis, M.; Mimouli, K.; Kyriakopoulou, Z.; Tsimpidis, M.; Tsakogiannis, D.; Markoulatos, P.; Amoutzias, G.D. Large-scale genomic analysis reveals recurrent patterns of intertypic recombination in human enteroviruses. Virology 2019, 526, 72–80. [Google Scholar] [CrossRef] [PubMed]
© 2020 by the authors. Licensee MDPI, Basel, Switzerland. This article is an open access article distributed under the terms and conditions of the Creative Commons Attribution (CC BY) license (http://creativecommons.org/licenses/by/4.0/).