Significance of Viral Activity for Regulating Heterotrophic Prokaryote Community Dynamics along a Meridional Gradient of Stratification in the Northeast Atlantic Ocean


_Brussaard.png)
Abstract
1. Introduction
2. Materials and Methods
2.1. Sampling and Physicochemical Parameters
2.2. Microbial Abundances
2.3. Heterotrophic Prokaryotic Production
2.4. Viral Mediated Mortality
2.5. Protozoan Mediated Mortality
2.6. Statistical Analysis
3. Results
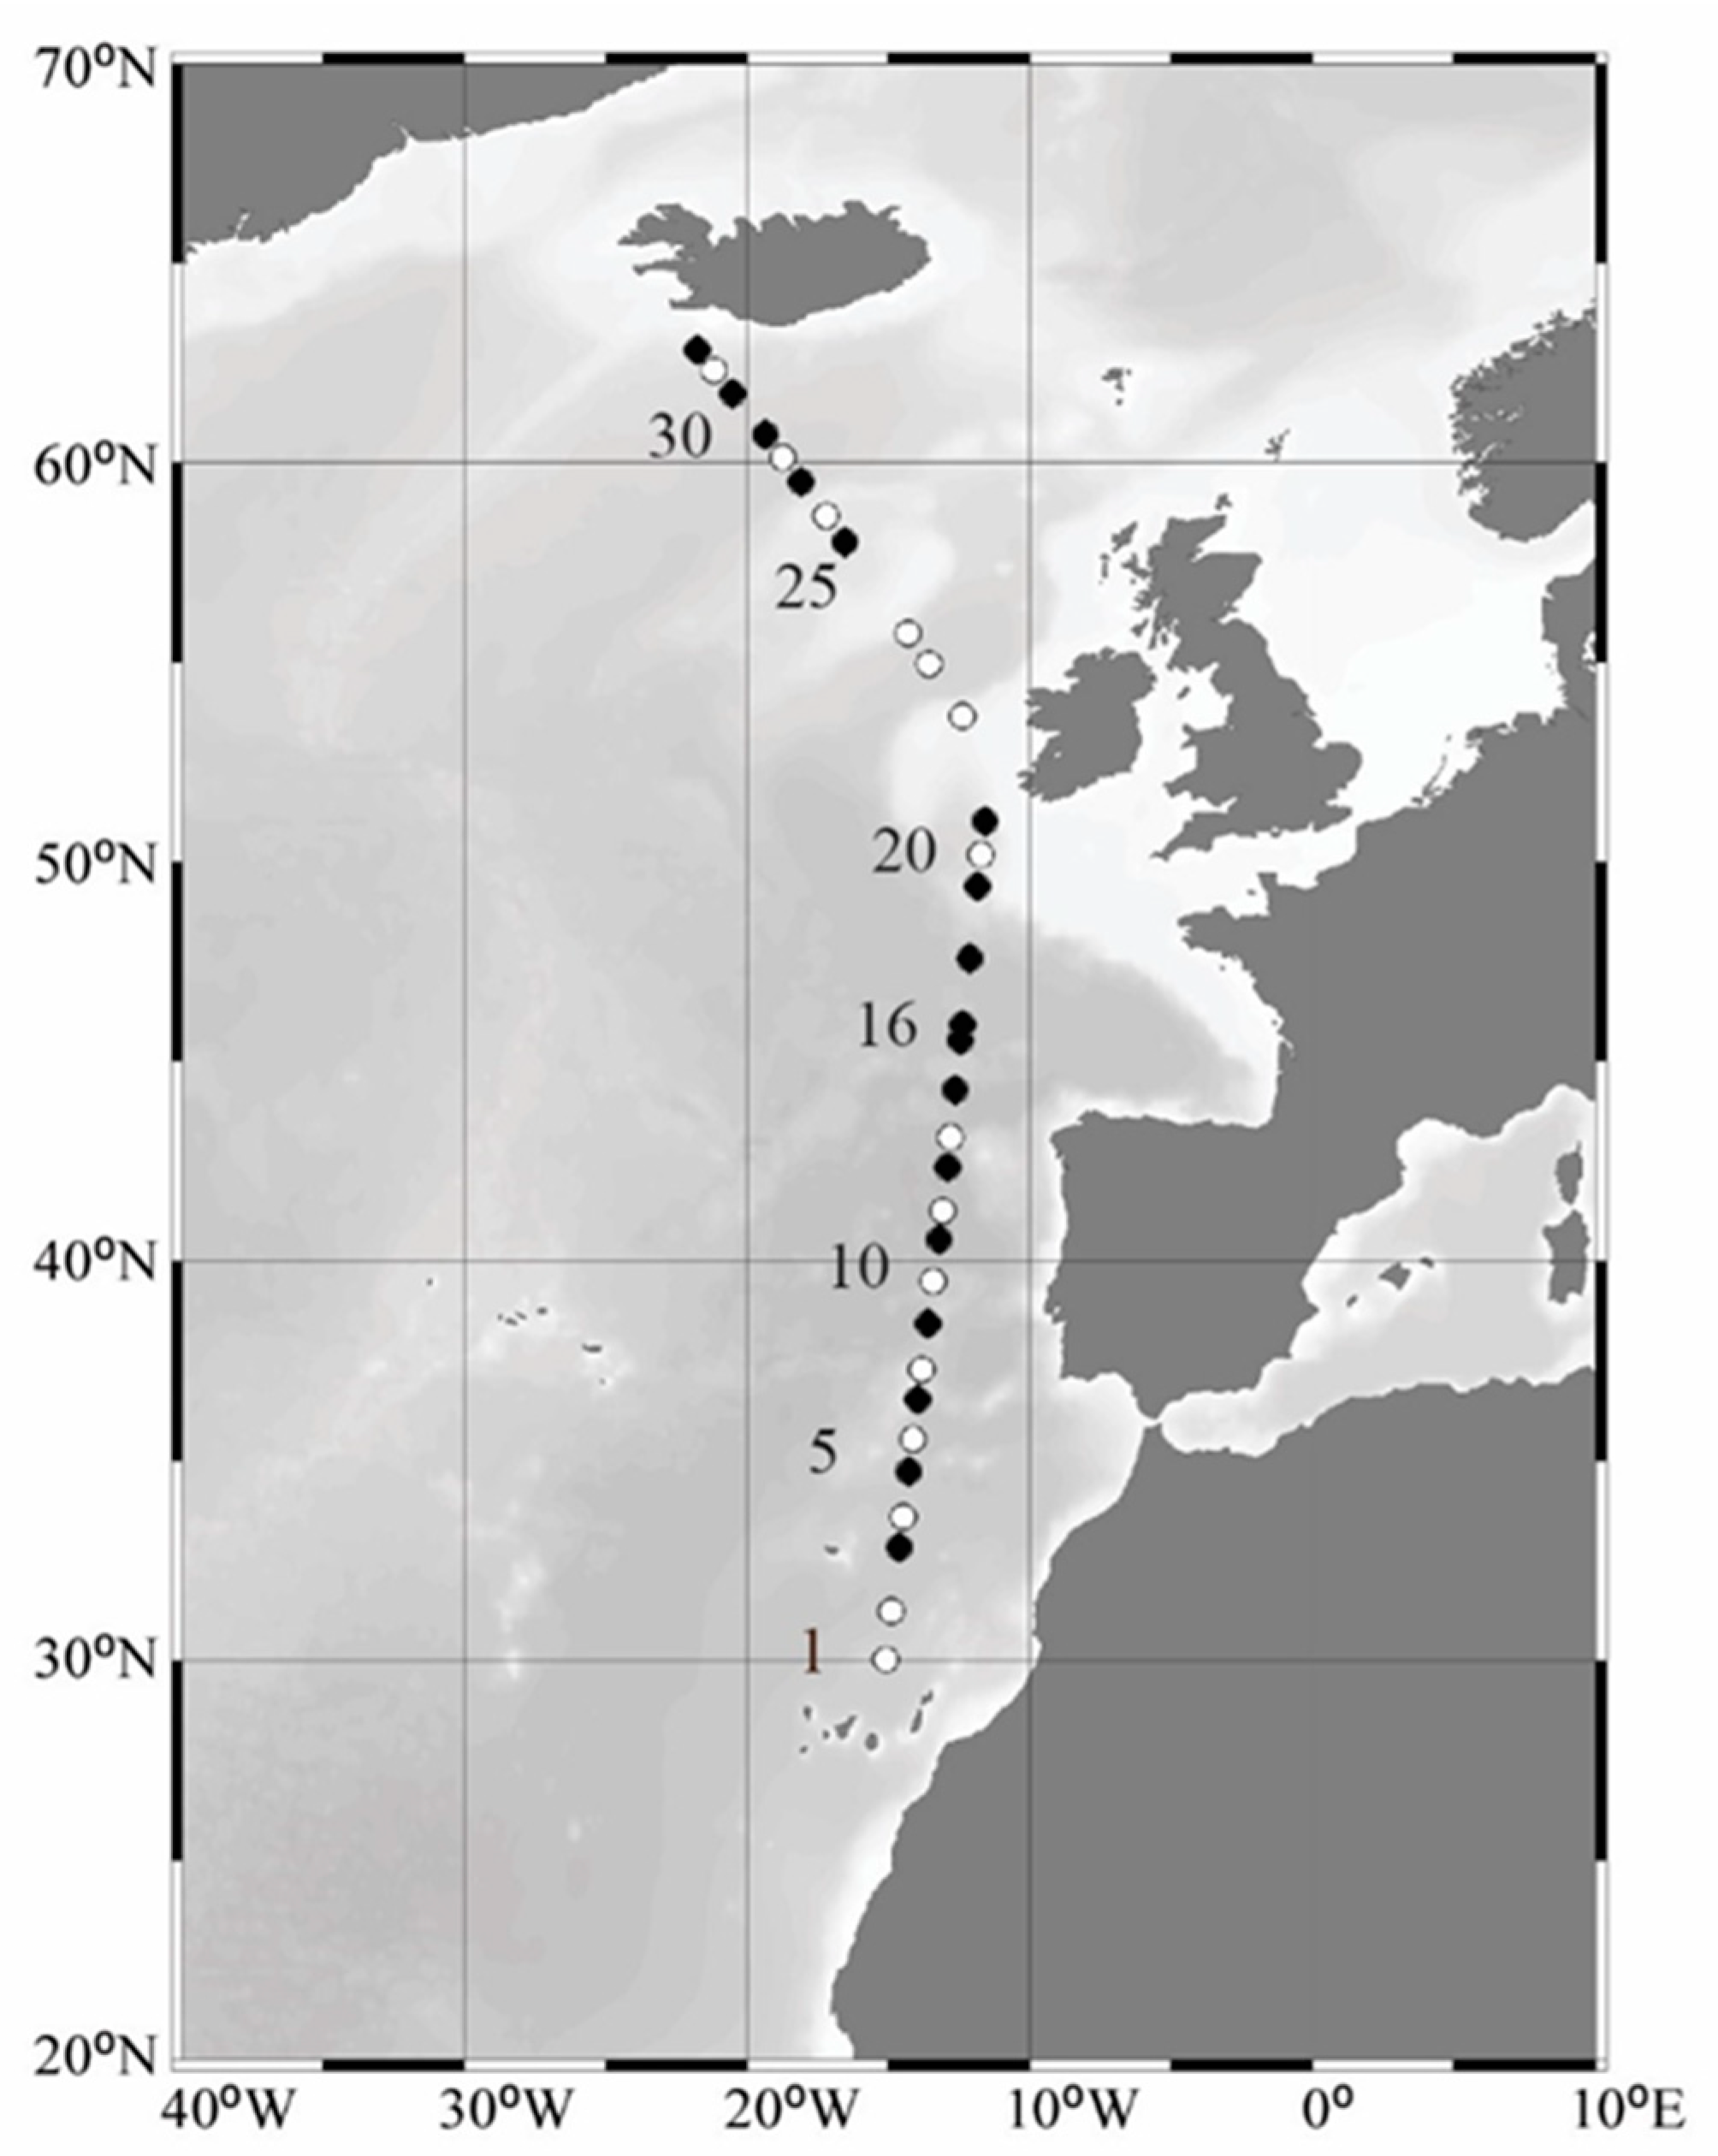
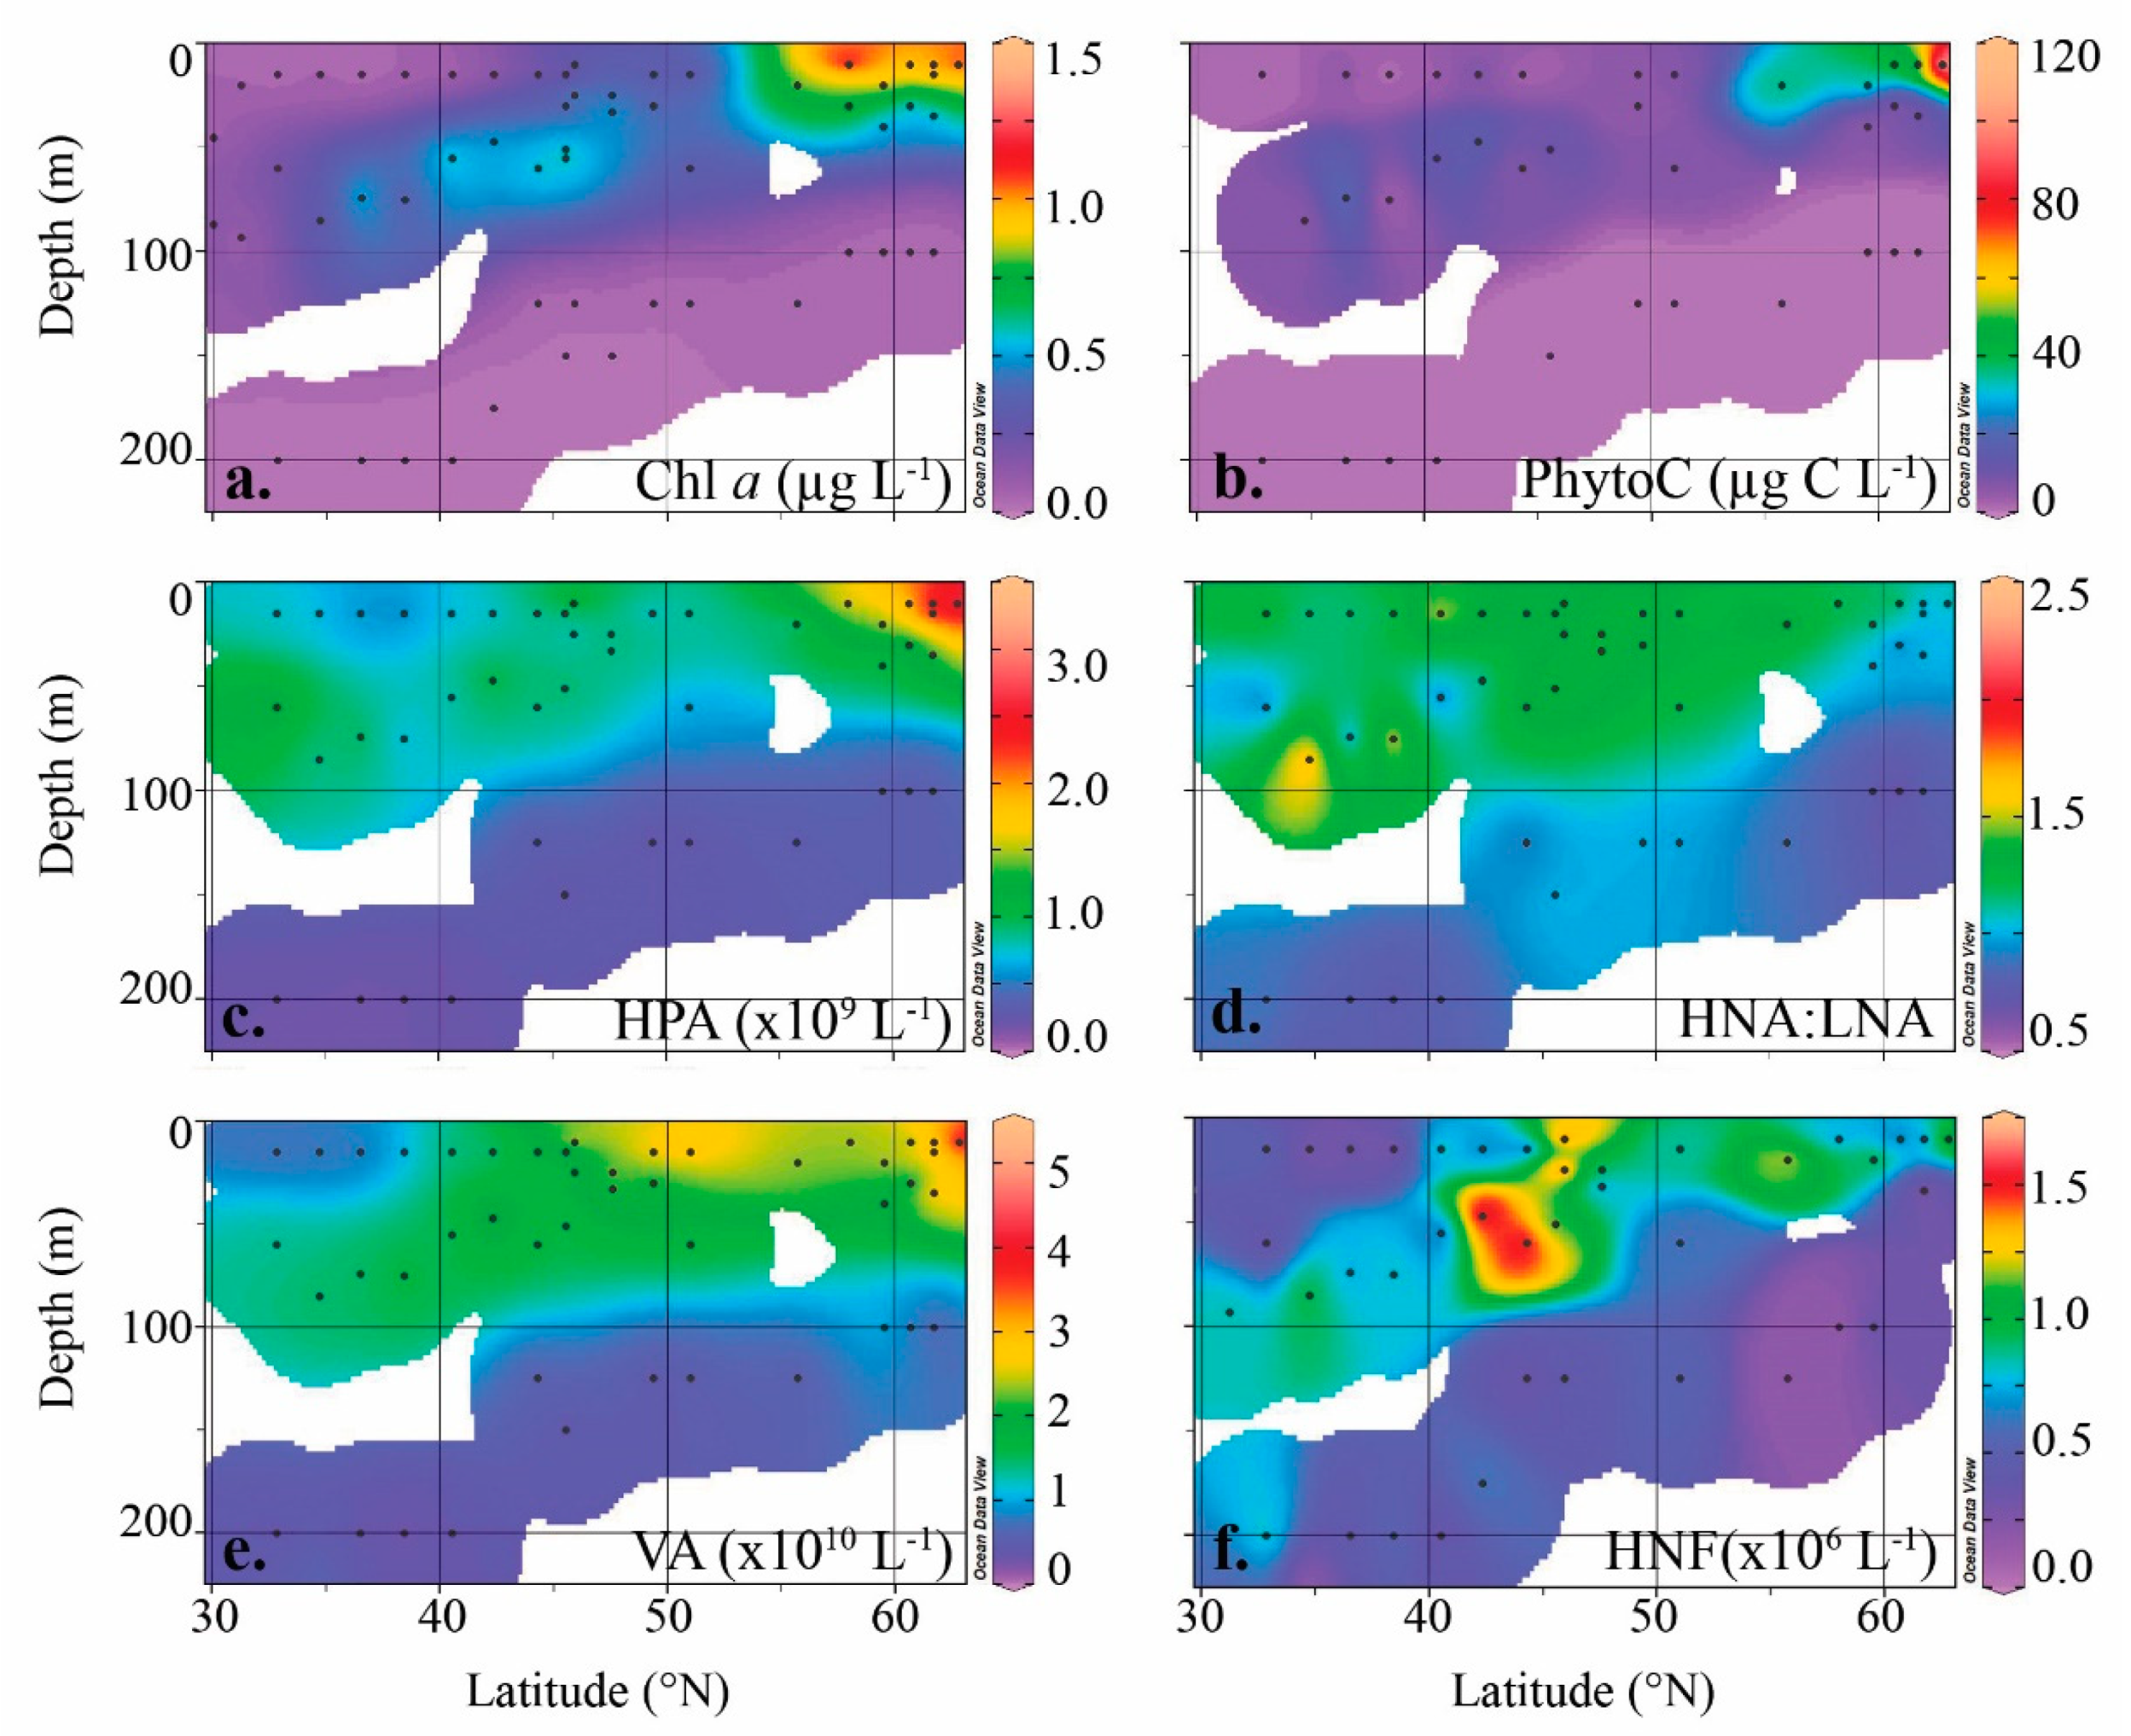
3.1. Study Site
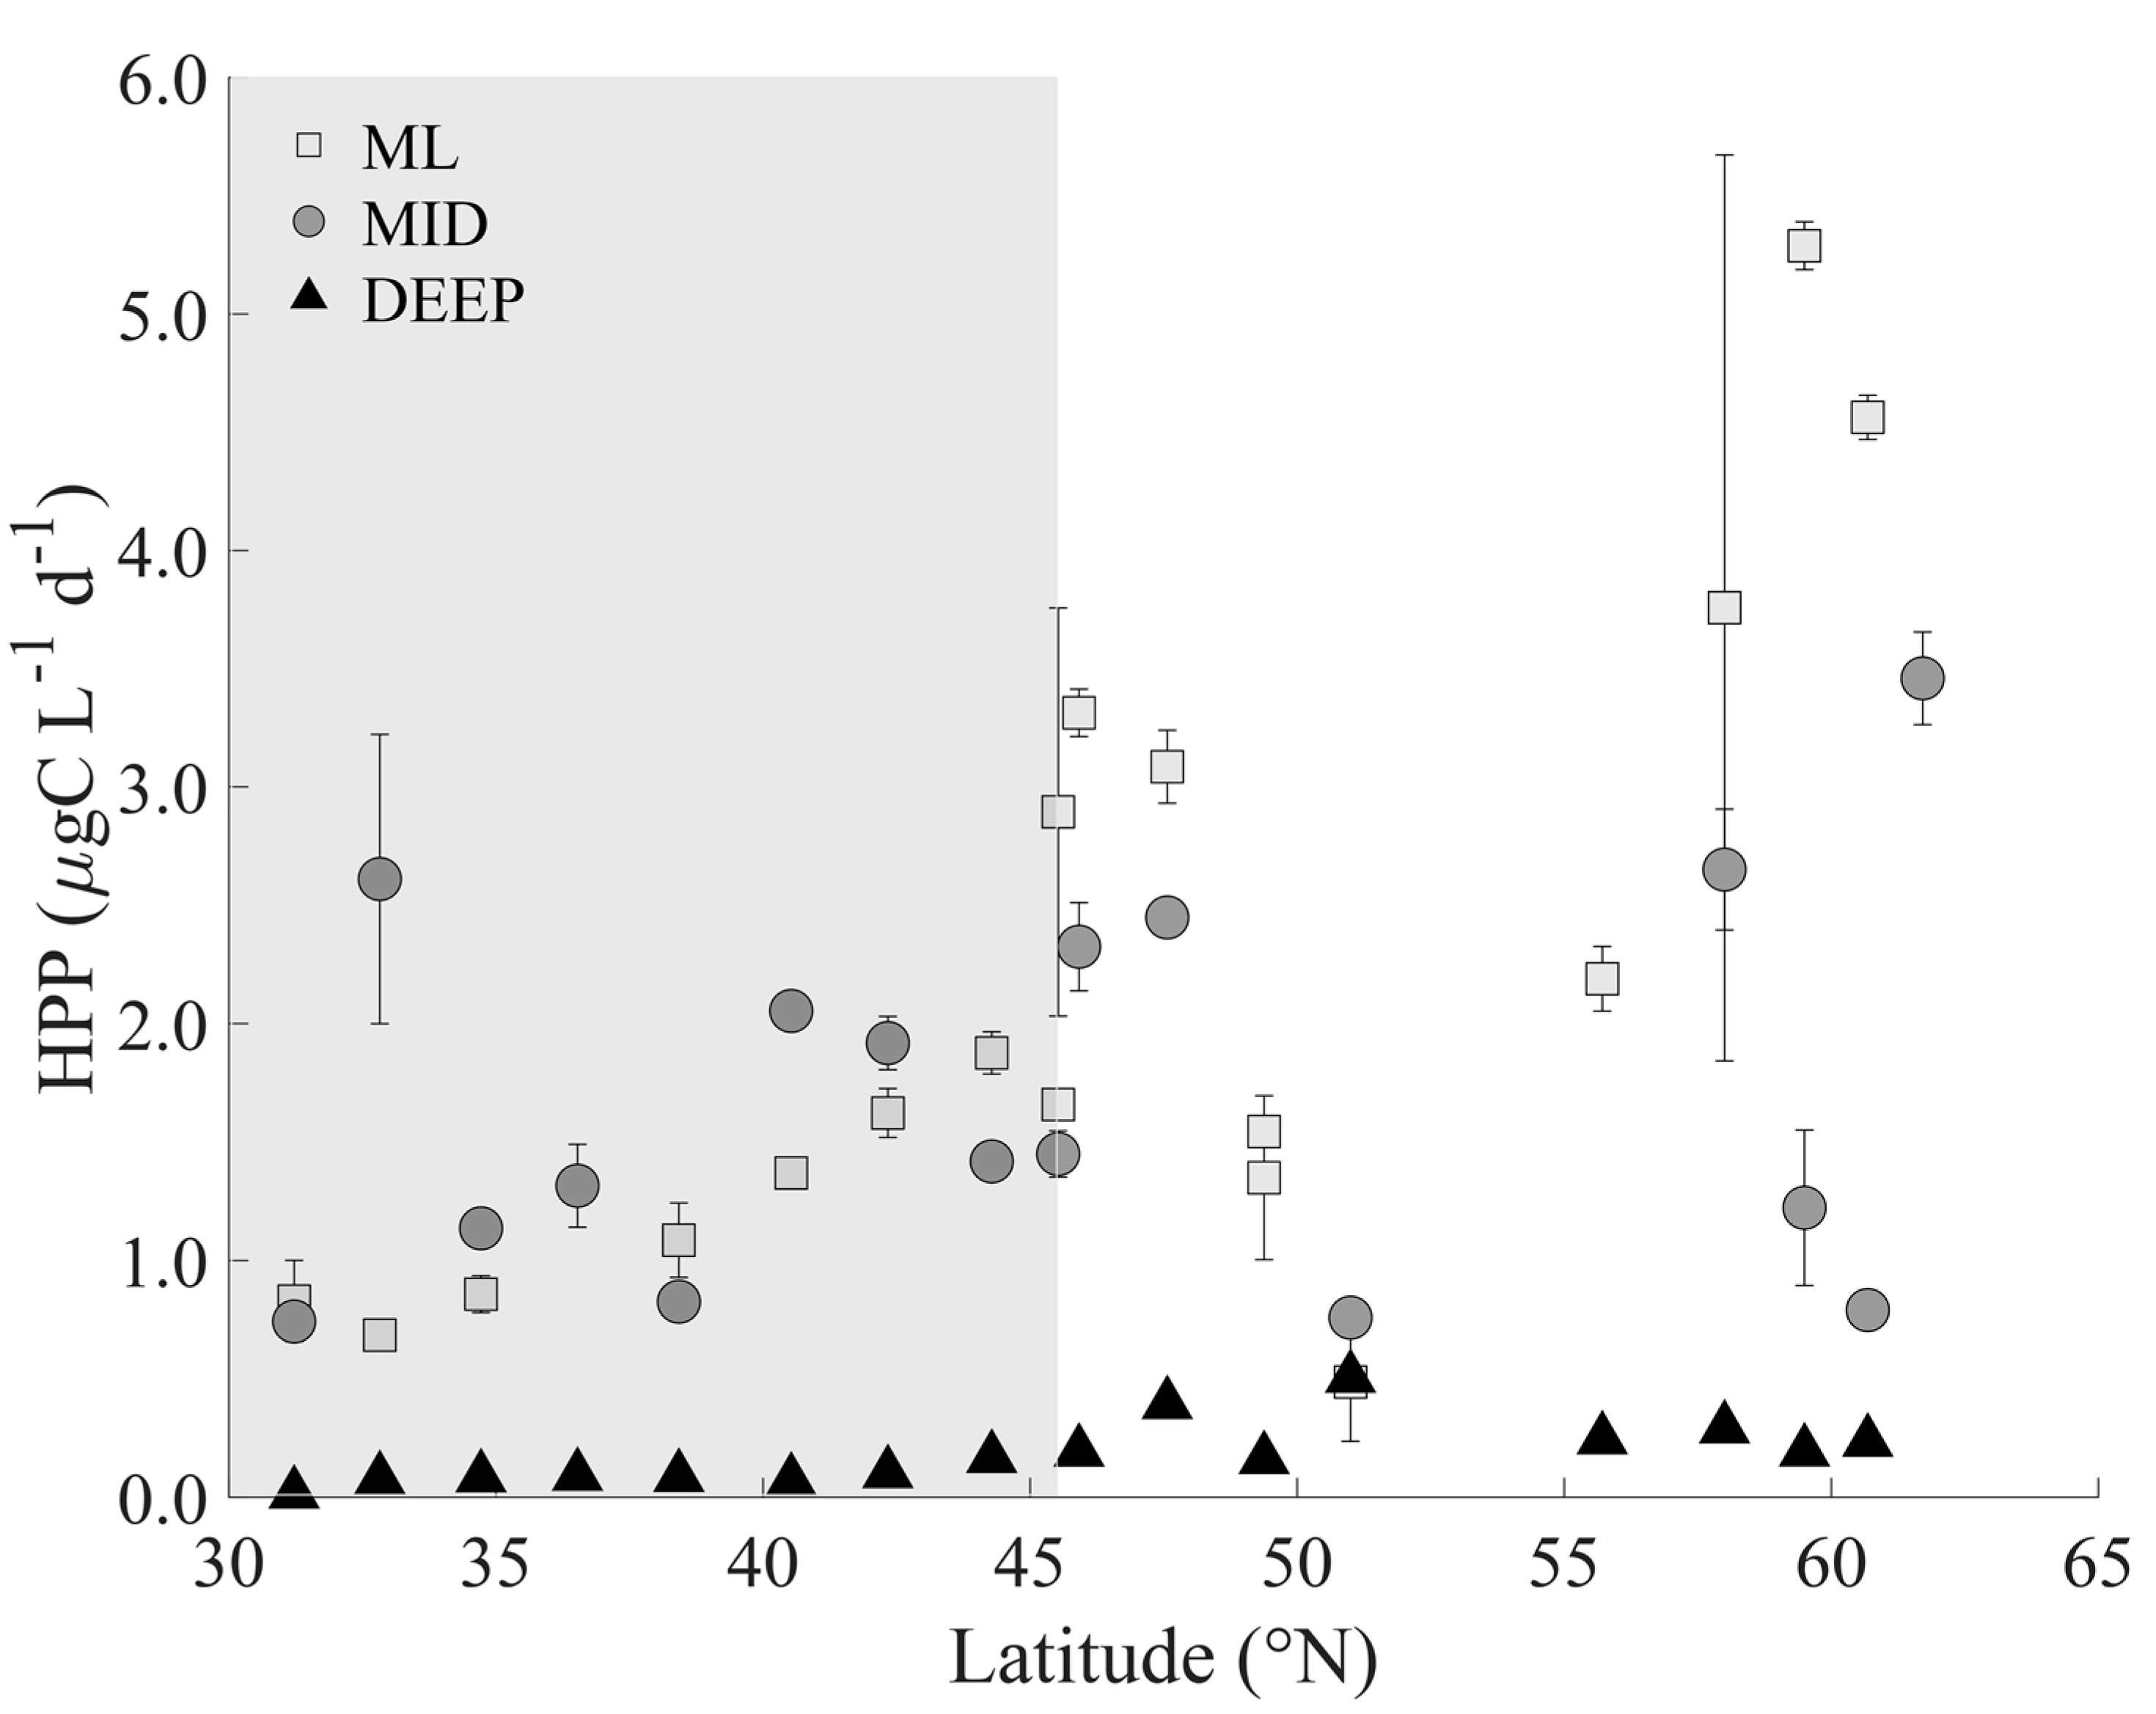
3.2. Heterotrophic Prokaryotes
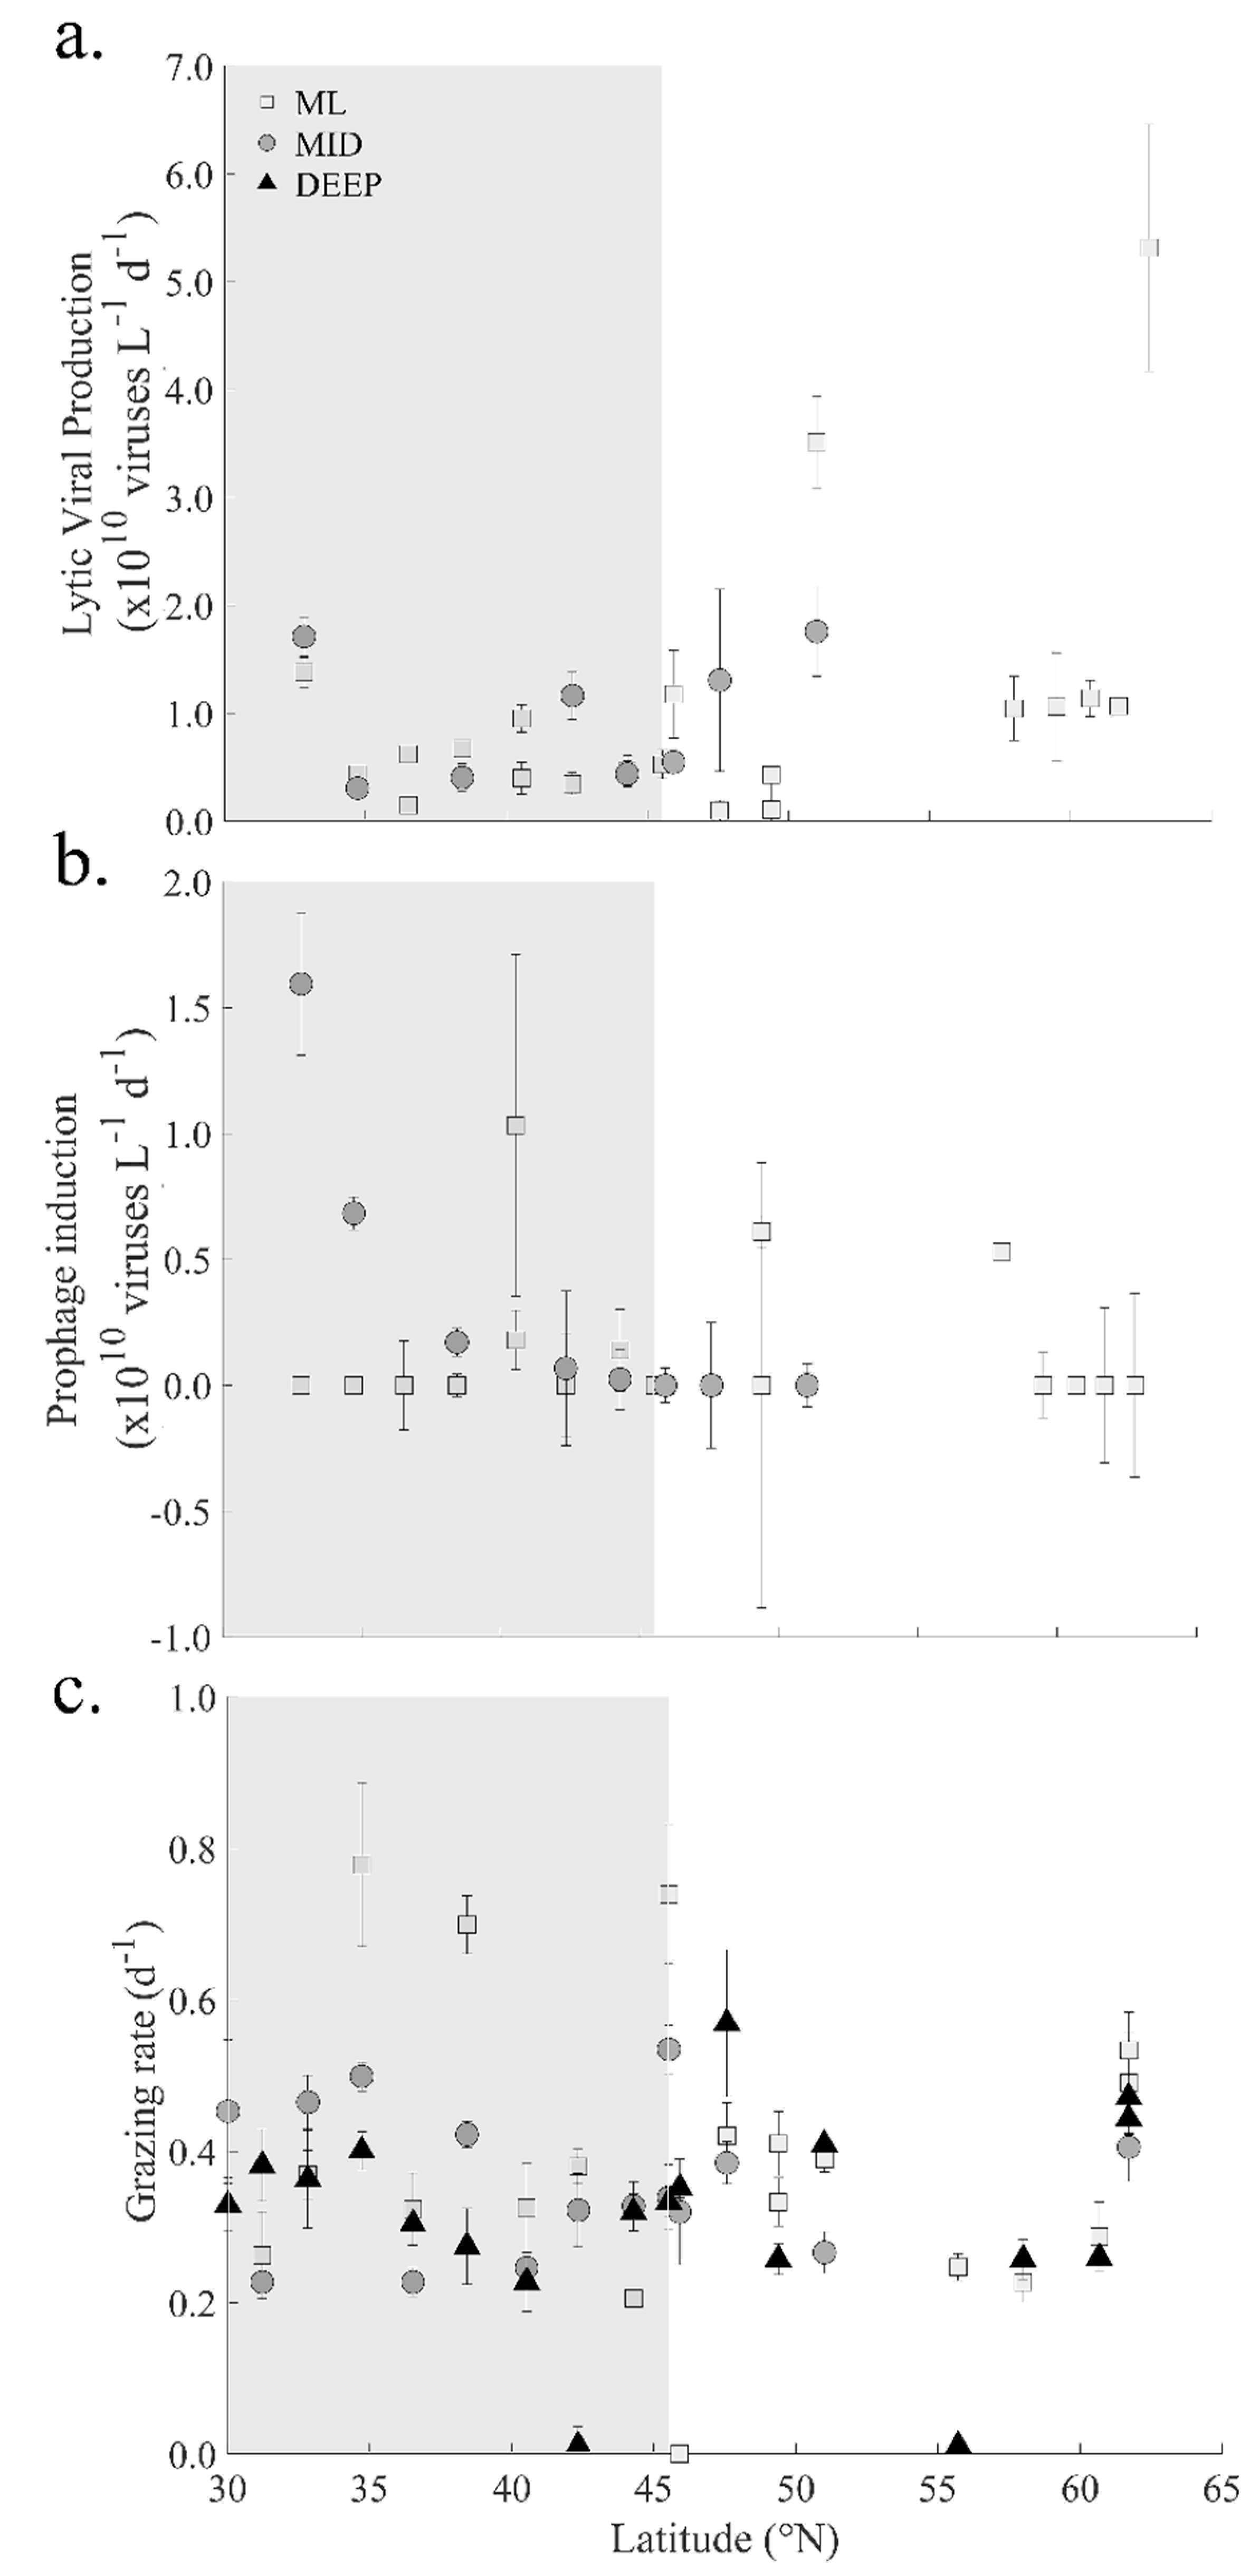
3.3. Viruses
3.4. Heterotrophic Protists
3.5. Heterotrophic Prokaryote Mortality
4. Discussion
4.1. Heterotrophic Prokaryote Abundance and Activity
4.2. Viral Mediated Mortality of Heterotrophic Prokaryotes
4.3. Controls on Grazing Mortality
4.4. Ecosystem Dynamics
Supplementary Materials
Author Contributions
Funding
Acknowledgments
Conflicts of Interest
References
- Zubkov, M.V.; Fuchs, B.M.; Burkill, P.H.; Amann, R. Comparison of Cellular and Biomass Specific Activities of Dominant Bacterioplankton Groups in Stratified Waters of the Celtic Sea. Appl. Environ. Microbiol. 2001, 67, 5210–5218. [Google Scholar] [CrossRef] [PubMed]
- Gasol, J.M.; Del Giorgio, P.A. Using flow cytometry for counting natural planktonic bacteria and understanding the structure of planktonic bacterial communities. Sci. Mar. 2000, 64, 197–224. [Google Scholar] [CrossRef]
- Button, D.K.; Robertson, B.R. Determination of DNA Content of Aquatic Bacteria by Flow Cytometry. Appl. Environ. Microbiol. 2001, 67, 1636–1645. [Google Scholar] [CrossRef] [PubMed]
- Bouvier, T.; Del Giorgio, P.A.; Gasol, J.M. A comparative study of the cytometric characteristics of High and Low nucleic-acid bacterioplankton cells from different aquatic ecosystems. Environ. Microbiol. 2007, 9, 2050–2066. [Google Scholar] [CrossRef]
- Proctor, C.R.; Besmer, M.D.; Langenegger, T.; Beck, K.; Walser, J.-C.; Ackermann, M.; Bürgmann, H.; Hammes, F. Phylogenetic clustering of small low nucleic acid-content bacteria across diverse freshwater ecosystems. ISME J. 2018, 12, 1344–1359. [Google Scholar] [CrossRef]
- Van Wambeke, F.; Català, P.; Pujo-Pay, M.; LeBaron, P. Vertical and longitudinal gradients in HNA-LNA cell abundances and cytometric characteristics in the Mediterranean Sea. Biogeosciences 2011, 8, 1853–1863. [Google Scholar] [CrossRef]
- Nishimura, Y.; Kim, C.; Nagata, T. Vertical and Seasonal Variations of Bacterioplankton Subgroups with Different Nucleic Acid Contents: Possible Regulation by Phosphorus. Appl. Environ. Microbiol. 2005, 71, 5828–5836. [Google Scholar] [CrossRef]
- Andrade, L.; Gonzalez, A.M.; Rezende, C.E.; Suzuki, M.; Valentin, J.L.; Paranhos, R. Distribution of HNA and LNA bacterial groups in the Southwest Atlantic Ocean. Braz. J. Microbiol. 2007, 38, 330–336. [Google Scholar] [CrossRef]
- Gasol, J.M.; Zweifel, U.L.; Peters, F.; Fuhrman, J.A.; Hagström, A. Significance of Size and Nucleic Acid Content Heterogeneity as Measured by Flow Cytometry in Natural Planktonic Bacteria. Appl. Environ. Microbiol. 1999, 65, 4475–4483. [Google Scholar] [CrossRef]
- LeBaron, P.; Servais, P.; Agogué, H.; Courties, C.; Joux, F. Does the High Nucleic Acid Content of Individual Bacterial Cells Allow Us To Discriminate between Active Cells and Inactive Cells in Aquatic Systems? Appl. Environ. Microbiol. 2001, 67, 1775–1782. [Google Scholar] [CrossRef]
- LeBaron, P.; Servais, P.; Baudoux, A.C.; Bourrain, M.; Courties, C.; Parthuisot, N. Variations of bacterial-specific activity with cell size and nucleic acid content assessed by flow cytometry. Aquat. Microb. Ecol. 2002, 28, 131–140. [Google Scholar] [CrossRef]
- Longnecker, K.; Sherr, B.F.; Sherr, E.B. Activity and Phylogenetic Diversity of Bacterial Cells with High and Low Nucleic Acid Content and Electron Transport System Activity in an Upwelling Ecosystem. Appl. Environ. Microbiol. 2005, 71, 7737–7749. [Google Scholar] [CrossRef] [PubMed]
- Jochem, F.J.; Lavrentyev, P.J.; First, M.R. Growth and grazing rates of bacteria groups with different apparent DNA content in the Gulf of Mexico. Mar. Biol. 2004, 145, 1213–1225. [Google Scholar] [CrossRef]
- Duarte, C.M.; Agustí, S.; Vaqué, D.; Agawin, N.S.R.; Felipe, J.; Casamayor, E.O.; Gasol, J.M. Experimental test of bacteria-phytoplankton coupling in the Southern Ocean. Limnol. Oceanogr. 2005, 50, 1844–1854. [Google Scholar] [CrossRef]
- Pernthaler, J. Predation on prokaryotes in the water column and its ecological implications. Nat. Rev. Microbiol. 2005, 3, 537–546. [Google Scholar] [CrossRef] [PubMed]
- Weinbauer, M.G.; Rassoulzadegan, F. Are viruses driving microbial diversification and diversity? Environ. Microbiol. 2004, 6, 1–11. [Google Scholar] [CrossRef]
- Wilhelm, S.W.; Suttle, C.A. Viruses and nutrient cycles in the sea—Viruses play critical roles in the structure and function of aquatic food webs. Bioscience 1999, 49, 781–788. [Google Scholar] [CrossRef]
- Fuhrman, J.A.; Noble, R.T. Viruses and protists cause similar bacterial mortality in coastal seawater. Limnol. Oceanogr. 1995, 40, 1236–1242. [Google Scholar] [CrossRef]
- Middelboe, M.; Jørgensen, N.O.G. Viral lysis of bacteria: An important source of dissolved amino acids and cell wall compounds. J. Mar. Biol. Assoc. U. K. 2006, 86, 605–612. [Google Scholar] [CrossRef]
- Sheik, A.R.; Brussaard, C.P.D.; Lavik, G.; Lam, P.; Musat, N.; Krupke, A.; Littmann, S.; Strous, M.; Kuypers, M.M.M. Responses of the coastal bacterial community to viral infection of the algae Phaeocystis globosa. ISME J. 2014, 8, 212–225. [Google Scholar] [CrossRef] [PubMed]
- Lønborg, C.; Middelboe, M.; Brussaard, C.P.D. Viral lysis of Micromonas pusilla: Impacts on dissolved organic matter production and composition. Biogeochemistry 2013, 116, 231–240. [Google Scholar] [CrossRef]
- Hahn, M.W.; Hofle, M.G. Grazing of protozoa and its effect on populations of aquatic bacteria. FEMS Microbiol. Ecol. 2001, 35, 113–121. [Google Scholar] [CrossRef]
- Hahn, M.W.; Hofle, M.G. Predation as a shaping force for the phenotypic and genotypic composition of planktonic bacteria. Antonie Van Leeuwenhoek 2002, 81, 413–434. [Google Scholar] [CrossRef]
- Gonzalez, J.M.; Sherr, E.B.; Sherr, B.F. Size-selective grazing on bacteria by natural assemblages of estuarine flagellates and ciliates. Appl. Environ. Microbiol. 1990, 56, 583–589. [Google Scholar] [CrossRef] [PubMed]
- Thingstad, T.F. Elements of a theory for the mechanisms controlling abundance, diversity, and biogeochemical role of lytic bacterial viruses in aquatic systems. Limnol. Oceanogr. 2000, 45, 1320–1328. [Google Scholar] [CrossRef]
- Winter, C.; Smit, A.; Herndl, G.J.; Weinbauer, M.G. Impact of Virioplankton on Archaeal and Bacterial Community Richness as Assessed in Seawater Batch Cultures. Appl. Environ. Microbiol. 2004, 70, 804–813. [Google Scholar] [CrossRef] [PubMed]
- Gasol, J.M.; Del Giorgio, P.A.; Massana, R.; Duarte, C.M. Active versus inactive bacteria:size-dependence in a coastal marine plankton community. Mar. Ecol. Prog. Ser. 1995, 128, 91–97. [Google Scholar] [CrossRef]
- Jürgens, K.; Güde, H. The potential importance of grazing-resistant bacteria in planktonic systems. Mar. Ecol. Prog. Ser. 1994, 112, 169–188. [Google Scholar] [CrossRef]
- Bouvier, T.; Maurice, C.F. A Single-Cell Analysis of Virioplankton Adsorption, Infection, and Intracellular Abundance in Different Bacterioplankton Physiologic Categories. Microb. Ecol. 2011, 62, 669–678. [Google Scholar] [CrossRef]
- Mojica, K.D.A.; Carlson, C.A.; Behrenfeld, M.J. Regulation of Low and High Nucleic Acid Fluorescent Heterotrophic Prokaryote Subpopulations and Links to Viral-Induced Mortality within Natural Prokaryote-Virus Communities. Microb. Ecol. 2020, 79, 213–230. [Google Scholar] [CrossRef]
- Mojica, K.D.A.; Van De Poll, W.H.; Kehoe, M.; Huisman, J.; Timmermans, K.R.; Buma, A.G.J.; Van Der Woerd, H.J.; Hahn-Woernle, L.; Dijkstra, H.A.; Brussaard, C.P.D. Phytoplankton community structure in relation to vertical stratification along a north-south gradient in the Northeast Atlantic Ocean. Limnol. Oceanogr. 2015, 60, 1498–1521. [Google Scholar] [CrossRef]
- Sherr, B.F.; Sherr, E.B.; Rassoulzadegan, F. Rates of Digestion of Bacteria by Marine Phagotrophic Protozoa: Temperature Dependence. Appl. Environ. Microbiol. 1988, 54, 1091–1095. [Google Scholar] [CrossRef] [PubMed]
- Rose, J.M.; Vora, N.M.; Countway, P.D.; Gast, R.J.; Caron, D.A. Effects of temperature on growth rate and gross growth efficiency of an Antarctic bacterivorous protist. ISME J. 2009, 3, 252–260. [Google Scholar] [CrossRef] [PubMed]
- Delaney, M.P. Effects of Temperature and Turbulence on the Predator–Prey Interactions between a Heterotrophic Flagellate and a Marine Bacterium. Microb. Ecol. 2003, 45, 218–225. [Google Scholar] [CrossRef]
- Shimeta, J.; Jumars, P.A.; Lessard, E.J. Influences of turbulence on suspension feeding by planktonic protozoa; experiments in laminar shear fields. Limnol. Oceanogr. 1995, 40, 845–859. [Google Scholar] [CrossRef]
- Dolan, J.R.; Sall, N.; Metcalfe, A.; Gasser, B. Effects of turbulence on the feeding and growth of a marine oligotrich ciliate. Aquat. Microb. Ecol. 2003, 31, 183–192. [Google Scholar] [CrossRef]
- Jurado, E.; Van Der Woerd, H.J.; Dijkstra, H.A. Microstructure measurements along a quasi-meridional transect in the northeastern Atlantic Ocean. J. Geophys. Res. 2012, 117, C04016. [Google Scholar] [CrossRef]
- Van De Poll, W.H.; Kulk, G.; Timmermans, K.R.; Brussaard, C.P.D.; Van Der Woerd, H.J.; Kehoe, M.J.; Mojica, K.D.A.; Visser, R.J.W.; Rozema, P.D.; Buma, A.G.J. Phytoplankton chlorophyll a biomass, composition, and productivity along a temperature and stratification gradient in the northeast Atlantic Ocean. Biogeosciences 2013, 10, 4227–4240. [Google Scholar] [CrossRef]
- Marie, D.; Brussaard, C.P.D.; Thyrhaug, R.; Bratbak, G.; Vaulot, D. Enumeration of Marine Viruses in Culture and Natural Samples by Flow Cytometry. Appl. Environ. Microbiol. 1999, 65, 45–52. [Google Scholar] [CrossRef]
- Mojica, K.D.A.; Evans, C.; Brussaard, C.P.D. Flow cytometric enumeration of marine viral populations at low abundances. Aquat. Microb. Ecol. 2014, 71, 203–209. [Google Scholar] [CrossRef]
- Vaulot, D. CYTOPC: Processing software for flow cytometric data. Signal Noise 1989, 2, 8. [Google Scholar]
- Mojica, K.D.A.; Huisman, J.; Wilhelm, S.W.; Brussaard, C.P.D. Latitudinal variation in virus-induced mortality of phytoplankton across the North Atlantic Ocean. ISME J. 2016, 10, 500–513. [Google Scholar] [CrossRef] [PubMed]
- Simon, M.; Azam, F. Protein content and protein synthesis rates of planktonic marine bacteria. Mar. Ecol. Prog. Ser. 1989, 51, 201–213. [Google Scholar] [CrossRef]
- Fukuda, R.; Ogawa, H.; Nagata, T.; Koike, I. Direct Determination of Carbon and Nitrogen Contents of Natural Bacterial Assemblages in Marine Environments. Appl. Environ. Microbiol. 1998, 64, 3352–3358. [Google Scholar] [CrossRef] [PubMed]
- Winget, D.M.; Williamson, K.E.; Helton, R.R.; Wommack, K.E. Tangential flow diafiltration: An improved technique for estimation of virioplankton production. Aquat. Microb. Ecol. 2005, 41, 221–232. [Google Scholar] [CrossRef][Green Version]
- Parada, V.; Herndl, G.J.; Weinbauer, M.G. Viral burst size of heterotrophic prokaryotes in aquatic systems. J. Mar. Biol. Assoc. U. K. 2006, 86, 613–621. [Google Scholar] [CrossRef]
- Sherr, B.F.; Sherr, E.B.; Fallon, R.D. Use of Monodispersed, Fluorescently Labeled Bacteria to Estimate In Situ Protozoan Bacterivory †. Appl. Environ. Microbiol. 1987, 53, 958–965. [Google Scholar] [CrossRef]
- R Core Team. R: A Language and Environment for Statistical Computing; R Foundation for Statistical Computing: Vienna, Austria, 2018. [Google Scholar]
- Oksanen, J.; Blanchet, F.G.; Kindt, R.; Legendre, P.; Minchin, P.R.; O’Hara, R.B.; Simpson, G.L.; Solymos, P.; Stevens, M.H.H.; Wagner, H. Vegan: Community Ecology Package, R Package Version 2.5-6. 2019. Available online: https://cran.r-project.org/web/packages/vegan/index.html (accessed on 12 November 2020).
- Zuur, A.F.; Ieno, E.N.; Elphick, C.S. A protocol for data exploration to avoid common statistical problems. Methods Ecol. Evol. 2010, 1, 3–14. [Google Scholar] [CrossRef]
- Zuur, A.; Ieno, E.N.; Walker, N.; Saveliev, A.A.; Smith, G.M. Mixed Effects Models and Extensions in Ecology with R; Springer: New York, NY, USA, 2009. [Google Scholar]
- Polovina, J.J.; Howell, E.A.; Abecassis, M. Ocean’s least productive waters are expanding. Geophys. Res. Lett. 2008, 35, L03618. [Google Scholar] [CrossRef]
- Longhurst, A.R. Ecological Geography of the Sea; Academic Press: London, UK, 2007. [Google Scholar]
- Cole, J.J.; Findlay, S.; Pace, M.L. Bacterial production in fresh and saltwater ecosystems: A cross-system overview. Mar. Ecol. Prog. Ser. 1988, 43, 1–10. [Google Scholar] [CrossRef]
- White, P.A.; Kalff, J.; Rasmussen, J.B.; Gasol, J.M. The effect of temperature and algal biomass on bacterial production and specific growth rate in freshwater and marine habitats. Microb. Ecol. 1991, 21, 99–118. [Google Scholar] [CrossRef] [PubMed]
- Gasol, J.M.; Duarte, C.M. Comparative analyses in aquatic microbial ecology: How far do they go? FEMS Microbiol. Ecol. 2000, 31, 99–106. [Google Scholar] [CrossRef] [PubMed]
- Church, M.J.; Hutchins, D.A.; Ducklow, H.W. Limitation of Bacterial Growth by Dissolved Organic Matter and Iron in the Southern Ocean. Appl. Environ. Microbiol. 2000, 66, 455–466. [Google Scholar] [CrossRef] [PubMed]
- Carlson, C.A.; Ducklow, H.W. Growth of bacterioplankton and consumption of dissolved organic carbon in the Sargasso Sea. Aquat. Microb. Ecol. 1996, 10, 69–85. [Google Scholar] [CrossRef]
- Kirchman, D.L. Limitation of bacterial growth by dissolved organic matter in the subarctic Pacific. Mar. Ecol. Prog. Ser. 1990, 62, 47–54. [Google Scholar] [CrossRef]
- Servais, P.; Casamayor, E.O.; Courties, C.; Catala, P.; Parthuisot, N.; LeBaron, P. Activity and diversity of bacterial cells with high and low nucleic acid content. Aquat. Microb. Ecol. 2003, 33, 41–51. [Google Scholar] [CrossRef]
- Longnecker, K.; Sherr, B.F.; Sherr, E.B. Variation in cell-specific rates of leucine and thymidine incorporation by marine bacteria with high and with low nucleic acid content off the Oregon coast. Aquat. Microb. Ecol. 2006, 43, 113–125. [Google Scholar] [CrossRef]
- Talarmin, A.; Van Wambeke, F.; Català, P.; Courties, C.; LeBaron, P. Flow cytometric assessment of specific leucine incorporation in the open Mediterranean. Biogeosciences 2011, 8, 253–265. [Google Scholar] [CrossRef]
- Bowman, J.S.; Amaral-Zettler, L.A.; Rich, J.J.; Luria, C.M.; Ducklow, H.W. Bacterial community segmentation facilitates the prediction of ecosystem function along the coast of the western Antarctic Peninsula. ISME J. 2017, 11, 1460–1471. [Google Scholar] [CrossRef]
- Al-Otaibi, N.; Huete-Stauffer, T.M.; Calleja, M.L.; Irigoien, X.; Morán, X.A.G. Seasonal variability and vertical distribution of autotrophic and heterotrophic picoplankton in the Central Red Sea. PeerJ 2020, 8, e8612. [Google Scholar] [CrossRef]
- Kujawinski, E.B.; Longnecker, K.; Barott, K.L.; Weber, R.J.M.; Soule, M.C.K. Microbial Community Structure Affects Marine Dissolved Organic Matter Composition. Front. Mar. Sci. 2016, 3, 3. [Google Scholar] [CrossRef]
- Strom, S.L.; Benner, R.; Ziegler, S.; Dagg, M.J. Planktonic grazers are a potentially important source of marine dissolved organic carbon. Limnol. Oceanogr. 1997, 42, 1364–1374. [Google Scholar] [CrossRef]
- Brussaard, C.P.D.; Mari, X.; Van Bleijswijk, J.D.L.; Veldhuis, M.J.W. A mesocosm study of Phaeocystis globosa (Prymnesiophyceae) population dynamics II. Significance for the microbial community. Harmful Algae 2005, 4, 875–893. [Google Scholar] [CrossRef]
- Schattenhofer, M.; Wulf, J.; Kostadinov, I.; Glöckner, F.O.; Zubkov, M.V.; Fuchs, B.M. Phylogenetic characterisation of picoplanktonic populations with high and low nucleic acid content in the North Atlantic Ocean. Syst. Appl. Microbiol. 2011, 34, 470–475. [Google Scholar] [CrossRef] [PubMed]
- Spring, S.; Scheuner, C.; Goker, M.; Klenk, H.P. A taxonomic framework for emerging groups of ecologically important marine gammaproteobacteria based on the reconstruction of evolutionary relationships using genome-scale data. Front. Microbiol. 2015, 6, 281. [Google Scholar] [CrossRef]
- Liu, S.; Liu, Z. Distinct capabilities of different Gammaproteobacterial strains on utilizing small peptides in seawater. Sci. Rep. 2020, 10, 1–11. [Google Scholar] [CrossRef]
- Cottrell, M.T.; Kirchman, D.L. Natural Assemblages of Marine Proteobacteria and Members of the Cytophaga-Flavobacter Cluster Consuming Low- and High-Molecular-Weight Dissolved Organic Matter. Appl. Environ. Microbiol. 2000, 66, 1692–1697. [Google Scholar] [CrossRef]
- Moran, X.A.G.; Alonso-Saez, L.; Nogueira, E.; Ducklow, H.W.; Gonzalez, N.; Lopez-Urrutia, A.; Diaz-Perez, L.; Calvo-Diaz, A.; Arandia-Gorostidi, N.; Huete-Stauffer, T.M. More, smaller bacteria in response to ocean’s warming? Proc. R. Soc. B Biol. Sci. 2015, 282, 20150371. [Google Scholar] [CrossRef]
- De Corte, D.; Sintes, E.; Winter, C.; Yokokawa, T.; Reinthaler, T.; Herndl, G.J. Links between viral and prokaryotic communities throughout the water column in the (sub)tropical Atlantic Ocean. ISME J. 2010, 4, 1431–1442. [Google Scholar] [CrossRef]
- De Corte, D.; Sintes, E.; Yokokawa, T.; Reinthaler, T.; Herndl, G.J. Links between viruses and prokaryotes throughout the water column along a North Atlantic latitudinal transect. ISME J. 2012, 6, 1566–1577. [Google Scholar] [CrossRef]
- Lara, E.; Vaqué, D.; Sà, E.L.; Boras, J.A.; Gomes, A.; Borrull, E.; Díez-Vives, C.; Teira, E.; Pernice, M.C.; Garcia, F.C.; et al. Unveiling the role and life strategies of viruses from the surface to the dark ocean. Sci. Adv. 2017, 3, e1602565. [Google Scholar] [CrossRef] [PubMed]
- Williamson, S.J.; Houchin, L.A.; McDaniel, L.; Paul, J.H. Seasonal Variation in Lysogeny as Depicted by Prophage Induction in Tampa Bay, Florida. Appl. Environ. Microbiol. 2002, 68, 4307–4314. [Google Scholar] [CrossRef] [PubMed]
- Motegi, C.; Nagata, T. Enhancement of viral production by addition of nitrogen or nitrogen plus carbon in subtropical surface waters of the South Pacific. Aquat. Microb. Ecol. 2007, 48, 27–34. [Google Scholar] [CrossRef]
- Middelboe, M. Bacterial Growth Rate and Marine Virus–Host Dynamics. Microb. Ecol. 2000, 40, 114–124. [Google Scholar] [CrossRef]
- Evans, C.; Brandsma, J.; Pond, D.W.; Venables, H.J.; Meredith, M.P.; Witte, H.J.; Stammerjohn, S.; Wilson, W.H.; Clarke, A.; Brussaard, C.P.D. Drivers of interannual variability in virioplankton abundance at the coastal western Antarctic peninsula and the potential effects of climate change. Environ. Microbiol. 2017, 19, 740–755. [Google Scholar] [CrossRef]
- Sabbagh, E.I.; Huete-Stauffer, T.M.; Calleja, M.L.L.; Silva, L.; Viegas, M.; Morán, X.A.G. Weekly variations of viruses and heterotrophic nanoflagellates and their potential impact on bacterioplankton in shallow waters of the central Red Sea. FEMS Microbiol. Ecol. 2020, 96. [Google Scholar] [CrossRef]
- Payet, J.P.; Suttle, C.A. To kill or not to kill: The balance between lytic and lysogenic viral infection is driven by trophic status. Limnol. Oceanogr. 2013, 58, 465–474. [Google Scholar] [CrossRef]
- Weinbauer, M.G.; Brettar, I.; Höfle, M.G. Lysogeny and virus-induced mortality of bacterioplankton in surface, deep, and anoxic marine waters. Limnol. Oceanogr. 2003, 48, 1457–1465. [Google Scholar] [CrossRef]
- Bongiorni, L.; Magagnini, M.; Armeni, M.; Noble, R.; Danovaro, R. Viral Production, Decay Rates, and Life Strategies along a Trophic Gradient in the North Adriatic Sea. Appl. Environ. Microbiol. 2005, 71, 6644–6650. [Google Scholar] [CrossRef]
- Weinbauer, M.G.; Suttle, C.A. Lysogeny and prophage induction in coastal and offshore bacterial communities. Aquat. Microb. Ecol. 1999, 18, 217–225. [Google Scholar] [CrossRef]
- Wilcox, R.M.; Fuhrman, J.A. Bacterial viruses in coastal seawater: Lytic rather than lysogenic production. Mar. Ecol. Prog. Ser. 1994, 114, 35–45. [Google Scholar] [CrossRef]
- Mojica, K.D.A.; Brussaard, C.P.D. Factors affecting virus dynamics and microbial host-virus interactions in marine environments. FEMS Microbiol. Ecol. 2014, 89, 495–515. [Google Scholar] [CrossRef] [PubMed]
- Sanders, R.W.; Caron, D.A.; Berninger, U.-G. Relationships between bacteria and heterotrophic nanoplankton in marine and fresh waters: An inter-ecosystem comparison. Mar. Ecol. Prog. Ser. 1992, 86, 1–14. [Google Scholar] [CrossRef]
- Krstulovic, N.; Solic, M.; Marasovic, I. Relationship between bacteria, phytoplankton, and heterotrophic nanoflagellates along a trophic gradient. Helgolaender Meeresunters. 1998, 51, 433–443. [Google Scholar] [CrossRef]
- Tsai, A.Y.; Gong, G.-C.; Shiau, W. Viral lysis and nanoflagellate grazing on prokaryotes: Effects of short-term warming in a coastal subtropical marine system. Hydrobiologia 2015, 751, 43–54. [Google Scholar] [CrossRef]
- Sandaa, R.-A.; Pree, B.; Larsen, A.; Våge, S.; Töpper, B.; Töpper, J.P.; Thyrhaug, R.; Thingstad, T.F. The Response of Heterotrophic Prokaryote and Viral Communities to Labile Organic Carbon Inputs Is Controlled by the Predator Food Chain Structure. Viruses 2017, 9, 238. [Google Scholar] [CrossRef]
- Larsen, A.; Egge, J.K.; Nejstgaard, J.C.; Di Capua, I.; Thyrhaug, R.; Bratbak, G.; Thingstad, T.F. Contrasting response to nutrient manipulation in A rctic mesocosms are reproduced by a minimum microbial food web model. Limnol. Oceanogr. 2015, 60, 360–374. [Google Scholar] [CrossRef]
- Sherr, B.F.; Sherr, E.B.; Berman, T. Grazing, Growth, and Ammonium Excretion Rates of a Heterotrophic Microflagellate Fed with Four Species of Bacteria. Appl. Environ. Microbiol. 1983, 45, 1196–1201. [Google Scholar] [CrossRef]
- Dolan, J.R. Phosphorus and ammonia excretion by planktonic protists. Mar. Geol. 1997, 139, 109–122. [Google Scholar] [CrossRef]
- Vaqué, D.; Pace, M.L.; Findlay, S.E.G.; Lints, D. Fate of bacterial production in a heterotrophic ecosystem: Grazing by protists and metazoans in the Hudson Estuary. Mar. Ecol. Prog. Ser. 1992, 89, 155–163. [Google Scholar] [CrossRef]
- Sherr, E.B.; Sherr, B.F. High rates of consumption of bacteria by pelagic ciliates. Nature 1987, 325, 710–711. [Google Scholar] [CrossRef]
- Gasol, J.M. A framework for the assessment of top-down vs. bottom-up control of heterotrophic nanoflagellate abundance. Mar. Ecol. Prog. Ser. 1994, 113, 291–300. [Google Scholar] [CrossRef]
- Koton-Czarnecka, M.; Chróst, R.J. Protozoans prefer large and metabolically active bacteria. Pol. J. Environ. Stud. 2003, 12, 325–334. [Google Scholar]
- Sintes, E.; Del Giorgio, P.A. Feedbacks between protistan single-cell activity and bacterial physiological structure reinforce the predator/prey link in microbial foodwebs. Front. Microbiol. 2014, 5, 453. [Google Scholar] [CrossRef] [PubMed]
- Wear, E.K.; Carlson, C.A.; Windecker, L.A.; Brzezinski, M.A. Roles of diatom nutrient stress and species identity in determining the short- and long-term bioavailability of diatom exudates to bacterioplankton. Mar. Chem. 2015, 177, 335–348. [Google Scholar] [CrossRef]
- López-Sandoval, D.C.; Rodríguez-Ramos, T.; Cermeño, P.; Marañón, E. Exudation of organic carbon by marine phytoplankton: Dependence on taxon and cell size. Mar. Ecol. Prog. Ser. 2013, 477, 53–60. [Google Scholar] [CrossRef][Green Version]
- Obernosterer, I.; Herndl, G.J. Phytoplankton extracellular release and bacterial growth: Dependence on the inorganic n: P ratio. Mar. Ecol. Prog. Ser. 1995, 116, 247–257. [Google Scholar] [CrossRef]
- Fuhrman, J.A. Marine viruses and their biogeochemical and ecological effects. Nature 1999, 399, 541–548. [Google Scholar] [CrossRef]
- Suttle, C.A.; Chen, F. Mechanisms and Rates of Decay of Marine Viruses in Seawater. Appl. Environ. Microbiol. 1992, 58, 3721–3729. [Google Scholar] [CrossRef]
- Gonzalez, J.M.; Suttle, C.A. Grazing by marine nanoflagellates on viruses and virus-sized particles: Ingestion and digestion. Mar. Ecol. Prog. Ser. 1993, 94, 1–10. [Google Scholar] [CrossRef]
- Tsai, A.Y.; Gong, G.C.; Hung, J. Seasonal variations of viral- and nanoflagellate-mediated mortality of heterotrophic bacteria in the coastal ecosystem of subtropical Western Pacific. Biogeosci. Discuss. 2012, 9, 17235–17261. [Google Scholar] [CrossRef]
- Weinbauer, M.G.; Peduzzi, P. Significance of viruses versus heterotrophic nanoflagellates for controlling bacterial abundance in the Northern Adriatic Sea. J. Plankton. Res. 1995, 17, 1851–1856. [Google Scholar] [CrossRef]
- Wommack, K.E.; Colwell, R.R. Virioplankton: Viruses in Aquatic Ecosystems. Microbiol. Mol. Biol. Rev. 2000, 64, 69–114. [Google Scholar] [CrossRef] [PubMed]
- Vaqué, D.; Alonso-Sáez, L.; Arístegui, J.; Agustí, S.; Duarte, C.M.; Sala, M.M.; Vázquez-Domínguez, E.; Gasol, J.M. Bacterial production and losses to predators along an open ocean productivity gradient in the Subtropical North East Atlantic Ocean. J. Plankton Res. 2014, 36, 198–213. [Google Scholar] [CrossRef]
- Cuevas, L.A.; Daneri, G.; Jacob, B.; Montero, P. Microbial abundance and activity in the seasonal upwelling area off Concepciόn (~36° S), central Chili: A comparison of upwelling and non-upwelling conditions. Deep-Sea Res. II 2004, 51, 2427–2440. [Google Scholar] [CrossRef]
- Gasol, J.M.; Pedrós-Alió, C.; Vaqué, D. Regulation of bacterial assemblages in oligotrophic plankton systems: Results from experimental and empirical approaches. Antonie Van Leeuwenhoek 2002, 81, 435–452. [Google Scholar] [CrossRef]
- Paterson, J.S.; Nayar, S.; Mitchell, J.G.; Seuront, L. A local upwelling controls viral and microbial community structure in South Australian continental shelf waters. Estuar. Coast. Shelf Sci. 2012, 96, 197–208. [Google Scholar] [CrossRef]
- Boras, J.A.; Sala, M.M.; Baltar, F.; Aristegui, J.; Duarte, C.M.; Vaque, D. Effect of viruses and protists on bacteria in eddies of the Canary Current region (subtropical northeast Atlantic). Limnol. Oceanogr. 2010, 55, 885–898. [Google Scholar] [CrossRef]


| ML | MID | |||
|---|---|---|---|---|
| S | N | S | N | |
| VMM | 3.0 ± 1.8 | 5.4 ± 5.1 | 4.0 ± 3.1 | 6.0 ± 3.1 |
| PMM | 2.3 ± 0.9 | 4.9 ± 4.2 | 3.0 ± 1.1 | 2.6 ± 1.3 |
| TMM | 5.8 ± 1.9 | 9.8 ± 6.3 | 7.3 ± 4.0 | 8.0 ± 3.2 |
Publisher’s Note: MDPI stays neutral with regard to jurisdictional claims in published maps and institutional affiliations. |
© 2020 by the authors. Licensee MDPI, Basel, Switzerland. This article is an open access article distributed under the terms and conditions of the Creative Commons Attribution (CC BY) license (http://creativecommons.org/licenses/by/4.0/).
Share and Cite
Mojica, K.D.A.; Brussaard, C.P.D. Significance of Viral Activity for Regulating Heterotrophic Prokaryote Community Dynamics along a Meridional Gradient of Stratification in the Northeast Atlantic Ocean. Viruses 2020, 12, 1293. https://doi.org/10.3390/v12111293
Mojica KDA, Brussaard CPD. Significance of Viral Activity for Regulating Heterotrophic Prokaryote Community Dynamics along a Meridional Gradient of Stratification in the Northeast Atlantic Ocean. Viruses. 2020; 12(11):1293. https://doi.org/10.3390/v12111293
Chicago/Turabian StyleMojica, Kristina D. A., and Corina P. D. Brussaard. 2020. "Significance of Viral Activity for Regulating Heterotrophic Prokaryote Community Dynamics along a Meridional Gradient of Stratification in the Northeast Atlantic Ocean" Viruses 12, no. 11: 1293. https://doi.org/10.3390/v12111293
APA StyleMojica, K. D. A., & Brussaard, C. P. D. (2020). Significance of Viral Activity for Regulating Heterotrophic Prokaryote Community Dynamics along a Meridional Gradient of Stratification in the Northeast Atlantic Ocean. Viruses, 12(11), 1293. https://doi.org/10.3390/v12111293