Abstract
Hepatitis C virus (HCV) can be cleared naturally in a subset of individuals. However, the asymptomatic nature of acute HCV infection makes the study of the early immune response and defining the correlates of protection challenging. Despite this, there is now strong evidence implicating the humoral immune response, specifically neutralising antibodies, in determining the clearance or chronicity outcomes of primary HCV infection. In general, immunoglobulin G (IgG) plays the major role in viral neutralisation. However, there are limited investigations of anti-HCV envelope protein 2 (E2) isotypes (IgM, IgG, IgA) and IgG subclasses (IgG1–4) in early HCV infection. In this study, using a rare cohort of 14 very recently HCV-infected individuals (4–45 days) with varying disease outcome (n = 7 clearers), the timing and potency of anti-HCV E2 isotypes and IgG subclasses were examined longitudinally, in relation to neutralising antibody activity. Clearance was associated with anti-E2 IgG, specifically IgG1 and IgG3, and appeared essential to prevent the emergence of new HCV variants and the chronic infection outcome. Interestingly, these IgG responses were accompanied by IgM antibodies and were associated with neutralising antibody activity in the subjects who cleared infection. These findings provide novel insights into the early humoral immune response characteristics associated with HCV disease outcome.
1. Introduction
Hepatitis C virus (HCV) is a major cause of chronic liver disease globally [1,2]. It is predominantly transmitted via blood-to-blood contact associated with injecting drug use (IDU), via sharing of injecting equipment [3,4]. Following acute infection, approximately 75% of people fail to clear the virus, resulting in chronic hepatitis [5,6,7]. While direct-acting antiviral (DAAs) treatments are decreasing the number of people living with HCV, control remains challenging globally due to the limitations in health infrastructure and high drug cost for treatment of the marginalised population affected, in addition to high rates of re-infection [8,9,10,11,12,13]. As HCV can be cleared naturally in a subset of individuals (~25%), and as subsequent re-infections are characterised by higher clearance rates (up to ~80%), it is reasonable to hypothesise that a vaccine could be designed to elicit effective immune responses that confer protection [14,15].
As early HCV infection is predominantly asymptomatic, it is difficult to characterise the initial immune response that contributes to clearance of HCV. Despite this, recent evidence suggests that an early neutralising antibody (nAb) response targeting envelope (E) glycoproteins E1 and E2, which are responsible for entry into the host cells, may contribute to clearance of the virus [16,17,18,19]. Immunoglobulin G (IgG) is thought to play a major role in viral neutralisation [20,21,22,23]; however, anti-HCV envelope isotypes and IgG subclasses in early primary HCV infection were studied longitudinally in only limited case series [24,25]. Furthermore, previous studies were limited with the majority of assays performed on samples from subjects with ultimate chronic infection (termed here chronic progressors), and examined reactivity against the core and non-structural (NS) proteins [26,27,28,29,30,31,32,33,34]. The most informative single study performed to date suggested that the majority of HCV-specific antibodies directed against NS, core, and envelope proteins were in the IgG1 and IgG3 subclasses, with limited IgG2 and IgG4 detected [23]. HCV-specific IgG1 and IgG3 antibodies were found in both acute and chronic stages of infection, including both clearers and chronic progressors [23]. Additionally, HCV-specific IgA and IgM antibodies were found in both the acute and chronic stages of HCV infection, but were not found to be associated with clearance [26,29,34].
Understanding these associations is important for development of antibody-based vaccines, as varied antibody subclasses and isotypes were found to be important in controlling different viral infections. IgM was shown to be critical for protection against West Nile virus and human immunodeficiency virus (HIV) mucosal transmission [35,36], where the pentameric structure of IgM is proposed to have high avidity resulting in a slow or absent off rate [35,37]. IgM was also shown to have neutralising properties against chikungunya and influenza viruses [36,38,39] and an important role in early immune activation via its Fc portion [40]. Furthermore, an early neutralising IgM response is induced by the smallpox (vaccinia) vaccine, one of the most successful vaccines to date [38,41].
With regard to IgG, in primary HIV infection, IgG3 antibody responses rather than IgG1 responses are linked to nAb activity and a drop in viral load [22,42], with a positive correlation with IgG3 and IgG1 response patterns, over IgG2, IgG4, and IgA [43,44,45]. Results from the RV144 HIV vaccine trial performed in Thailand noted that subjects who developed IgG3 antibodies against the Env V1V2 regions had a reduced risk of infection [46,47]. IgG3 is a more flexible subclass, and it is hypothesised that this feature allows the antibody better access to the virus, resulting in superior neutralisation [22,42]. Additionally, samples from the same vaccine trial showed a higher anti-HIV envelope variable region (Env V1V2) IgG:IgA ratio correlated with a decreased risk of infection [43]. It was proposed that IgA may outcompete and block Fc-dependent protective functions of IgG-bound antibodies, such as antibody-dependent cell-mediated cytotoxicity (ADCC) responses [48].
Given this backdrop, it is possible in HCV infection that specific isotypes and subclasses with either nAb or non-nAb activity (i.e., Fc-dependent activities) directed against E1E2 could facilitate viral clearance [21,22]. Better understanding of the details of humoral immune-mediated protection is essential for successful vaccine design. We and others showed that early nAb responses against HCV were associated with clearance of primary infection [16,17,19]. In this study, we extended upon these findings and examined the isotype and subclass utilisation and the timing and potency of these responses, in relation to nAb activity, in a rare cohort of very recently infected individuals. The findings indicate that IgG, specifically IgG1 and IgG3, responses appear essential to prevent emergence of new HCV variants and the chronic infection outcome.
2. Materials and Methods
2.1. Subjects and Samples
Samples from a prospective cohort of 590 HCV seronegative, high-risk individuals enrolled in the Hepatitis C Incidence and Transmission Study (HITS) in prisons (HITS-p) or in a sister cohort in the general community (HITS-c) collected between 2005 and 2015 were used in this study [49,50,51]. Inmates were enrolled in 34 correctional centres across New South Wales, Australia. Blood samples were collected every six months to screen for seroconversion and for HCV RNA positivity; upon incident infection, subjects were sampled frequently for 24 weeks until infection outcome was resolved and antiviral treatment offered, and then three to six monthly thereafter. Early incident cases (n = 14), designated when a time point was available that was antibody-negative and HCV RNA-positive, were selected for this analysis. The date of infection was estimated by subtracting the average pre-seroconversion window period, which was estimated at 51 days [52,53,54,55], from the midpoint between the last seronegative and first seropositive time points. Details of the study protocol are reported elsewhere [12,49,50,51].
2.2. Ethics Statement
Ethical approvals were obtained from New South Wales Department of Corrective Services (reference number 05/0884), the University of New South Wales (reference numbers 05094, 08081), and Human Research Ethics Committees of Justice Health, (reference numbers GEN 31/05 and G304/11), 6 December 2011, all located in Sydney, Australia. Written informed consent was obtained from the participants. All methods were performed in accordance with the ethical guidelines of the 1975 Declaration of Helsinki.
2.3. Virologic Assessments
All sera were tested for HCV antibodies using the Abbott ARCHITECT anti-HCV chemiluminescent microparticle immunoassay (Abbott Diagnostics, Chicago, IL, USA). HCV RNA detection was performed using either the VERSANT HCV RNA Qualitative Transcription Mediated Amplification (TMA) assay (Bayer Diagnostics, Emeryville, CA, USA; lower limit of detection: 3200 copies/mL) for samples collected prior to July 2008, or the COBAS AmpliPrep/COBAS TaqMan HCV assay (Roche, Basel, Switzerland; lower limit of detection 223 genome copies/mL) for samples from August 2008 onward [56].
2.4. Construction and Expression of Recombinant E2
Recombinant E2 (rE2) protein was derived from HCV H77 genotype 1a (GenBank accession number AF011751) and HCV UNK3a.13.6 genotype 3a (GenBank accession number AY894683). E2 regions corresponding to HCV H77 genotype 1a isolate poly-protein amino acid residues 384 to 661, introduced into pcDNA3.1 expression vector (Life Technologies, Carlsbad, CA, USA) with a C-terminal Avitag and six-histidine epitope tag (6-His) [57,58] and codon-optimised, were purchased from GeneArt (Thermo Fisher Scientific, Waltham, MA, USA).
Transient transfection of expression plasmids was performed using 293-F cells (FreeStyle 293 HEKs, Thermo Fisher Scientific, Waltham, MA, USA) using DNA-293fectin reagent (Life technologies, Carlsbad, CA, USA) as per the manufacturer’s instructions. Media was harvested at approximately 96 h post transfection for purification. This supernatant was then passed through a 1-mL HiTrap Chelating HP chromatography column (Amersham, Buckinghamshire, UK) charged with 0.1 M NiSO4·6H2O and washed with 10 mL of binding buffer. Proteins were eluted from the column by passing through 50 mM imidazole in binding buffer. Elution fractions were pooled, and native PAGE, SDS-PAGE, and Western blotting were performed with the HCV-specific monoclonal antibody, CBH4G, as well as the AviTag antibody. Additionally, an ELISA was performed with nine previously characterised HCV monoclonal antibodies (mAbs) to confirm the conformation of the recombinant E2 (rE2) protein. These mAbs included AR1B, AR2A, AR3A, AR4A, and AR5A, sourced from A/Prof. Mansun Law (Scripps, La Jolla, CA, USA) [59], CBH4G and CBH7 antibodies purified from hybridomas purchased from the American Type Culture Collection (ATCC; Manassas, VA, USA, PTA-4468 and PTA-4470), and HCV84.26 and HCV-1 generated by transient transfection of plasmids provided by Prof. Heidi Drummer (Burnet Institute, Melbourne, Australia) as previously described [60].
2.5. Enzyme-Linked Immunoassays
Microtitre 96-well plates 96-well (Nunc Maxisorb, Thermo Fisher Scientific) were prepared with rE2 (H77 for genotype 1 and 2 infected subjects or UNK3a.13.6 for genotype 3 infected subjects) and incubated for one hour. Plates were washed three times with Tris-buffered saline with Tween (TBS-T) and then blocked for one hour with blocking buffer (5% non-fat dry milk in TBS-T). The bound rE2 was then incubated with plasma (heat inactivated by incubation at 56 °C for 30 min) at a final dilution of 1:10 for 1.5 h. The bound plasma was then incubated for one hour with anti-human IgG conjugated with horseradish peroxidase (HRP) (Jackson Immunoresearch, West Grove, PA, USA, 1:6000 for genotype 1a and 3a), anti-human IgA (α-chain-specific)–HRP (Sigma-Aldrich, St. Louis, MO, USA, 1:3000 for genotype 1a and 1:1500 for genotype 3a), anti-human IgM (μ-chain-specific)–HRP (Sigma-Aldrich, 1:3000 for genotype 1a and 1:1500 for genotype 3a), anti-human IgG1 Fc–HRP (SouthernBiotech, Birmingham, AL, USA, 1:6000 for genotype 1a and 1:1500 for genotype 3a), anti-human IgG2 Fc–HRP (SouthernBiotech, 1:6000 for genotype 1a and 1:1500 for genotype 3a), anti-human IgG3 hinge–HRP (SouthernBiotech, 1:6000 for genotype 1a and 3a), and anti-human IgG4 Fc–HRP (SouthernBiotech, 1:6000 for genotype 1a and 1:1500 for genotype 3a). The 3,3′,5,5′-tetramethylbenzidine (TMB) liquid substrate for ELISA (Sigma-Aldrich) was added to the plate and incubated for 15 min after absorbance was read at 450 nm. In order to define a true positive result, a cut-off value was calculated for each assay as the mean + 3 SD of signal/noise (S/N) values in plasma from 10 healthy donors; these were as follows: genotype 3a; 1.87 S/N for IgA, 1.39 S/N for IgG and 2.89 S/N for IgM, 1.54 S/N for IgG1, 1.54 S/N for IgG2, 1.33 S/N for IgG3, and 2.9 S/N for IgG4 and genotype 1a; 1.67 S/N for IgA, 1.68 S/N for IgG and 3.91 S/N for IgM, 1.19 S/N for IgG1, 1.17 S/N for IgG2, 1.74 S/N for IgG3, and 2.55 S/N for IgG4. Results were normalised and converted to S/N for analysis. The mAbs CBH-5 and CBH-7 were used as a positive control for IgG and IgG1, respectively. For the remaining subclasses and isotypes, serum samples that previously tested positive in comparable ELISAs were kindly supplied as positive controls (Dr Kim Wilson, National Reference Laboratory, Melbourne, Australia). Unless specified, all subclass and isotype assays were performed in intra-assay duplicates.
2.6. Statistical Analysis
All data analysis was performed and all graphs were created using GraphPad Prism Software (version 7.0, La Jolla, CA, USA) for Macintosh. Wilcoxon rank-sum tests, Kolmogorov–Smirnov tests and Mann–Whitney tests were used (where appropriate) to evaluate statistically significant differences between groups. Statistical significance was defined as a p-value less than 0.05.
For the analysis of temporal trends in relation to viraemia, the period during primary infection in which the HCV viral load consistently declined was designated here as at least two consecutive time points, immediately after the peak HCV viral load time point (occurring at <90 days post infection (DPI), as described previously [61,62]). To be included in this analysis, consecutive time points were required to decline by >0.076 log10 IU/mL when compared to the HCV viral load of the previous time point (corresponding with the intra-assay variability previously reported for the COBAS Taqman Assay [63,64]). All sequential time points that declined were included. The endpoint for inclusion in the analysis was an HCV RNA increase by >0.076 log10.
3. Results
3.1. Patient Description
Longitudinally collected samples from 14 newly viraemic, seronegative subjects were selected for this study. These 14 subjects were described extensively elsewhere [19]. In brief, the 14 subjects had a primary HCV infection with the most prevalent Australian strains, including genotypes 1a (n = 5), 1b (n = 3), 3a (n = 4), and 2b (n = 2) [13]. The estimated days post infection (DPI) of the initial infection time point ranged from four to 45 days (median 30). Of the 14 subjects, seven naturally cleared the primary infection, and seven developed chronic infection (Table 1).

Table 1.
Subject characteristics and time point analysis.
3.2. The Timing and Magnitude of Anti-E2 IgA and IgM Are Not Associated with Clearance, Whereas an Early Anti-E2 IgG Response Is
Anti-E2 IgM, IgG, and IgA responses were examined in the longitudinally collected sera to determine which isotype responses were being generated and whether these responses were associated with clearance or chronic infection outcomes.
In this study, five of seven chronic progressors had detectable anti-E2 IgM reactivity, whereas all seven clearers had detectable anti-E2 IgM, at any one time during infection (Figure 1). In 10 of the 12 subjects with anti-E2 IgM, responses persisted and were relatively stable throughout infection. In the two remaining subjects, IgM responses were transient. The timing and magnitude of anti-E2 IgM responses were assessed in the clearers and chronic progressors with a reactive response to determine whether anti-E2 IgM was associated with disease outcome (Figure 2). No significant differences were observed in relation to the timing of the first detectable anti-E2 IgM response (Mann–Whitney; p = 0.8409, clearer median 44 DPI (range 4–95) versus chronic median 30 DPI (range 2–440)), timing of the peak response (DPI) (Mann–Whitney; p = 0.6023, clearer median 100 DPI (range 44–888) versus chronic median 108 DPI (range 16–440)), and magnitude of the peak anti-E2 IgM response (Mann–Whitney; p > 0.9999, clearer median 6.41 S/N, (range 4.5–36) versus chronic median 9.85 S/N, (range 4.56–14.65)).
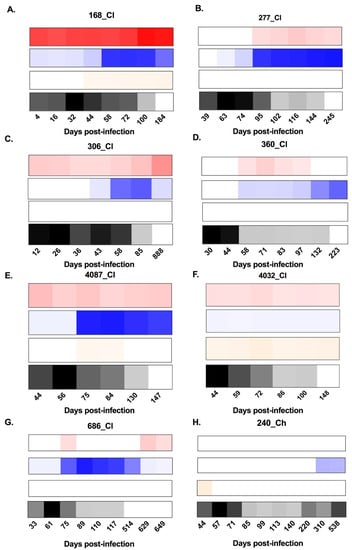
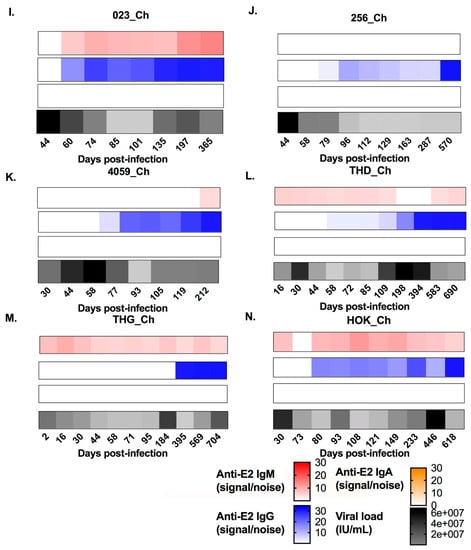
Figure 1.
Heat maps representing the longitudinal patterns of anti-hepatitis C virus (HCV) envelope protein 2 (E2)-antibody isotype utilisation (signal/noise) for anti-E2 immunoglobulin M (IgM), IgG, and IgA responses, as well as HCV RNA levels (IU/mL). Panels A–G show subjects who cleared the infection. Panels H–N show subjects who developed chronic hepatitis. IgM is represented in red, IgG is represented in blue, IgA is represented in orange, and longitudinal HCV RNA levels (IU/mL) are represented in black (see key). Days post infection (DPI) are indicated below each heat map. All results were generated in duplicate from longitudinal serum samples collected for each subject.
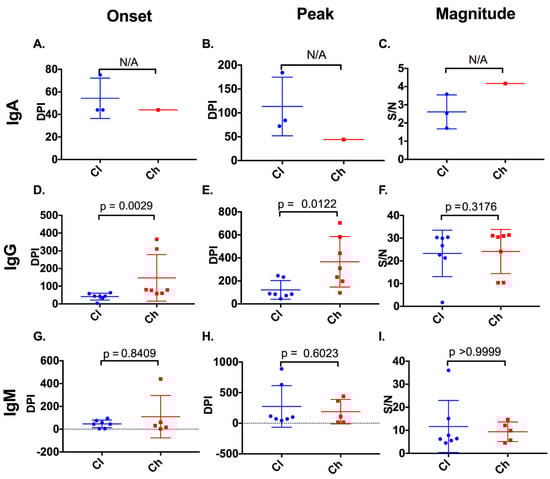
Figure 2.
Timing and magnitude of anti-E2 IgA, IgG, and IgM responses in clearer and chronic progressor subjects. The timing (days post infection (DPI)) and magnitude (signal/noise (SN)) of anti-E2 IgA, IgG, and IgM responses were assessed in clearers and chronic progressors for the first detectable anti-E2 IgA (A), IgG (D), and IgM (G) responses, the timing of the peak anti-E2 IgA (B), IgG (E), and IgM (H) responses, and the magnitude of the peak anti-E2 IgA (C), IgG (F), and IgM (I) responses. Statistical significance was not applicable (N/A) for anti-E2 IgA responses, because of a lack of reactive samples in chronic progressors.
Three of seven clearer subjects were found to have anti-E2 IgA responses, whereas only one of the seven chronic progressors was found to have anti-E2 IgA responses. In two of the subjects with anti-E2 IgA, responses were stable and persisted. In contrast, in the remaining two subjects, responses were transient (Figure 1). As only one chronic progressor had detectable anti-E2 IgA, the timing and magnitude of these responses were not compared statistically (Figure 2).
All seven clearers and all seven chronic progressors were found to have anti-E2 IgG responses. For the clearers, the anti-E2 IgG responses increased in magnitude up until ~100 DPI. Following this increase, levels were sustained for n = 3 subjects (277_Cl, 360_Cl, and 4032_Cl), whereas levels started to decrease concurrent with the loss of detectable virus in the plasma for the remaining n = 4 subjects (168_Cl, 306_Cl, 4087_Cl, and 686_Cl). This contrasted with the pattern observed in chronic progressors, where anti-E2 IgG levels increased over the course of infection, concordant with ongoing viraemia (Figure 1).
Clearers had an earlier anti-E2 IgG response (median of 44 DPI (range 5–74)) when compared to chronic progressors (median 80 DPI (range 58–365), Mann–Whitney; p = 0.0029). These dynamics were similar to those observed with nAb activity as recently published [19]. Additionally, clearers had an earlier peak anti-E2 IgG response (median 85 DPI (range 44–245)), when compared to chronic progressors (median of 310 DPI (range 96–704), Mann–Whitney; p = 0.0122) (Figure 2). However, no difference was observed in the magnitude of the response between clearers (median of 26.73 S/N (range 1.72–30.42)) and chronic progressors (median of 24.14 S/N (range 10.39–31.38), Mann–Whitney; p = 0.3176).
The timing of anti-E2 IgG responses was compared to the appearance of non-envelope antibody responses (i.e., anti-core, NS3 and NS5) measured using the Abbott ARCHITECT anti-HCV CIA assay. In clearers, anti-E2 IgG responses were detected before or in close proximity to development of responses against core and NS proteins (median of −15 days (range −54–0 days), Wilcoxon rank-sum test; p = 0.0625). In chronic progressors, anti-E2 IgG responses were often delayed until after the response to core and NS proteins (19 median days, range 0–307 days, Wilcoxon rank-sum test; p = 0.0625, Figure 3A). This time difference (seroconversion to core/NS (DPI)—appearance of anti-E2 IgG (DPI)) between clearers and chronic progressors was significant (p = 0.0035, Figure 3B).
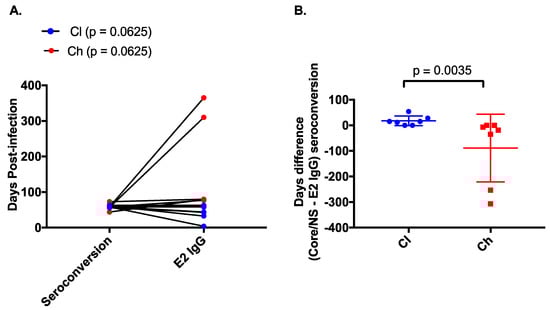
Figure 3.
Comparison of E2-specific IgG binding and non-E2 specific binding in clearer and chronic progressor subjects. The timing (days post infection) of anti-E2 specific IgG as measured by ELISA was compared to the timing of core/non-structural protein (NS) seroconversion as measured by the commercial Abbott assay (A) for clearers (blue) and chronic progressors (red). The difference in days between the appearance of anti-E2 IgG and anti-core/NS was compared between clearers (blue) and chronic progressors (red) (B).
3.3. An Early Anti-E2 IgG1 Response Is Associated with Clearance
The IgG subclass utilisation of the anti-E2 responses was examined to understand whether specific subclasses are utilised preferentially, as reported for HIV and other acute viral infections [21,65,66].
Four of seven chronic progressors had detectable anti-E2 IgG3 responses, in comparison to all seven clearers (Figure 4). Responses were transient in eight of the eleven subjects lasting a mean of 66 days (SD 56). Analysis of the timing and magnitude (Figure 5) of these responses revealed no significant differences between clearers and chronic progressors for timing of the first anti-E2 IgG3 responses (p = 0.3848, clearer median 58 DPI (range 12–75) versus chronic median 71.5 DPI (range 60–93)), timing of the peak of anti-E2 IgG3 responses (Mann–Whitney; p = 0.7879, clearer median 74 DPI (range 12–245) versus chronic median 88 DPI (range 60–583)), and magnitude of the peak anti-E2 IgG3 responses (Mann–Whitney; p = 0.6485, clearer median 2.89 S/N (range 1.51–25.41) versus chronic median 3.185 S/N (range 1.39–3.58)).
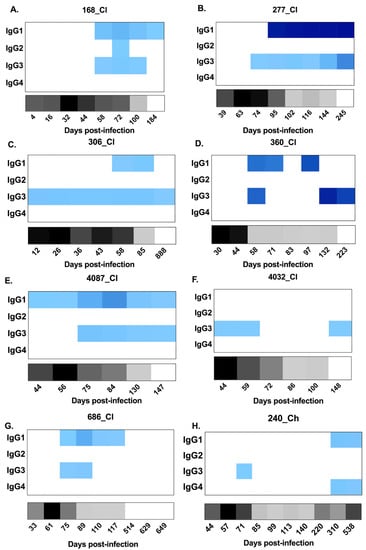
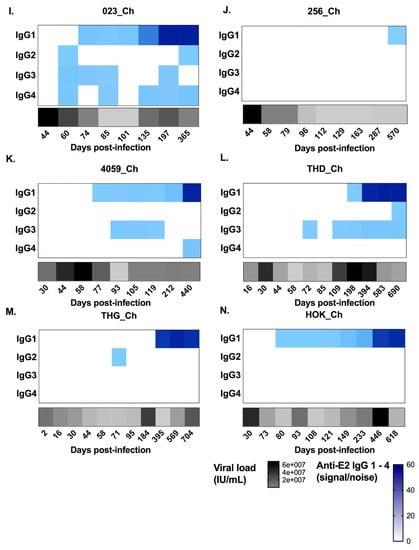
Figure 4.
Heat maps representing longitudinal patterns of anti-HCV E2-antibody subclass utilisation (signal/noise) for IgG1–4 responses, as well as HCV RNA levels (IU/mL), in clearer and chronic progressor subjects. Panels A–G show subjects who cleared the infection. Panels H–N show subjects who developed chronic hepatitis. Anti-E2 IgG1–4 (signal/noise) is represented in blue with lower magnitudes in lighter blue and higher magnitudes in darker blue (see key). HCV RNA levels (IU/mL) are represented in grey/black (see key). Days post infection are indicated below each heat map. All results were generated from duplicate measures from all serum samples collected for each subject.
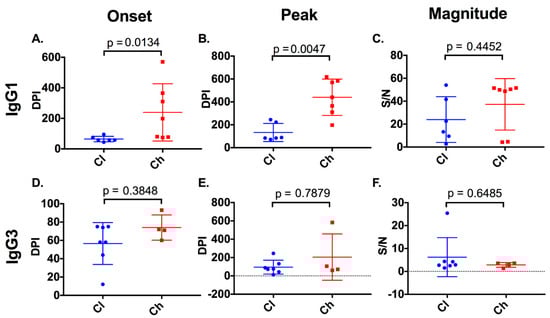
Figure 5.
Timing and magnitude of anti-E2 IgG subclasses in clearer and chronic progressor subjects. The timing (days post infection (DPI)) and magnitude (signal/noise (SN)) of anti-E2 IgG1 and IgG3 responses were assessed in clearers and chronic progressors for the first detectable anti-E2 IgG1 (A) and IgG3 (D) responses, the timing of the peak anti-E2 IgG1 (B) and IgG3 (E) responses, and the magnitude of the peak anti-E2 IgG1 (C), IgG3 (F) responses.
With regard to the anti-E2 IgG1 response, all subjects, with the exception of 4032_Cl, had a response (Figure 4) which increased in magnitude in clearers until 100 DPI. Following this increase, IgG1 levels started to decline in all clearer subjects, except for 277_Cl where levels were sustained. In contrast, in all seven chronic progressors, the magnitude of the responses became stronger over time. When the timing of the first detectable anti-E2 IgG1 response for clearers and chronic progressors was compared, clearers were found to have significantly earlier responses (Mann–Whitney; p = 0.0134, clearer median 58 DPI (range 44–95) versus chronic median 198 DPI (range 74–570)) (Figure 5). Furthermore, clearers had significantly earlier peak anti-E2 IgG1 responses compared to chronic progressors (Mann–Whitney; p = 0.0047, clearer median 87 DPI (range 72–245) versus chronic median 440 DPI (range 197–618)). The peak anti-E2 IgG1 response was not significantly different (Mann–Whitney; p = 0.4452, clearer median 17.96 S/N (range 2.73–54.04) versus chronic median 49.88 S/N (range 4.27–51.57)).
Limited anti-E2 IgG2 was detected throughout infection, and the responses that were detected were transient and low in magnitude—only marginally above cut off (Figure 4). Similarly, anti-E2 IgG4 responses were not detected in any of the seven clearer subjects and in only three of the seven chronic progressors (Figure 4) in whom the responses were transient and low in magnitude.
3.4. The Initial Decline in HCV RNA Is Associated with Anti-E2 IgG1 and IgG3 Responses in Subjects Who Clear
At HCV RNA peak time points, all chronic progressors and the majority of clearer subjects were negative for IgG1 and IgG3. Therefore, no significant difference in IgG1 (Mann–Whitney; p > 0.9999) or IgG3 titres (Mann–Whitney; p = 0.4615) (Figure 6) was observed. The period referred to here as the HCV RNA decline (see Section 2 for definition) was evident in all seven clearers and seven chronic progressors between 16 and 130 DPI. At the HCV RNA decline (Table S1, Supplementary Materials) a potent IgG1 and IgG3 response was detected in all seven clearers. In contrast, the IgG1 and IgG3 responses in chronic progressors during this period were low or not detected (Mann–Whitney; p = 0.0008 and p = 0.0111 for anti-E2 IgG1 and IgG3, respectively) (Figure 6).
Figure 6.
Anti-E2 IgG1 and IgG3 responses were examined at the peak HCV RNA time point and at the initial decline in viral load for both clearer and chronic progressor subjects. Anti-E2 IgG subclass responses at the peak HCV RNA time points were compared for anti-E2 IgG1 (A) or anti-E2 IgG3 (B). Additionally, time points where initial HCV RNA decline occurred were compared for clearers and chronic progressors for anti-E2 IgG1 (C) and anti-E2 IgG3 (D) responses.
3.5. Co-Occurrence of IgM/IgG Occurs in Samples with nAb Activity in Subjects Who Clear
To understand isotype(s) which may correlate with nAb activity, the longitudinal nAb data generated on the same cohort and time points used in this study were analysed in the context of anti-E2 isotypes (Table S1, Supplementary Materials) [19]. In samples where nAb responses (50% inhibition of HCVpp at 1/40 dilution of serum) were present, IgG reactivity accompanied by either an anti-E2 IgM or an anti-E2 IgA response was observed. Therefore, the ratio of anti-E2 IgA/IgG and anti-E2 IgM/IgG was calculated for time points where nAb responses were detected, and for time points where nAb responses were not detected. Clearers were found to have significantly higher anti-E2 IgM/IgG (Kolmogorov–Smirnov; p = 0.0240) (Figure 7) at time points with nAb when compared to chronic progressors. No significant difference was observed between clearers and chronic progressors for anti-E2 IgM/IgG in time points where nAb responses were not detected (Kolmogorov–Smirnov; p = 0.1178). Furthermore, no significant difference was observed for anti-E2 IgA/IgG between clearers and chronic progressors in time points both with (Kolmogorov–Smirnov; p = 0.0928), and without nAbs detected (Kolmogorov–Smirnov; p = 0.9840).
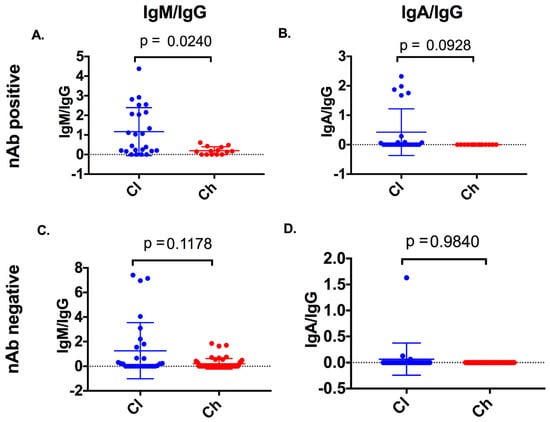
Figure 7.
Anti-E2 isotype ratios were compared between clearers and chronic progressors at samples with neutralising antibody (nAb) activity and without nAb activity. Anti-E2 IgM/IgG and anti-E2 IgA/IgG was compared between clearers and chronic progressors in samples with nAb activity (nAb-positive, panels A and B) and without nAb activity (nAb-negative, panels C and D).
4. Discussion
This study is the first to examine longitudinal anti-E2 isotype and subclass responses in very early primary HCV infection in subjects with clearance or chronic progression outcomes. Clearance was associated with earlier and more potent anti-E2 IgG, specifically IgG1 and IgG3, responses. Interestingly, these IgG responses were accompanied by IgM antibodies and correlated with nAb activity in the subjects who cleared infection. These results provide novel insights into the humoral immune response characteristics associated with disease outcome in early HCV infection.
It is generally believed in primary HCV infection that an anti-E2 IgG response is associated with nAb activity, which in turn is associated with viral clearance [20]. The results presented here show that chronic progressors develop anti-E2 IgG much later in infection than those that clear the virus. This delayed kinetics was most evident for IgG1 subclass responses, but anti-E2 IgG3 responses were also found in all clearer subjects but only a subset of chronic progressors. There were limited significant anti-E2 IgG2 or anti-E2 IgG4 responses found in either outcome group, consistent with previous reports [25,67,68,69].
The initial viral load decline was correlated with both the anti-E2 IgG1 and anti-E2 IgG3 in subjects that cleared infection and is consistent with our recent finding in these same subjects that HCV RNA decline was associated with nAb activity in those who cleared infection [19]. IgG1 and IgG3 were implicated as the major mediators of nAb across various viral infections including West Nile virus, dengue, and HIV [42,70,71,72]. These findings are also consistent with those of Chung et al., who observed in primary HIV infection that IgG3 antibodies likely co-operate with IgG1 to drive Fc-dependent functions, such as antibody-dependent cell-mediated cytotoxicity (ADCC) [66]. Thus, future vaccine efforts in HIV and HCV, as well as other viral infections, may need to induce both anti-E2 IgG1 and anti-E2 IgG3.
The delayed anti-E2 IgG responses observed in chronic progressors in this study highlights a key unresolved question in the immunopathogenesis of primary HCV infection—why only some subjects develop an early and strong anti-E2 IgG1 response. The potential contributors to these delayed kinetics include the immunogenicity of the E1E2 of the particular transmitted–founder (T/F) variants [73], the regulation of humoral response, and the characteristics of the B-cell repertoire [74]. The delayed induction of IgG1 in chronic progressors could indicate delayed class switching and somatic hypermutation of the antibody due to inadequate help by cluster of differentiation 4-positive (CD4+) follicular helper T cells, a concept that is supported by a previous study examining HCV-specific CD4+ T cell responses which showed that, in a subset of subjects from the same cohort, chronic progressors had higher CD4+ regulatory-to-effector ratios. This, along with two recent studies investigating follicular helper T cells and HCV disease progression [75,76], suggests that HCV disease outcome may be pre-determined by the host [77]. It would be interesting to examine the IgG1 responses in chronic progressors to determine if they require extensive maturation to appear, thus indicating that the pre-existing B-cell repertoire is a natural determinant of outcome, as observed in HIV [78].
This is the first study to show that early co-occurrence of IgM is associated with the neutralising activity in the plasma of subjects with a clearance outcome from primary infection. An early IgM response may be protective because of its pentameric structure which results in high-affinity antibodies which can neutralise viruses before the development of an IgG response [38]. IgM also plays an important role in the maturation of B-cell responses regulating B-cell tolerance as well as class switching to IgG and IgA [40,79]. Results of this study are in keeping with those of vaccination studies in HIV, which showed that subjects with a higher anti-envelope IgA:IgG ratio after vaccination were more likely to become infected, potentially indicating reduced protective immunity [43]. It may be noteworthy that the present study examined these virus-specific antibody responses in association with clearance, whereas the HIV vaccine study was investigating protection—that is, reduced potential for establishment of infection [43]. It is well recognised that IgG and IgA antibodies can have neutralisation- as well as Fc-dependent functions including ADCC [20,80].
Although the results reported here are both promising and informative for HCV pathogenesis and vaccine research, there are limitations in the current study. A key limitation was that the ELISA-based assays used here did not measure virion-bound antibody (that is, antibodies bound in immune complexes), only free antibodies in the plasma [81]. It was shown in HIV that the first detectable antibody responses are found in the form of immune complexes [82]. This may also be the case in primary HCV infection. Engagement in immune complex formation could explain why transient responses were observed in some subjects for both anti-E2 IgM and anti-E2 IgA. It should be noted, however, that several time points were examined including those which had very low levels of viraemia (i.e., available antigen) and transient responses were still observed. Another key area of further investigation to strengthen these data is the characterisation of class switching in HCV-specific B cells.
In conclusion, subjects able to mount an early anti-E2 IgG3 and anti-E2 IgG1 response, along with IgM responses, were more likely to achieve natural clearance of HCV. Thus, future vaccine design efforts may seek to promote such anti-E2 IgG1 and anti-E2 IgG3 responses, potentially along with IgM to foster nAb and potentially non-nAb activities.
Supplementary Materials
The following are available online at https://www.mdpi.com/1999-4915/12/1/75/s1: Table S1: Initial HCV RNA decline in subjects with varied disease outcomes.
Author Contributions
Conceptualization, M.R.W., R.A.B., and A.R.L.; methodology, M.R.W., A.A.E., H.L., and M.M.M.; formal analysis, M.R.W. and A.A.E.; resources, L.M., and A.R.L.; writing—original draft preparation, M.R.W.; writing—review and editing, M.R.W., A.R.L., and R.A.B.; funding acquisition, R.A.B. and A.R.L. All authors have read and agreed to the published version of the manuscript.
Funding
Research support for the HITS-p cohort included grants from the National Health and Medical Research Council of Australia (NHMRC)—Project Nos. 222887, 1146082, Partnership No. 1016351, and Program Nos. 510488 and 1053206. The HITS-c cohort was supported by the UNSW Hepatitis C Vaccine Initiative and NHMRC Project Grant No. 630483. A.A.E., A.R.L., and R.A.B. are supported by NHMRC Research Fellowships (Nos. 1130128, 1041897, and 1084706).
Acknowledgments
We would like to thank the HITS-p and HITS-c investigators who include Kate Dolan, Paul Haber, William Rawlinson, Carla Treloar, Greg Dore, Lisa Maher, Andrew Lloyd, and Fabio Luciani.
Conflicts of Interest
The authors declare no conflicts of interest.
References
- Lanini, S.; Easterbrook, P.J.; Zumla, A.; Ippolito, G. Hepatitis c: Global epidemiology and strategies for control. Clin. Microbiol. Infect. 2016, 22, 833–838. [Google Scholar] [CrossRef]
- The Polaris Observatory HCV Collaborators. Global prevalence and genotype distribution of hepatitis c virus infection in 2015: A modelling study. Lancet Gastroenterol. Hepatol. 2017, 2, 161–176. [Google Scholar] [CrossRef]
- Crofts, N.; Hopper, J.L.; Milner, R.; Breschkin, A.M.; Bowden, D.S.; Locarnini, S.A. Blood-borne virus infections among australian injecting drug users: Implications for spread of hiv. Eur. J. Epidemiol. 1994, 10, 687–694. [Google Scholar] [CrossRef]
- Law, M.G.; Dore, G.J.; Bath, N.; Thompson, S.; Crofts, N.; Dolan, K.; Giles, W.; Gow, P.; Kaldor, J.; Loveday, S.; et al. Modelling hepatitis c virus incidence, prevalence and long-term sequelae in australia, 2001. Int. J. Epidemiol. 2003, 32, 717–724. [Google Scholar] [CrossRef] [PubMed]
- Esmaeili, A.; Mirzazadeh, A.; Morris, M.D.; Hajarizadeh, B.; Sacks, H.S.; Maher, L.; Grebely, J.; Kim, A.Y.; Lauer, G.; Cox, A.L.; et al. The effect of female sex on hepatitis c incidence among people who inject drugs: Results from the international multicohort inc3 collaborative. Clin. Infect. Dis. 2018, 66, 20–28. [Google Scholar] [CrossRef] [PubMed]
- Seeff, L.B. Natural history of chronic hepatitis c. Hepatology 2002, 36, S35–S46. [Google Scholar] [PubMed]
- Micallef, J.M.; Kaldor, J.M.; Dore, G.J. Spontaneous viral clearance following acute hepatitis c infection: A systematic review of longitudinal studies. J. Viral Hepat. 2006, 13, 34–41. [Google Scholar] [CrossRef] [PubMed]
- White, P.A.; Zhai, X.; Carter, I.; Zhao, Y.; Rawlinson, W.D. Simplified hepatitis c virus genotyping by heteroduplex mobility analysis. J. Clin. Microbiol. 2000, 38, 477–482. [Google Scholar] [CrossRef]
- Chen, J.; McGuinness, P.H.; Koorey, D.J.; Rickard, K.; Wylie, B.; McCaughan, G.W. Hepatitis c virus genotypes in a cohort of australian blood donors and haemophiliac and liver transplant patients. J. Gastroenterol. Hepatol. 1997, 12, 182–187. [Google Scholar] [CrossRef]
- McCaw, R.; Moaven, L.; Locarnini, S.A.; Bowden, D.S. Hepatitis c virus genotypes in australia. J. Viral Hepat. 1997, 4, 351–357. [Google Scholar] [CrossRef]
- Kaba, S.; Dutta, U.; Byth, K.; Crewe, E.B.; Khan, M.H.; Coverdale, S.A.; Lin, R.; Liddle, C.; Farrell, G.C. Molecular epidemiology of hepatitis c in australia. J. Gastroenterol. Hepatol. 1998, 13, 914–920. [Google Scholar] [CrossRef] [PubMed]
- Pham, S.T.; Bull, R.A.; Bennett, J.M.; Rawlinson, W.D.; Dore, G.J.; Lloyd, A.R.; White, P.A. Frequent multiple hepatitis c virus infections among injection drug users in a prison setting. Hepatology 2010, 52, 1564–1572. [Google Scholar] [CrossRef] [PubMed]
- Walker, M.R.; Li, H.; Teutsch, S.; Betz-Stablein, B.; Luciani, F.; Lloyd, A.R.; Bull, R.A. Incident hepatitis c virus genotype distribution and multiple infection in australian prisons. J. Clin. Microbiol. 2016, 54, 1855–1861. [Google Scholar] [CrossRef] [PubMed]
- Grebely, J.; Petoumenos, K.; Hellard, M.; Matthews, G.V.; Suppiah, V.; Applegate, T.; Yeung, B.; Marks, P.; Rawlinson, W.; Lloyd, A.R.; et al. Potential role for interleukin-28b genotype in treatment decision-making in recent hepatitis c virus infection. Hepatology 2010, 52, 1216–1224. [Google Scholar] [CrossRef] [PubMed]
- Osburn, W.O.; Fisher, B.E.; Dowd, K.A.; Urban, G.; Liu, L.; Ray, S.C.; Thomas, D.L.; Cox, A.L. Spontaneous control of primary hepatitis c virus infection and immunity against persistent reinfection. Gastroenterology 2010, 138, 315–324. [Google Scholar] [CrossRef]
- Osburn, W.O.; Snider, A.E.; Wells, B.L.; Latanich, R.; Bailey, J.R.; Thomas, D.L.; Cox, A.L.; Ray, S.C. Clearance of hepatitis c infection is associated with the early appearance of broad neutralizing antibody responses. Hepatology 2014, 59, 2140–2151. [Google Scholar] [CrossRef]
- Pestka, J.M.; Zeisel, M.B.; Blaser, E.; Schurmann, P.; Bartosch, B.; Cosset, F.L.; Patel, A.H.; Meisel, H.; Baumert, J.; Viazov, S.; et al. Rapid induction of virus-neutralizing antibodies and viral clearance in a single-source outbreak of hepatitis c. Proc. Natl. Acad. Sci. USA 2007, 104, 6025–6030. [Google Scholar] [CrossRef]
- Dowd, K.A.; Netski, D.M.; Wang, X.H.; Cox, A.L.; Ray, S.C. Selection pressure from neutralizing antibodies drives sequence evolution during acute infection with hepatitis c virus. Gastroenterology 2009, 136, 2377–2386. [Google Scholar] [CrossRef]
- Walker, M.R.; Leung, P.; Eltahla, A.A.; Underwood, A.; Abayasingam, A.; Brasher, N.A.; Li, H.; Wu, B.R.; Maher, L.; Luciani, F.; et al. Clearance of hepatitis c virus is associated with early and potent but narrowly-directed, envelope-specific antibodies. Sci. Rep. 2019, 9, 1–14. [Google Scholar] [CrossRef]
- Schroeder, H.W., Jr.; Cavacini, L. Structure and function of immunoglobulins. J. Allergy Clin. Immunol. 2010, 125, S41–S52. [Google Scholar] [CrossRef]
- van Riet, E.; Retra, K.; Adegnika, A.A.; Jol-van der Zijde, C.M.; Uh, H.W.; Lell, B.; Issifou, S.; Kremsner, P.G.; Yazdanbakhsh, M.; van Tol, M.J.; et al. Cellular and humoral responses to tetanus vaccination in gabonese children. Vaccine 2008, 26, 3690–3695. [Google Scholar] [CrossRef] [PubMed]
- Scharf, O.; Golding, H.; King, L.R.; Eller, N.; Frazier, D.; Golding, B.; Scott, D.E. Immunoglobulin g3 from polyclonal human immunodeficiency virus (hiv) immune globulin is more potent than other subclasses in neutralizing hiv type 1. J. Virol. 2001, 75, 6558–6565. [Google Scholar] [CrossRef] [PubMed]
- Chen, M.; Sallberg, M.; Sonnerborg, A.; Weiland, O.; Mattsson, L.; Jin, L.; Birkett, A.; Peterson, D.; Milich, D.R. Limited humoral immunity in hepatitis c virus infection. Gastroenterology 1999, 116, 135–143. [Google Scholar] [CrossRef]
- Sallberg, M.; Ruden, U.; Wahren, B.; Magnius, L.O. Antigenic regions within the hepatitis c virus envelope 1 and non-structural proteins: Identification of an igg3-restricted recognition site with the envelope 1 protein. Clin. Exp. Immunol. 1993, 91, 489–494. [Google Scholar] [CrossRef] [PubMed]
- Netski, D.M.; Mosbruger, T.; Depla, E.; Maertens, G.; Ray, S.C.; Hamilton, R.G.; Roundtree, S.; Thomas, D.L.; McKeating, J.; Cox, A. Humoral immune response in acute hepatitis c virus infection. Clin. Infect. Dis. 2005, 41, 667–675. [Google Scholar] [CrossRef] [PubMed]
- Sagnelli, E.; Coppola, N.; Marrocco, C.; Coviello, G.; Rossi, G.; Battaglia, M.; Sagnelli, C.; Messina, V.; Tonziello, A.; Scolastico, C.; et al. Diagnosis of hcv related acute hepatitis by serial determination of igm to hcv: A preliminary observation. J. Biol. Regul. Homeost. Agents 2003, 17, 207–210. [Google Scholar]
- Li, H.C.; Lo, S.Y. Hepatitis c virus: Virology, diagnosis and treatment. World J. Hepatol. 2015, 7, 1377–1389. [Google Scholar] [CrossRef]
- Chen, P.J.; Wang, J.T.; Hwang, L.H.; Yang, Y.H.; Hsieh, C.L.; Kao, J.H.; Sheu, J.C.; Lai, M.Y.; Wang, T.H.; Chen, D.S. Transient immunoglobulin m antibody response to hepatitis c virus capsid antigen in posttransfusion hepatitis c: Putative serological marker for acute viral infection. Proc. Natl. Acad. Sci. USA 1992, 89, 5971–5975. [Google Scholar] [CrossRef]
- Lau, G.K.; Lesniewski, R.; Johnson, R.G.; Davis, G.L.; Lau, J.Y. Immunoglobulin m and a antibodies to hepatitis c core antigen in chronic hepatitis c virus infection. J. Med. Virol. 1994, 44, 1–4. [Google Scholar] [CrossRef]
- Yamaguchi, N.; Tokushige, K.; Yamauchi, K.; Hayashi, N. Humoral immune response in japanese acute hepatitis patients with hepatitis c virus infection. Can. J. Gastroenterol. 2000, 14, 593–598. [Google Scholar] [CrossRef][Green Version]
- Nikolaeva, L.I.; Blokhina, N.P.; Tsurikova, N.N.; Voronkova, N.V.; Miminoshvili, M.I.; Braginsky, D.M.; Yastrebova, O.N.; Booynitskaya, O.B.; Isaeva, O.V.; Michailov, M.I.; et al. Virus-specific antibody titres in different phases of hepatitis c virus infection. J. Viral Hepat. 2002, 9, 429–437. [Google Scholar] [CrossRef] [PubMed]
- Ilan, Y.; Shouval, D.; Ashur, Y.; Manns, M.; Naparstek, Y. Iga deficiency associated with chronic hepatitis c virus infection. A cause or an effect? Arch. Intern. Med. 1993, 153, 1588–1592. [Google Scholar] [CrossRef] [PubMed]
- Tanaka, M.; Sato, S.; Fujiyama, S.; Kawano, S.; Taura, Y.; Chikazawa, H.; Honda, Y.; Shibata, J.; Sato, T. Clinical study of iga antibody against hepatitis c virus core antigen in patients with type c chronic liver disease. Dig. Dis. Sci. 1995, 40, 457–464. [Google Scholar] [CrossRef] [PubMed]
- Sato, S.; Fujiyama, S.; Tanaka, M.; Goto, M.; Taura, Y.; Kawano, S.; Sato, T.; Yasuo, H. Igm and iga antibodies generated against hepatitis c virus core antigen in patients with acute and chronic hcv infection. Dig. Dis. Sci. 1994, 39, 2022–2031. [Google Scholar] [CrossRef] [PubMed]
- Gong, S.; Tomusange, K.; Kulkarni, V.; Adeniji, O.S.; Lakhashe, S.K.; Hariraju, D.; Strickland, A.; Plake, E.; Frost, P.A.; Ratcliffe, S.J.; et al. Anti-hiv igm protects against mucosal shiv transmission. Aids 2018, 32, F5–F13. [Google Scholar] [CrossRef]
- Diamond, M.S.; Sitati, E.M.; Friend, L.D.; Higgs, S.; Shrestha, B.; Engle, M. A critical role for induced igm in the protection against west nile virus infection. J. Exp. Med. 2003, 198, 1853–1862. [Google Scholar] [CrossRef]
- Krishnamurty, A.T.; Thouvenel, C.D.; Portugal, S.; Keitany, G.J.; Kim, K.S.; Holder, A.; Crompton, P.D.; Rawlings, D.J.; Pepper, M. Somatically hypermutated plasmodium-specific igm(+) memory b cells are rapid, plastic, early responders upon malaria rechallenge. Immunity 2016, 45, 402–414. [Google Scholar] [CrossRef]
- Chua, C.L.; Sam, I.C.; Chiam, C.W.; Chan, Y.F. The neutralizing role of igm during early chikungunya virus infection. PLoS ONE 2017, 12, e0171989. [Google Scholar] [CrossRef]
- Skountzou, I.; Satyabhama, L.; Stavropoulou, A.; Ashraf, Z.; Esser, E.S.; Vassilieva, E.; Koutsonanos, D.; Compans, R.; Jacob, J. Influenza virus-specific neutralizing igm antibodies persist for a lifetime. Clin. Vaccine Immunol. 2014, 21, 1481–1489. [Google Scholar] [CrossRef]
- Kubagawa, H.; Honjo, K.; Ohkura, N.; Sakaguchi, S.; Radbruch, A.; Melchers, F.; Jani, P.K. Functional roles of the igm fc receptor in the immune system. Front. Immunol. 2019, 10, 945. [Google Scholar] [CrossRef]
- Moyron-Quiroz, J.E.; McCausland, M.M.; Kageyama, R.; Sette, A.; Crotty, S. The smallpox vaccine induces an early neutralizing igm response. Vaccine 2009, 28, 140–147. [Google Scholar] [CrossRef] [PubMed]
- Cavacini, L.A.; Kuhrt, D.; Duval, M.; Mayer, K.; Posner, M.R. Binding and neutralization activity of human igg1 and igg3 from serum of hiv-infected individuals. Aids Res. Hum. Retrovir. 2003, 19, 785–792. [Google Scholar] [CrossRef] [PubMed]
- Haynes, B.F.; Gilbert, P.B.; McElrath, M.J.; Zolla-Pazner, S.; Tomaras, G.D.; Alam, S.M.; Evans, D.T.; Montefiori, D.C.; Karnasuta, C.; Sutthent, R.; et al. Immune-correlates analysis of an hiv-1 vaccine efficacy trial. N. Engl. J. Med. 2012, 366, 1275–1286. [Google Scholar] [CrossRef] [PubMed]
- Ackerman, M.E.; Mikhailova, A.; Brown, E.P.; Dowell, K.G.; Walker, B.D.; Bailey-Kellogg, C.; Suscovich, T.J.; Alter, G. Polyfunctional hiv-specific antibody responses are associated with spontaneous hiv control. PLoS Pathog. 2016, 12, e1005315. [Google Scholar] [CrossRef]
- Ljunggren, K.; Moschese, V.; Broliden, P.A.; Giaquinto, C.; Quinti, I.; Fenyo, E.M.; Wahren, B.; Rossi, P.; Jondal, M. Antibodies mediating cellular cytotoxicity and neutralization correlate with a better clinical stage in children born to human immunodeficiency virus-infected mothers. J. Infect. Dis. 1990, 161, 198–202. [Google Scholar] [CrossRef]
- Yates, N.L.; Liao, H.X.; Fong, Y.; deCamp, A.; Vandergrift, N.A.; Williams, W.T.; Alam, S.M.; Ferrari, G.; Yang, Z.Y.; Seaton, K.E.; et al. Vaccine-induced env v1-v2 igg3 correlates with lower hiv-1 infection risk and declines soon after vaccination. Sci. Transl. Med. 2014, 6, 228ra239. [Google Scholar] [CrossRef]
- Rerks-Ngarm, S.; Pitisuttithum, P.; Nitayaphan, S.; Kaewkungwal, J.; Chiu, J.; Paris, R.; Premsri, N.; Namwat, C.; de Souza, M.; Adams, E.; et al. Vaccination with alvac and aidsvax to prevent hiv-1 infection in thailand. N. Engl. J. Med. 2009, 361, 2209–2220. [Google Scholar] [CrossRef]
- Tomaras, G.D.; Ferrari, G.; Shen, X.; Alam, S.M.; Liao, H.X.; Pollara, J.; Bonsignori, M.; Moody, M.A.; Fong, Y.; Chen, X.; et al. Vaccine-induced plasma iga specific for the c1 region of the hiv-1 envelope blocks binding and effector function of igg. Proc. Natl. Acad. Sci. USA 2013, 110, 9019–9024. [Google Scholar] [CrossRef]
- Teutsch, S.; Luciani, F.; Scheuer, N.; McCredie, L.; Hosseiny, P.; Rawlinson, W.; Kaldor, J.; Dore, G.J.; Dolan, K.; Ffrench, R.; et al. Incidence of primary hepatitis c infection and risk factors for transmission in an australian prisoner cohort. BMC Public Health 2010, 10, 633. [Google Scholar] [CrossRef]
- Luciani, F.; Bretana, N.A.; Teutsch, S.; Amin, J.; Topp, L.; Dore, G.J.; Maher, L.; Dolan, K.; Lloyd, A.R.; HITS-p investigators. A prospective study of hepatitis c incidence in australian prisoners. Addiction 2014, 109, 1695–1706. [Google Scholar] [CrossRef]
- Dolan, K.; Teutsch, S.; Scheuer, N.; Levy, M.; Rawlinson, W.; Kaldor, J.; Lloyd, A.; Haber, P. Incidence and risk for acute hepatitis c infection during imprisonment in australia. Eur. J. Epidemiol. 2010, 25, 143–148. [Google Scholar] [CrossRef] [PubMed]
- Busch, M.P. Insights into the epidemiology, natural history and pathogenesis of hepatitis c virus infection from studies of infected donors and blood product recipients. Transfus Clin. Biol. 2001, 8, 200–206. [Google Scholar] [CrossRef]
- Glynn, S.A.; Wright, D.J.; Kleinman, S.H.; Hirschkorn, D.; Tu, Y.; Heldebrant, C.; Smith, R.; Giachetti, C.; Gallarda, J.; Busch, M.P. Dynamics of viremia in early hepatitis c virus infection. Transfusion 2005, 45, 994–1002. [Google Scholar] [CrossRef] [PubMed]
- Page-Shafer, K.; Pappalardo, B.L.; Tobler, L.H.; Phelps, B.H.; Edlin, B.R.; Moss, A.R.; Wright, T.L.; Wright, D.J.; O’Brien, T.R.; Caglioti, S.; et al. Testing strategy to identify cases of acute hepatitis c virus (hcv) infection and to project hcv incidence rates. J. Clin. Microbiol. 2008, 46, 499–506. [Google Scholar] [CrossRef][Green Version]
- Bull, R.A.; Luciani, F.; McElroy, K.; Gaudieri, S.; Pham, S.T.; Chopra, A.; Cameron, B.; Maher, L.; Dore, G.J.; White, P.A.; et al. Sequential bottlenecks drive viral evolution in early acute hepatitis c virus infection. PLoS Pathog. 2011, 7, e1002243. [Google Scholar] [CrossRef]
- Al Olaby, R.R.; Azzazy, H.M. Hepatitis c virus rna assays: Current and emerging technologies and their clinical applications. Expert Rev. Mol. Diagn. 2011, 11, 53–64. [Google Scholar] [CrossRef]
- Wang, Y.; Keck, Z.Y.; Saha, A.; Xia, J.; Conrad, F.; Lou, J.; Eckart, M.; Marks, J.D.; Foung, S.K. Affinity maturation to improve human monoclonal antibody neutralization potency and breadth against hepatitis c virus. J. Biol. Chem. 2011, 286, 44218–44233. [Google Scholar] [CrossRef]
- McCaffrey, K.; Boo, I.; Owczarek, C.M.; Hardy, M.P.; Perugini, M.A.; Fabri, L.; Scotney, P.; Poumbourios, P.; Drummer, H.E. An optimized hepatitis c virus e2 glycoprotein core adopts a functional homodimer that efficiently blocks virus entry. J. Virol. 2017, 91, e01668-16. [Google Scholar] [CrossRef]
- Giang, E.; Dorner, M.; Prentoe, J.C.; Dreux, M.; Evans, M.J.; Bukh, J.; Rice, C.M.; Ploss, A.; Burton, D.R.; Law, M. Human broadly neutralizing antibodies to the envelope glycoprotein complex of hepatitis c virus. Proc. Natl. Acad. Sci. USA 2012, 109, 6205–6210. [Google Scholar] [CrossRef]
- Alhammad, Y.; Gu, J.; Boo, I.; Harrison, D.; McCaffrey, K.; Vietheer, P.T.; Edwards, S.; Quinn, C.; Coulibaly, F.; Poumbourios, P.; et al. Monoclonal antibodies directed toward the hepatitis c virus glycoprotein e2 detect antigenic differences modulated by the n-terminal hypervariable region 1 (hvr1), hvr2, and intergenotypic variable region. J. Virol. 2015, 89, 12245–12261. [Google Scholar] [CrossRef]
- Hajarizadeh, B.; Grebely, J.; Applegate, T.; Matthews, G.V.; Amin, J.; Petoumenos, K.; Hellard, M.; Rawlinson, W.; Lloyd, A.; Kaldor, J.; et al. Dynamics of hcv rna levels during acute hepatitis c virus infection. J. Med. Virol. 2014, 86, 1722–1729. [Google Scholar] [CrossRef] [PubMed]
- Hajarizadeh, B.; Grady, B.; Page, K.; Kim, A.Y.; McGovern, B.H.; Cox, A.L.; Rice, T.M.; Sacks-Davis, R.; Bruneau, J.; Morris, M.; et al. Patterns of hepatitis c virus rna levels during acute infection: The inc3 study. PLoS ONE 2015, 10, e0122232. [Google Scholar] [CrossRef] [PubMed]
- Sarrazin, C.; Dragan, A.; Gartner, B.C.; Forman, M.S.; Traver, S.; Zeuzem, S.; Valsamakis, A. Evaluation of an automated, highly sensitive, real-time pcr-based assay (cobas ampliprep/cobas taqman) for quantification of hcv rna. J. Clin. Virol. 2008, 43, 162–168. [Google Scholar] [CrossRef] [PubMed]
- Ross, R.S.; Viazov, S.; Sarr, S.; Hoffmann, S.; Kramer, A.; Roggendorf, M. Quantitation of hepatitis c virus rna by third generation branched DNA-based signal amplification assay. J. Virol. Methods 2002, 101, 159–168. [Google Scholar] [CrossRef]
- Cooper, P.J.; Espinel, I.; Wieseman, M.; Paredes, W.; Espinel, M.; Guderian, R.H.; Nutman, T.B. Human onchocerciasis and tetanus vaccination: Impact on the postvaccination antitetanus antibody response. Infect. Immun. 1999, 67, 5951–5957. [Google Scholar] [CrossRef]
- Chung, A.W.; Ghebremichael, M.; Robinson, H.; Brown, E.; Choi, I.; Lane, S.; Dugast, A.S.; Schoen, M.K.; Rolland, M.; Suscovich, T.J.; et al. Polyfunctional fc-effector profiles mediated by igg subclass selection distinguish rv144 and vax003 vaccines. Sci. Transl. Med. 2014, 6, 228ra238. [Google Scholar] [CrossRef]
- Barrett, D.J.; Ayoub, E.M. Igg2 subclass restriction of antibody to pneumococcal polysaccharides. Clin. Exp. Immunol. 1986, 63, 127–134. [Google Scholar]
- Murphy, S.L.; Li, H.; Mingozzi, F.; Sabatino, D.E.; Hui, D.J.; Edmonson, S.A.; High, K.A. Diverse igg subclass responses to adeno-associated virus infection and vector administration. J. Med. Virol. 2009, 81, 65–74. [Google Scholar] [CrossRef]
- Spinsanti, L.I.; Farias, A.A.; Aguilar, J.J.; del Pilar Diaz, M.; Contigiani, M.S. Immunoglobulin g subclasses in antibody responses to st. Louis encephalitis virus infections. Arch. Virol. 2011, 156, 1861–1864. [Google Scholar] [CrossRef]
- Liu, F.; Bergami, P.L.; Duval, M.; Kuhrt, D.; Posner, M.; Cavacini, L. Expression and functional activity of isotype and subclass switched human monoclonal antibody reactive with the base of the v3 loop of hiv-1 gp120. Aids Res. Hum. Retrovir. 2003, 19, 597–607. [Google Scholar] [CrossRef]
- Hofmeister, Y.; Planitzer, C.B.; Farcet, M.R.; Teschner, W.; Butterweck, H.A.; Weber, A.; Holzer, G.W.; Kreil, T.R. Human igg subclasses: In vitro neutralization of and in vivo protection against west nile virus. J. Virol. 2011, 85, 1896–1899. [Google Scholar] [CrossRef] [PubMed]
- Rodrigo, W.W.; Block, O.K.; Lane, C.; Sukupolvi-Petty, S.; Goncalvez, A.P.; Johnson, S.; Diamond, M.S.; Lai, C.J.; Rose, R.C.; Jin, X.; et al. Dengue virus neutralization is modulated by igg antibody subclass and fcgamma receptor subtype. Virology 2009, 394, 175–182. [Google Scholar] [CrossRef] [PubMed]
- Abayasingam, A.; Leung, P.; Eltahla, A.; Bull, R.A.; Luciani, F.; Grebely, J.; Dore, G.J.; Applegate, T.; Page, K.; Bruneau, J.; et al. Genomic characterization of hepatitis c virus transmitted founder variants with deep sequencing. Infect. Genet. Evol. 2019, 71, 36–41. [Google Scholar] [CrossRef] [PubMed]
- Abbott, R.K.; Lee, J.H.; Menis, S.; Skog, P.; Rossi, M.; Ota, T.; Kulp, D.W.; Bhullar, D.; Kalyuzhniy, O.; Havenar-Daughton, C.; et al. Precursor frequency and affinity determine b cell competitive fitness in germinal centers, tested with germline-targeting hiv vaccine immunogens. Immunity 2018, 48, 133–146. [Google Scholar] [CrossRef]
- Raziorrouh, B.; Sacher, K.; Tawar, R.G.; Emmerich, F.; Neumann-Haefelin, C.; Baumert, T.F.; Thimme, R.; Boettler, T. Virus-specific cd4+ t cells have functional and phenotypic characteristics of follicular t-helper cells in patients with acute and chronic hcv infections. Gastroenterology 2016, 150, 696–706. [Google Scholar] [CrossRef]
- Zhang, Z.H.; Jiang, B.C.; Liu, X.H.; Zhang, M.X.; Li, Z.S.; Zhu, G.Z. Interleukin-7 regulates t follicular helper cell function in patients with chronic hepatitis c. Viral Immunol. 2018, 31, 417–425. [Google Scholar] [CrossRef]
- Keoshkerian, E.; Hunter, M.; Cameron, B.; Nguyen, N.; Sugden, P.; Bull, R.; Zekry, A.; Maher, L.; Seddiki, N.; Zaunders, J.; et al. Hepatitis c-specific effector and regulatory cd4 t-cell responses are associated with the outcomes of primary infection. J. Viral Hepat. 2016, 23, 985–993. [Google Scholar] [CrossRef]
- Sok, D.; Laserson, U.; Laserson, J.; Liu, Y.; Vigneault, F.; Julien, J.P.; Briney, B.; Ramos, A.; Saye, K.F.; Le, K.; et al. The effects of somatic hypermutation on neutralization and binding in the pgt121 family of broadly neutralizing hiv antibodies. PLoS Pathog. 2013, 9, e1003754. [Google Scholar] [CrossRef]
- Ehrenstein, M.R.; O’Keefe, T.L.; Davies, S.L.; Neuberger, M.S. Targeted gene disruption reveals a role for natural secretory igm in the maturation of the primary immune response. Proc. Natl. Acad. Sci. USA 1998, 95, 10089–10093. [Google Scholar] [CrossRef]
- Black, K.P.; Cummins, J.E., Jr.; Jackson, S. Serum and secretory iga from hiv-infected individuals mediate antibody-dependent cellular cytotoxicity. Clin. Immunol. Immunopathol. 1996, 81, 182–190. [Google Scholar] [CrossRef]
- Wang, T.T.; Ravetch, J.V. Immune complexes: Not just an innocent bystander in chronic viral infection. Immunity 2015, 42, 213–215. [Google Scholar] [CrossRef] [PubMed]
- Tomaras, G.D.; Yates, N.L.; Liu, P.; Qin, L.; Fouda, G.G.; Chavez, L.L.; Decamp, A.C.; Parks, R.J.; Ashley, V.C.; Lucas, J.T.; et al. Initial b-cell responses to transmitted human immunodeficiency virus type 1: Virion-binding immunoglobulin m (igm) and igg antibodies followed by plasma anti-gp41 antibodies with ineffective control of initial viremia. J. Virol. 2008, 82, 12449–12463. [Google Scholar] [CrossRef] [PubMed]
© 2020 by the authors. Licensee MDPI, Basel, Switzerland. This article is an open access article distributed under the terms and conditions of the Creative Commons Attribution (CC BY) license (http://creativecommons.org/licenses/by/4.0/).