A Combination of Real-Time PCR and High-Resolution Melting Analysis to Detect and Identify CpGV Genotypes Involved in Type I Resistance


Abstract
:1. Introduction
2. Materials and Methods
2.1. Insects
2.2. Viruses
2.3. Amplification of the Different Viral Mixed Populations
2.4. Infection Categories
2.4.1. Standard Range for Quantification in HRM Analysis
2.4.2. Viral Infections of CpNPP with Mixes and Analysis of BV Production
2.4.3. Viral Infections of CpNPP with Mixes and Analysis of OBs Production
2.5. DNA Purification
2.6. Primer Design
2.7. HRM Assay
2.8. Amplicon Sequencing
3. Results
3.1. Identification and Quantification of Genotypes in a Mixture
3.2. Analysis of BVs Extracted from Hemolymph
3.3. Analysis of OBs Productions
4. Discussion
Author Contributions
Acknowledgments
Conflicts of Interest
References
- Food and Agricultural Commodities Production (FAOSTAT 2017). Available online: http://www.fao.org/faostat/en/#data/QC (accessed on 25 February 2019).
- Solomon, M.G.; Cross, J.V.; Fitzgerald, J.D.; Campbell, C.A.M.; Jolly, R.L.; Olszak, R.W.; Niemczyk, E.; Vogt, H. Biocontrol of pests of apples and pears in northern and central Europe-3. Predators. Biocontrol Sci. Technol. 2000, 10, 91–128. [Google Scholar] [CrossRef]
- Ministère de L’agriculture de L’agroalimentaire et de la Foret. Enquête Pratiques Phytosanitaires en Arboriculture 2012 Nombre de Traitements; Agreste, Montreuil-sous-Bois: Seine-Saint-Denis, France, 2014. [Google Scholar]
- Graillot, B. Analyse de la Durabilité de la Lutte Biologique à l ’aide de Baculovirus. Ph.D. Thesis, Ecole des Mines de Saint Etienne, Loire, France, 2015. [Google Scholar]
- Lacey, L.A.; Thomson, D.; Vincent, C.; Arthurs, S.P. Codling moth granulovirus: A comprehensive review. Biocontrol Sci. Technol. 2008, 18, 639–663. [Google Scholar] [CrossRef]
- Knight, A.L.; Brunner, J.F.; Alston, D. Survey of azinphosmethyl resistance in codling moth (Lepidoptera: Tortricidae) in Washington and Utah. J. Econ. Entomol. 1994, 87, 285–292. [Google Scholar] [CrossRef]
- Cutright, C.R. A Codling Moth Population Resistant to DDT. J. Econ. Entomol. 1954, 47, 189–190. [Google Scholar] [CrossRef]
- Knight, A.L.; Flexner, L. Disruption of mating in codling moth (Lepidoptera: Tortricidae) by chlorantranilipole, an anthranilic diamide insecticide. Pest Manag. Sci. 2007, 63, 180–189. [Google Scholar] [CrossRef] [PubMed]
- Reyes, M.; Franck, P.; Charmillot, P.J.; Ioriatti, C.; Olivares, J.; Pasqualini, E.; Sauphanor, B. Diversity of insecticide resistance mechanisms and spectrum in European populations of the Codling moth, Cydia pomonella. Pest Manag. Sci. 2007, 63, 890–902. [Google Scholar] [CrossRef] [PubMed]
- Bush, M.R.; Abdel-Aal, Y.A.; Rock, G.C. Parathion Resistance and Esterase Activity in Codling Moth (Lepidoptera:Tortricidae) from North Carolina. J. Econ. Entomol. 1993, 86, 660–666. [Google Scholar] [CrossRef]
- Tanada, Y. A granulosis virus of codling moth Carpocapsa pomonella (linnaeus)) Olethreutidae Lepidoptera). J. Insect Pathol. 1964, 6, 378–380. [Google Scholar]
- Luque, T.; Finch, R.; Crook, N.; O’Reilly, D.R.; Winstanley, D. The complete sequence of the Cydia pomonella granulovirus genome. J. Gen. Virol. 2001, 82, 2531–2547. [Google Scholar] [CrossRef]
- Crook, N.E.; Spencer, R.A.; Payne, C.C.; Leisy, D.J. Variation in Cydia pomonella granulosis virus isolates and physical maps of the DNA from three variants. J. Gen. Virol. 1985, 66, 2423–2430. [Google Scholar] [CrossRef]
- Eberle, K.E.; Sayed, S.; Rezapanah, M.; Shojai-Estabragh, S.; Jehle, J.A. Diversity and evolution of the Cydia pomonella granulovirus. J. Gen. Virol. 2009, 90, 662–671. [Google Scholar] [CrossRef] [PubMed]
- Wennmann, J.T.; Radtke, P.; Eberle, K.E.; Alletti, G.G.; Jehle, J.A. Deciphering single nucleotide polymorphisms and evolutionary trends in isolates of the cydia pomonella granulovirus. Viruses 2017, 9, 227. [Google Scholar] [CrossRef] [PubMed]
- Gebhardt, M.M.; Eberle, K.E.; Radtke, P.; Jehle, J.A. Baculovirus resistance in codling moth is virus isolate-dependent and the consequence of a mutation in viral gene pe38. Proc. Natl. Acad. Sci. USA 2014, 111, 15711–15716. [Google Scholar] [CrossRef] [PubMed]
- Eberle, K.E.; Jehle, J.A. Field resistance of codling moth against Cydia pomonella granulovirus (CpGV) is autosomal and incompletely dominant inherited. J. Invertebr. Pathol. 2006, 93, 201–206. [Google Scholar] [CrossRef] [PubMed]
- Fritsch, E.; Undorf-Spahn, K.; Kienzle, J.; Zebitz, C.; Huber, J. Codling moth granulovirus: First indication of variations in the susceptibility of local codling moth populations. Nachr. Dtsch. Pflanzenschutzd. 2005, 29–34. [Google Scholar]
- Sauphanor, B.; Berling, M.; Toubon, J.-F.; Reyes, M.; Delnatte, J. Carpocapse des pommes cas de résistance aux virus de la granulose dans le Sud-Est. Phytoma 2006, 590, 24–27. [Google Scholar]
- Schmitt, A.; Bisutti, I.L.; Ladurner, E.; Benuzzi, M.; Sauphanor, B.; Kienzle, J.; Zingg, D.; Undorf-Spahn, K.; Fritsch, E.; Huber, J.; et al. The occurrence and distribution of resistance of codling moth to Cydia pomonella granulovirus in Europe. J. Appl. Entomol. 2013, 137, 641–649. [Google Scholar] [CrossRef]
- Jehle, J.A.; Schulze-Bopp, S.; Undorf-Spahn, K.; Fritsch, E. Evidence for a second type of resistance against Cydia pomonella granulovirus in field populations of codling moths. Appl. Environ. Microbiol. 2017, 83, e02330-16. [Google Scholar] [CrossRef]
- Rezapanah, M.; Shojai-Estabragh, S.; Huber, J.; Jehle, J.A. Molecular and biological characterization of new isolates of Cydia pomonella granulovirus from Iran. J. Pest Sci. 2008, 81, 187–191. [Google Scholar] [CrossRef]
- Eberle, K.E.; Asser-Kaiser, S.; Sayed, S.M.; Nguyen, H.T.; Jehle, J.A. Overcoming the resistance of codling moth against conventional Cydia pomonella granulovirus (CpGV-M) by a new isolate CpGV-I12. J. Invertebr. Pathol. 2008, 98, 293–298. [Google Scholar] [CrossRef]
- Berling, M.; Blachère-López, C.; Soubabere, O.; Lery, X.; Bonhomme, A.; Sauphanor, B.; López-Ferber, M. Cydia pomonella granulovirus genotypes overcome virus resistance in the codling moth and improve virus efficiency by selection against resistant hosts. Appl. Environ. Microbiol. 2009, 75, 925–930. [Google Scholar] [CrossRef] [PubMed]
- Asser-Kaiser, S.; Radtke, P.; El-Salamouny, S.; Winstanley, D.; Jehle, J.A. Baculovirus resistance in codling moth (Cydia pomonella L.) caused by early block of virus replication. Virology 2011, 410, 360–367. [Google Scholar] [CrossRef] [PubMed]
- Alletti, G.G.; Sauer, A.J.; Weihrauch, B.; Fritsch, E.; Undorf-Spahn, K.; Wennmann, J.T.; Jehle, J.A. Using next generation sequencing to identify and quantify the genetic composition of resistance- breaking commercial isolates of Cydia pomonella granulovirus. Viruses 2017, 9, 250. [Google Scholar] [CrossRef] [PubMed]
- Graillot, B.; Bayle, S.; Blachère-López, C.; Besse, S.; Siegwart, M.; López-Ferber, M. Biological characteristics of experimental genotype mixtures of cydia pomonella granulovirus (CpGV): Ability to control susceptible and resistant pest populations. Viruses 2016, 8, 147. [Google Scholar] [CrossRef] [PubMed]
- Frutos, R.; Federici, B.A.; Revet, B.; Bergoin, M. Taxonomic studies of Rickettsiella, Rickettsia, and Chlamydia using genomic DNA. J. Invertebr. Pathol. 1994, 63, 294–300. [Google Scholar] [CrossRef] [PubMed]
- Krejmer-Rabalska, M.; Rabalski, L.; Jukes, M.; Lobo de Souza, M.; Moore, S.; Szewczyk, B. New Method for Differentiation of Granuloviruses (Betabaculoviruses) Based on Real-Time Polymerase Chain Reaction (Real-Time PCR). Viruses 2019, 11, 115. [Google Scholar] [CrossRef]
- Issa, R.; Abdul, H.; Hashim, S.H.; Seradja, V.H.; Shaili, N.A.; Hassan, N.A.M. High resolution melting analysis for the differentiation of Mycobacterium species. J. Med. Microbiol. 2014, 63, 1284–1287. [Google Scholar] [CrossRef]
- Toubanaki, D.K.; Karagouni, E. Genotype-specific real-time PCR combined with high-resolution melting analysis for rapid identification of red-spotted grouper nervous necrosis virus. Arch. Virol. 2017, 162, 2315–2328. [Google Scholar] [CrossRef]
- Zhong, X.; Li, Q.; Yu, H.; Kong, L. Development and Validation of Single-nucleotide Polymorphism Markers in the Pacific Oyster, Crassostrea gigas, Using High-resolution Melting Analysis. J. World Aquac. Soc. 2013, 44, 455–465. [Google Scholar] [CrossRef]
- Ashrafi, R.; Bruneaux, M.; Sundberg, L.-R.; Pulkkinen, K.; Ketola, T. Application of high resolution melting assay (HRM) to study temperature-dependent intraspecific competition in a pathogenic bacterium. Sci. Rep. 2017, 7, 980. [Google Scholar] [CrossRef]
- Villinger, J.; Mbaya, M.K.; Ouso, D.; Kipanga, P.N.; Lutomiah, J.; Masiga, D.K. Arbovirus and insect-specific virus discovery in Kenya by novel six genera multiplex high-resolution melting analysis. Mol. Ecol. Resour. 2017, 17, 466–480. [Google Scholar] [CrossRef] [PubMed]
- López-Ferber, M.; Simón, O.; Williams, T.; Caballero, P. Defective or effective? Mutualistic interactions between virus genotypes. Proc. R. Soc. Lond. Ser. B Biol. Sci. 2003, 270, 2249–2255. [Google Scholar] [CrossRef] [PubMed] [Green Version]
- Graillot, B.; Besse, S.; Blachère-López, C.; Olivares, J.; Graillot, B.; Olivares, J.; Siegwart, M.; López-Ferber, M. Sequence analysis of CpGV-R5 isolate, able to efficiently control CpGV-M resistant insects: Relation between biologic al activity and genome. IOBC-WPRS Bull. 2013, 90, 195–199. [Google Scholar]
- Ayres, M.D.; Howard, S.C.; López-Ferber, M.; Possee, R.D. The complete DNA sequence of Autographa californica nuclear polyhedrosis virus. Virology 1994, 202, 586–605. [Google Scholar] [CrossRef]
- Graillot, B.; Berling, M.; Blachère-López, C.; Siegwart, M.; Besse, S.; López-Ferber, M. Progressive adaptation of a CpGV Isolate to codling moth populations resistant to CpGV-M. Viruses 2014, 6, 5135–5144. [Google Scholar] [CrossRef] [PubMed]
- Fisher, C.; Meng, R.; Bizouarn, F.; Scott, R. High Resolution Melt Parameter Considerations for Optimal Data Resolution; Bio-Rad Laboratories: Hercules, CA, USA, 2010. [Google Scholar]
- Jehle, J.; Sauer, A.; Gueli Alletti, G.; Fritsch, E.; Undorf-Spahn, K. Granulovirusresistenz beim Apfelwickler und neue resistenzbrechende Granulovirus-Isolate. Öko-Obstbau 2016, 2, 16–18. [Google Scholar]
 ) (M0-R100), (M99-R1), (M95-R5); (
  ) (M100-R0), (M1-R99) and (M5-R95); (
  ) (M90-R10); (
  ) (M75-R25); (
  ) (M50-R50); (
  ) (M25-R75); (
  ) (M10-R90).
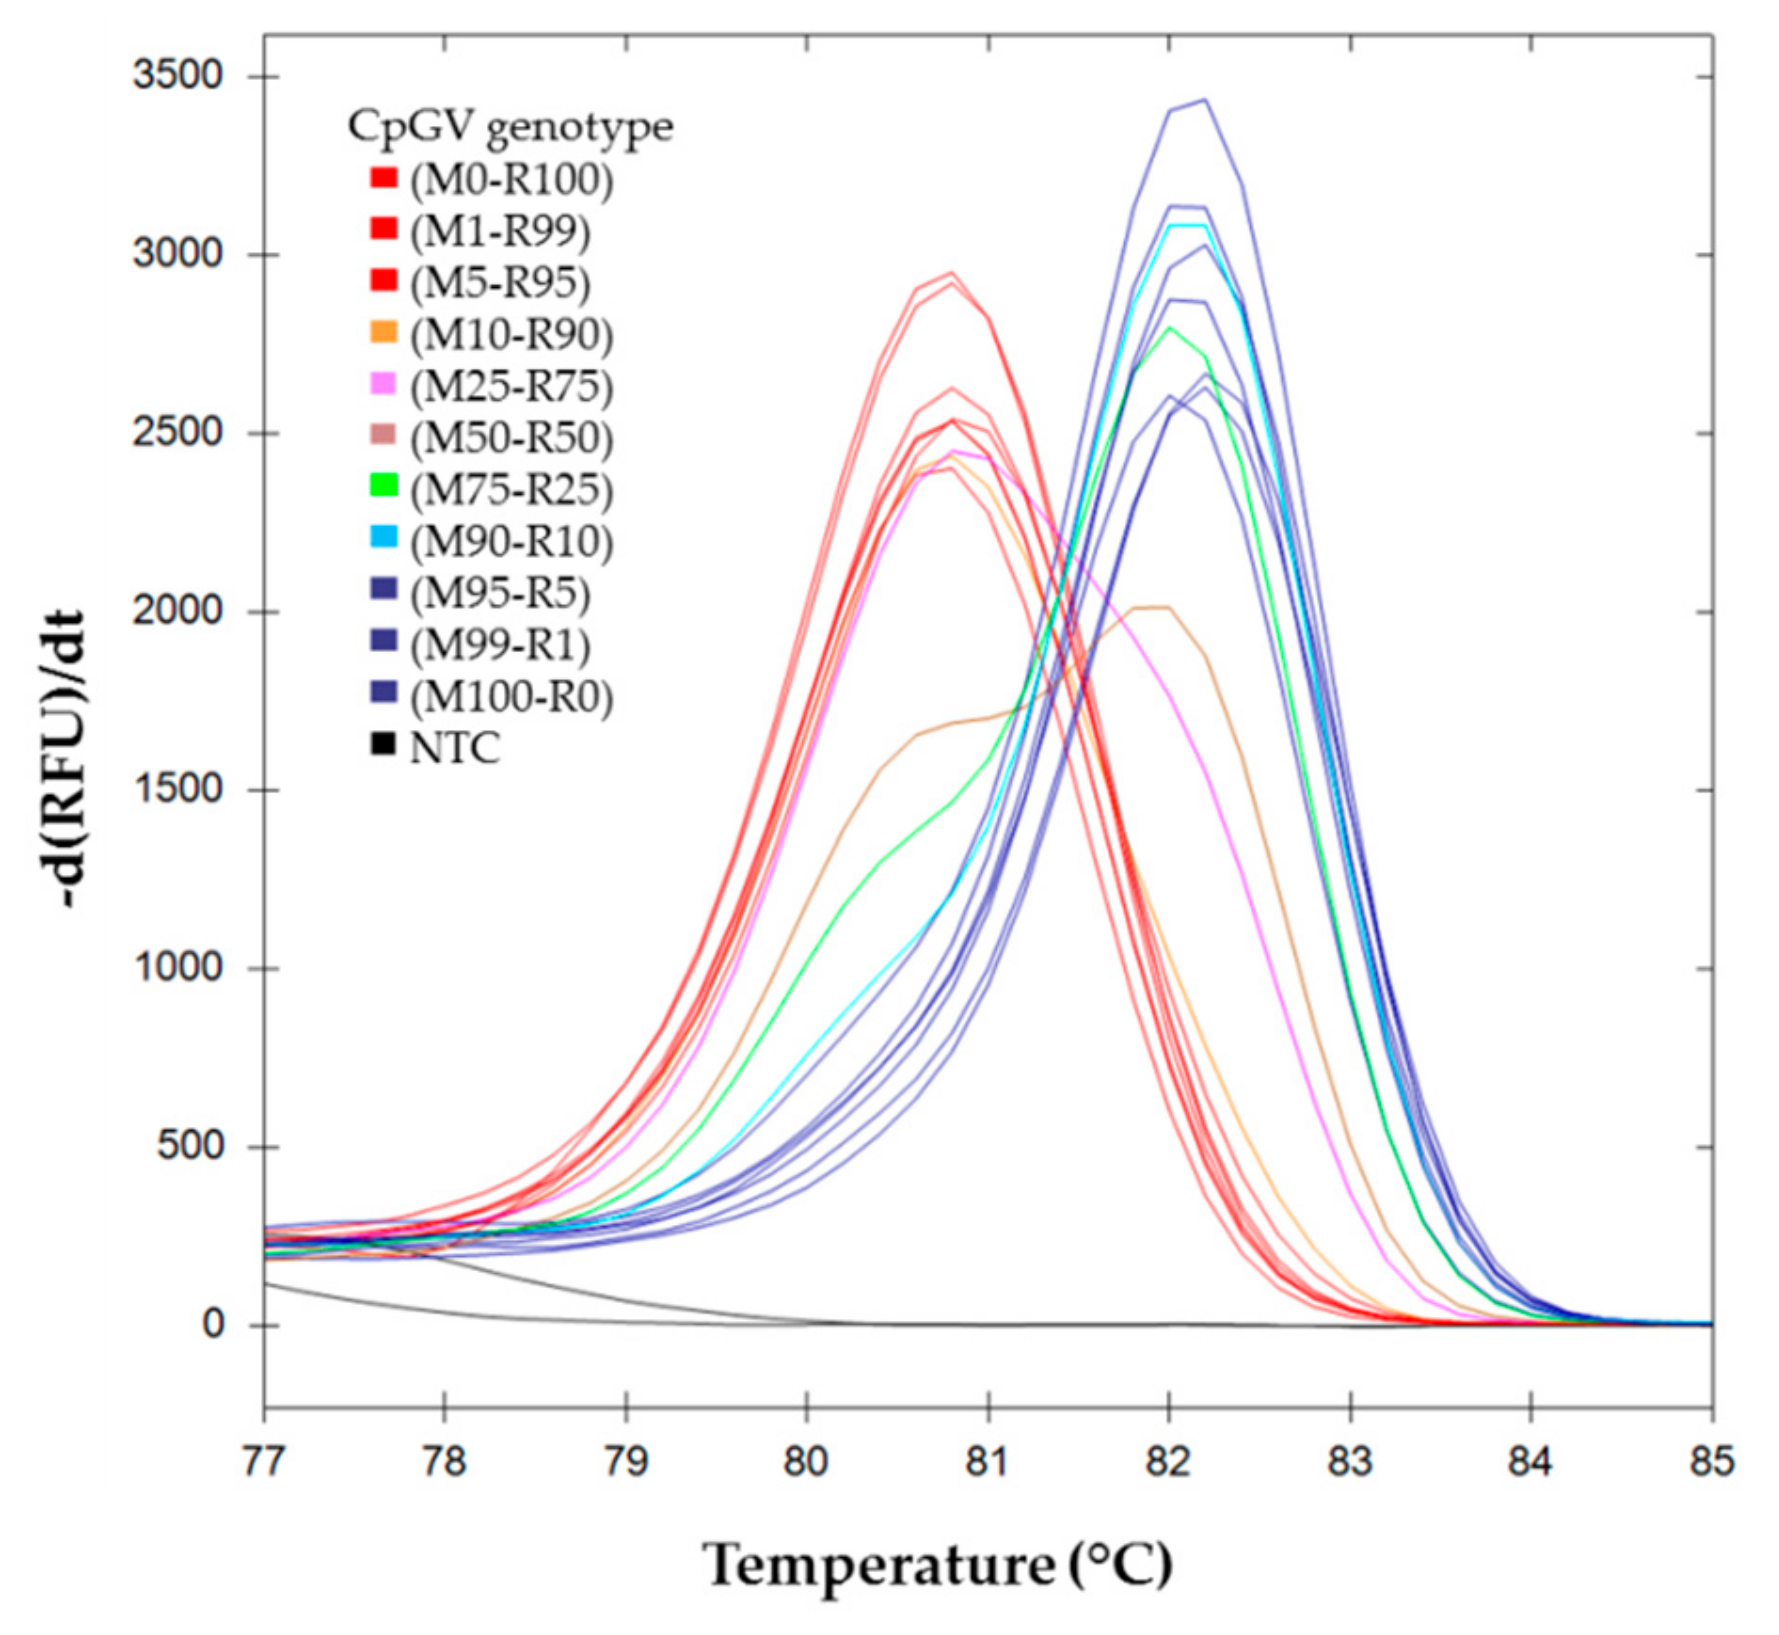
) (M0-R100), (M99-R1), (M95-R5); ( ) (M100-R0), (M1-R99) and (M5-R95); ( ) (M90-R10); ( ) (M75-R25); ( ) (M50-R50); ( ) (M25-R75); ( ) (M10-R90).
) (M10-R90).
) (M0-R100), (M99-R1), (M95-R5); ( ) (M100-R0), (M1-R99) and (M5-R95); ( ) (M90-R10); ( ) (M75-R25); ( ) (M50-R50); ( ) (M25-R75); ( ) (M10-R90). ) (M0-R100), (M99-R1), and (M95-R5); ( ) (M100-R0), (M1-R99) and (M5-R95); ( ) (M90-R10); ( ) (M75-R25); ( ) (M50-R50); ( ) (M25-R75); ( ) (M10-R90).
) (M0-R100), (M99-R1), and (M95-R5); ( ) (M100-R0), (M1-R99) and (M5-R95); ( ) (M90-R10); ( ) (M75-R25); ( ) (M50-R50); ( ) (M25-R75); ( ) (M10-R90).
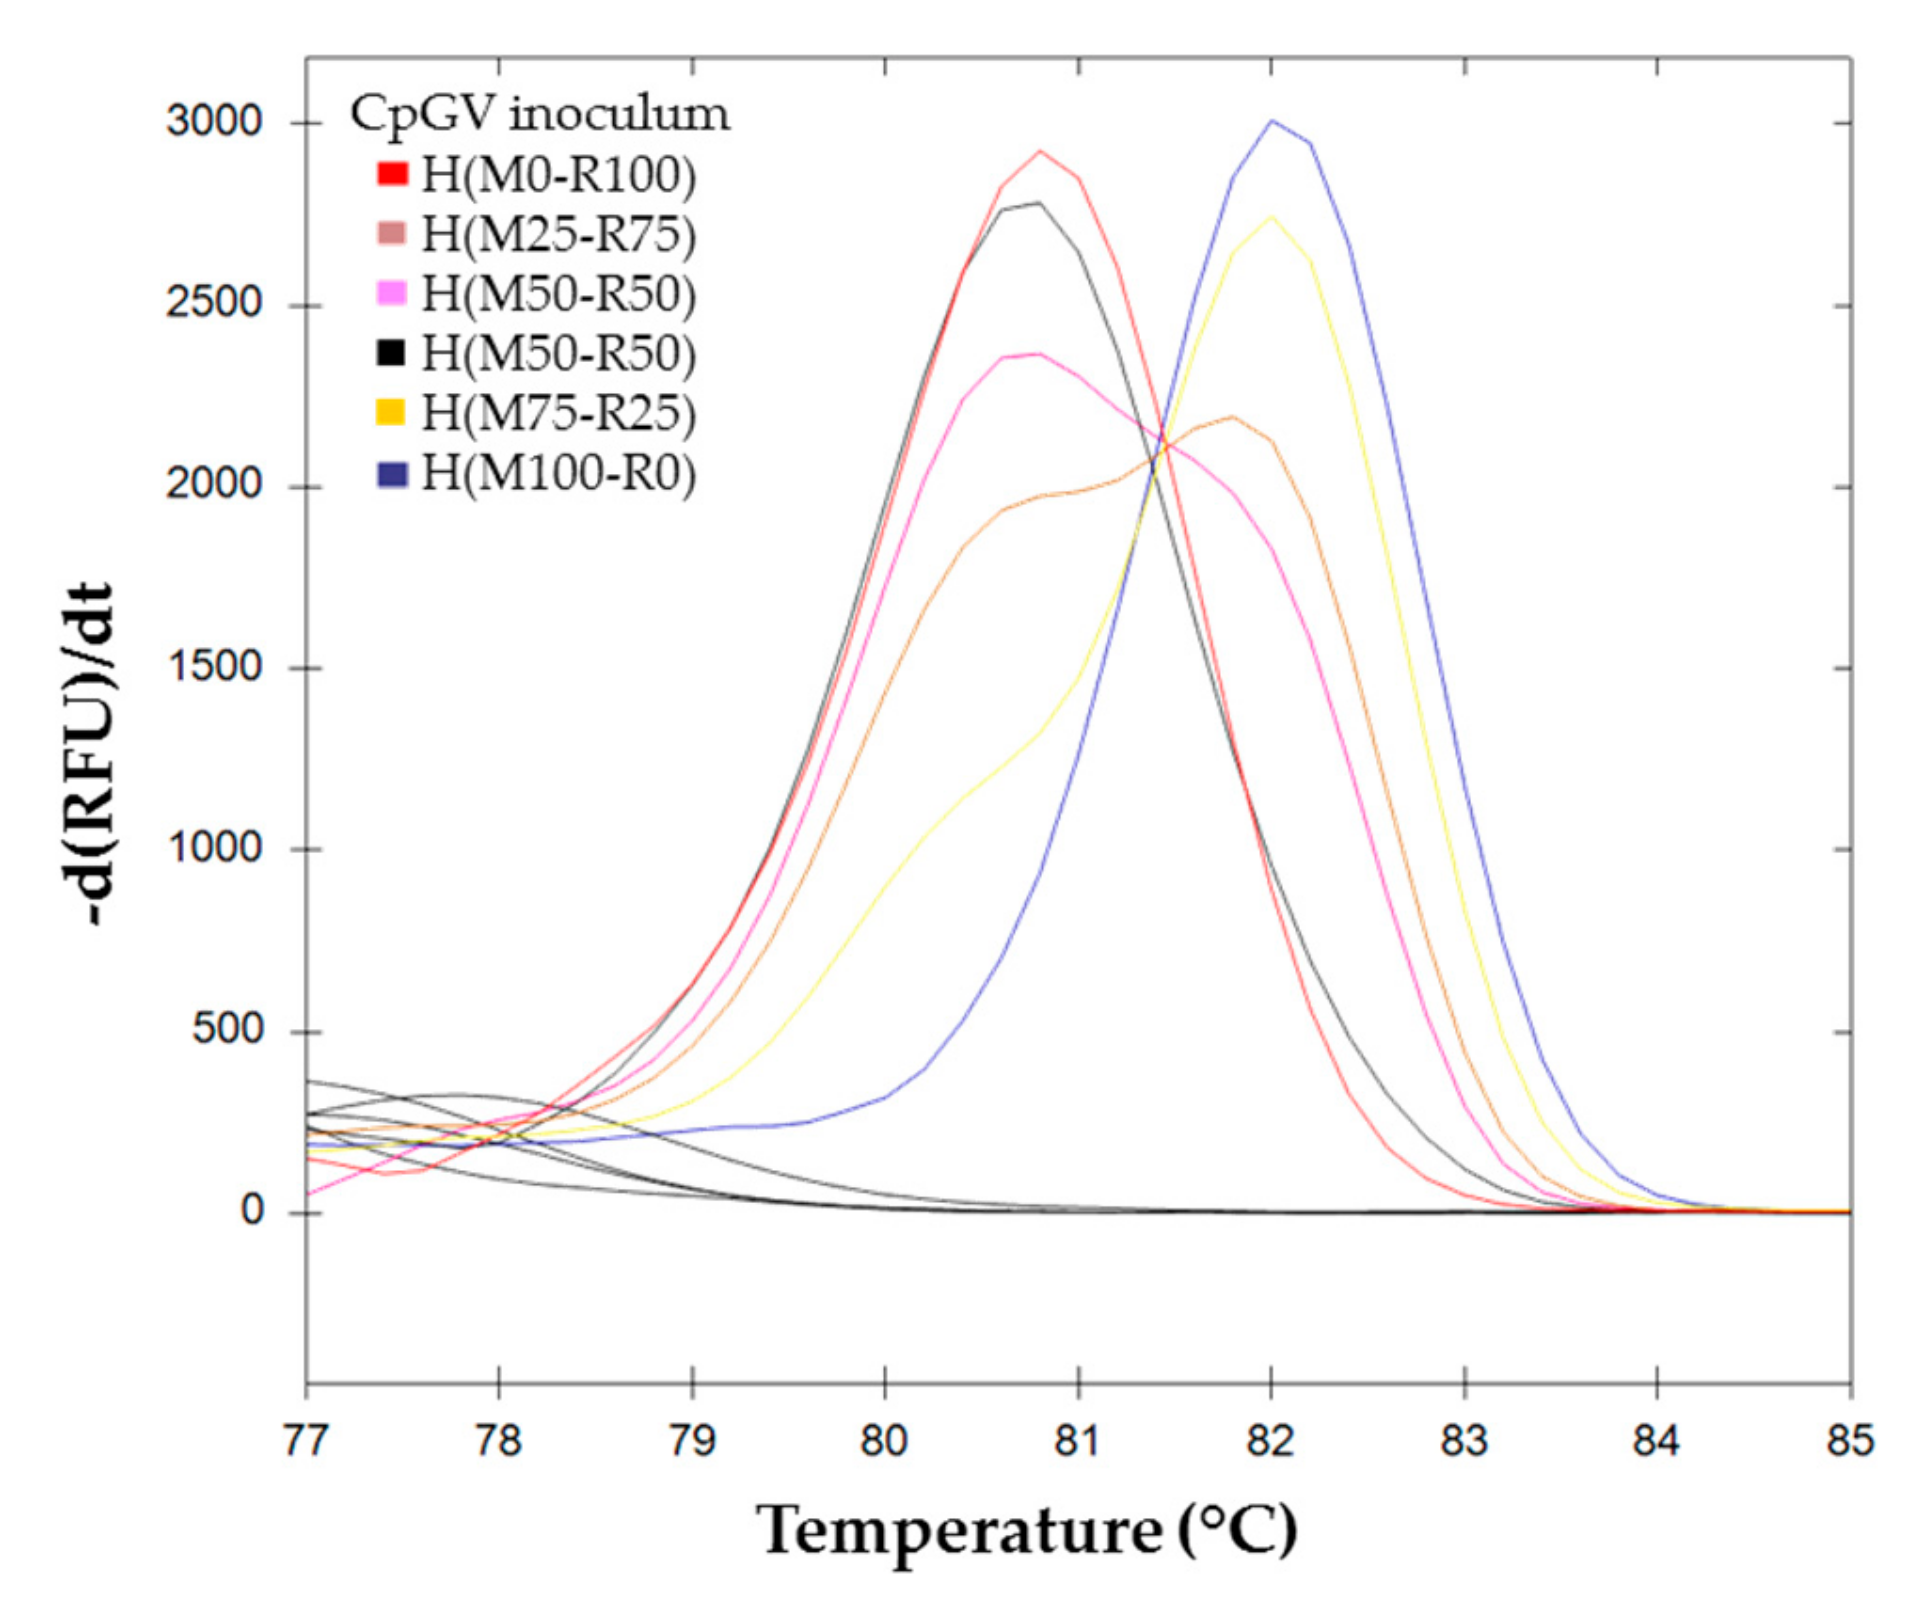
) (M0-R100), (M99-R1), and (M95-R5); ( ) (M100-R0), (M1-R99) and (M5-R95); ( ) (M90-R10); ( ) (M75-R25); ( ) (M50-R50); ( ) (M25-R75); ( ) (M10-R90).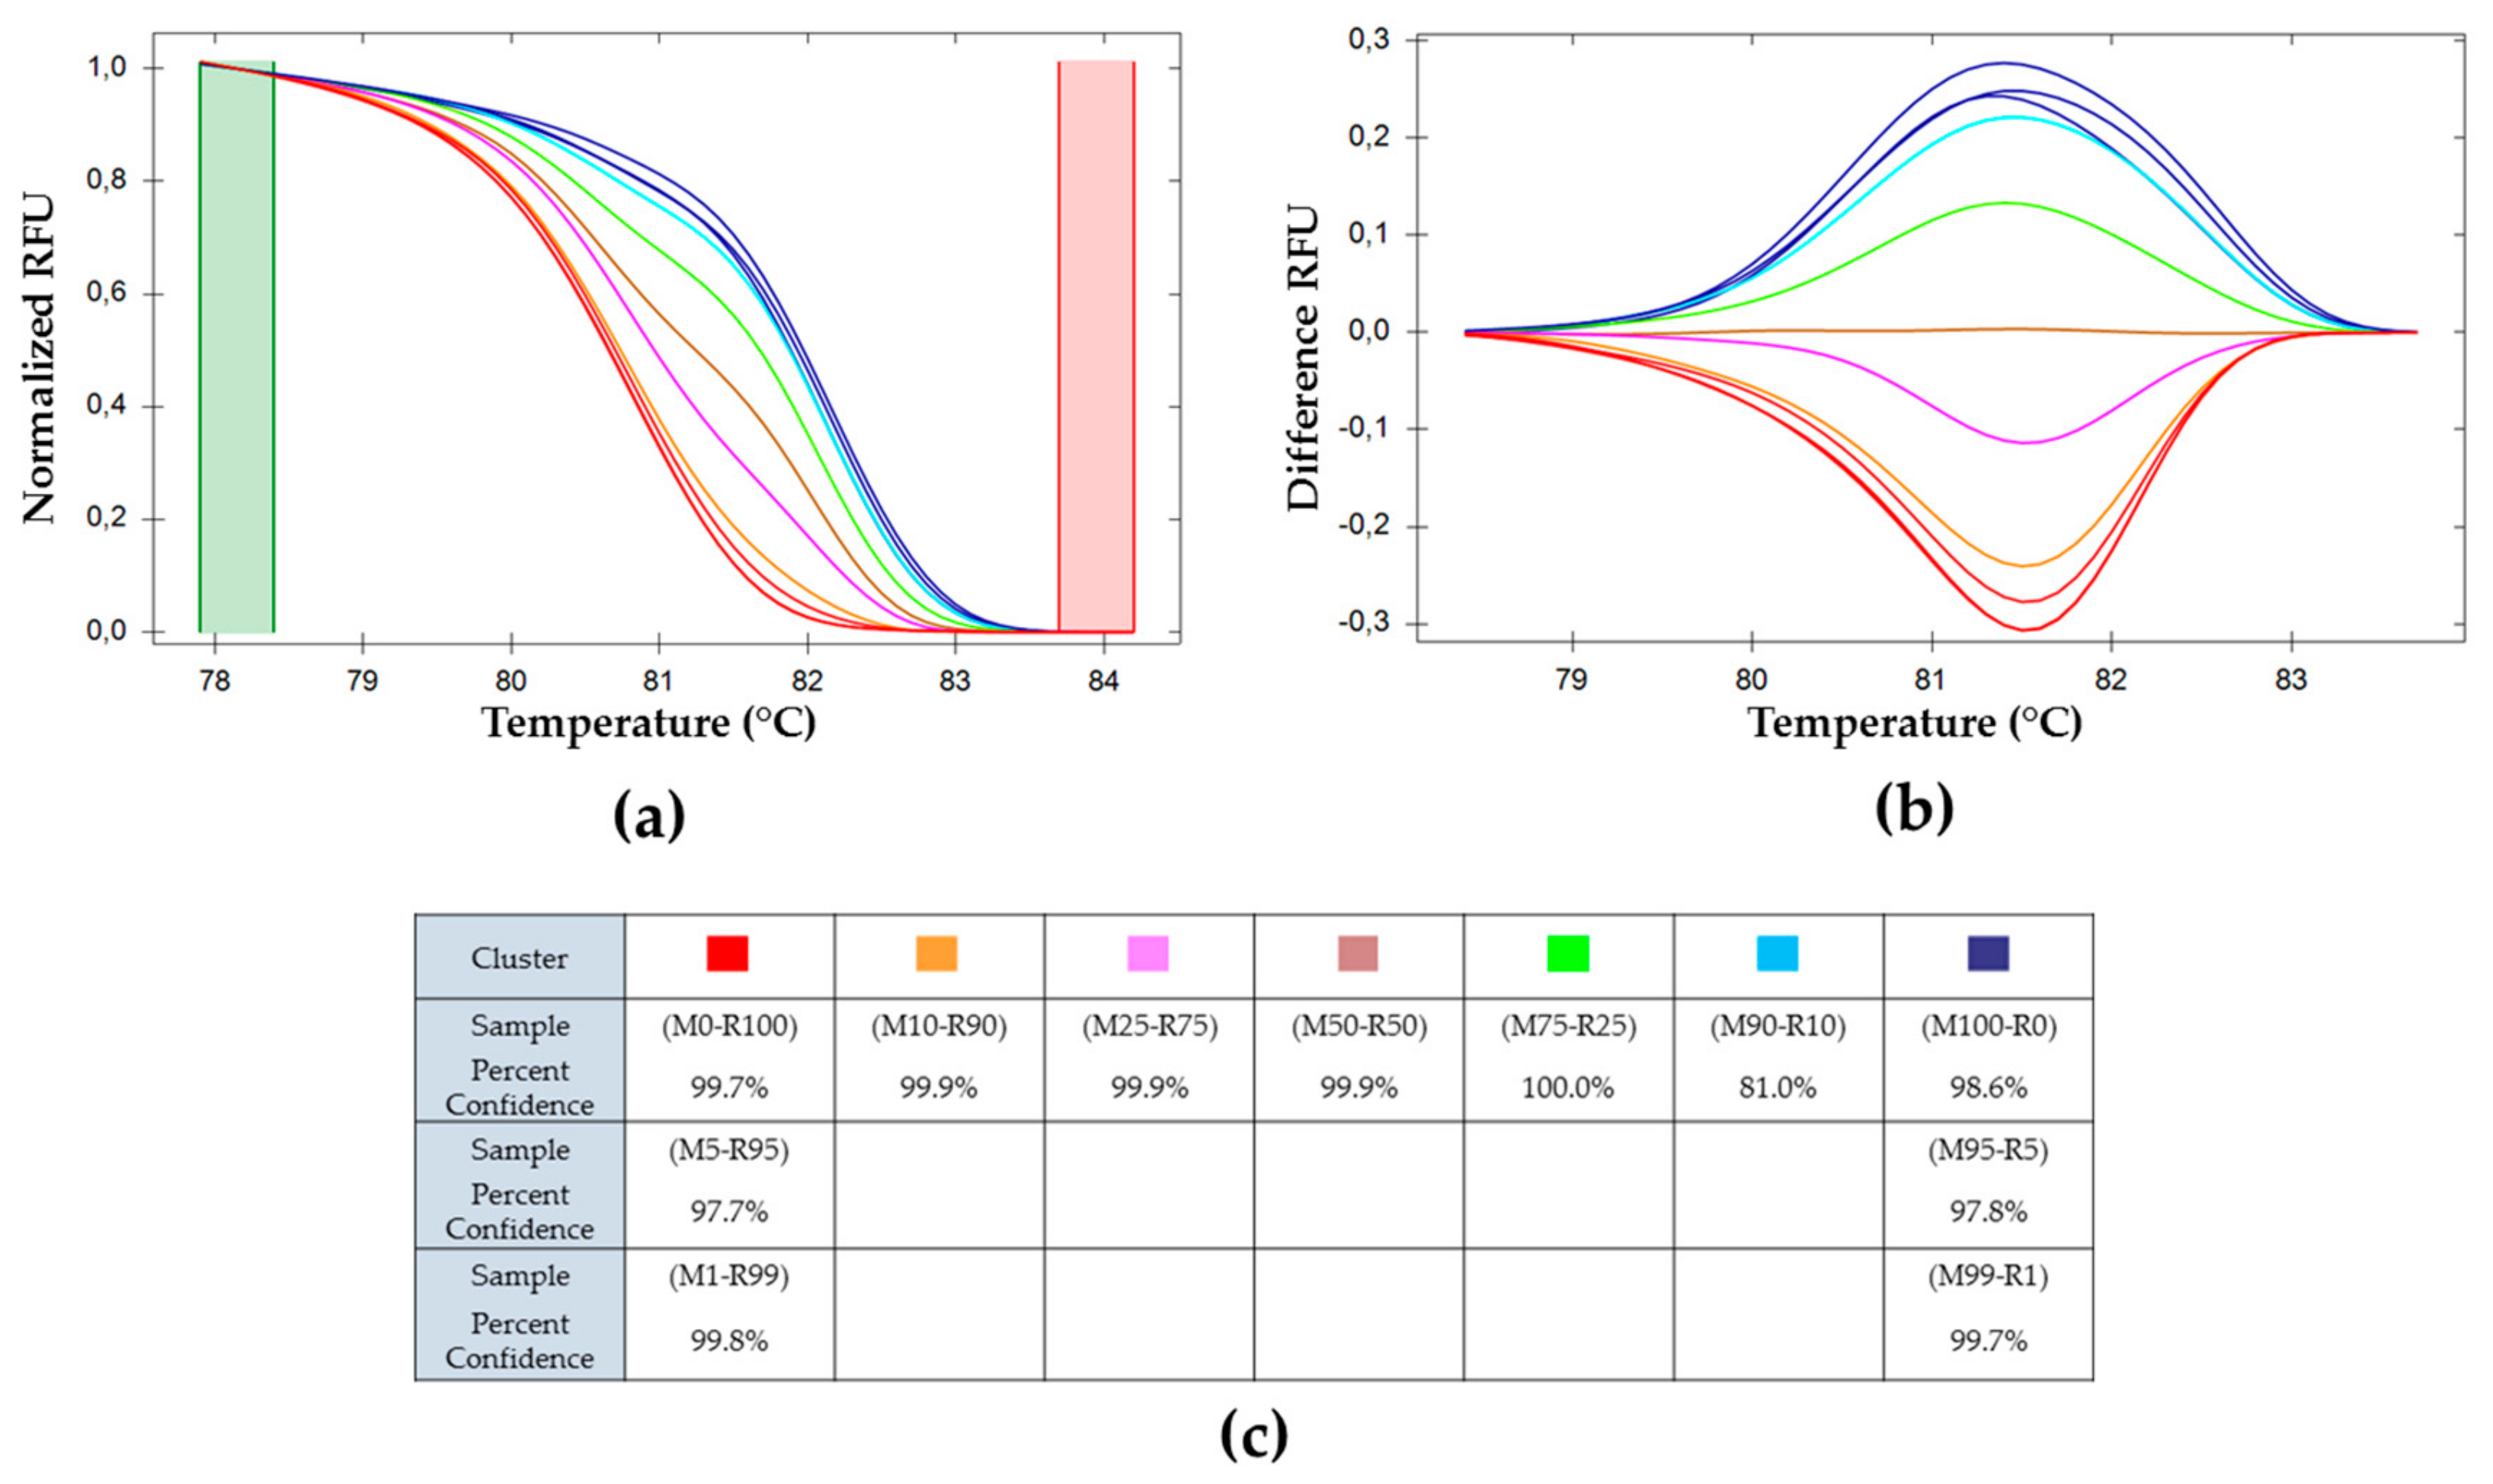 ) H(M0-R100), ( ) H(M25-R75), ( ) H(M50-R50)a, (
  ) H(M50-R50)b, (
  ) H(M75-R25), and ( ) H(M100-R0).
) H(M0-R100), ( ) H(M25-R75), ( ) H(M50-R50)a, ( ) H(M50-R50)b, ( ) H(M75-R25), and ( ) H(M100-R0).
) H(M75-R25), and ( ) H(M100-R0).
) H(M0-R100), ( ) H(M25-R75), ( ) H(M50-R50)a, ( ) H(M50-R50)b, ( ) H(M75-R25), and ( ) H(M100-R0). ) (M50-R50) of the standard range is used as reference. Cluster of the standard range is represented with dotted lines: ( ) (M0-R100); ( ) (M100-R0); ( ) (M10-R90); ( ) (M25-R75); ( ) (M50-R50); ( ) (M75-R25); ( ) (M90-R10). BVs resulting from each inoculum: ( ) H(M0-R100); ( ) H(M25-R75); ( ) H(M50-R50)a; ( ) H(M50-R50)b; ( ) H(M75-R25) and ( ) H(M100–R0). (c) Percent of confidence for each sample belonging to a cluster.
) (M50-R50) of the standard range is used as reference. Cluster of the standard range is represented with dotted lines: ( ) (M0-R100); ( ) (M100-R0); ( ) (M10-R90); ( ) (M25-R75); ( ) (M50-R50); ( ) (M75-R25); ( ) (M90-R10). BVs resulting from each inoculum: ( ) H(M0-R100); ( ) H(M25-R75); ( ) H(M50-R50)a; ( ) H(M50-R50)b; ( ) H(M75-R25) and ( ) H(M100–R0). (c) Percent of confidence for each sample belonging to a cluster.
) (M50-R50) of the standard range is used as reference. Cluster of the standard range is represented with dotted lines: ( ) (M0-R100); ( ) (M100-R0); ( ) (M10-R90); ( ) (M25-R75); ( ) (M50-R50); ( ) (M75-R25); ( ) (M90-R10). BVs resulting from each inoculum: ( ) H(M0-R100); ( ) H(M25-R75); ( ) H(M50-R50)a; ( ) H(M50-R50)b; ( ) H(M75-R25) and ( ) H(M100–R0). (c) Percent of confidence for each sample belonging to a cluster. ) P(M0-R100); ( ) P(M10-R90); ( ) P(M50-R50); ( ) P(M90-R10); ( ) P(M99-R1); ( ) P(M100-R0).
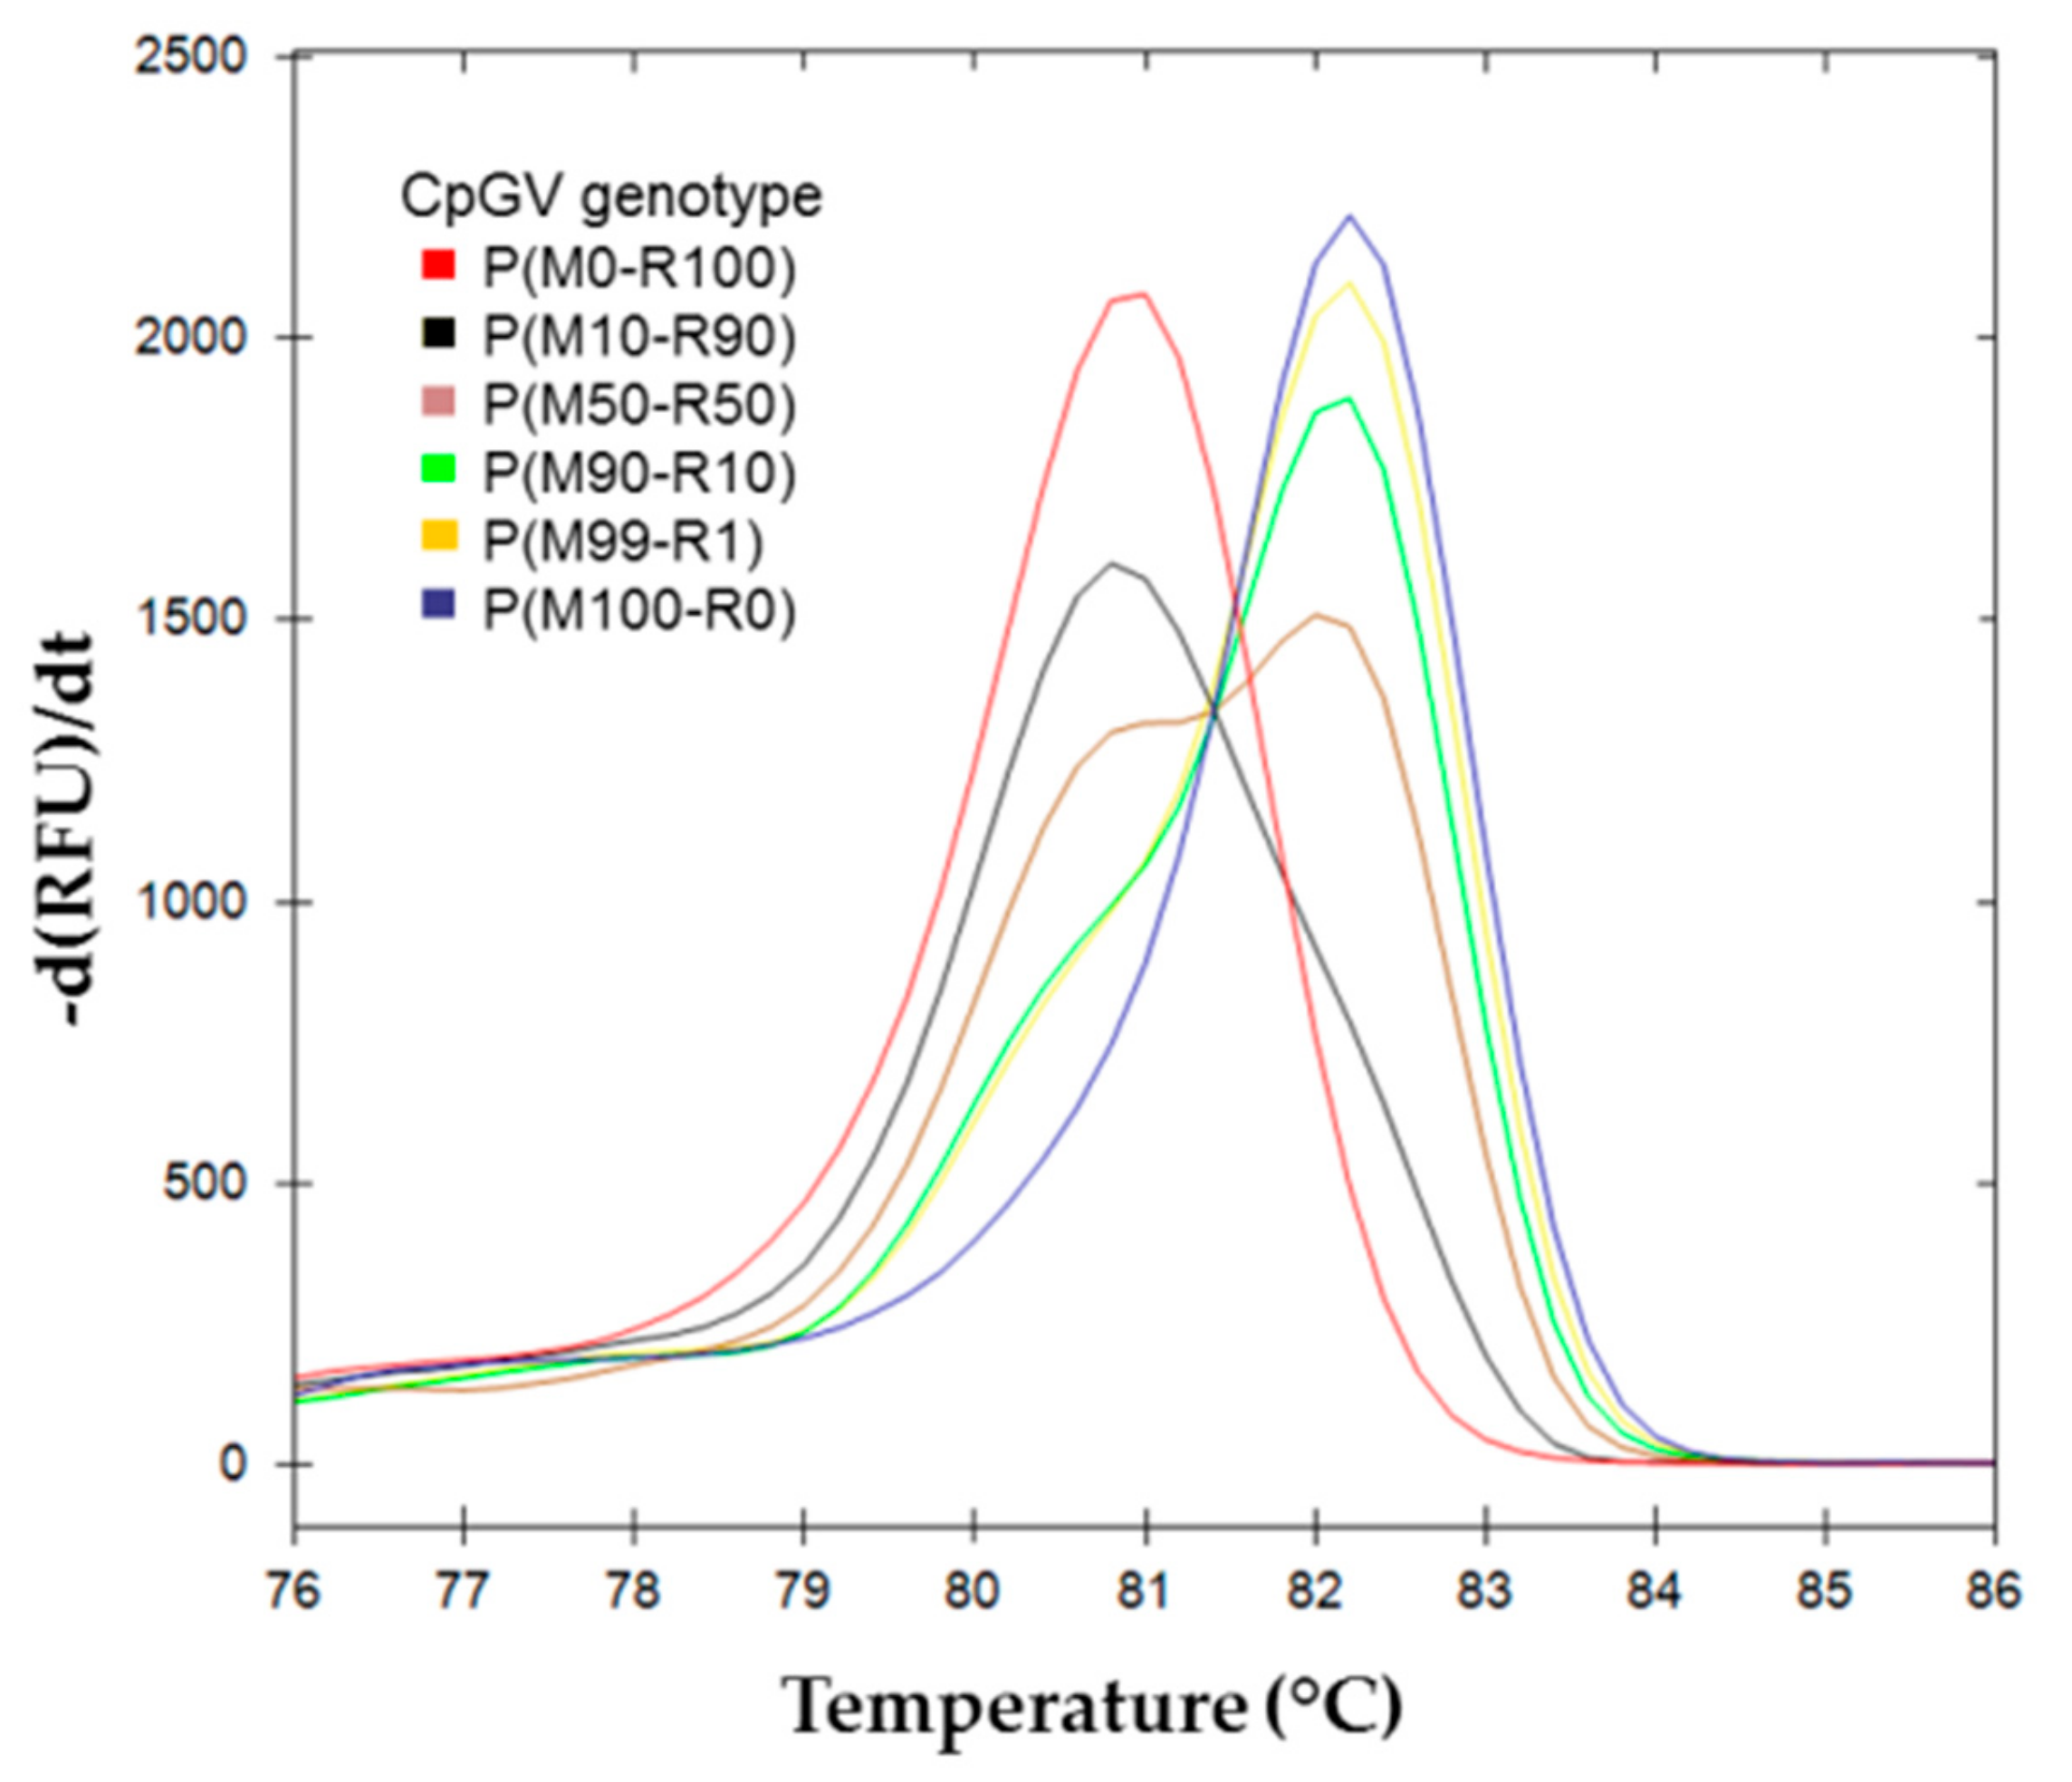
) P(M0-R100); ( ) P(M10-R90); ( ) P(M50-R50); ( ) P(M90-R10); ( ) P(M99-R1); ( ) P(M100-R0).
) P(M0-R100); ( ) P(M10-R90); ( ) P(M50-R50); ( ) P(M90-R10); ( ) P(M99-R1); ( ) P(M100-R0). ) (M50-R50) used as reference. Cluster of the standard range is represented in dotted lines: ( ) (M0-R100), ( ) (M100-R0), ( ) (M10-R90), ( ) (M25-R75), ( ) (M50-R50), ( ) (M75-R25), and ( ) (M90-R10). OBs resulting from each inoculum: ( ) P(M0-R100), ( ) P(M10-R90), ( ) P(M50-R50), ( ) P(M90-R10), ( ) P(M99-R1), and ( ) P(M100-R0). (c) Percent of confidence for each sample to belong to a cluster.
) (M50-R50) used as reference. Cluster of the standard range is represented in dotted lines: ( ) (M0-R100), ( ) (M100-R0), ( ) (M10-R90), ( ) (M25-R75), ( ) (M50-R50), ( ) (M75-R25), and ( ) (M90-R10). OBs resulting from each inoculum: ( ) P(M0-R100), ( ) P(M10-R90), ( ) P(M50-R50), ( ) P(M90-R10), ( ) P(M99-R1), and ( ) P(M100-R0). (c) Percent of confidence for each sample to belong to a cluster.
) (M50-R50) used as reference. Cluster of the standard range is represented in dotted lines: ( ) (M0-R100), ( ) (M100-R0), ( ) (M10-R90), ( ) (M25-R75), ( ) (M50-R50), ( ) (M75-R25), and ( ) (M90-R10). OBs resulting from each inoculum: ( ) P(M0-R100), ( ) P(M10-R90), ( ) P(M50-R50), ( ) P(M90-R10), ( ) P(M99-R1), and ( ) P(M100-R0). (c) Percent of confidence for each sample to belong to a cluster.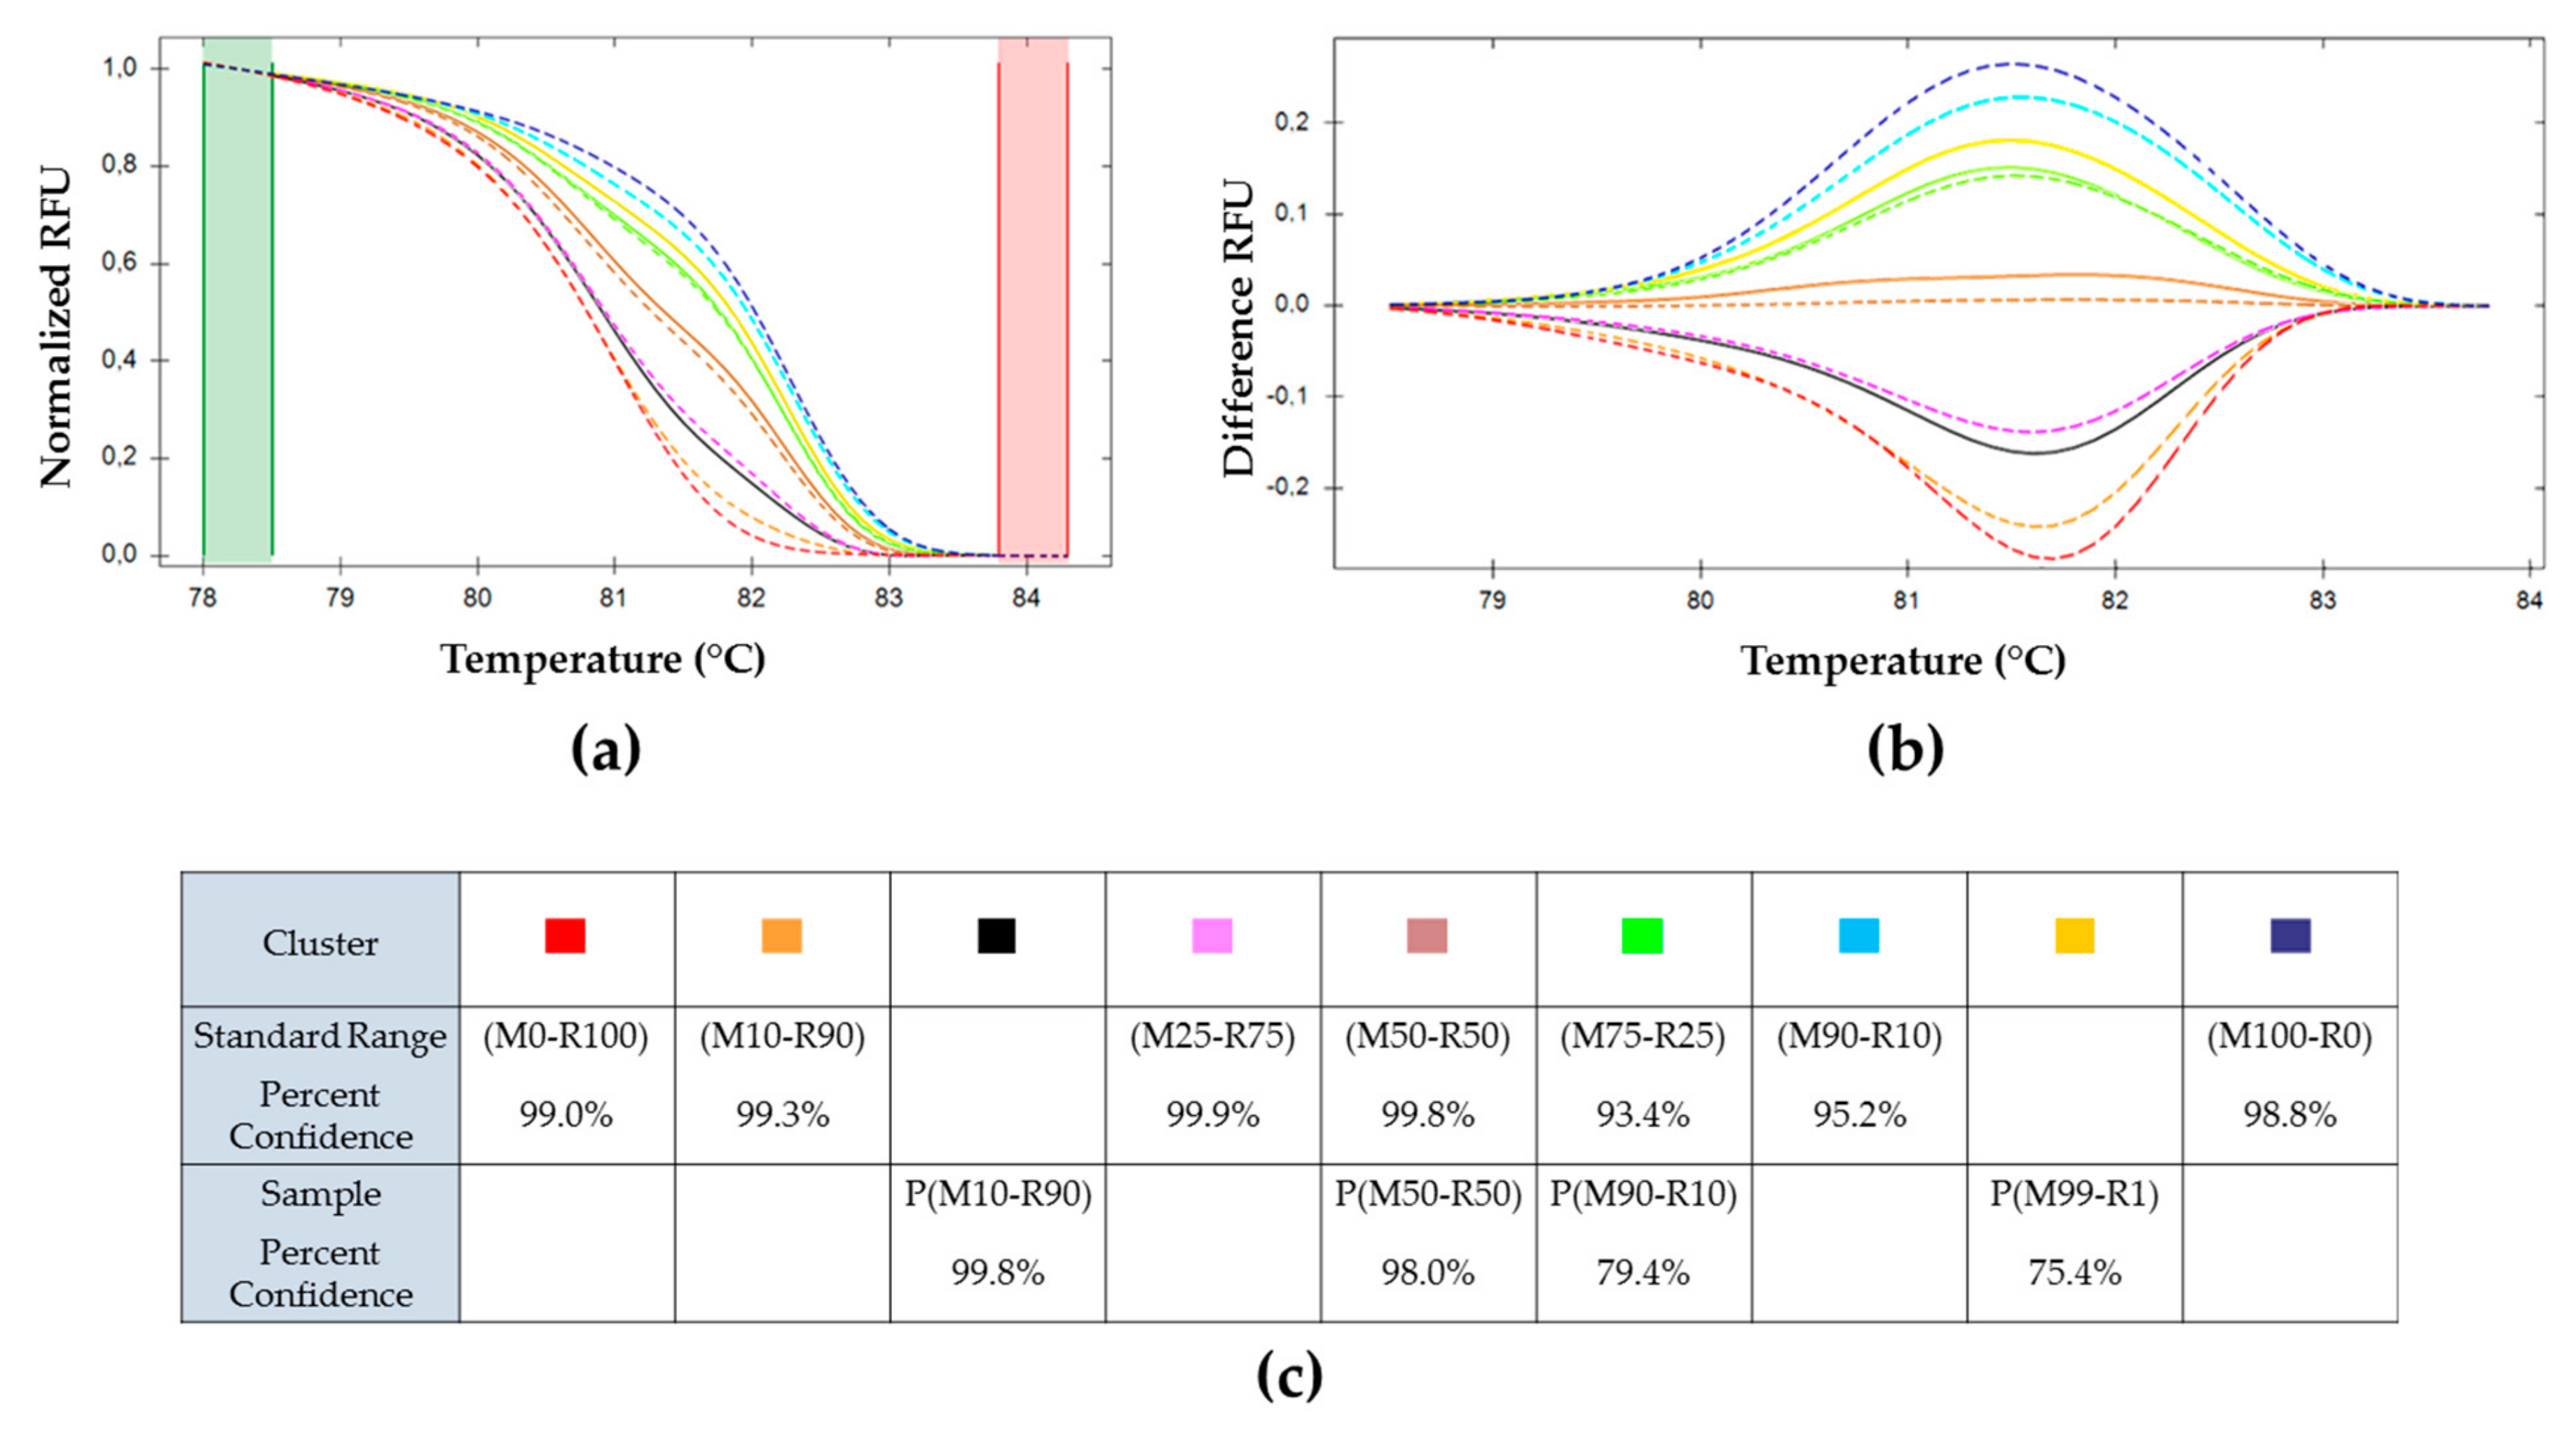
© 2019 by the authors. Licensee MDPI, Basel, Switzerland. This article is an open access article distributed under the terms and conditions of the Creative Commons Attribution (CC BY) license (http://creativecommons.org/licenses/by/4.0/).
Share and Cite
Hinsberger, A.; Theulier Saint Germain, S.; Guerrero, P.; Blachère-López, C.; López-Ferber, M.; Bayle, S. A Combination of Real-Time PCR and High-Resolution Melting Analysis to Detect and Identify CpGV Genotypes Involved in Type I Resistance. Viruses 2019, 11, 723. https://doi.org/10.3390/v11080723
Hinsberger A, Theulier Saint Germain S, Guerrero P, Blachère-López C, López-Ferber M, Bayle S. A Combination of Real-Time PCR and High-Resolution Melting Analysis to Detect and Identify CpGV Genotypes Involved in Type I Resistance. Viruses. 2019; 11(8):723. https://doi.org/10.3390/v11080723
Chicago/Turabian StyleHinsberger, Aurélie, Stéphane Theulier Saint Germain, Patrice Guerrero, Christine Blachère-López, Miguel López-Ferber, and Sandrine Bayle. 2019. "A Combination of Real-Time PCR and High-Resolution Melting Analysis to Detect and Identify CpGV Genotypes Involved in Type I Resistance" Viruses 11, no. 8: 723. https://doi.org/10.3390/v11080723
APA StyleHinsberger, A., Theulier Saint Germain, S., Guerrero, P., Blachère-López, C., López-Ferber, M., & Bayle, S. (2019). A Combination of Real-Time PCR and High-Resolution Melting Analysis to Detect and Identify CpGV Genotypes Involved in Type I Resistance. Viruses, 11(8), 723. https://doi.org/10.3390/v11080723