EHDV-2 Infection Prevalence Varies in Culicoides sonorensis after Feeding on Infected White-Tailed Deer over the Course of Viremia

 ,
,  ,
,
Abstract
1. Introduction
2. Materials and Methods
2.1. Animals and Culicoides
2.2. Virus and Inoculum
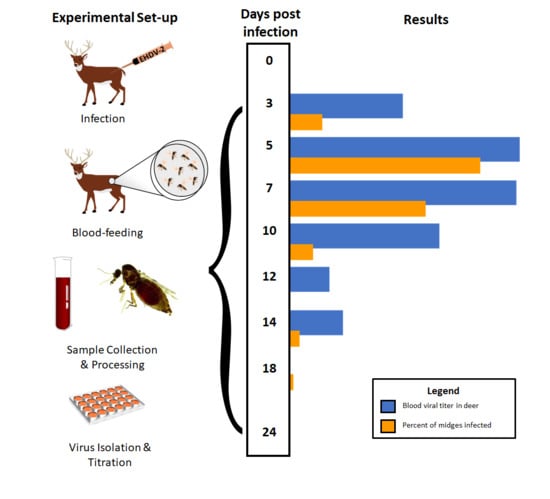
2.3. Experimental Design
2.4. Virology and Serology
2.4.1. Deer
2.4.2. Culicoides
2.5. Statistics
3. Results
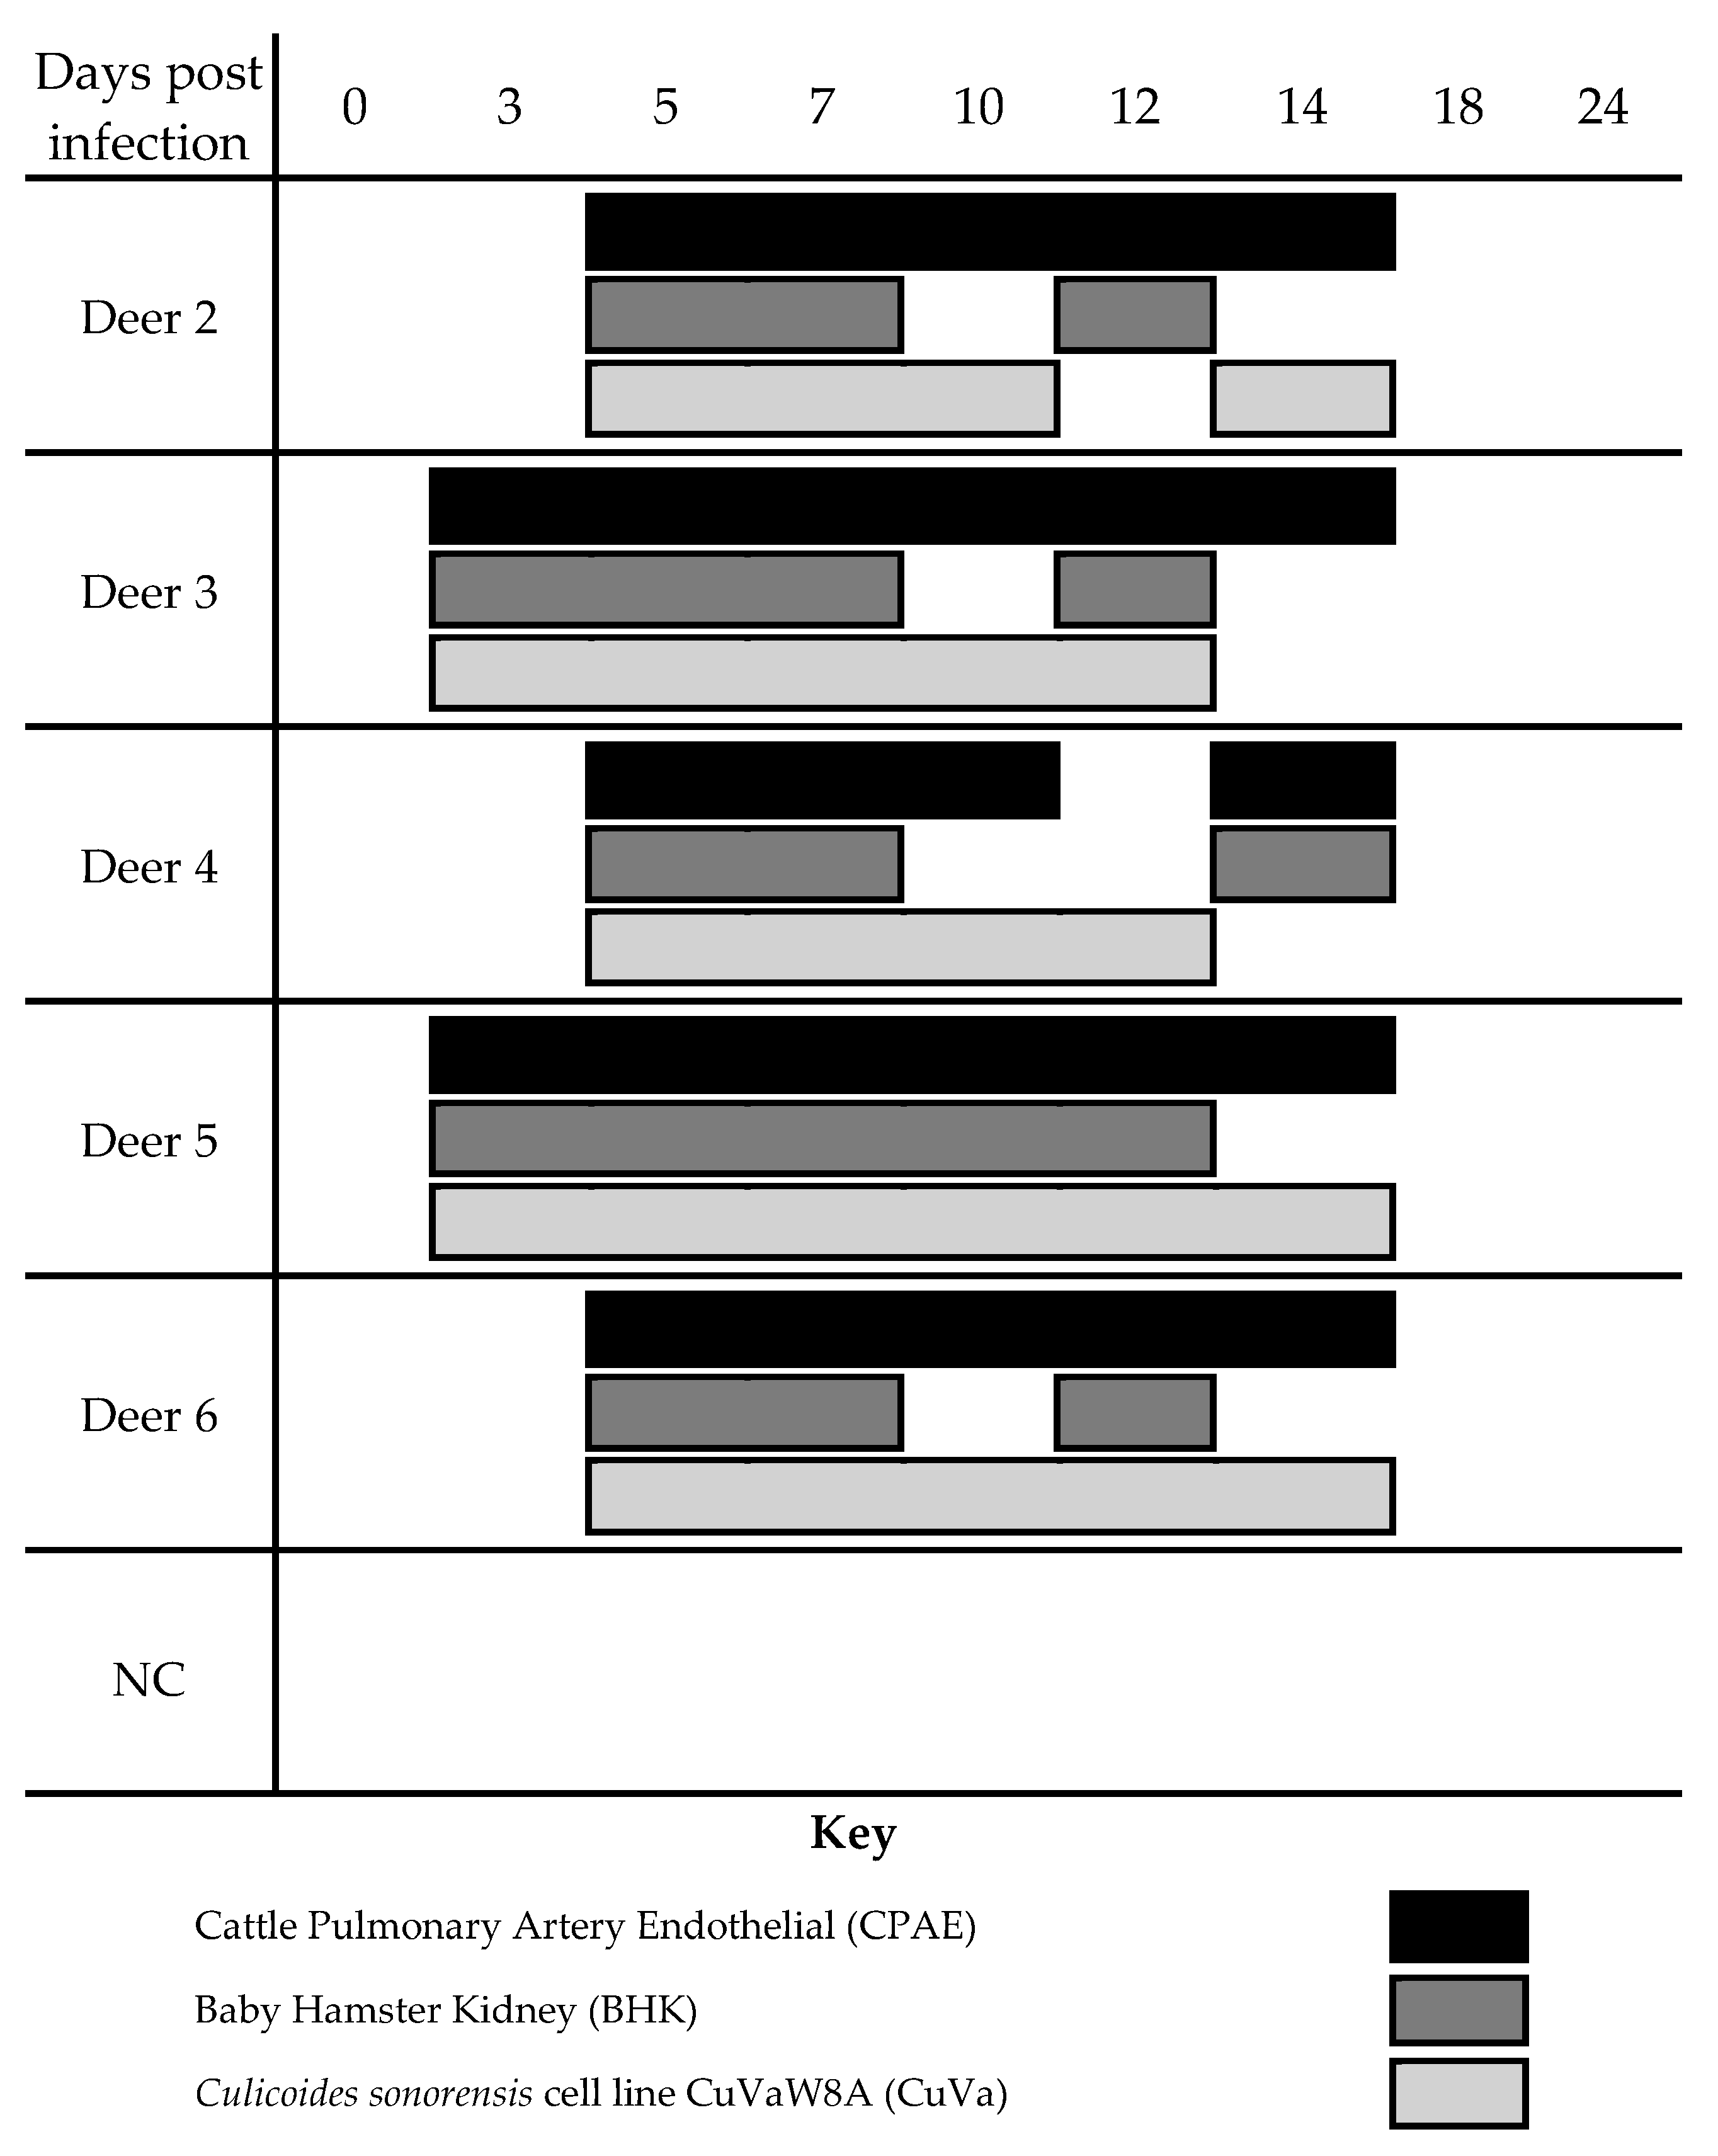
3.1. WTD Infection
3.2. C. sonorensis Infection
4. Discussion
Author Contributions
Funding
Acknowledgments
Conflicts of Interest
References
- Anthony, S.J.; Maan, S.; Maan, N.; Kgosana, L.; Bachanek-Bankowska, K.; Batten, C.; Darpel, K.E.; Sutton, G.; Attoui, H.; Mertens, P.P. Genetic and phylogenetic analysis of the outer-coat proteins vp2 and vp5 of epizootic haemorrhagic disease virus (EHDV): Comparison of genetic and serological data to characterise the ehdv serogroup. Virus Res. 2009, 145, 200–210. [Google Scholar] [CrossRef]
- Allison, A.B.; Goekjian, V.H.; Potgieter, A.C.; Wilson, W.C.; Johnson, D.J.; Mertens, P.P.; Stallknecht, D.E. Detection of a novel reassortant epizootic hemorrhagic disease virus (EHDV) in the USA containing RNA segments derived from both exotic (EHDV-6) and endemic (EHDV-2) serotypes. J. General Virol. 2010, 91, 430–439. [Google Scholar] [CrossRef] [PubMed]
- Ruder, M.G.; Lysyk, T.J.; Stallknecht, D.E.; Foil, L.D.; Johnson, D.J.; Chase, C.C.; Dargatz, D.A.; Gibbs, E.P. Transmission and epidemiology of bluetongue and epizootic hemorrhagic disease in north America: Current perspectives, research gaps, and future directions. Vector Borne Zoonotic Dis. (Larchmont, N.Y.) 2015, 15, 348–363. [Google Scholar] [CrossRef] [PubMed]
- Foster, N.M.; Breckon, R.D.; Luedke, A.J.; Jones, R.H. Transmission of two strains of epizootic hemorrhagic disease virus in deer by Culicoides variipennis. J. Wildlife Dis. 1977, 13, 9–16. [Google Scholar] [CrossRef]
- Jones, R.H.; Roughton, R.D.; Foster, N.M.; Bando, B.M. Culicoides, the vector of epizootic hemorrhagic disease in white-tailed deer in kentucky in 1971. J. Wildlife Dis. 1977, 13, 2–8. [Google Scholar] [CrossRef]
- Smith, K.E.; Stallknecht, D.E.; Nettles, V.F. Experimental infection of Culicoides lahillei (diptera: Ceratopogonidae) with epizootic hemorrhagic disease virus serotype 2 (orbivirus: Reoviridae). J. Med. Entomol. 1996, 33, 117–122. [Google Scholar] [CrossRef]
- Mullen, G.R.; Hayes, M.E.; Nusbaum, K.E. Potential vectors of bluetongue and epizootic hemorrhagic disease viruses of cattle and white-tailed deer in Alabama. Progress Clin. Biolog. Res. 1985, 178, 201–206. [Google Scholar]
- Howerth, E.W.; Stallknecht, D.E.; Kirkland, P.D. Bluetongue, epizootic hemorrhagic disease, and other orbivirus-related diseases. In Infectious Diseases of Wild Mammals; Iowa State University Press: Ames, IA, USA, 2001; pp. 77–97. [Google Scholar]
- Gaydos, J.K.; Davidson, W.R.; Elvinger, F.; Howerth, E.W.; Murphy, M.; Stallknecht, D.E. Cross-protection between epizootic hemorrhagic disease virus serotypes 1 and 2 in white-tailed deer. J. Wildlife Dis. 2002, 38, 720–728. [Google Scholar] [CrossRef] [PubMed][Green Version]
- Gaydos, J.K.; Davidson, W.R.; Elvinger, F.; Mead, D.G.; Howerth, E.W.; Stallknecht, D.E. Innate resistance to epizootic hemorrhagic disease in white-tailed deer. J. Wildlife Dis. 2002, 38, 713–719. [Google Scholar] [CrossRef][Green Version]
- Stallknecht, D.E.; Nettles, V.F.; Rollor, E.A.; Howerth, E.W. Epizootic hemorrhagic disease virus and bluetongue virus serotype distribution in white-tailed deer in georgia. J. Wildlife Dis. 1995, 31, 331–338. [Google Scholar] [CrossRef][Green Version]
- Nettles, V.F.; Stallknecht, D.E.; Davidson, W.R. Epidemiology of epizootic hemorrhagic disease viruses in wildlife in the USA. In Bluetongue, african horse sickness, and related orbiviruses: Proceedings of the second international symposium; Walton, T., Osburn, B.I., Eds.; CRC Press: Boca Raton, FL, USA, 1992; pp. 238–248. [Google Scholar]
- Quist, C.F.; Howerth, E.W.; Stallknecht, D.E.; Brown, J.; Pisell, T.; Nettles, V.F. Host defense responses associated with experimental hemorrhagic disease in white-tailed deer. J. Wildl. Dis. 1997, 33, 584–599. [Google Scholar] [CrossRef][Green Version]
- Mills, M.K.; Michel, K.; Pfannenstiel, R.S.; Ruder, M.G.; Veronesi, E.; Nayduch, D. Culicoides–virus interactions: Infection barriers and possible factors underlying vector competence. Curr. Opin. Insect Sci. 2017, 22, 7–15. [Google Scholar] [CrossRef]
- Fu, H.; Leake, C.J.; Mertens, P.P.; Mellor, P.S. The barriers to bluetongue virus infection, dissemination and transmission in the vector, culicoides variipennis (diptera: Ceratopogonidae). Arch. Virol. 1999, 144, 747–761. [Google Scholar] [CrossRef]
- Ruder, M.G.; Stallknecht, D.E.; Howerth, E.W.; Carter, D.L.; Pfannenstiel, R.S.; Allison, A.B.; Mead, D.G. Effect of temperature on replication of epizootic hemorrhagic disease viruses in culicoides sonorensis (diptera: Ceratopogonidae). J. Med. Entomol. 2015, 52, 1050–1059. [Google Scholar] [CrossRef][Green Version]
- Ruder, M.G.; Howerth, E.W.; Stallknecht, D.E.; Allison, A.B.; Carter, D.L.; Drolet, B.S.; Klement, E.; Mead, D.G. Vector competence of culicoides sonorensis (diptera: Ceratopogonidae) to epizootic hemorrhagic disease virus serotype 7. Parasites Vectors 2012, 5, 236. [Google Scholar]
- Wechsler, S.J.; McHolland, L.E.; Tabachnick, W.J. Cell lines from culicoides variipennis (diptera: Ceratopogonidae) support replication of bluetongue virus. J. Invertebr. Pathol. 1989, 54, 385–393. [Google Scholar] [CrossRef]
- Nayduch, D.; Cohnstaedt, L.W.; Saski, C.; Lawson, D.; Kersey, P.; Fife, M.; Carpenter, S. Studying culicoides vectors of BTV in the post-genomic era: Resources, bottlenecks to progress and future directions. Virus Res. 2014, 182, 43–49. [Google Scholar] [CrossRef]
- Reed, L.J.; Muench, H. A simple method of estimating fifty per cent endpoints. Am. J. Epidemiol. 1938, 27, 493–497. [Google Scholar]
- Clavijo, A.; Sun, F.; Lester, T.; Jasperson, D.C.; Wilson, W.C. An improved real-time polymerase chain reaction for the simultaneous detection of all serotypes of epizootic hemorrhagic disease virus. J. Vet. Diag. Invest. 2010, 22, 588–593. [Google Scholar] [CrossRef]
- Smith, K.E.; Stallknecht, D.E. Culicoides (diptera:Ceratopogonidae) collected during epizootics of hemorrhagic disease among captive white-tailed deer. J. Med. Entomol. 1996, 33, 507–510. [Google Scholar] [CrossRef]
- EPA. Chemical Concentration Data Near the Detection Limit; EPA 903/8–91–001: Technical Guidance Manual; Region III Office of Superfund, Hazardous Waste Management: Philadelphia, PA, USA, 1991. [Google Scholar]
- Jennings, D.M.; Mellor, P.S. Variation in the responses of culicoides variipennis (diptera, ceratopogonidae) to oral infection with bluetongue virus. Archi. Virol. 1987, 95, 177–182. [Google Scholar] [CrossRef]
- Eschbaumer, M.; Wernike, K.; Batten, C.A.; Savini, G.; Edwards, L.; Di Gennaro, A.; Teodori, L.; Oura, C.A.; Beer, M.; Hoffmann, B. Epizootic hemorrhagic disease virus serotype 7 in european cattle and sheep: Diagnostic considerations and effect of previous btv exposure. Vet. Microbiol. 2012, 159, 298–306. [Google Scholar] [CrossRef] [PubMed]
- Stallknecht, D.E.; Howerth, E.W. Epidemiology of bluetongue and epizootic haemorrhagic disease in wildlife: Surveillance methods. Veterinaria. Italiana 2004, 40, 203–207. [Google Scholar] [PubMed]


| dpi | Mean (SE) log10 Titer for Deer with Viremia | Number of Midges Evaluated | Percent (SE) of Midges Virus Isolation Positive | Percent (SE) of Midges with Titer ≥102.7 TCID50 /Midge | Mean (SE) Titer for Virus Isolation Positive Midges |
|---|---|---|---|---|---|
| 3 | 3.27 b (0.50) | 30 | 5.8 a,b (4.9) | 2.7 a (3.1) | 1.94 a,b (0.99) |
| 5 | 3.98 b (0.39) | 127 | 47.1 c (10.9) | 36.4 b (11.0) | 3.51 b (0.21) |
| 7 | 3.92 b (0.39) | 86 | 30.4 b,c (10.2) | 23.0 a,b (9.3) | 3.54 b (0.28) |
| 10 | 2.59 a,b (0.39) | 85 | 6.1 a,b (4.1) | 1.5 a (1.8) | 2.19 a,b (0.70) |
| 12 | 1.15 a (0.39) | 157 | 2 0.0 | 3 0.0 | 1 ND |
| 14 | 1.15 a (0.39) | 373 | 2.6 a (1.8) | 3 0.0 | 1.15 a (0.53) |
| 18 | 1 ND | 498 | 0.4 a (0.4) | 3 0.0 | 1.53 a,b (0.81) |
© 2019 by the authors. Licensee MDPI, Basel, Switzerland. This article is an open access article distributed under the terms and conditions of the Creative Commons Attribution (CC BY) license (http://creativecommons.org/licenses/by/4.0/).
Share and Cite
Mendiola, S.Y.; Mills, M.K.; Maki, E.; Drolet, B.S.; Wilson, W.C.; Berghaus, R.; Stallknecht, D.E.; Breitenbach, J.; McVey, D.S.; Ruder, M.G. EHDV-2 Infection Prevalence Varies in Culicoides sonorensis after Feeding on Infected White-Tailed Deer over the Course of Viremia. Viruses 2019, 11, 371. https://doi.org/10.3390/v11040371
Mendiola SY, Mills MK, Maki E, Drolet BS, Wilson WC, Berghaus R, Stallknecht DE, Breitenbach J, McVey DS, Ruder MG. EHDV-2 Infection Prevalence Varies in Culicoides sonorensis after Feeding on Infected White-Tailed Deer over the Course of Viremia. Viruses. 2019; 11(4):371. https://doi.org/10.3390/v11040371
Chicago/Turabian StyleMendiola, Sandra Y., Mary K. Mills, Elin Maki, Barbara S. Drolet, William C. Wilson, Roy Berghaus, David E. Stallknecht, Jonathan Breitenbach, D. Scott McVey, and Mark G. Ruder. 2019. "EHDV-2 Infection Prevalence Varies in Culicoides sonorensis after Feeding on Infected White-Tailed Deer over the Course of Viremia" Viruses 11, no. 4: 371. https://doi.org/10.3390/v11040371
APA StyleMendiola, S. Y., Mills, M. K., Maki, E., Drolet, B. S., Wilson, W. C., Berghaus, R., Stallknecht, D. E., Breitenbach, J., McVey, D. S., & Ruder, M. G. (2019). EHDV-2 Infection Prevalence Varies in Culicoides sonorensis after Feeding on Infected White-Tailed Deer over the Course of Viremia. Viruses, 11(4), 371. https://doi.org/10.3390/v11040371