Article

Hierarchical Environmental Factors Affecting the Distribution of Abies koreana on the Korean Peninsula

1
Division of Ecological Assessment, National Institute of Ecology, Seocheon 33657, Korea
2
Division of Ecological Survey Research, National Institute of Ecology, Seocheon 33657, Korea
3
Division of Ecological Conservation Research, National Institute of Ecology, Seocheon 33657, Korea
*
Author to whom correspondence should be addressed.
Forests 2018, 9(12), 777; https://doi.org/10.3390/f9120777
Submission received: 22 October 2018 / Revised: 10 December 2018 / Accepted: 11 December 2018 / Published: 16 December 2018
(This article belongs to the Special Issue Influence of Climate Change on Tree Growth and Forest Ecosystems)

Abstract

:
A regional decline in the Korean fir (Abies koreana) has been observed since the 1980s in the subalpine region. To explain this decline, it is important to investigate the degree to which environmental factors have contributed to plant distributions on diverse spatial scales. We applied a hierarchical regression model to determine quantitatively the relationship between the abundance of Korean fir (seedlings) and diverse environmental factors across two different ecological scales. We measured Korean fir density and the occurrence of its seedlings in 102 (84) plots nested at five sites and collected a range of environmental factors at the same plots. Our model included hierarchical explanatory variables at both site-level (weather conditions) and plot-level (micro-topographic factors, soil properties, and competing species). The occurrence of Korean fir seedlings was positively associated with moss cover and rock cover but negatively related to dwarf bamboo cover. At the site level, winter precipitation was significantly and positively related to the occurrence of seedlings. A hierarchical Poisson regression model revealed that Korean fir density was negatively associated with slope aspect, topographic position index, Quercus mongolica cover, and mean summer temperature. Our results suggest that rising temperature, drought, and competition with other species are factors that impede the survival of the Korean fir. We can predict that the population of Korean fir will continue to decline in the subalpine, and only a few Korean fir will survive on northern slopes or valleys due to climate change.

1. Introduction

Environmental differences play a critical role in species establishment and growth [1,2]. Specifically in mountain areas, the heterogeneity of topographic factors can exert strong effects on a wide variety of micro-habitats [3,4,5]. For example, different elevations, topographic position, and slope aspects can create a mosaic of diverse microclimates, and these factors can affect the distribution and diversity of species. Hence, ecological data are often hierarchically structured, and environmental variables act in a hierarchical manner on different ecological scales [6,7]. With regard to experimental designs, ecological field data often involve random effects [8]. Common random effects in field ecology data are blocks that are replicated across sites or times [9,10]. When a hierarchical relationship (or random effects) within explanatory variables is ignored, the actual results can be distorted or obscured because the assumption of independent errors is violated [8]. To quantify the contributions of environmental factors to the distribution of Korean fir on different spatial scales, we applied a multilevel/hierarchical generalized linear model, which is a more sophisticated and novel statistical technique than a simple regression model [7,8].
The Korean fir is an endemic and rare species that grows in the subalpine regions of Mount Halla, Jiri, Dukyu, and Gaya, which are located in the southern part of the Korean Peninsula [11]. This tree endures harsh environmental conditions, such as low temperatures, strong winds, and low soil nutrient levels, in its subalpine ecosystem [12,13]. It is well-known that relictual, cold-adapted subalpine plant species can be very sensitive to climate changes, such as rising temperatures and drought [14,15,16]. Climate changes can induce adverse physiological responses to the subalpine conifer trees [17,18]. Extreme weather events, such as heat waves and drought, can especially directly affect the mortality of conifer seedlings [19,20]. To establish a conservation plan for endangered tree species, it is important to determine the critical environmental factors affecting seedling mortality. The Korean fir, a subalpine cold-adapted tree, is categorized as an endangered species (EN) by the International Union for Conservation of Nature (IUCN) [21]. A regional decline in the Korean fir population has been observed since the 1980s, and has occurred for complex reasons, including rising temperatures, drought stress, and competition with other species [12,15,19,22,23]. However, those related studies were conducted in regional Korean fir forests and did not consider diverse environmental factors on a hierarchical spatial scale. Thus far, most studies have only provided a description of local Korean fir forests without reasonable statistical evidence. To explain the reason for the decline in the Korean fir population, it is crucial to investigate the degree to which different environmental factors contribute to the distribution on diverse spatial scales. Therefore, we considered a range of environmental factors, including climatic factors, topographic factors, soil properties, and competition with other species. The objective of this study was to determine quantitatively the relationship between the abundance of Korean fir seedlings and diverse environmental factors across a range of ecological scales. Additionally, we explored potential future changes in Korean fir distribution patterns.

2. Materials and Methods
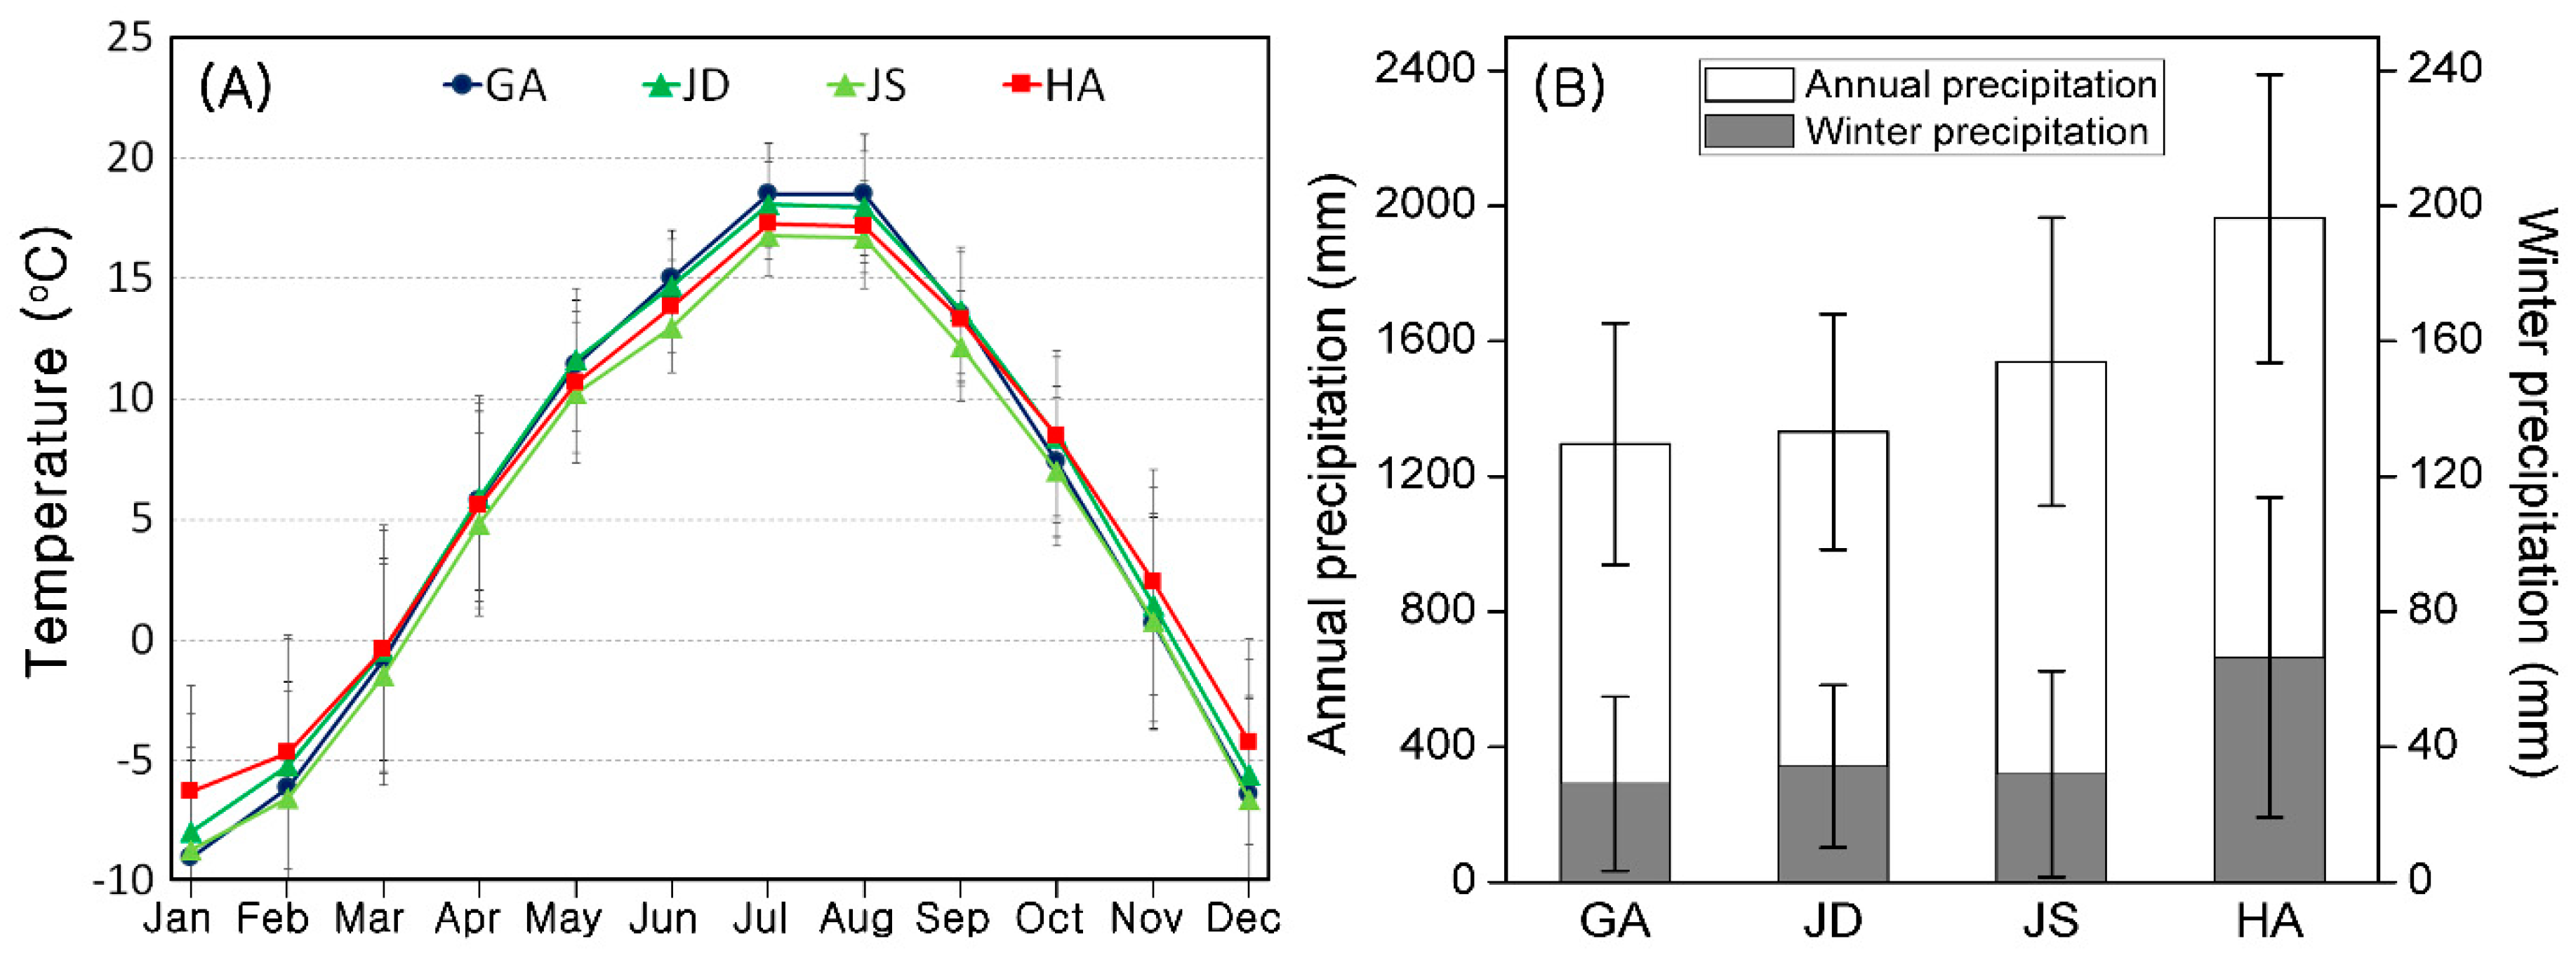
2.1. Study Sites

The sites chosen for this study were five Korean fir forests on Mt. Gaya, Mt. Jiri, and Mt. Halla, all of which are located in the southern part of the Korean Peninsula (Figure 1).
The bedrock types at the Mt. Gaya and Mt. Jiri sites consist of granite and gneiss. Mt. Halla is a dormant volcano, and the surface of this region is composed of volcanic rock types, such as andesite and basalt [24]. The altitude at the summit of Mt. Gaya is 1430 m. Mt. Jiri is the second highest mountain (1915 m) in South Korea, followed by Mt. Halla (1947 m). The study sites experience low levels of winter precipitation (about 2–5% of total annual precipitation), and more than half of the annual precipitation falls in the summer. Mt. Halla has higher winter temperatures and annual precipitation rates than the other sites due to oceanic effects (Figure 2). Mt. Gaya and Mt. Jiri are dominated by Korean fir at higher elevations (>1300 m), and the Korean fir trees mix with Quercus mongolica, Pinus densiflora, Betula ermanii, and Magnolia sieboldii at lower elevations (<1300 m) [25,26]. Korean fir forests on Mt. Halla are found at elevations ranging from 1400 to 1800 m above sea level, with these trees are mixed with Taxus cuspidate, Betula ermanii, and Prunus sargentii [27]. The tree species composition in the studied plots at the three mountain sites differed based on importance values (IV = (relative coverage + relative frequency)/2). On Mt. Gaya, Abies koreana (IV = 27.7%), Q. mongolica (IV = 22.9%), Fraxinus sieboldiana (IV = 10.6%), and Betula ermani (IV = 8.9%) were the species with the greatest importance values, whereas on Mt. Jiri, A. koreana (IV = 46.1%), Q. mongolica (IV = 17.5%), and Pinus koraiensis (IV = 8.9%) had the greatest importance values. On Mt. Halla, the species with the greatest importance values were A. koreana (IV = 63.8%), Prunus maximowiczii (IV = 10.5%), Betula ermani (IV = 7.4%), and Q. mongolica (IV = 6.1). In addition, the diameter at breast height (DBH) of A. koreana on Mt. Gaya was smaller than that on the other mountains (Gaya: 10.1 ± 0.5 cm; Jiri: 11.9 ± 0.8 cm; Halla: 12 ± 0.3 cm), and the height of A. koreana on Mt. Gaya and Mt. Halla was smaller than that on Mt. Jiri (Gaya: 5.7 ± 0.3 m; Jiri: 7.2 ± 0.4 m; Halla: 5.3 ± 0.3). Our study was conducted in natural stands of the subalpine forest because the species’ compositions and heights were completely different in the natural A. koreana forests versus the restoration sites.

2.2. Sampling Design and Species Data Collection

We collected data using a random sampling design at five Korean fir forest plot sites in September of 2015 and June of 2016. For each sampling plot, a 100 m2 plot was set to survey the density of Korean fir trees, but when the average height of trees in the plot was 10 m or above, we sampled a 400 m2 plot. For unbiased random sampling, we considered the distance of each sampling plot (the minimum distance of the sampling plots was 45 m). To obtain the representative value of the study sites, we placed a total of 102 (84) plots over the five different sites (GA: 24, JD: 25, JS: 15, HY: 23 (5), HS: 15) and recorded the coverage or the density of all vascular plants and bryophytes within the plots. The DBH and the height of all trees were measured. In addition to measuring Korean fir seedling density, we set a 1 m2 subplot at the spot where the seedling density was highest within the plot. The growth stages of Korean fir were assigned based on the height: seedling (≤0.15 m), sapling (0.15–2 m), and mature tree (>2 m). The average height of seedlings was about 8 cm, and we estimated that their ages were more than 5 years because the genus Abies grows slowly during earlier stages of its life span. Height was measured using a hypsometer (Vertex laser, Haglöf, Långsele, Sweden), and DBH was measured at a height of 1.3 m above the ground. A handheld GPS unit (Garmin, Olathe, KS, USA) was used to record the longitude and latitude of each plot.

2.3. Environmental Data Collection

We assumed that the weather conditions were the main environmental variables at the site level. We selected four seasonal mean temperatures (Tsp, Tsu, Tau, Tw) and the average annual precipitation (Pan) and winter precipitation (Pw) to investigate the association between the Korean fir distribution and the weather conditions. Due to elevation differences between the study sites and weather stations used in this study, we could not use temperature data from the weather stations, except in the case of Mt. Halla. Temperatures on Mt. Gaya and Mt. Jiri were estimated using a generalized least squares model considering time-series autocorrelation in the R package (R version 3.4) (mean absolute error: 0.56–0.99) [28]. The response variables were the temperature datasets from field measurements taken from June of 2015 to October of 2016 using a HOBO® temperature data logger (Onset corp. U23-001, Boston, MA, USA), and the explanatory variables were the temperature dataset and binary data of the rainfall status from the closest automatic weather station in each case. We predicted the daily mean temperature for a time span of 10 years. The precipitation data were from the closest weather station (the Korea Meteorological Administration from 1987 to 2017).
We selected four micro-topographic variables (elevation, slope, aspect, topographic position index (TPI)), four soil physicochemical variables (rock cover, pH, organic matter content, electrical conductivity), and three biological variables (Sasa cover, moss cover, Q. mongolica cover) at the plot scale (Level 1). The topographic variables were derived from the digital elevation model (DEM) (10 m × 10 m) of the study area. Elevations varied from 1306 m to 1715 m, and slopes varied from 0° to 45°. The TPI was classified into one of the following categories: 1 = valley or lower slope, 2 = mid slope, and 3 = upper slope or ridge. The slope aspect was divided into the following four categories by considering the amount of solar radiation: 1 = 315–45°, 2 = 45–90° or 270–315°, 3 = 90–135° or 225–270°, and 4 = 135–225°. To measure the soil physicochemical properties, soil samples were collected from five randomly selected points in each plot (10 m × 10 m) after removing organic debris. This was followed by thorough mixing to produce a composite sample for each sampling plot. The soil samples were returned to the laboratory, and the pH, electrical conductivity (EC), and organic matter (OM) values were calculated. The soil pH and EC (ratio of soil to distilled water, 1:5) values were measured using a pH meter (Thermo Fisher, Orion Star A211; Waltham, MA, USA) and an EC meter (Thermo Fisher, Orion Star A212; Waltham, MA, USA), respectively. The soil OM was calculated according to the weight loss after the samples were kept in a muffle furnace at 550 °C for 4 h. Rock cover, moss cover, Sasa cover, and Q. mongolica cover levels were measured as the percentage of ground covered in each plot with division into six categories for further statistical analysis (0 = 0%, 1 = 1–5%, 2 = 6–25%, 3 = 26–50%, 4 = 51–75%, 5 = 76–100%).

2.4. Data Analysis

We calculated the Pearson correlation coefficient using the plot-scale dataset to determine the correlation and the degree of multicollinearity among the nine environmental variables. Furthermore, sampling plots were grouped based on two-dimensional nonmetric multidimensional scaling (NMDS) scores to present the associations between the groups and variables. NMDS ordination plots were produced from the Euclidean distances. The goodness-of-fit of the NMDS configuration was assessed by the loss of stress function. The stress value was 0.161 for the two-dimensional solution, which is lower than the generally accepted maximum stress value: <0.05 = excellent, <0.10 = good, and <0.20 = usable [29]. NMDS ordination was conducted with the R package “vegan” [30].
Hierarchical generalized regression models were applied to investigate the associations between the abundance of Korean fir (seedlings) and the explanatory variables on the different spatial scales [31]. This refers to a type of mixed model with datasets nested at more than one level [32]. Our model provides a hierarchical framework for identifying the effects of site-level and plot-level explanatory variables on the response variables. We combined the HY and HS sites into a single HA site for our hierarchical regression model because the distance between the two sites is less than 2 km, and we assumed that the two sites had similar weather conditions. To reduce the collinearity among the explanatory variables and to improve the model’s performance, all explanatory variables were centered by subtracting the mean of the explanatory variables χ from every value in χ [8].
Before constructing the explanatory regression models, we fitted an unconditional model without introducing other explanatory variables but considering random intercepts to estimate the baseline of the variance. This model can be expressed as follows:
Y i j = γ 00 + u o j + e i j .
Here, Y i j is the abundance of Korean fir (the Poisson distribution with the log link function) and the occurrence of its seedlings (a Bernoulli distribution with the logit link function) at sample plot i of site j . γ 00 represents the overall average of the density of Korean fir at all sites, and u 0 j is the difference between the average density at the j th site from that overall mean. The variable e i j represents the difference between the density level at the plot and its mean at the site.
To ascertain the relationship between the abundance of Korean fir and each predictor variable on the plot scale, we devised a univariate random coefficient model instead of a random intercept model. The random coefficient model assumes that all groups have a different slope for a fitted covariate, which can reduce Type I and Type II errors [8,32]. Scatter plots also showed that the slope of a predictor could vary considerably among the sites.
Y i j = γ 00 + γ p 0 X p i j + u p j X p i j + u 0 j + e i j
In this equation, the relationship between the Korean fir density and each explanatory variable is partitioned into two components: (1) the across-site slope relating the tree’s density to each environmental variable ( γ p 0 ) and (2) the difference between the slope of the within-site relationship between the tree’s density and each explanatory variable ( u p j ).
We extended this model by including multiple explanatory variables at both the plot-level and the site-level. Specifically, our final model also included site-level explanatory variables, in this case the monthly mean temperature and the annual precipitation.
Y i j = γ 00 + γ p 0 X p i j + γ 0 q Z q j + u p j X p i j + u 0 j + e i j
The additional piece of the random coefficient model is γ 0 q Z q j , where γ 0 q represents the fixed effect of the site-level variable Z q j on the response variables.
To find the best hierarchical linear model, we applied a stepwise selection method based on the p values of the predictors and the information criterion (Akaike information criterion (AIC) and Bayesian information criterion (BIC)). With the desired set of predictors selected, we calculated the variance inflation factor (VIF) of each predictor, dropping variables with a VIF higher than 3 to avoid collinearity among the predictor variables [32].

3. Results

3.1. Comparison of Study Sites

The descriptive statistics for the Korean fir density and environmental variables are shown in Table 1. Living Korean fir had the highest density in JS and the lowest density in GA among the five surveyed sites. The proportion of dead Korean fir trees at the HY and JD sites was higher than those at the other sites. We could not find significant differences in the density of Korean fir seedlings among the five sites. Mean elevations with small variations were significantly different depending on the site. Plots on Mt. Halla are located at higher elevations than the other mountains. Plots at JS had the lowest TPI value compared to the other sites because they lie in a valley on Mt. Jiri. GA and HY had higher rock cover and moss cover levels than the other sites. The cover level of the genus Sasa was higher on Mt. Halla than on Mt. Jiri and Mt. Gaya.

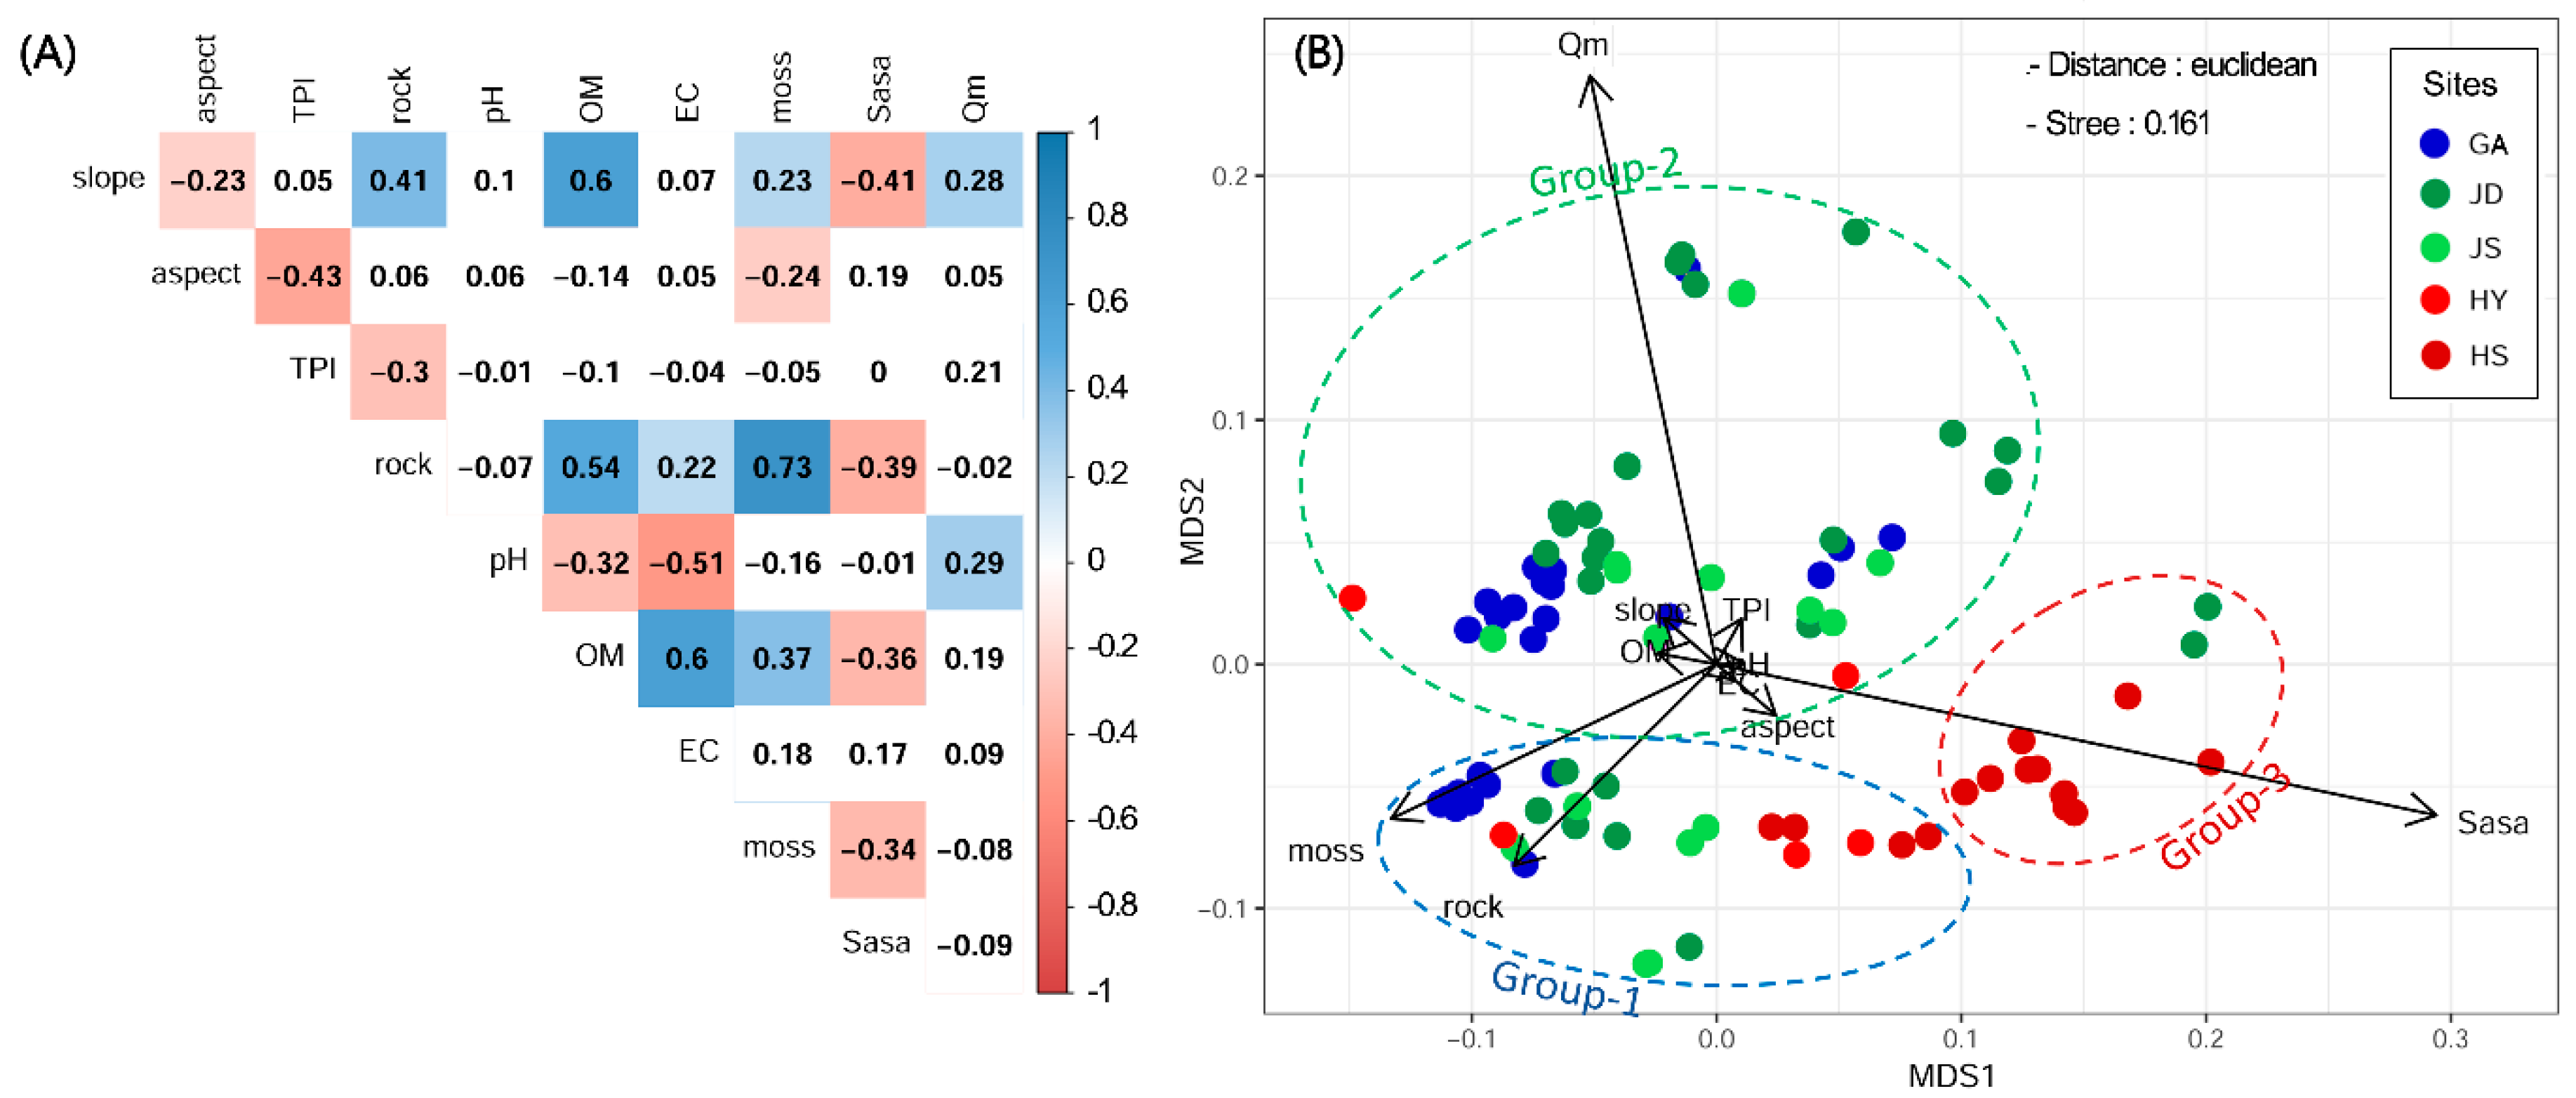
3.2. The Relationship among Environmental Variables

Pearson correlation coefficients of 10 environmental variables are presented in Figure 3. Strong positive correlations were observed between rock cover and moss cover levels, whereas rock cover was negatively associated with Sasa cover (Figure 3A). Moss cover was higher on the northern side slope than on the southern slope, and moss cover was negatively correlated with Sasa cover (Figure 3A). To determine the characteristics of each plot and site, we grouped 84 plots based on a matrix of the 10 selected environmental variables (Figure 3B). Surveyed plots were divided into three groups according to the NMDS (stress: 0.161) and hierarchical clustering (average silhouette width: 0.43) scores. Moss cover, rock cover, Sasa cover, and Q. mongolica cover were more critical factors in regard to the grouping of each site compared to the other environmental factors. GA and HY had similar environmental characteristics with higher moss cover and rock cover levels than the other sites. GA and JD showed greater Q. mongolica cover; otherwise, HS had higher Sasa cover than the other sites.

3.3. Korean Fir Seedling: Environmental Factor Relationships

Before constructing the explanatory models, we fitted the unconditional model of the occurrence of Korean fir seedlings without introducing other explanatory variables but considering random intercept across sites (Table 2, upper). The unconditional model showed a non-significant random intercept, which indicated that the occurrence of Korean fir seedlings within each site does not differ from the overall average. The results of the univariate random coefficient model showed that the occurrence of seedlings was primarily related to variations in the (4) rock cover, (8) moss cover, and (9) Sasa cover levels. Moss cover exerted more influence than rock cover in this study.
Moss cover had greater random effect variation (0.514) than rock cover (0.078), indicating that the relationship of moss cover to the occurrence of seedlings varies more across sites than does the impact of rock cover. The occurrence of seedlings was negatively related to Sasa cover, and Sasa cover showed minor random effect variation compared to the other explanatory variables.
Based on the univariate random coefficient model, we constructed a final hierarchical logistic regression model that included the site-level explanatory variable (Table 2, lower). We dropped rock cover due to the degree of collinearity with moss cover. At the plot level, moss cover was positively related to the occurrence of seedlings. On the other hand, Sasa cover was negatively associated with the occurrence of seedlings. At the site level, winter precipitation was positively related to the occurrence of seedlings.

3.4. The Density of Korean Fir: Environmental Factors Relationships

When we fitted the unconditional model of the density of Korean fir, this model showed a significant random intercept (Table 3). This indicates that the average of the Korean fir density level within each site differed from the overall average. The univariate random coefficient model showed that the Korean fir density levels were negatively related to aspect and TPI. Aspect had greater random effect variation (0.02) than that of TPI (0.003), indicating that the relationship between aspect and the Korean fir density level varies more across the sites than does the impact of TPI. We incorporated site-level explanatory variables into the final model. The final hierarchical Poisson regression model revealed that the Korean fir density levels were negatively associated with aspect, TPI, Quercus mongolica (Qm) cover, and the mean summer temperature at the 0.1 p-value level.

4. Discussion

This study revealed the hierarchical nature of the relationships between the Korean fir distribution patterns and environmental conditions in various types of Korean fir forests. Our results show that Korean fir seedlings mainly occur at plots with higher levels of both rock cover and moss cover and with lower levels of genus Sasa (dwarf bamboo) cover. At the site level, Korean fir seedlings were frequently found in areas with higher rates of winter precipitation.
Earlier studies also noted that rock cover can have positive effects on the establishment and growth of Korean fir seedlings [22,33]. Korean fir seeds may stay for a long period of time in the gaps of rock, which can facilitate germination [34]. Rock gaps usually have higher soil moisture, more OM, and longer periods of snow cover than flatland areas, which can, thus, provide beneficial conditions for seedling germination and survival [22,35]. Moreover, rock-covered areas usually have lower density levels of dwarf bamboo and deciduous trees, indicating that Korean fir can receive higher levels of solar radiation in rock-covered areas than under dwarf bamboo.
Dense dwarf bamboo can have a negative influence on not only Korean fir seedlings but also seedlings of other trees [36,37,38,39,40]. Dwarf bamboo is the most dominant understory species in Korean fir forests [22,37]. Although interactions between high sunlight and water stress can inhibit the growth and survival of fir seedlings in an alpine–treeline ecotone [41], the light intensity may be too low for the survival of fir seedlings at sites with dense bamboo [36]. Dwarf bamboo is a broadleaf evergreen shrub; therefore, this species can continuously prevent light penetration into Korean fir seedlings during all four seasons. Furthermore, a thick litter layer and the subterranean stems of dwarf bamboo can negatively affect the germination of tree seeds [38,39].
Regarding water stress, it is well-known that a stable moisture supply is an important factor for tree seedling survival [13,19,42]. Korean fir seedlings are frequently found in moss-covered plots. Moss cover can be used as a proxy variable for the humidity in the air [43,44]. We surmise, especially in the dry season, that a stable water supply can have a positive effect on the survival of Korean fir seedlings. Moreover, winter precipitation is also positively associated with the occurrence of Korean fir seedlings. Winter precipitation is usually in the form of snow in subalpine areas. Higher levels of winter precipitation can alleviate severe drought in the springtime. In addition, snow cover can protect small tree seedlings from freezing damage during the winter season [45]. Under a global warming scenario, one climate model predicted that the Korean Peninsula may be affected by a seasonal drought [46]. Based on our results, we predict that drought conditions can also increase Korean fir seedlings’ mortality.
Our study also revealed that the abundance of Korean fir was significantly associated with the aspect and TPI. Specifically, Korean fir trees were more frequently found on northern slopes and valleys than on southern slopes and ridges. Northern slopes and valley sites usually have higher air humidity, lower temperatures, lower solar radiation, and longer snow-covered periods than the southern slope and ridge sites. These micro-climate conditions, higher air humidity, and lower temperatures can have a beneficial effect on the survival of the seedlings [20,42]. Additionally, Korean fir can avoid competition with Q. mongolica, which is a representative tree species competing with Korean fir in high-altitude areas [47]. Several reports have predicted that global climate change will lead to further increases in the temperature on the Korean Peninsula compared to other areas at similar latitudes [48,49]. Our study showed that the abundance of Korean fir is negatively associated with high summer temperatures at the site level. Several molecular and physiological studies also mentioned that the Korean fir has adapted to low-temperature environmental conditions [17,18]. Rising temperatures may increase high-temperature-induced photoinhibition, which can decrease the vitality of Korean fir [14,50]. In addition, similar to Picea jezonesis, higher temperatures can increase the initial mortality of Korean fir seedlings [20].

5. Conclusions

The question for the near future is what changes in Korean fir forests are likely to occur. Based on our results, we predict that drought conditions can also increase Korean fir seedlings’ mortality. Furthermore, the distribution area of dwarf bamboo and Q. mongolica will be expanded in subalpine regions. Consequently, the population of Korean fir will continue to decline on the Korean Peninsula. Specifically, the Korean fir population may more rapidly shrink on the southern slopes and ridges than on the northern slopes and valleys under global warming. Further studies need to investigate the direct effects of light intensity, insects, herbivorous animals, and mycorrhiza on the mortality of the Korean fir.

Author Contributions

J.S.P. analyzed the data and wrote the paper. H.S.S. and C.-h.C. provided technical assistance to J.S.P. and helped with the field data collection. J.L. developed and investigated the work. J.K. revised and edited the manuscript and supervised the work. All authors read and approved the final manuscript.

Funding

This research was funded by the National Institute of Ecology, in part, through grant numbers NIE-C-2018-13 and NIE-C-2018-14.

Acknowledgments

We would like to thank the Ministry of Environment of the Republic of Korea for its assistance. We are also grateful for the support provided by the Korea National Park Service.

Conflicts of Interest

The authors declare no conflicts of interest.

References

  1. Dale, M.R.T. Spatial Pattern Analysis in Plant Ecology; Cambridge University Press: Cambridge, UK, 1999. [Google Scholar]
  2. Moeslund, J.E.; Arge, L.; Bøcher, P.K.; Dalgaard, T.; Svenning, J.C. Topography as a driver of local terrestrial vascular plant diversity patterns. Nord. J. Bot. 2013, 31, 129–144. [Google Scholar] [CrossRef]
  3. Lippok, D.; Beck, S.G.; Renison, D.; Hensen, I.; Apaza, A.E.; Schleuning, M. Topography and edge effects are more important than elevation as drivers of vegetation patterns in a neotropical montane forest. J. Veg. Sci. 2014, 25, 724–733. [Google Scholar] [CrossRef]
  4. Opedal, Ø.H.; Armbruster, W.S.; Graae, B.J. Linking small-scale topography with microclimate, plant species diversity and intra-specific trait variation in an alpine landscape. Plant Ecol. Divers. 2015, 8, 305–315. [Google Scholar] [CrossRef]
  5. Yasuhiro, K.; Hirofumi, M.; Kihachiro, K. Effects of topographic heterogeneity on tree species richness and stand dynamics in a subtropical forest in Okinawa Island, southern Japan. J. Ecol. 2004, 92, 230–240. [Google Scholar] [CrossRef] [Green Version]
  6. Shi, H.; Wen, Z.; Guo, M. Leaf Trait Variation with Environmental Factors at Different Spatial Scales: A Multilevel Analysis across a Forest-Steppe Transition. Forests 2018, 9, 122–135. [Google Scholar]
  7. McMahon, S.M.; Diez, J.M. Scales of association: Hierarchical linear models and the measurement of ecological systems. Ecol. Lett. 2007, 10, 437–452. [Google Scholar] [CrossRef] [PubMed]
  8. Harrison, X.A.; Donaldson, L.; Correa-Cano, M.E.; Evans, J.; Fisher, D.N.; Goodwin, C.E.; Robinson, B.S.; Hodgson, D.J.; Inger, R. A brief introduction to mixed effects modelling and multi-model inference in ecology. PeerJ 2018, 6, e4794. [Google Scholar] [CrossRef]
  9. Bolker, B.M.; Brooks, M.E.; Clark, C.J.; Geange, S.W.; Poulsen, J.R.; Stevens, M.H.H.; White, J.S.S. Generalized linear mixed models: A practical guide for ecology and evolution. Trends Ecol. Evol. 2009, 24, 127–135. [Google Scholar] [CrossRef]
  10. Kéry, M.; Royle, J.A. Applied Hierarchical Modeling in Ecology; Elsevier: Amsterdam, The Netherland, 2016. [Google Scholar]
  11. Lee, T.B. Illustrated Flora of Korea; Hyangmunsa: Seoul, Korea, 1999. [Google Scholar]
  12. Koo, K.A.; Park, W.K.; Kong, W.S. Dendrochronological analysis of Abies koreana W. at Mt. Halla, Korea: Effects of climate change on the growths. Korean J. Ecol. 2001, 24, 281–288. [Google Scholar]
  13. Rochefort, R.M.; Little, R.L.; Woodward, A.; Peterson, D.L. Changes in sub-alpine tree distribution in western North America: A review of climatic and other causal factors. Holocene 1994, 4, 89–100. [Google Scholar] [CrossRef]
  14. Koo, K.A.; Kong, W.S.; Park, S.U.; Lee, J.H.; Kim, J.; Jung, H. Sensitivity of Korean fir (Abies koreana Wils.), a threatened climate relict species, to increasing temperature at an island subalpine area. Ecol. Model. 2017, 353, 5–16. [Google Scholar] [CrossRef]
  15. Lim, J.H.; Woo, S.Y.; Kwon, M.J.; Chun, J.H.; Shin, J.H. Photosynthetic Capacity and Water Use Efficiency under Different Temperature Regimes on Healthy and Declining Korean Fir in Mt. Halla. J. Korean For. Sci. 2006, 95, 705–710. [Google Scholar]
  16. Tsuyama, I.; Higa, M.; Nakao, K.; Matsui, T.; Horikawa, M.; Tanaka, N. How will subalpine conifer distributions be affected by climate change? Impact assessment for spatial conservation planning. Reg. Environ. Chang. 2015, 15, 393–404. [Google Scholar] [CrossRef]
  17. Hwang, J.E.; Kim, Y.J.; Shin, M.H.; Hyun, H.J.; Bohnert, H.J.; Park, H.C. A comprehensive analysis of the Korean fir (Abies koreana) genes expressed under heat stress using transcriptome analysis. Sci. Rep. 2018, 8, 10233. [Google Scholar] [CrossRef] [PubMed]
  18. Woo, S.Y.; Lim, J.H.; Lee, D.K. Effects of temperature on photosynthetic rates in Korean fir (Abies koreana) between healthy and dieback population. J. Integr. Plant Boil. 2008, 50, 190–193. [Google Scholar] [CrossRef] [PubMed]
  19. Allen, C.D.; Macalady, A.K.; Chenchouni, H.; Bachelet, D.; McDowell, N.; Vennetier, M.; Kitzberger, T.; Rigling, A.; Breshears, D.D.; Gonzalez, P.; et al. A global overview of drought and heat-induced tree mortality reveals emerging climate change risks for forests. For. Ecol. Manag. 2010, 259, 660–684. [Google Scholar] [CrossRef]
  20. Han, A.R.; Kim, H.J.; Jung, J.B.; Park, P.S. Seed germination and initial seedling survival of the subalpine tree species, Picea jezoensis, on different forest floor substrates under elevated temperature. For. Ecol. Manag. 2018, 429, 579–588. [Google Scholar] [CrossRef]
  21. The IUCN Red List of Threatened Species. Available online: https://www.iucnredlist.org/species/31244/9618913 (accessed on 2 June 2018).
  22. Song, K.M.; Kang, Y.J.; Hyeon, H.J. Vegetation Structure at the Slope Direction and Characteristic of Seedlings of Abies koreana in Hallasan Mountain. J. Environ. Sci. Int. 2014, 3, 39–46. [Google Scholar] [CrossRef]
  23. Kim, J.; Park, E. Chemical and Biological Properties of the Genus Abies. In Advances in Plant Phenolics: From Chemistry to Human Health; ACS Symposium Series; American Chemical Society: Washington, DC, USA, 2018; pp. 225–236. ISBN 978-0-8412-3295-2. [Google Scholar]
  24. Korea Institute of Geoscience and Mineral Resources. 2018. Geologic Maps. Available online: https://mgeo.kigam.re.kr/map/geology.jsp (accessed on 27 June 2018).
  25. Lee, C.S.; Cho, H.J. Structure and Dynamics of Abies koreana Wilson Community in Mt. Gaya. Korean J. Ecol. 1993, 16, 75–91. [Google Scholar]
  26. Cho, D.S. Community Structure, and Size and Age Distribution of Conifers in Subalpine Korean Fir (Abies koreana) Forest in Mt. Chiri. Korean J. Ecol. 1994, 17, 415–424. [Google Scholar]
  27. Kim, G.T.; Choo, G.C.; Um, T.W. Studies on the Structure of Abies koreana Community at Subalpine Zone in Hallasan. Korea J. Environ. Ecol. 2007, 21, 161–167. [Google Scholar] [CrossRef]
  28. Pinheiro, J.; Bates, D.; DebRoy, S.; Sarkar, D. R Core Team (2014) nlme: Linear and Nonlinear Mixed Effects Models. R Package Version 3.1-137 2014. Available online: http://CRAN.r-project.org/package=nlme (accessed on 2 June 2018).
  29. Clarke, K.R. Non-parametric multivariate analyses of changes in community structure. Aust. J. Ecol. 1993, 18, 117–143. [Google Scholar] [CrossRef]
  30. Oksanen, J.; Blanchet, F.G.; Kindt, R.; Legendre, P.; Minchin, P.; O’Hara, R.; Simpson, G.; Solymos, P.; Stevens, M.; Wagner, H. Vegan: Community Ecology Package. R Package Version. 2.5-2. CRAN. Available online: http://CRAN.r-project.org/package=vegan (accessed on 10 June 2018).
  31. Finch, W.H.; Bolin, J.E.; Kelley, K. Multilevel Modeling Using R; CRC Press: Boca Raton, FL, USA, 2016. [Google Scholar]
  32. Zuur, A.F.; Ieno, E.N.; Elphick, C.S. A protocol for data exploration to avoid common statistical problems. Methods Ecol. Evol. 2010, 1, 3–14. [Google Scholar] [CrossRef]
  33. Washitani, I.; Kabaya, H. Germination responses to temperature responsible for the seedling emergence seasonality of Primula sieboldii E. Morren in its natural habitat. Ecol. Res. 1988, 3, 9–20. [Google Scholar] [CrossRef]
  34. Cho, H.K.; Takahashi, K.; Shibuya, M.; Saito, H.; Kim, J.J.; Hong, S.G. Effects of cold stratification, temperature, and drought on seed germination characteristics of Abies koreana and Abies sachalinensis. J. Jpn. For. Soc. 2005, 87, 465–470. [Google Scholar] [CrossRef]
  35. Kim, J.J.; Cho, H.K.; Takahashi, K. Environmental Characteristics of Abies koreana Stand on Mt. Halla. Korean J. Nat. Conserv. 2007, 1, 5–9. [Google Scholar]
  36. Gratzer, G.; Rai, P.B.; Glatzel, G. The influence of the bamboo Yushania microphylla on regeneration of Abies densa in central Bhutan. Can. J. For. Res. 1999, 29, 1518–1527. [Google Scholar] [CrossRef]
  37. Park, S.G.; Yi, M.H.; Yoon, J.W.; Sin, H.T. Environmental factors and growth properties of Sasa borealis (Hack.) Makino community and effect its distribution on the development of lower vegetation in Jirisan National Park. Korean J. Environ. Ecol. 2012, 26, 82–90. [Google Scholar]
  38. Yamamoto, S.I. Gap characteristics and gap regeneration in a subalpine coniferous forest on Mt Ontake, central Honshu. Jpn. Ecol. Res. 1993, 8, 277–285. [Google Scholar] [CrossRef]
  39. Narukawa, Y.; Yamamoto, S. Effects of dwarf bamboo (Sasa sp.) and forest floor microsites on conifer seedling recruitment in a subalpine forest, Japan. For. Ecol. Manag. 2002, 163, 61–70. [Google Scholar] [CrossRef]
  40. Takahashi, K. Regeneration and coexistence of two subalpine conifer species in relation to dwarf bamboo in the understorey. J. Veg. Sci. 1997, 8, 529–536. [Google Scholar] [CrossRef]
  41. Germino, M.J.; Smith, W.K.; Resor, A.C. Conifer seedling distribution and survival in an alpine-tree line ecotone. Plant Ecol. 2002, 162, 157–168. [Google Scholar] [CrossRef]
  42. Cui, M.; Smith, W.K. Photosynthesis, water relations and mortality in Abies lasiocarpa seedlings during natural establishment. Tree Physiol. 1991, 8, 37–46. [Google Scholar] [CrossRef] [PubMed]
  43. Nakamura, T. Effect of bryophytes on survival of conifer seedlings in subalpine forests of central Japan. Ecol. Res. 1992, 7, 155–162. [Google Scholar] [CrossRef]
  44. Karger, D.N.; Kluge, J.; Abrahamczyk, S.; Salazar, L.; Homeier, J.; Lehnert, M.; Amoroso, V.B.; Kessler, M. Bryophyte cover on trees as proxy for air humidity in the tropics. Ecol. Indic. 2012, 20, 277–281. [Google Scholar] [CrossRef]
  45. Domisch, T.; Martz, F.; Repo, T.; Rautio, P. Winter survival of Scots pine seedlings under different snow conditions. Tree Physiol. 2017, 38, 602–616. [Google Scholar] [CrossRef] [PubMed]
  46. Kim, D.W.; Byun, H.R. Future pattern of Asian drought under global warming scenario. Theor. Appl. Climatol. 2009, 98, 137–150. [Google Scholar] [CrossRef] [Green Version]
  47. Jang, W.S.; Park, P.S.; Han, A.R.; Kim, K.Y.; Kim, M.P.; Park, H.K. The spatial distribution of Quercus mongolica and its association with other tree species in two Quercus mongolica stands in Mt. Jiri, Korea. J. Ecol. Environ. 2010, 33, 67–77. [Google Scholar] [CrossRef]
  48. Gosling, S.N.; Dunn, R.; Carrol, F.; Christidis, N.; Fullwood, J.; de Gusmao, D.; Golding, N.; Good, L.; Hall, T.; Kendon, L. Climate: Observations, Projections and Impacts. UK Met Office. Nottingham ePrints: Nottingham, UK, 2011. Available online: http://eprints.nottingham.ac.uk/2040/ (accessed on 12 June 2018).
  49. Pachauri, R.K.; Allen, M.R.; Barros, V.R.; Broome, J.; Cramer, W.; Christ, R.; Church, J.A.; Clarke, L.; Dahe, Q.; Dasgupta, P.; et al. Climate Change 2014: Synthesis Report; Contribution of Working Groups I, II and III to the Fifth Assessment Report of the Intergovernmental Panel on Climate Change; IPCC: Geneva, Switzerland, 2014. [Google Scholar]
  50. Streb, P.; Aubert, S.; Bligny, R. High temperature effects on light sensitivity in the two high mountain plant species Soldanella alpina (L.) and Rannunculus glacialis (L.). Plant Biol. 2003, 5, 432–440. [Google Scholar] [CrossRef]
Figure 1. The distribution of the study sites located in the southern part of the Korean Peninsula. GA: Mt. Gaya; JD: Dweajiryeong of Mt. Jiri; JS: Sesuck of Mt. Jiri; HY: Youngsil of Mt. Halla; HS: southern slope of Mt. Halla.
Forests 09 00777 g001
Figure 2. Monthly mean temperature (A) at the study sites during the period of June 2008 to June 2018. Temperatures values are estimated using the generalized least squares method considering time-series autocorrelation (Mean Absolute Error: 0.56–0.99). Annual and winter precipitation (B) during 1987–2017 (data from the nearest weather station of the Korea Meteorological Administration). GA: Mt. Gaya; JD: Dweajiryeong of Mt. Jiri; JS: Sesuck of Mt. Jiri; HY: Youngsil of Mt. Halla; HS: southern slope of Mt. Halla.
Forests 09 00777 g002
Figure 3. (A) A Pearson correlation coefficient plot of combinations of environmental variables (n = 84). Colored boxes represent a significant correlation coefficient between the variables (p < 0.05); (B) The ordination of nonmetric multidimensional scaling (NMDS) based on the environmental variables matrix, showing the scores of the environmental variables. Dots represent individual plots sampled from the five sites. Dotted ellipses represent three groups based on hierarchical clustering of the NMDS points. GA: Mt. Gaya; JD: Dweajiryeong of Mt. Jiri; JS: Sesuck of Mt. Jiri; HY: Youngsil of Mt. Halla; HS: southern slope of Mt. Halla; TPI: topographic position index; OM: organic matter; EC: electrical conductivity; Qm: Quercus mongolica.
Forests 09 00777 g003
Table 1. Descriptive statistics of the Korean fir density and environmental variables.
NGAJDJSHYHSF Value
Living Abies koreana1027.2 ± 1.4 c12 ± 1.8 bc20.8 ± 2.5 a12.3 ± 1.1 bc15.5 ± 1.5 ab8.4 *
Dead A. koreana840.2 ± 0.1 b4.6 ± 0.9 a4.3 ± 0.6 a4.61 ± 0.8 a2.5 ± 0.8 ab10.1 *
A. koreana seedling843.6 ± 1.02.1 ± 0.94.9 ± 1.76.0 ± 1.32.5 ± 1.21.2
Elevation (m)1021354.0 ± 4 e1401 ± 19 d1457 ± 19 c1615 ± 4 b1681 ± 5 a118 *
Aspect (1–4)1022.3 ± 0.2 b1.9 ± 0.2 bc3.6 ± 0.1 a1.4 ± 0.1 c3.1 ± 0.2 a18.4 *
Slope (°)10231.0 ± 1.9 a18.4 ± 0.5 b13.5 ± 1.4 c8.3 ± 0.7 d9.5 ± 0.7 cd64.1 *
TPI (1–3)1022.1 ± 0.2 bc2.8 ± 0.1 a1.5 ± 0.2 c2.3 ± 0.1 ab1.9 ± 0.2 bc8.2 *
Rock cover (0–5)1024.0 ± 0.3 a1.1 ± 0.2 b3.1 ± 0.4 a3.7 ± 0.2 a1.5 ± 0.4 b23.3 *
pH844.6 ± 0.14.6 ± 04.5 ± 0.14.3 ± 0.14.6 ± 0.01.4
OM (%)8436.3 ± 1.6 a17.5 ± 1.2 b18.4 ± 1 b20.1 ± 4.3 b14.0 ± 1.6 b37.5 *
EC (dS/m)840.8 ± 0.1 a0.4 ± 0.0 b0.5 ± 0.1 b1.0 ± 0.2 a0.7 ± 0.1 ab10.1 *
Sasa cover (0–5)1020.7 ± 0.3 b1.2 ± 0.4 b1.1 ± 0.4 b3.2 ± 0.5 a4.8 ± 0.1 a16.9 *
Moss cover (0–5)1022.3 ± 0.2 ab0.8 ± 0.2 c1.5 ± 0.3 bc2.9 ± 0.2 a0.8 ± 0.4 c14.6 *
Qm cover (0–5)1021.8 ± 0.3 a1.5 ± 0.2 ab1.4 ± 0.3 ab0.6 ± 0.2 bc0.0 ± 0.0 c7.3 *
Note. GA: Mt. Gaya; JD: Dweajiryeong of Mt. Jiri; JS: Sesuck of Mt. Jiri; HY: Youngsil of Mt. Halla; HS: southern slope of Mt. Halla; TPI: topographic position index; OM: organic matter; EC: electrical conductivity; Qm: Quercus mongolica. Meaningful differences in each variable among the five sites are marked with * to represent p < 0.001 and the letters (a, b, c, d, e), based on the results from an analysis of variance (Tukey’s HSD).
Table 2. Unconditional (upper) and hierarchical logistic regression (lower) models of the occurrence of Korean fir seedlings ( Y i j ) with plot-level explanatory variables ( X i j ) and site-level explanatory variables ( Z j ) using the maximum likelihood method (Laplace approximation).
Unconditional model
( Y i j   ~   B e r n o u l l i ( P i j ) ,       L o g i t ( P i j ) = γ 00 + u o j + e i j )
Fixed EffectRandom Effect
ParameterEstimatez valuep-valueVarianceAIC
Intercept0.160.4150.670.39119
Univariate random coefficient model
( Y i j   ~   B e r n o u l l i ( P i j ) ,       L o g i t ( P i j )   = γ 00 +   γ p 0 X p i j + u p j X p i j + u 0 j + e i j )
(1)Intercept−0.50−1.270.200.001110
Slope−0.06−0.610.540.046
(2)Intercept−0.17−0.550.580.036114
Aspect−0.63−1.050.291.241
(3)Intercept0.150.370.710.386124
TPI−0.01−0.040.970.008
(4)Intercept0.030.360.920.240111
Rock cover0.48 **2.30<0.050.078
(5)Intercept0.150.390.690.407123
pH−0.50−0.400.691.961
(6)Intercept0.160.450.650.256121
OM0.031.130.260.001
(7)Intercept0.310.740.460.371120
EC0.020.010.997.052
(8)Intercept−0.130.390.720.195104
Moss cover1.01 **2.27<0.050.514
(9)Intercept0.310.500.620.889109
Sasa cover−0.56 **−2.57<0.050.002
Final hierarchical logistic regression model
( Y i j   ~   B e r n o u l l i ( P i j ) ,       L o g i t ( P i j )   = γ 00 +   γ p 0 X p i j + u p j X p i j + u 0 j + e i j )
Intercept0.02 *0.060.070.03697
Moss cover0.76 *1.820.060.406
Sasa cover−0.68 **−2.53<0.05-
Pw0.08 **1.96<0.05-
Note. TPI: topographic position index; OM: organic matter; EC: electrical conductivity; AIC: Akaike information criterion. Each significant parameter is marked with * (p < 0.1) and ** (p < 0.05), respectively.
Table 3. Unconditional (upper) and hierarchical Poisson regression (lower) models of the density of Korean fir ( Y i j ) with plot-level explanatory variables ( X i j ) and site-level explanatory variables ( Z j ) using the maximum likelihood method (Laplace approximation).
Unconditional model
( Y i j   ~   P o i s s o n ( λ i j ) ,           L o g ( λ i j ) = γ 00 + u o j + e i j )
Fixed EffectRandom Effect
ParameterEstimatez valuep-valueVarianceAIC
Intercept2.59 ***16.1<0.0010.13757
Univariate Random coefficient model
( Y i j   ~   P o i s s o n ( λ i j ) ,         L o g ( λ i j ) = γ 00 + γ p 0 X p i j + u p j X p i j + u 0 j + e i j )
(1)Intercept2.34 ***7.35<0.0010.39729
Slope0.0060.420.670.001
(2)Intercept2.56 ***9.57<0.0010.27734
Aspect−0.17 *−2.05<0.050.02
(3)Intercept2.54 ***13.92<0.0010.13754
TPI−0.11 *−2.54<0.050.003
(4)Intercept2.28 ***5.57<0.0010.65712
Rock cover0.070.570.560.07
(5)Intercept2.55 ***12.47<0.0010.16738
pH0.030.080.950.62
(6)Intercept2.34 ***6.32<0.0010.53699
OM0.020.870.380.002
(7)Intercept2.78 ***9.21<0.0010.33727
EC−0.27−0.580.560.79
(8)Intercept2.47 ***10.04<0.0010.07702
Qm cover−0.17•−1.890.060.03
Final hierarchical Poisson regression model
( Y i j   ~   P o i s s o n ( λ i j ) ,       L o g ( λ i j ) = γ 00 + γ p 0 X p i j + γ 0 q Z q j + u p j X p i j + u 0 j + e i j )
Intercept2.66 ***46.79<0.0010.006
Aspect−0.14 **−3.25<0.01-
TPI−0.11 *−2.03<0.05-688
Qm cover−0.17•−1.780.080.022
Tsu−0.30 ***−5.13<0.001-
Note. TPI: topographic position index; OM: organic matter; EC: electrical conductivity, Qm: Quercus mongolica. Each significant parameter is marked with • (p < 0.1), * (p < 0.05), ** (p < 0.01), and *** (p < 0.001), respectively.

