Article

Can Future CO2 Concentrations Mitigate the Negative Effects of High Temperature and Longer Droughts on Forest Growth?

by
Eric J. Gustafson
*,
Brian R. Miranda
and
Brian R. Sturtevant
Institute for Applied Ecosystem Studies, Northern Research Station, USDA Forest Service, 5985 Highway K, Rhinelander, WI 54501, USA
*
Author to whom correspondence should be addressed.
Forests 2018, 9(11), 664; https://doi.org/10.3390/f9110664
Submission received: 4 September 2018 / Revised: 20 October 2018 / Accepted: 22 October 2018 / Published: 24 October 2018
(This article belongs to the Section Forest Ecology and Management)

Abstract

:
(1) Background: Climate change may subject forests to climate conditions to which they are not adapted. Elevated temperatures can potentially reduce net photosynthesis by increasing respiration rates and increasingly long droughts dramatically increase morbidity. While CO2 enrichment enhances productivity, it is not clear to what extent CO2 enrichment can offset the negative effects of elevated temperatures and longer droughts; (2) Methods: We used a mechanistic landscape model to conduct controlled simulation experiments manipulating CO2 concentration, temperature, drought length and soil water capacity; (3) Results: We found that elevated CO2 stimulates productivity such that it dwarfs the negative effect caused by elevated temperature. Energy reserves were not as strongly mitigated by elevated CO2, and the mortality of less competitive cohorts increased. Drought length had a surprisingly small effect on productivity measures, but longer droughts increased the risk of mortality; (4) Conclusions: Elevated CO2 compensated for the negative effect of longer droughts in terms of productivity measures, but not survival measures.

1. Introduction

Climate change is expected to alter temperature and precipitation patterns throughout much of the world [1], subjecting forests to climate conditions to which they are not adapted. Water stress is a major limiting factor on plant growth [2]. Individual trees can become water stressed because of inadequate precipitation inputs and/or inferior ability to extract water from the soil compared to adjacent competitors, and when water stress becomes acute, individuals can die [3]. When water stress is widespread, such as during drought, forest dynamics can be impacted by increased morbidity of drought intolerant species across the landscape. Temperature stress is less likely to directly cause mortality because acclimation can occur in some species, but it can reduce photosynthetic efficiency and increase respiration rates such that growth can be reduced and energy reserves depleted, making individuals more susceptible to mortality by other causes [4,5]. Alternatively, elevated temperatures can enhance growth of temperature-limited species [5].
Gustafson et al. [4] used a mechanistic forest landscape model based on the PnET-II ecophysiology model [6] to conduct a controlled simulation experiment to quantify the relative effect of temperature, precipitation, light (cloudiness) and soil water capacity on growth and competition of tree species found in the temperate forests of central North America. They discovered that temperature had a positive effect on growth when temperature rise was moderate (+3 °C), but a negative effect when temperatures rose by 6 °C (driven by very high respiration rates). Available water (precipitation and soil) had the greatest effect on growth, with more water resulting in greater growth. Light had a similar effect, but the effect was much more modest. However, that study did not explicitly examine the effect of CO2 concentration on growth, and concentrations rose gradually, being <510 ppm for the first half of 100-year simulations. That study also reduced precipitation as a constant fraction of monthly precipitation and did not include drought events. Droughts, particularly long droughts, can have an important effect on forest dynamics. Tree mortality on tens of thousands of forest inventory plots in the Midwestern U.S. over 40 years was more related to the length of dry periods (droughts) than to the magnitude of precipitation reduction [7,8]. However, the interaction of droughts with other aspects of climate change has been little studied formally.
Elevated CO2 increases plant productivity through several mechanisms that may reduce temperature and water stress. Water is primarily lost from a plant when leaf stomata are opened to allow CO2 to diffuse into the leaf. At increasingly higher CO2 concentrations, the stomata open less frequently, decreasing water loss and thus increasing water use efficiency. Elevated CO2 also increases conductance of CO2 into the leaf and produces more favorable internal leaf conditions relative to CO2 compensation point [9]. Empirical experiments manipulating CO2 and temperature or water have shown that CO2 can have a strong mitigating effect on temperature and water stress effects (see [10,11] for reviews), but mechanistic modeling studies are required to explore whether these relationships hold under more extreme conditions or longer time frames.
The objective of this study was to conduct a simulation experiment using representative temperate tree species to quantify the interactions of CO2, temperature, drought length and disturbance on forest growth and competition to complement the findings of Gustafson et al. [4]. Our expectation was that chronically elevated CO2 concentrations (750 ppm) would increase growth rates even at high temperatures. This contrasts with the findings of Gustafson et al. [4] that growth was reduced when temperature increased by 6 °C but CO2 only gradually increased to 697 ppm in 100 years. We also expected that increased drought length (holding decadal precipitation amount constant) would produce a greater negative effect on growth than Gustafson and Sturtevant [7] found with just a proportional decrease in precipitation. We also surmised that there may be an interaction with CO2 such that drought effects are also mitigated by high CO2 concentrations by reducing stomatal water loss. Finally, we expected that disturbance would increase landscape-wide productivity under elevated temperature and water stress by hastening a species composition change favoring species with greater heat and drought tolerance. Such composition changes may also result in changes to the spatial pattern of the landscape.

2. Materials and Methods

We conducted two sets of simulation experiments: (1) a site-scale experiment to tightly control the main treatment effects while minimizing the confounding effects of disturbance and establishment of new competing cohorts to determine the relative effects of each factor and their interactions, and (2) a landscape-scale experiment to assess how spatial processes such as seed dispersal and disturbance interact with the treatment factors, to discover how CO2 concentrations may mitigate the climate drivers in forest settings. We used the mechanistic, physiological first principles PnET-Succession model because it is equally suited to site and landscape scale simulations, and has direct, mechanistic links between species growth (photosynthesis) and the experimental factors of temperature, drought and CO2 concentration, allowing competitive outcomes to emerge from the simulated growth of species with varying life history attributes.
PnET-Succession [12] is a plug-in within the LANDIS-II forest landscape modeling platform [13]. It mechanistically projects growth and competition of tree species cohorts for water and light by simulating photosynthetic production as a function of mean life history traits at a monthly time step on each landscape grid cell. Access to light is proportional to cohort size (biomass), while access to soil moisture depends on the ability of a species to extract soil water at the water potential found at the site. Cohort leaf biomass is assigned to canopy layers as a function of woody biomass (used as a surrogate for height), and light attenuation is computed according to the extinction coefficients of the species making up the mixed-species canopy layers. Soil water for each grid-cell is tracked using a bulk-hydrology “bucket” model. Rooting depth and soil water holding capacity determine the size of the “bucket,” precipitation provides inputs, and losses result from evaporation, runoff, percolation out of the rooting zone, foliage interception, and uptake by vegetation (transpiration).
In PnET-Succession, the primary determinant of maximum photosynthetic capacity (Amax) is foliar nitrogen (FolN). Several limiting factors are used to compute actual photosynthesis (A) by applying individual growth reduction multipliers (ranging between 0.0 and 1.0) to Amax so that values of 1.0 cause no reduction and values <1.0 reduce Amax proportionally, with photosynthesis being halted altogether by a single value of 0.0 [12]. The light stress multiplier (fRad) represents the useable light available to the cohort at each level of its vertical canopy profile, given its shade tolerance. The water stress multiplier (fWater) represents the soil water available to the cohort, given its ability to extract water at the water potential of the site. The senescence multiplier (fAge) increasingly reduces photosynthesis as cohorts age, reaching 0.0 at longevity age. The temperature multiplier (fTempPsn) equals 1.0 at the optimal temperature for photosynthesis of the species and declines negative-exponentially as temperature departs (in either direction) from that value. There is a conceptually similar CO2 enrichment multiplier (DelAmax) that exceeds 1.0 as atmospheric CO2 concentration exceeds 350 ppm, based on equations in Franks et al. [9,14]. Photosynthesis occurs only in months where average temperature exceeds the species-specific minimum, which allows phenology to respond dynamically to variation in seasonal temperature. PnET-Succession accounts for reductions in biomass accumulation by respiration (growth and maintenance), using a Q10 relationship in which a 10 °C increase in temperature causes a doubling of respiration rate [15]. Maintenance respiration rate depends on temperature and biomass, and foliar respiration depends on temperature and moisture. Respiration acclimation to elevated temperature is simulated according to Wythers et al. [16]. Non-structural carbon reserves become depleted when respiration exceeds photosynthetic production (e.g., from various stress factors), and mortality occurs when reserves are below a particular threshold (typically 1%) at the end of a calendar year. Cohort establishment probabilities are dynamic, being proportional to computed growth rates below the canopy each month for each species. Monthly mean temperature, precipitation, radiation and CO2 are provided as inputs as, causing growth and establishment rates to respond to both gradual change and extreme events. For additional model details see De Bruijn et al. [13] and Gustafson et al. [14,17].

2.1. Site-Scale Experiment

The site-scale experiment was conducted on a single cell using a full-factorial design with four fixed treatment effects (temperature, CO2 concentration, drought length and soil texture (available water capacity)) applied to assemblages of four generic tree species with randomly generated life history traits. Soil texture was also included as a fixed treatment effect because it has a large effect on the availability of water for tree photosynthesis for a given amount of precipitation [8]. Response variables were chosen to represent distinct aspects of physiological response to the treatments. (1) Total annual net productivity (NetPsn) of each cohort over the course of the growing season was chosen to represent photosynthetic response, integrating effects of temperature on photosynthesis and respiration, growing season length, and seasonal variability in precipitation; (2) Total cohort woody biomass production was chosen because it integrates photosynthetic output (accounting for stress factors), water use efficiency and maintenance respiration; (3) Mean monthly carbon reserves (NSCfrac) are believed to be an indicator of plant stress and are inversely correlated with likelihood of mortality [3,18]; (4) The mean age attained by the four cohorts on a cell was chosen to represent crowding-induced mortality (competitive exclusion), such that a mean age <140 indicates that at least one cohort died during the simulation. Rather than choose a single simulation year to sample response variables, we used the average value observed over the full 100 years of each simulation for net photosynthesis, biomass, and NSCfrac, assuming that these means represent the relative vigor and competitive ability of each cohort (and its competitors) in response to the treatment factors throughout the entire simulation. When cohorts died, only the years prior to death were included, representing the state of the cohort prior to death.
Randomly assigned parameter values (Table 1 and Table 2) were applied to 40-year-old assemblages of four species competing on a single cell for 100 years. When life history traits differ among species in an assemblage, the abiotic conditions of certain treatment combinations will favor some species while hindering others. Furthermore, these traits may interact among competitors such that the specific combination of life history traits within an assemblage may have a large impact on the outcome of their competition. For that reason, we randomized the life history traits of the four hypothetical deciduous tree species in each replicate by selecting (with replacement) a value for each of the four life history traits listed in Table 1. These life history traits determine growth capacity (FolN) or control the physiological response to the treatments. Each random assemblage was simulated for all combinations (n = 81) of the full factorial of treatments (Table 2) and the four response variables for a single species formed a single observation, along with the treatment levels and the values of the four life history traits. By simulating 250 such species assemblages, we generated 81,000 cohort observations.
Each experimental treatment factor had three levels (Table 2). We used the temperature treatment time series of Gustafson et al. [4] to enhance comparisons with that study. This series was based on weather data from Oconto county (WI, USA) from the period 1949–2010, which was replicated to create a time series extending through the year 2105 (100 years) and the treatments were implemented by modifying the monthly temperature values by adding the number of degrees of each treatment level to the temperature values in the climate input file. We did not use the precipitation time series of Gustafson et al. [4] because that time series had very few drought years, and our experiment required distinct drought periods. We instead used the precipitation projections used in the landscape experiment (below) generated by the MIROC General Circulation Model [18] under the RCP8.5 (Representative Concentration Pathways) emissions scenario because it had a steady precipitation trend with several drought events. For this purpose we used the projected precipitation of the scenario, and we implemented the drought length treatment by: (1) swapping dry and wet years to change the length of wet and dry periods without altering the total precipitation of the full weather series, and (2) intensified the droughts by reducing precipitation by 40% in drought years and increasing it by the same amount in the wet years that were swapped, to produce a strong drought signal as in Gustafson et al. [8]. Droughts were arbitrarily defined as periods when annual precipitation was less than the median of the 100-year precipitation time series, and less than the 25% quantile of total growing season precipitation and of maximum monthly growing season precipitation. Sixteen years qualified as drought years by these criteria. We swapped wet for dry years to center droughts on the years 2025, 2050 and 2075 (n = 3 droughts). We sought to swap years that occurred closely in time as much as possible, avoiding the creation of near-drought conditions longer than one year elsewhere in the time series. The CO2 treatment used a fixed value of CO2 set at the treatment level throughout the simulations. The levels of the soil factor created a gradient of available water capacity (AWC), defined as field capacity minus wilting point, using three standard soil texture classes (sand, sandy loam, loam) [19] (Table 2).
Each replicate random assemblage was simulated on a single, empty 30 m cell, and for each assemblage, a single cohort of each of the four hypothetical species was established in 1970 and grown for 40 years using fixed monthly averages of temperature, precipitation and PAR and constant CO2 (385 ppm) to compute starting biomass. The treatments were applied starting in 2010 and run for 100 years. The establishment of new cohorts was prevented to avoid confounding the experiment.

2.2. Analysis

Our main objective was to assess the relative magnitude of response to each of the main treatment effects on the dynamics of species behavior under different competitive environments. We computed mean responses to individual experimental effects by holding all covariates to their mean level using a least-squares means procedure [20]. We suspected that these effects might interact to produce non-intuitive dynamics. We focused solely on the relative magnitude of effects, intentionally avoiding making inferences about the significance of differences because differences in response variables could always achieve statistical significance with enough replicates [21]. We encourage readers to draw their own conclusions about significance, by comparing the 99% confidence intervals among treatment means.

2.3. Landscape-Scale Experiment

A similar factorial simulation experiment was conducted at the landscape scale using PnET-Succession to incorporate the effects of spatial processes such as dispersal and contagious disturbances that typically structure forested landscapes. The experiment featured the real assemblages of species (Table 3) found on a 104,471 ha sub-boreal mixed forest landscape in northern Wisconsin (USA) (Figure 1) that was used by Gustafson et al. [4], to enhance comparisons with those results. Topographic relief is minimal, so climate was assumed to be homogeneous across the study area. Variation in soil type was inherent in the land type map (Figure 1), which was generated by assigning all SSURGO [22] soil map polygons to the most similar of the three soil types used in the site-scale experiment. The initial forest conditions (species and age classes) were those used by Janowiak et al. [23], which were created using the methods of Wilson et al. [24]. Cell size was 30 m. The main effects were Emission scenario, with the associated CO2, temperature and precipitation levels, Drought length (Table 4), and AWC, which was not a fixed treatment effect, but varied across the landscape according to the land type input map.
We linked the CO2 and temperature treatments by using GCM projections of temperature driven by two RCP emissions (CO2) scenarios developed for the Intergovernmental Panel on Climate Change Fifth Assessment Report [1] for the period 2006–2100. We chose the Model for Interdisciplinary Research on Climate earth system model (MIROC-ESM r1i1p1) [18] to generate the temperature and base precipitation weather stream for the RCP emission scenarios because it predicts a very warm future in our study area under the RCP8.5 scenario. For both climate scenarios, we used future monthly values of solar irradiation from the Vegetation-Ecosystem Modeling and Analysis Project (VEMAP 2; https://daac.ornl.gov/cgi-bin/dsviewer.pl?ds_id=567) [25]. The RCP3.0 scenario projects CO2 atmospheric concentrations to peak at 443 ppm around the year 2050 and decline thereafter, while the RCP8.5 scenario projects concentrations to rise throughout this century and stabilize around the year 2250 at over 1900 ppm. Because the climate projections end at the year 2100, we duplicated the precipitation series (negligible temporal trend) for an additional three centuries to produce a time series through the year 2405 (400 years). A stochastic background disturbance regime was simulated in all factorial combinations that included fire, windthrow and timber harvest. Fires were simulated using the Base Fire extension [26], parameterized based on data in [27]. Microburst wind events were simulated using the Base Wind extension [28], parameterized based on data in Rich et al. [29]. Tornadoes and derechos were simulated using the Linear Wind extension [30], parameterized based on data in Hjelmfelt [31] and online sources (http://www.wunderground.com/resources/education/tornadoFAQ.asp?MR=1) [32]. Timber harvest was simulated using the Biomass Harvest extension [33], using generic harvest prescriptions based loosely on those used in another study in the region [27]. Prescriptions included a mix of clearcut (various rotation intervals), shelterwood and selection cutting methods. Input files for all LANDIS-II extensions are included in the online Supplement.
Three replicates of each factorial combination were simulated for 400 years. Because of the longevity of some species, we found that 400 years was required to erase the legacy of the starting conditions. The response variable was mean biomass through time of sets of functional groups defined by: drought tolerance, PsnTOpt, forest type (consistent with Gustafson et al. [4]). We plotted the temporal trends in the response variable under each treatment combination in side-by-side panels to allow visualization of the treatment effects. We also computed mean measures of diversity (species and age class richness) for all forested cells and an index of landscape fragmentation (Aggregation Index [34]).

3. Results

3.1. Site-Scale Experiment

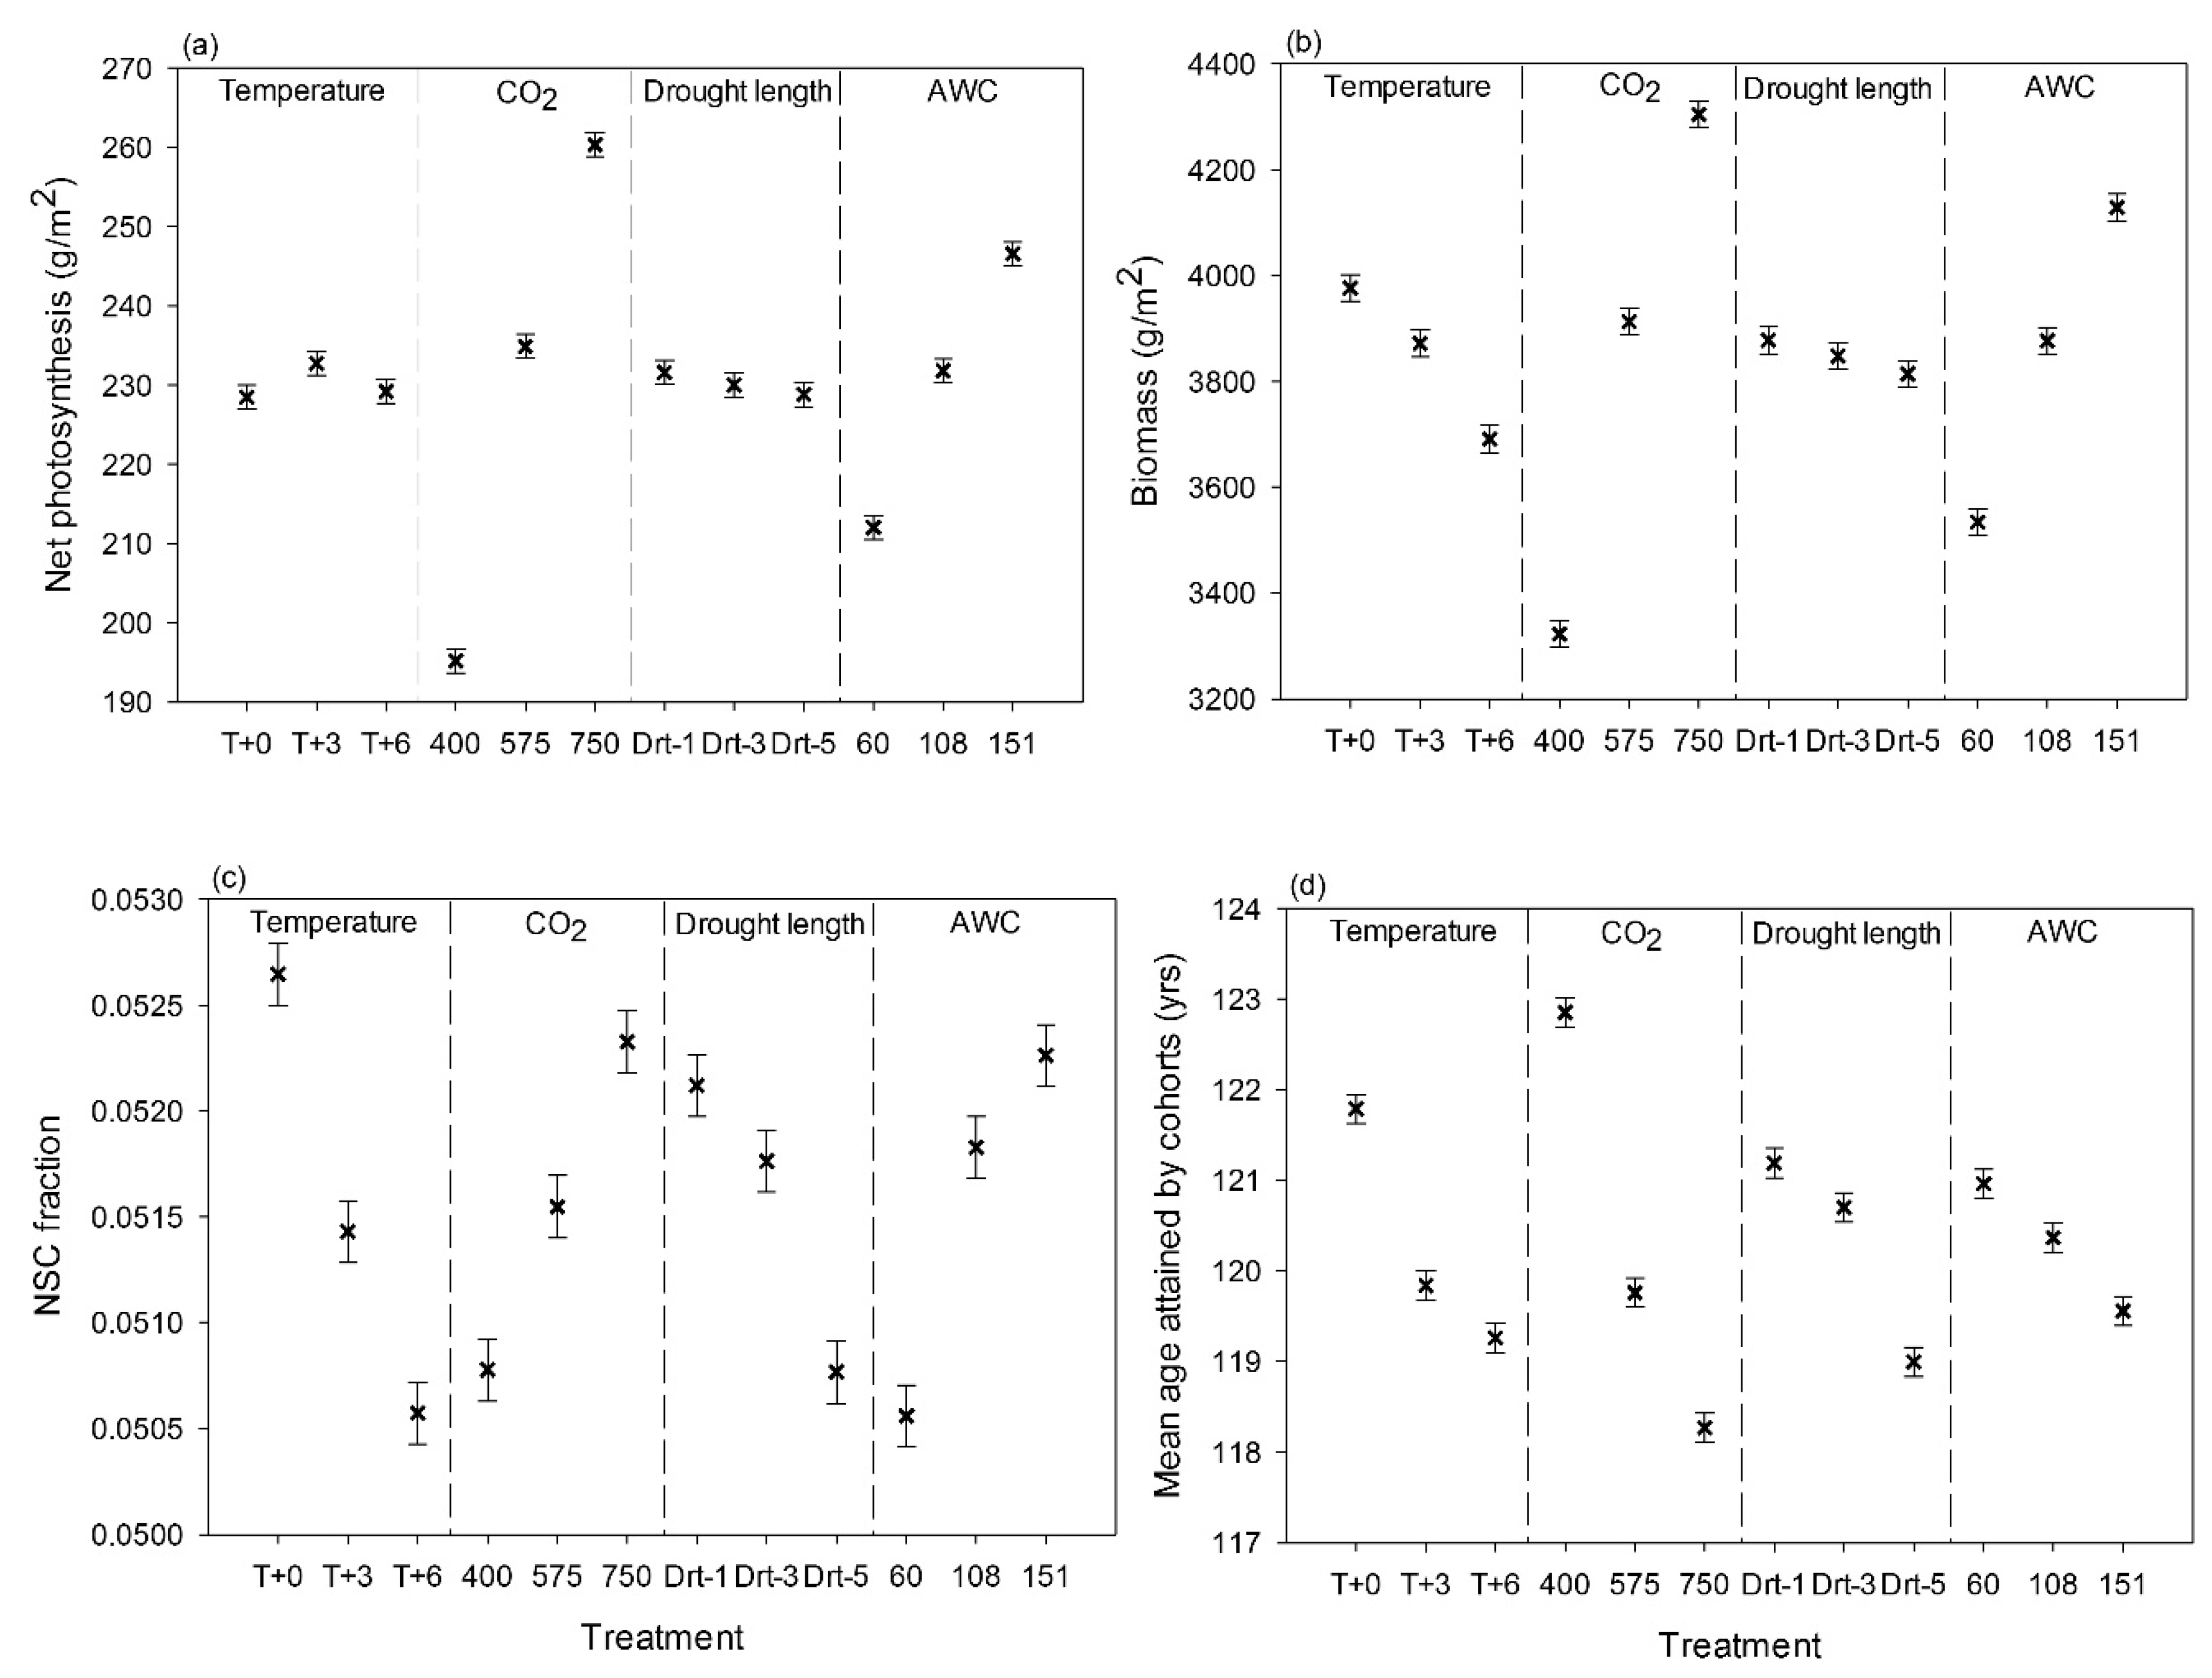
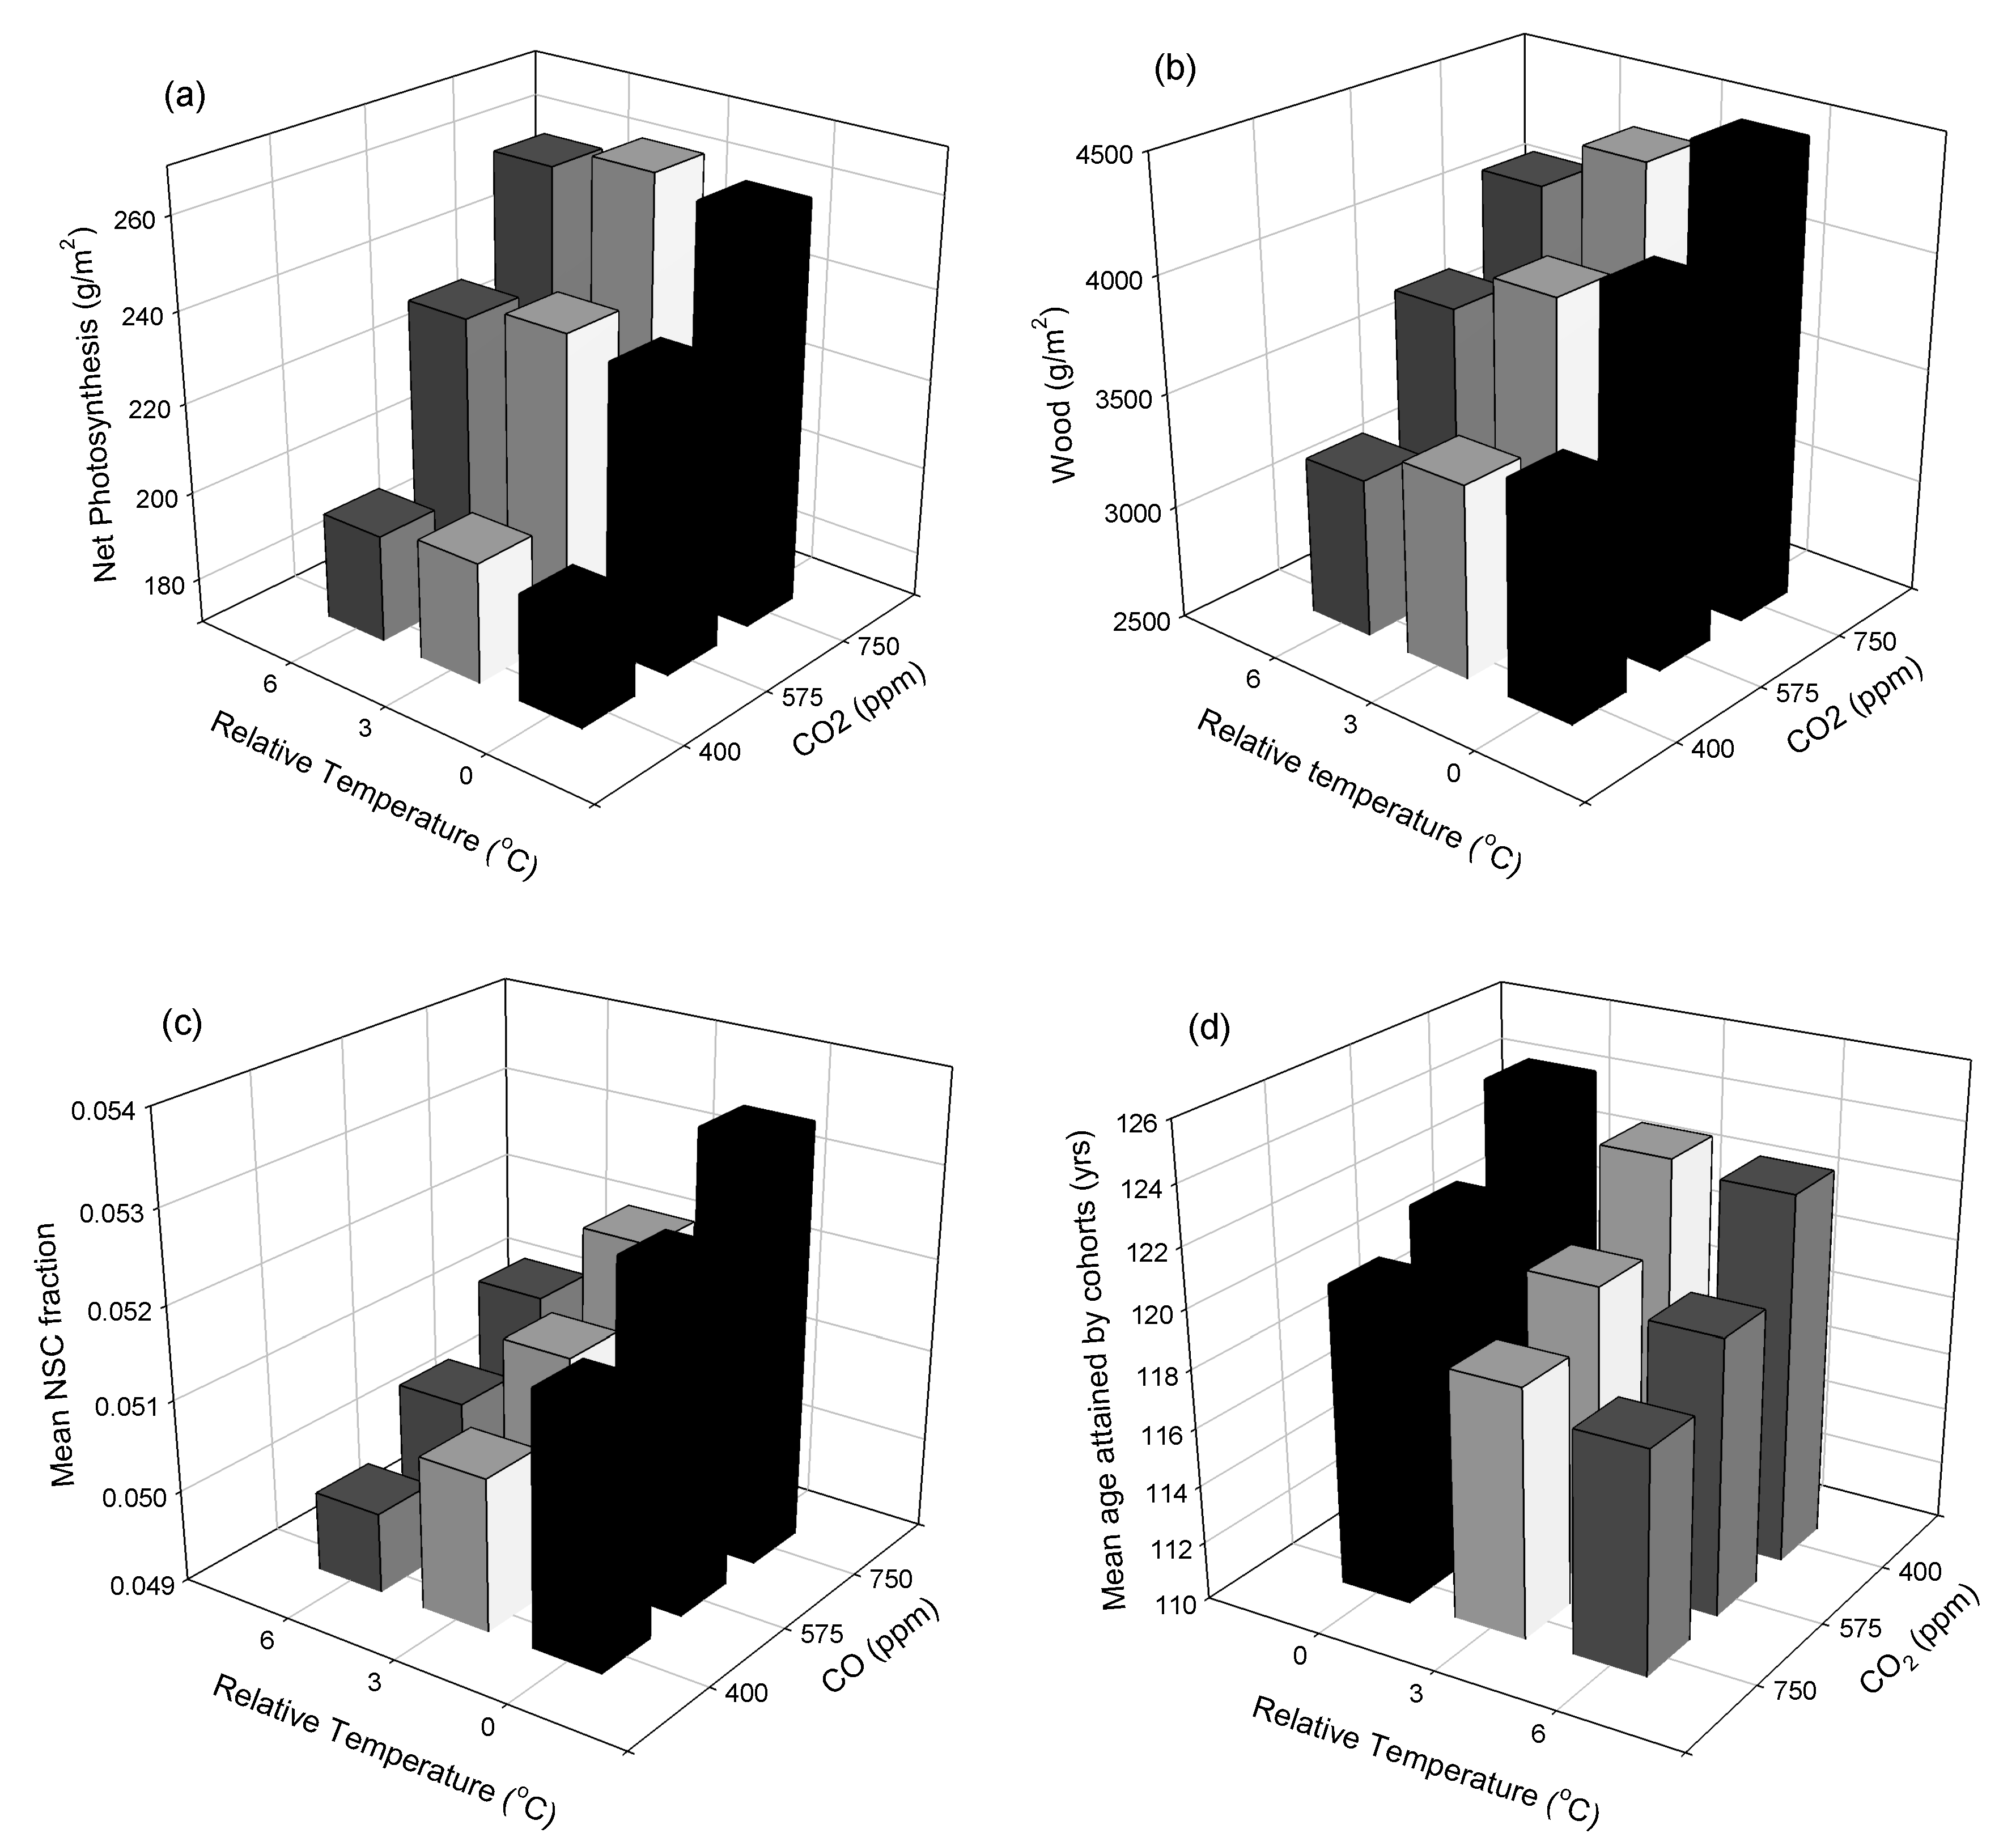
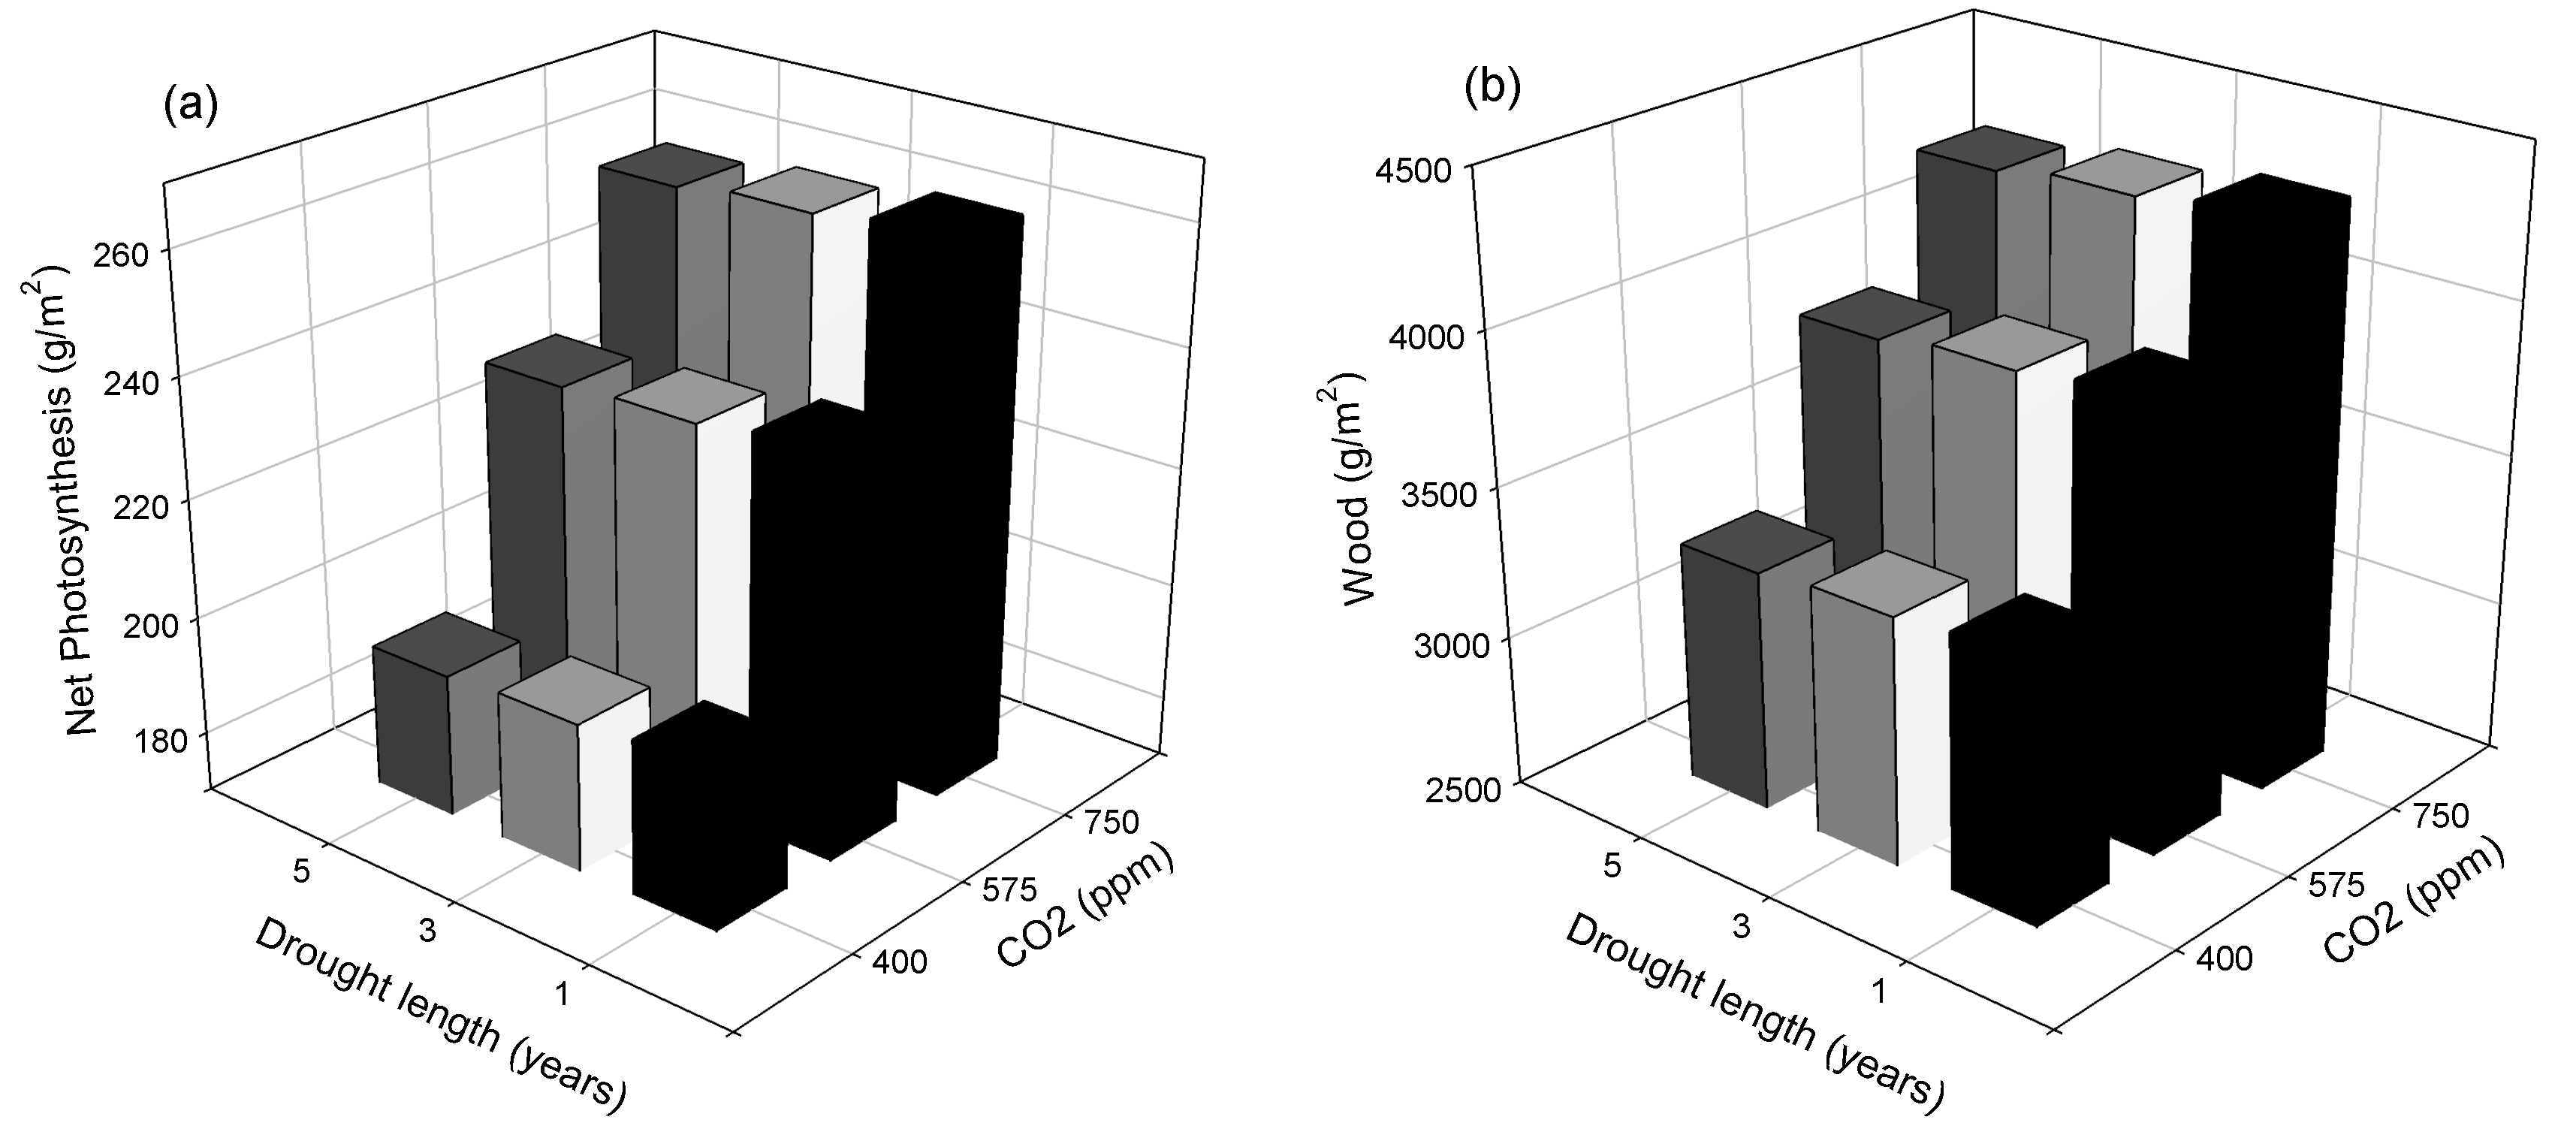
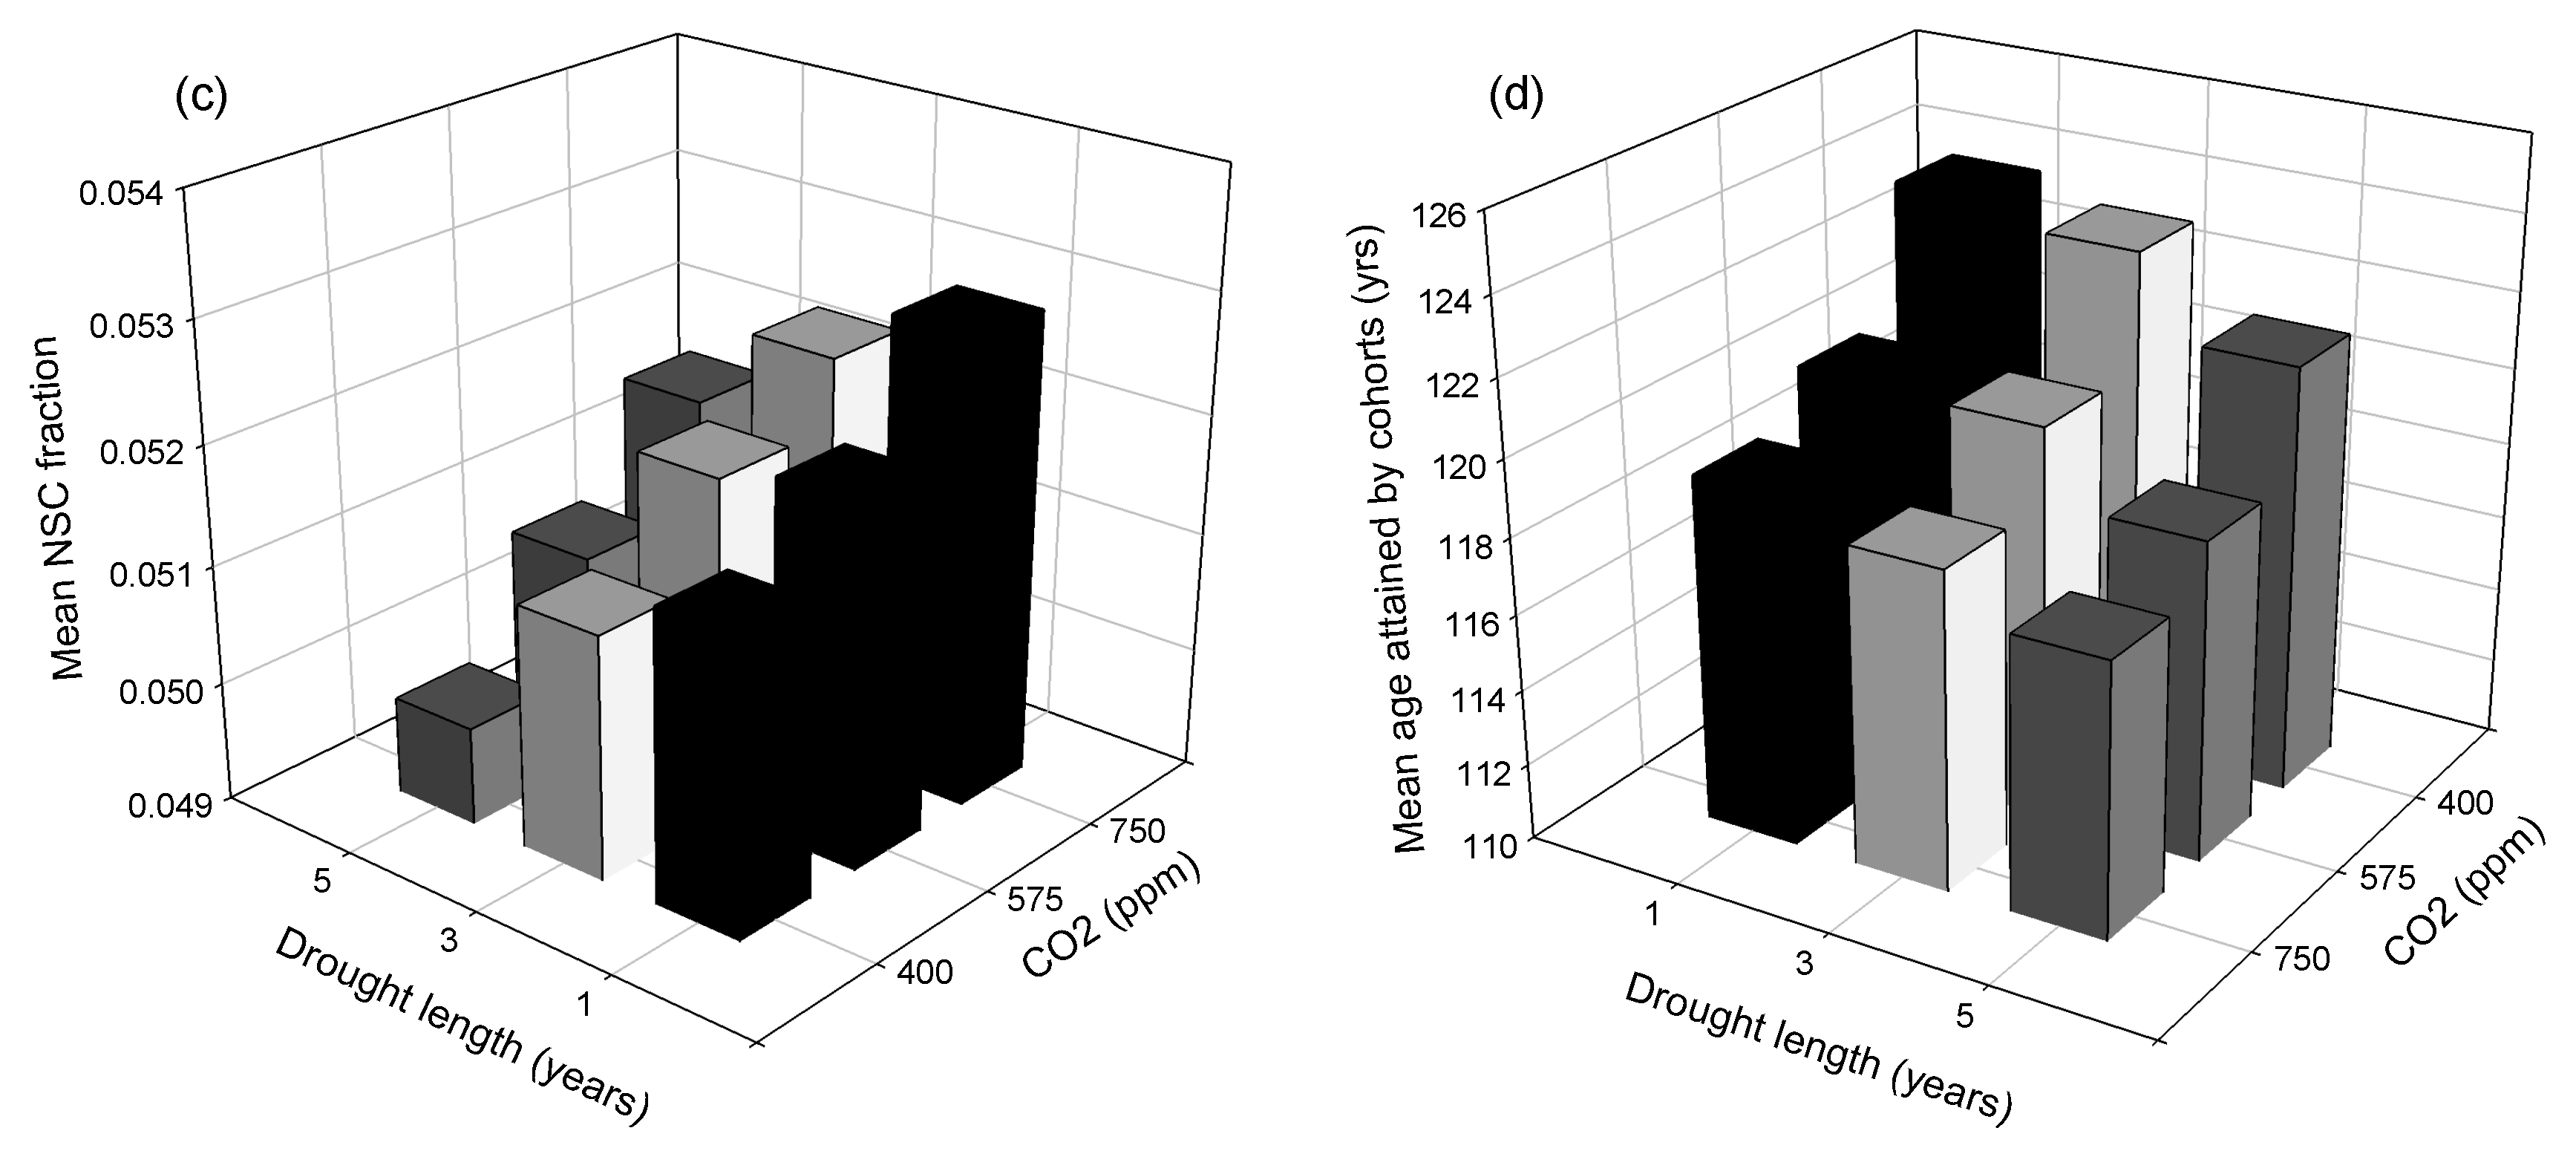
The CO2 treatment factor had the greatest effect on all of the response variables except NSCfrac (carbon reserves). Its positive effect on growth (Figure 2a,b) dwarfed the negative effects of elevated temperature and longer droughts, and approximately compensated those negative effects for carbon reserves (Figure 2c). All four factors had a negative effect on mean age attained by cohorts (Figure 2d). Elevated CO2 and increasing AWC had an indirect negative effect on mean age attained by cohorts by enhancing the competitive advantage of rapidly growing cohorts, allowing them to competitively exclude slower growing cohorts. Elevated temperature and longer droughts also had direct negative effects by increasing respiration costs and reducing reserves, promoting the mortality of cohorts. The magnitude of the positive effect of CO2 relative to the negative effect of temperature and drought length is clearly seen in Figure 3 and Figure 4.

3.2. Landscape-Scale Experiment

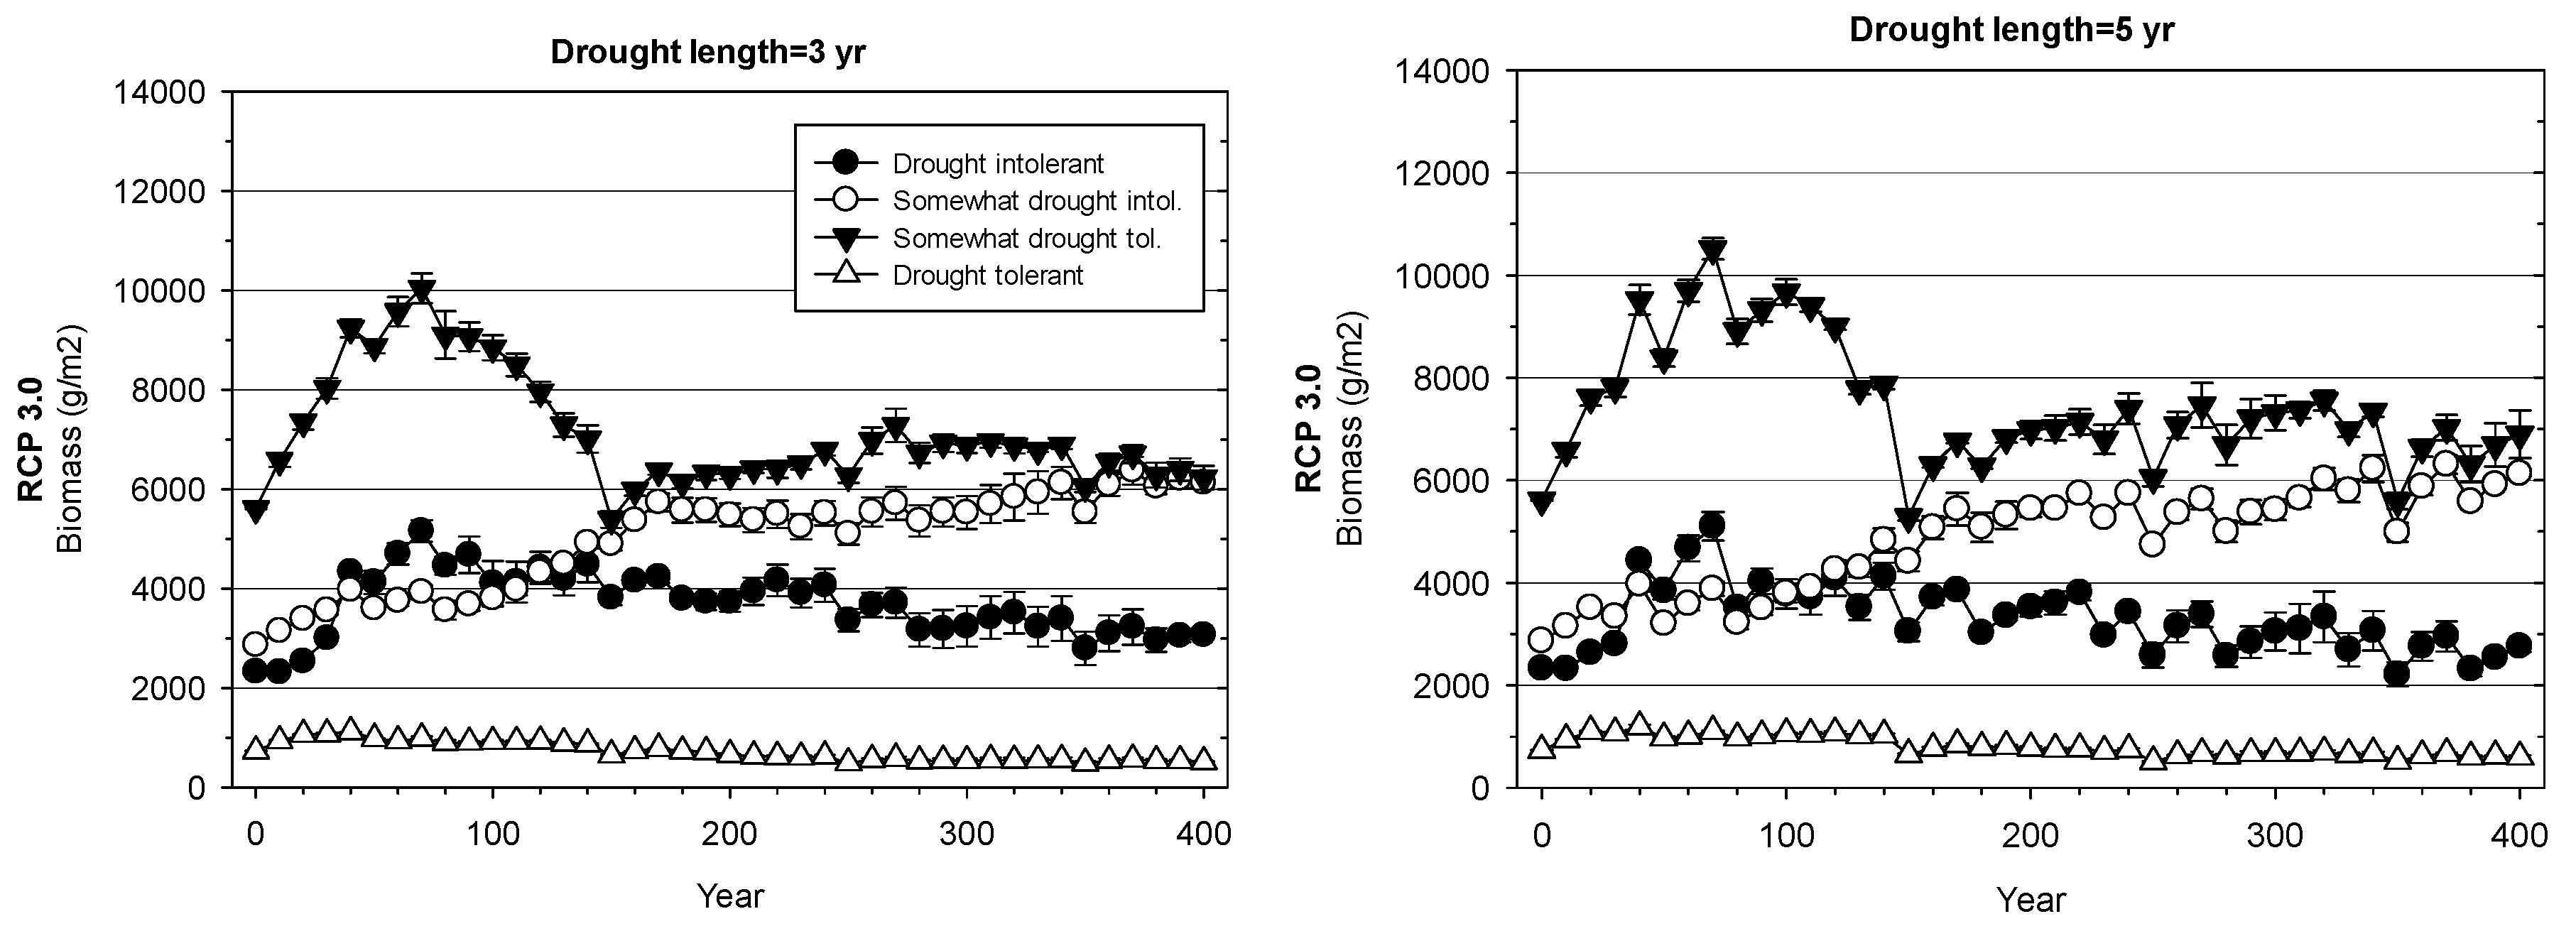
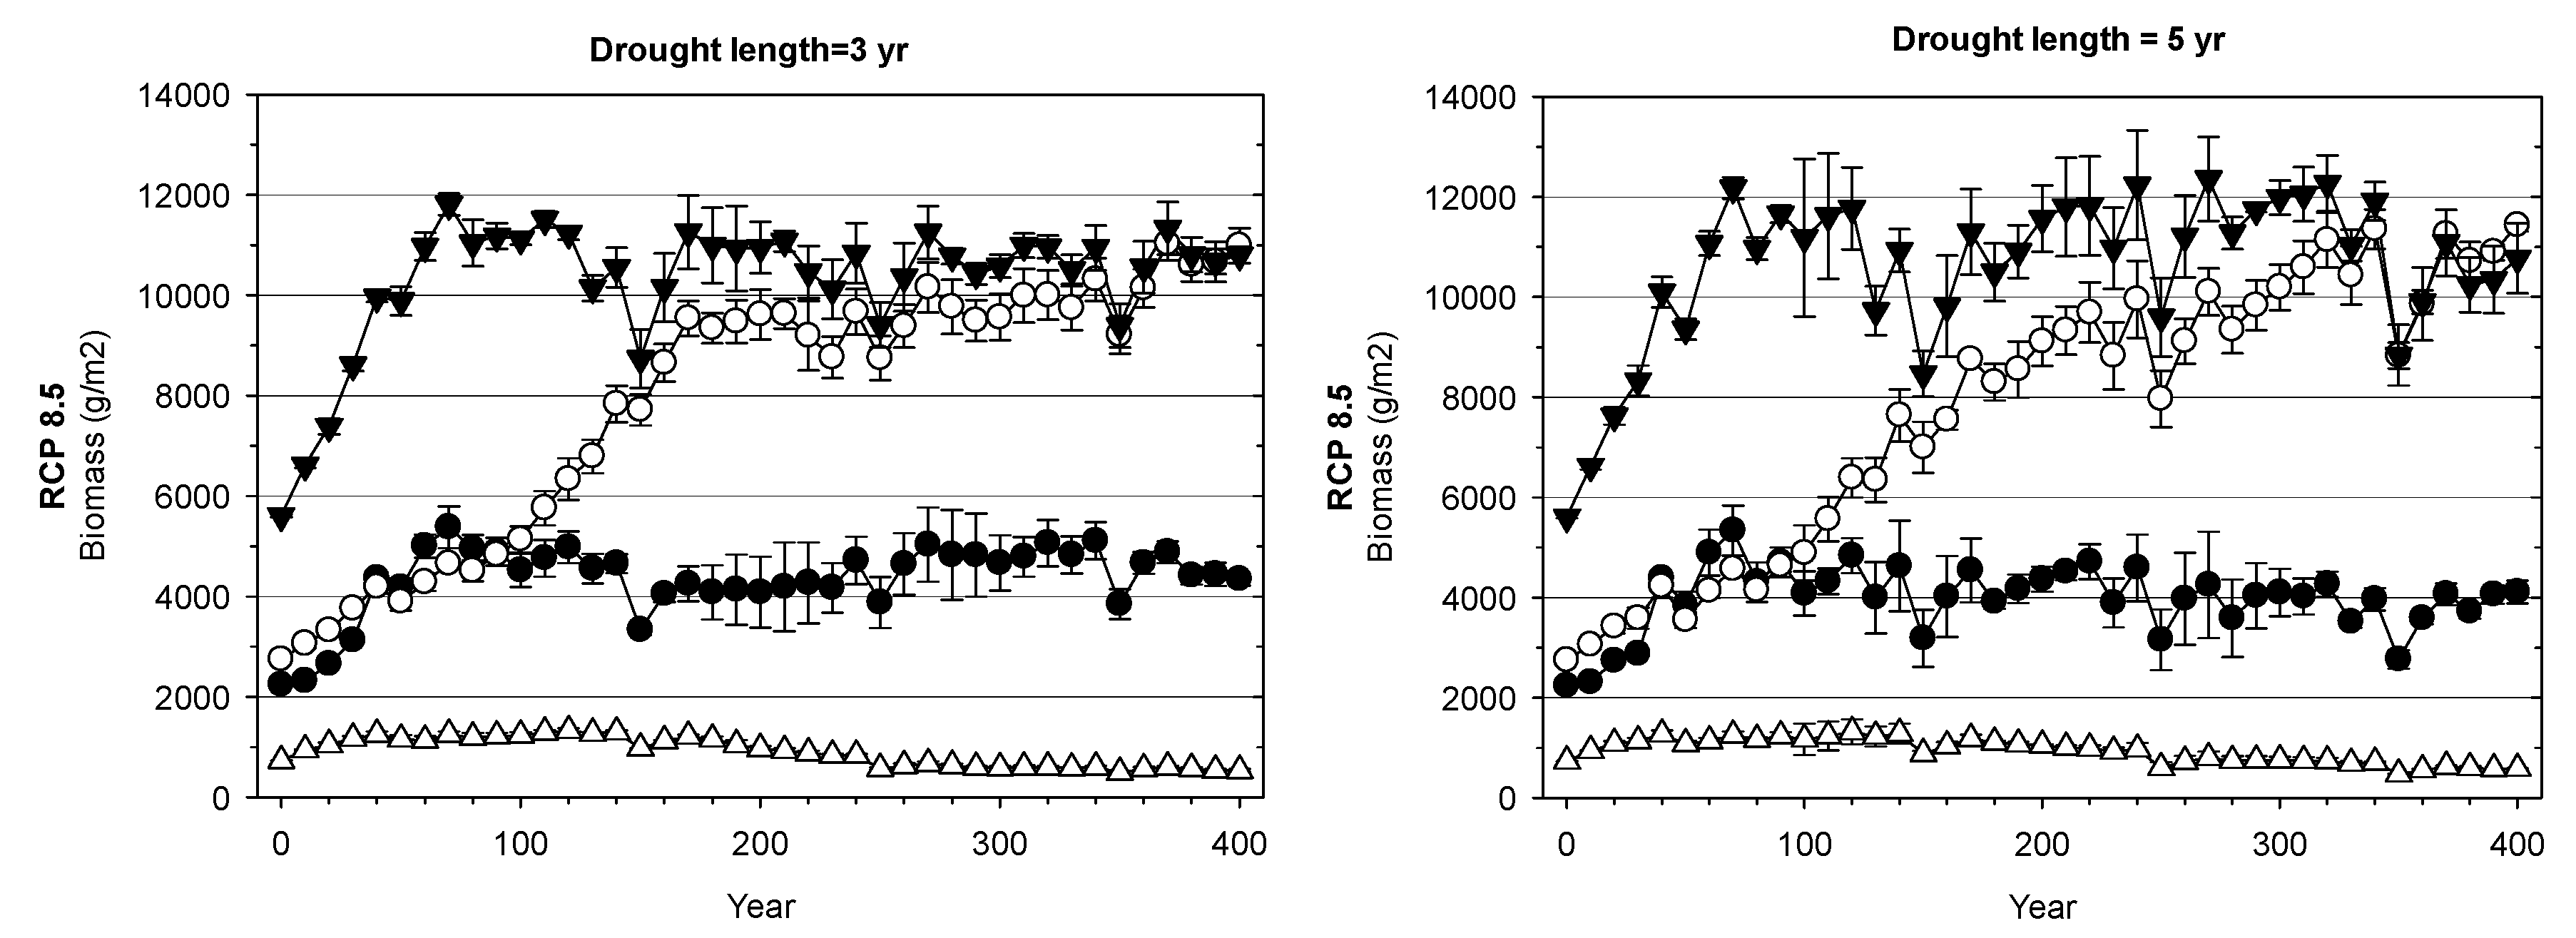
At the landscape scale, productivity was impacted by climate scenario to a much greater extent than drought length (Figure 5, Figure 6 and Figure 7). Under both climate change scenarios, longer droughts increased variability around the long-term trend, and generally, less drought-tolerant species (H4 = −1.37, −1.40 MPa) had somewhat lower biomass and more drought-tolerant species (H4 = −1.44, −1.50 MPa) had somewhat higher biomass (Figure 5). Higher CO2 concentrations and warmer temperatures (RCP8.5) generally increased the biomass of all drought-tolerance groups, and only marginally mitigated the effect of drought length. The most drought-tolerant group (H4 = −1.50 MPa) showed almost no response to drought length, although such species were very uncommon and may not have had enough photosynthetic machinery (foliage biomass) to take advantage of their competitive advantage under longer droughts.
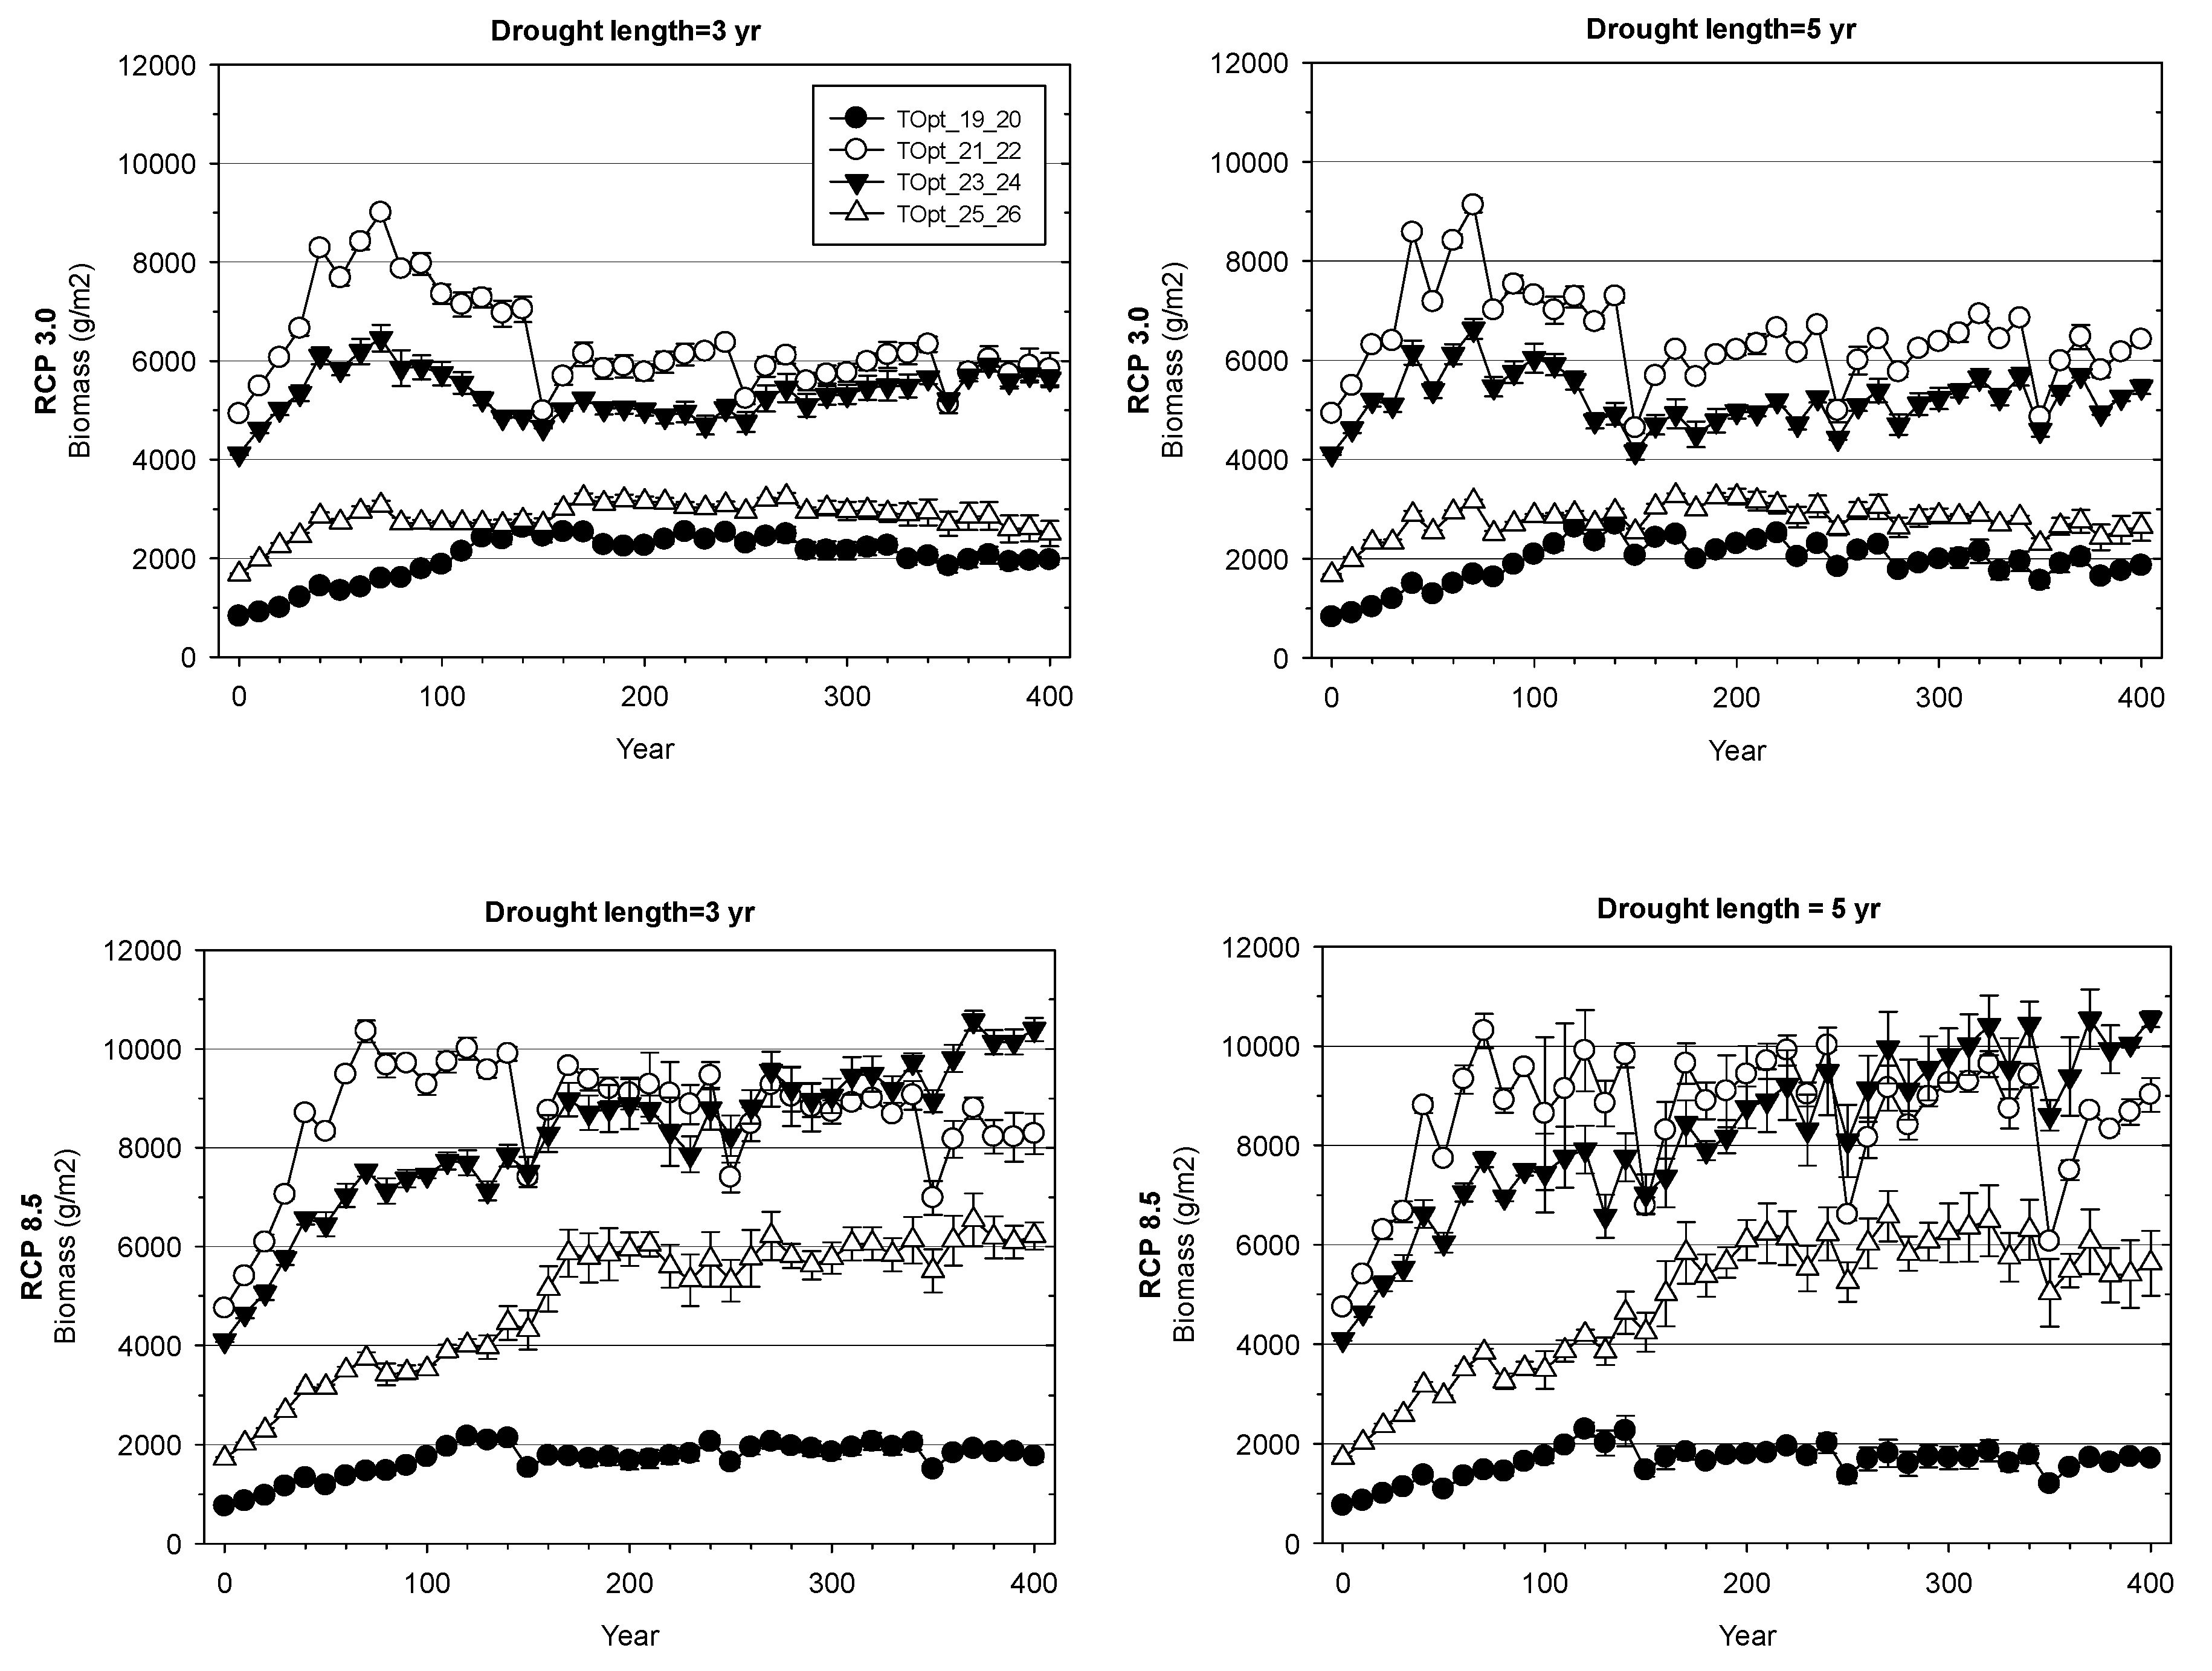
Species productivity (biomass growth) was enhanced by warmer temperatures and elevated CO2 for all but the most cold-adapted group (PsnTOpt = 19–20 °C) (Figure 6). Drought length did not greatly affect the biomass of optimal temperature groups, suggesting that drought-tolerance is not correlated with optimal temperature for the species studied.
The growth response (biomass) of forest type groups often responded dramatically to climate scenario, while the response to drought length was more subtle (Figure 7). Specific responses depended on many life history attributes, with optimal temperature and drought-tolerance being the most directly linked to the treatments. For example, aspen-birch responded negatively to both extreme climate (RCP8.5) and longer droughts. Red maple responded positively to extreme climate and negatively to longer droughts. The pine-oak-hemlock group responded positively to both extreme climate and longer droughts.
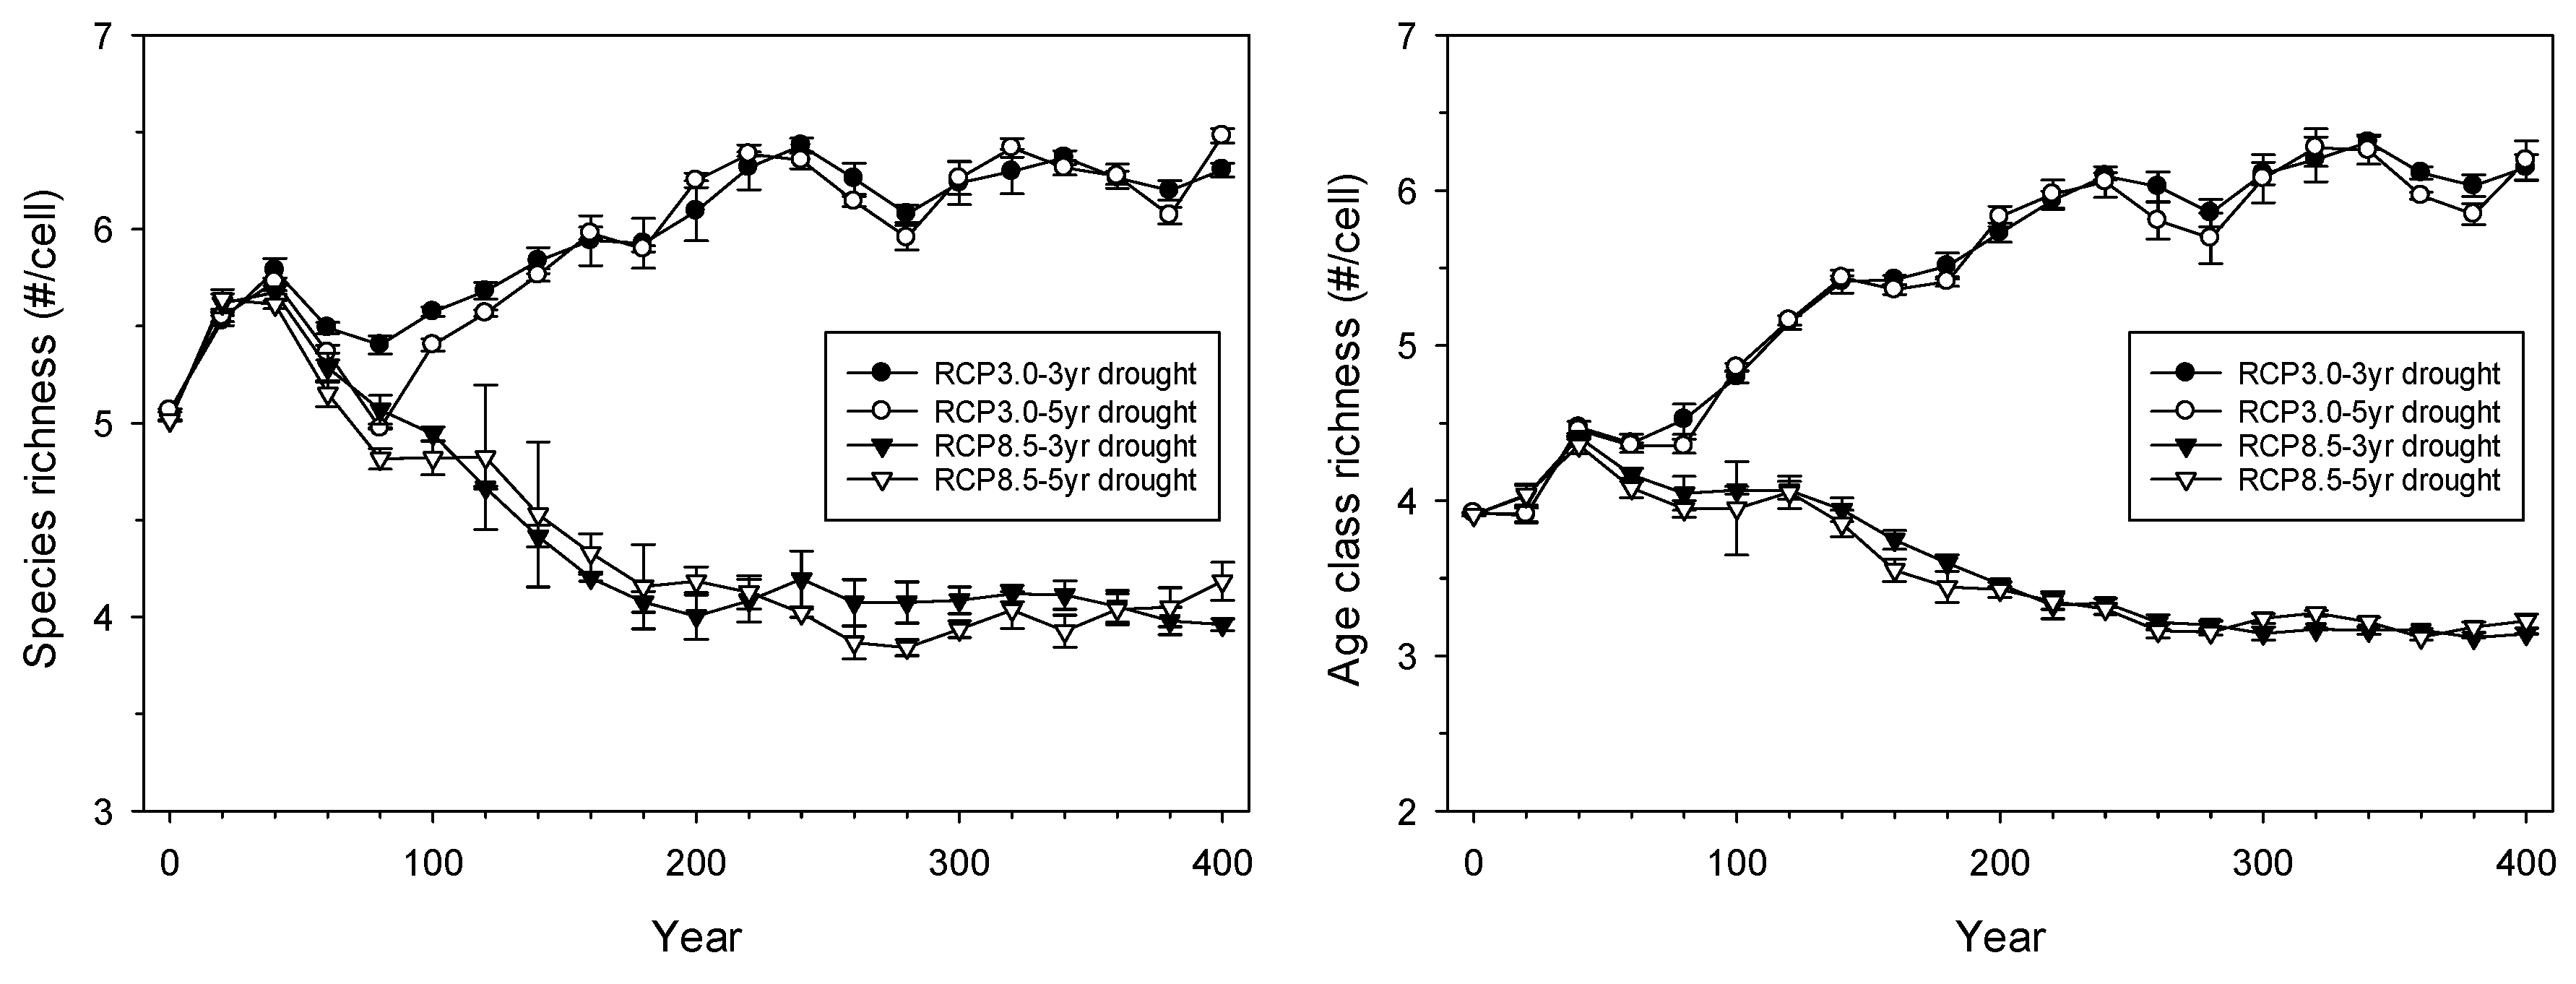
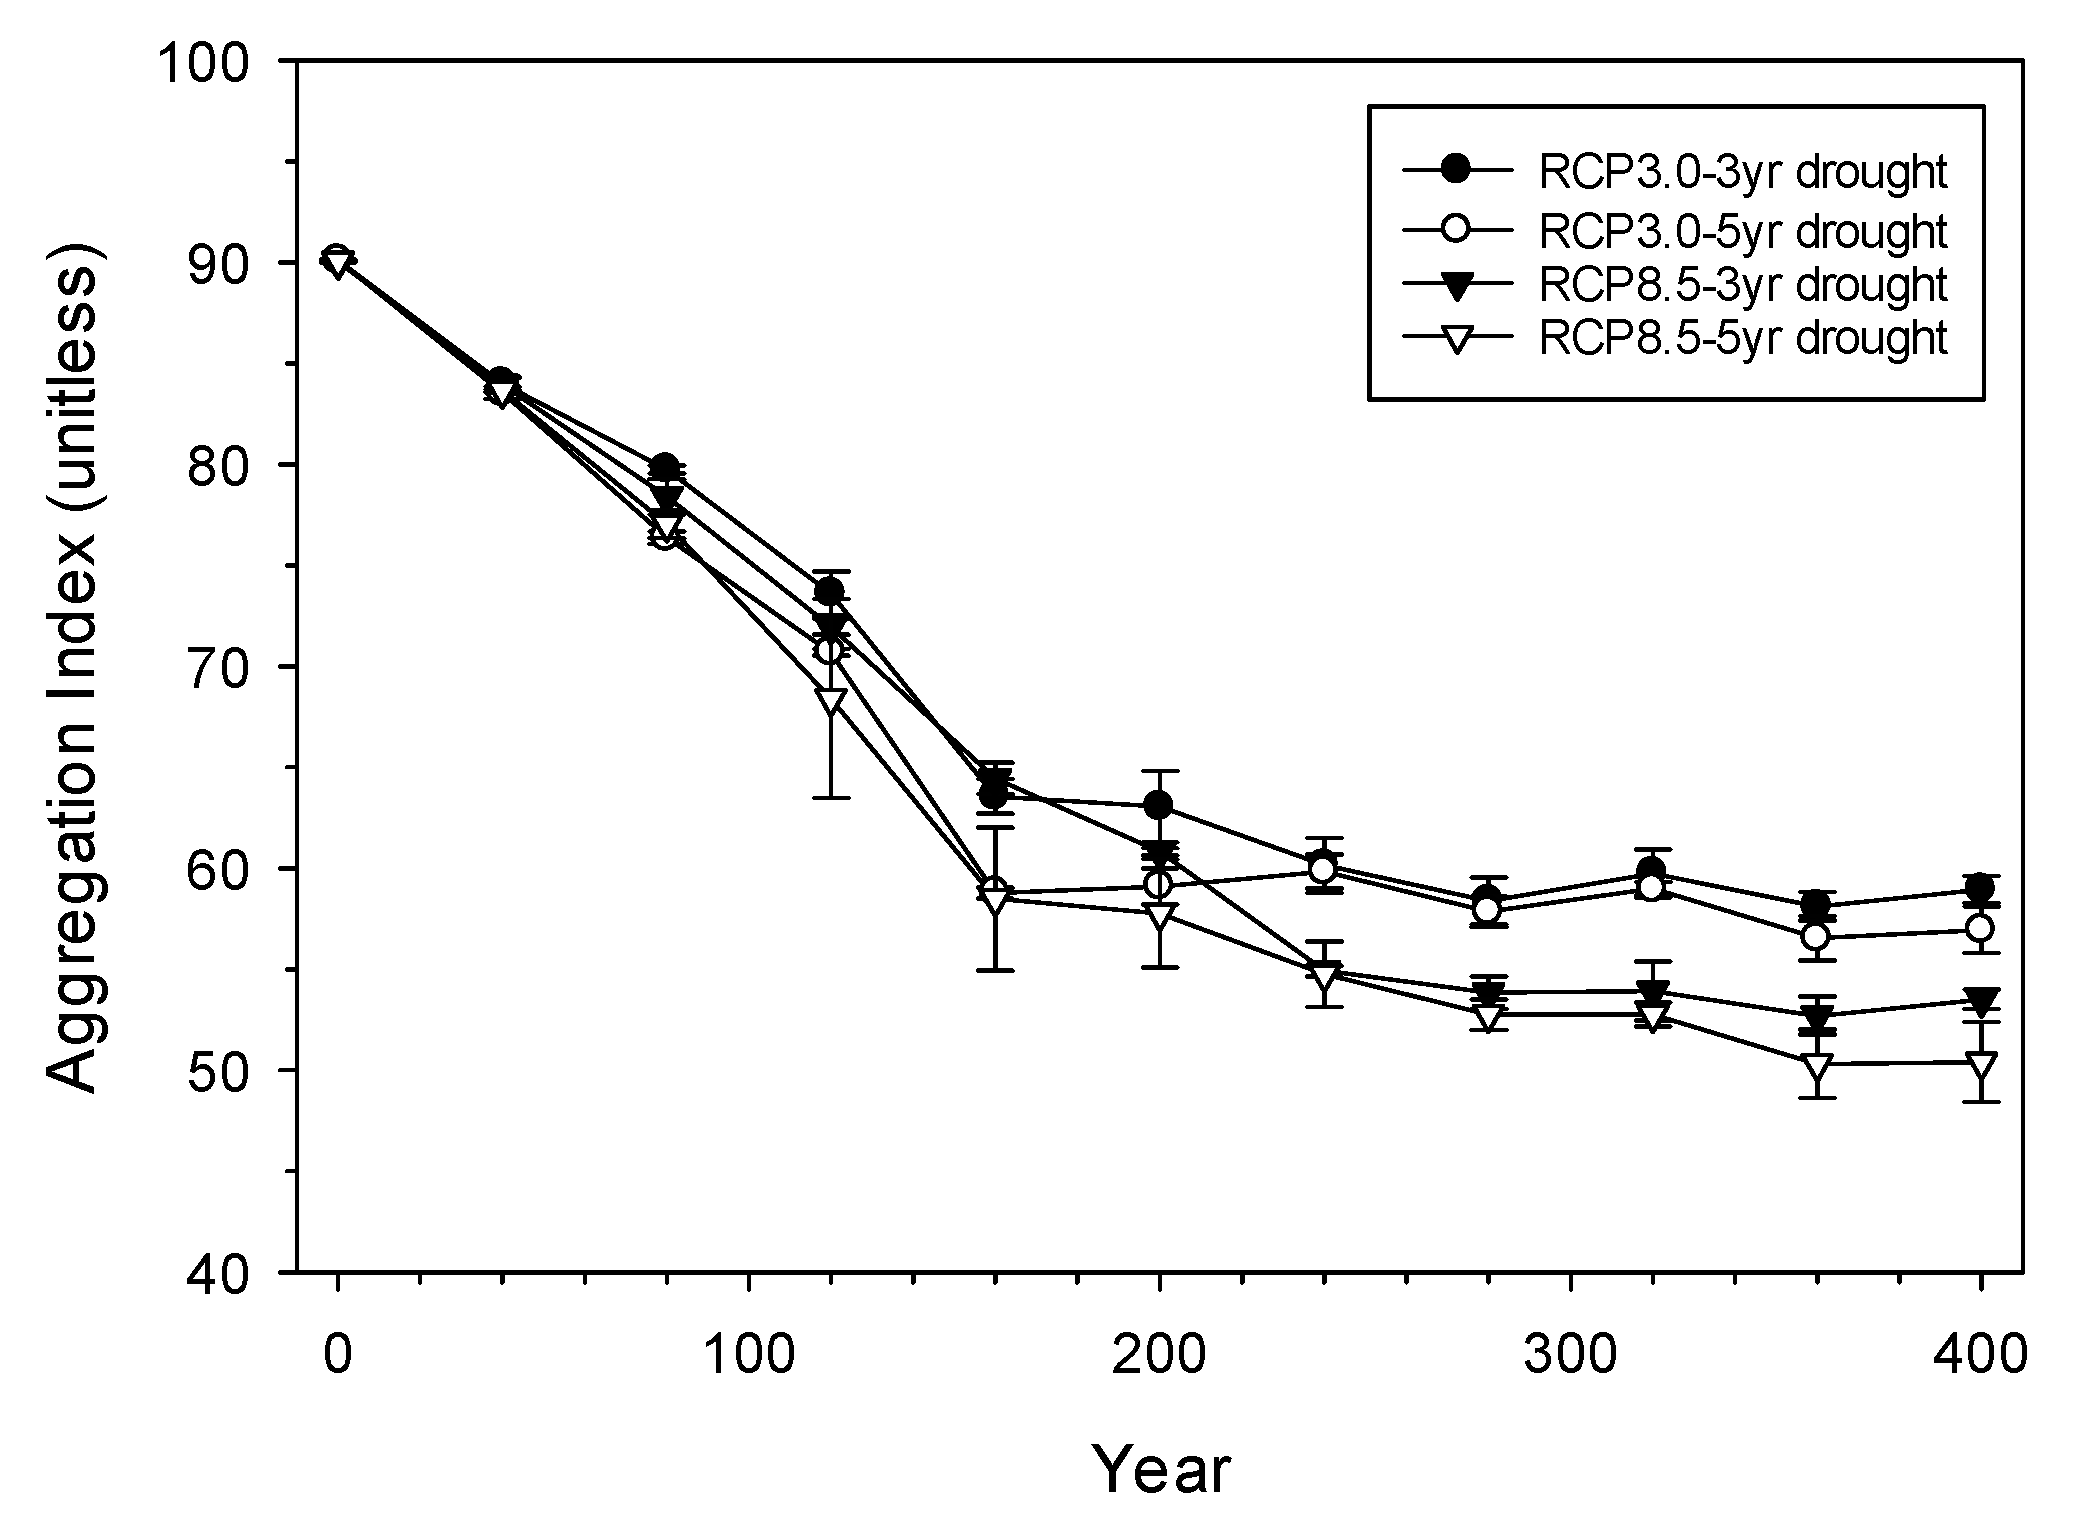
Climate had a pronounced effect on species and age class diversity (richness) while drought length did not (Figure 8). Mild climate change (RCP3.0) increased diversity, and severe climate change reduced it. Disturbances had a strong fragmenting effect on forest as defined by forest type over the first 80 years, and harsh climate change increased fragmentation somewhat in the long term compared to mild climate change (Figure 9). The effect of drought length was less pronounced, with longer droughts having a greater fragmenting effect.

4. Discussion

4.1. Site-Scale Experiment

Our results clearly show that greatly elevated CO2 stimulates productivity (NetPsn and biomass production) to such an extent that it dwarfs the negative effect of higher respiration rates caused by elevated temperature (Figure 2a,b). In Figure 3a,c, productivity measures for the next highest temperature and CO2 level are always higher than at the lower levels, indicating that a 175 ppm increase in CO2 more than compensates for the increased respiration caused by a 3 °C temperature increase. This result clarifies the results of Gustafson et al. [4] that showed a negative effect on growth of a 6-degree (C) temperature increase in the absence of the concomitant CO2 concentration that would accompany such a temperature increase. This result is consistent with empirical findings of large CO2 enrichment effects across a range of species and ecosystems. Charney et al. [35] used continent-wide empirical observations of tree sensitivity to climate and CO2 to predict increases in growth across much of North America of up to 60% under the RCP8.5 emissions scenario. In a test of the ability of PnET-Succession to simulate the effects of CO2 enrichment on tree growth and competition in the Aspen-FACE experiment in northern Wisconsin, USA [36], Gustafson et al. [14] found good agreement with empirical CO2 effects with no calibration required. Giardin et al. [37] found a negative temperature effect (attributed to respiration) on the growth of trees across Canada in the last half of the 20th century, which was not completely mitigated by the CO2 concentrations of that period (<400 ppm). It is important to note that our model does account for CO2 acclimation effects on growth as described by Franks et al. [9], and to maintenance respiration acclimation as temperature rises [15,38], so these results can be considered robust at the CO2 and temperature levels simulated. Conversely, carbon reserves (NSCfrac) were not as strongly mitigated by elevated CO2. Increased temperature reduced carbon reserves while increased CO2 concentration increased them by about the same amount (Figure 2c). Although the magnitude of the differences in mean NSCfrac may appear to be small, it is not uncommon for simulated cohorts to have “near misses” with death in the event of an extreme climate event, typically drought. Thus, a small difference in mean carbon reserves may dramatically change the likelihood of cohort survival.
The relationship between temperature and CO2 was opposite for the metric of competitive exclusion (mean age attained by cohorts) compared to all other response variables (Figure 2d), although the mechanisms driving the response was consistent for all variables. The mean age of cohorts declined when some cohorts died prematurely, reflecting competitive exclusion. Mean cohort age declined when temperature increased because the increased respiration load reduced carbon reserves and increased the risk of mortality. However, mean cohort age also declined when CO2 concentration increased, through the competition process. Elevated CO2 gave dominant cohorts an even greater competitive advantage over subdominant cohorts, which became more prone to mortality because they were less able to maintain carbon reserves.
Drought length had a surprisingly small effect on productivity measures (Figure 2a,b), but a marked negative effect on survival probability (NSCfrac and mean age) (Figure 2c,d and Figure 4c,d). In fact, the trends suggest a negative exponential decline in survival measures when droughts exceed 5 years in length (Figure 2c,d). The modest negative effect of drought length at each level of CO2 for the productivity measures (Figure 4a,b) suggests that surviving cohorts compensate for the lost productivity of killed cohorts as competition for light and water resources is reduced, consistent with the empirical results described by Gustafson and Sturtevant [7], where biomass lost to mortality on US Forest Service inventory plots increased exponentially with drought length. Elevated CO2 was able to compensate for the negative effect of longer droughts in terms of productivity measures (e.g., compare 5-year drought productivity to the 1-year drought values at the next lower CO2 level (Figure 4a,b)), but not for survival measures (Figure 4c,d). This suggests that elevated CO2 may sustain or even increase the productivity of forests in the face of rising temperatures or longer droughts, but it may not sustain species or age class diversity.
Increased soil water (AWC) always increased productivity and carbon reserves, but it also increased competitive exclusion (Figure 2). This reflects the fact that water is the primary limiting factor as cohorts gain biomass and increase transpiration demand. Increased AWC results in increased mortality of less competitive cohorts by enhancing the growth of their competitors. While elevated CO2 speeds biomass gain and therefore hastens the time when water becomes limiting, greater AWC enables greater biomass gain in response to elevated CO2. Similar to the trends for drought length, NSCfrac decreased non-linearly with decreasing AWC, suggesting that chronic water stress can rapidly reduce reserves and make cohorts more likely to die. Because water stress differs among the species on a given cell according to their drought tolerance (i.e., H3/H4, Figure 5), simulated droughts tend to kill less drought tolerant species first, potentially altering species composition.

4.2. Landscape-Scale Experiment

The tightly controlled site-level experiment clearly revealed the response of competing assemblages of species without the confounding effects of disturbances, dispersal, establishment, and the spatial pattern of soil types and existing vegetation. The landscape-scale experiment was more realistic in that it featured real assemblages of species and life history traits typical of the sub-boreal zone, and revealed whether the responses were altered when interacting with spatial legacies and landscape structuring processes. Although the treatments mostly altered the absolute biomass of most forest type groups, the rank order in biomass of forest types remained consistent, with the exception of the aspen-birch group. Even under the RCP8.5 scenario, longer droughts had about the same effect as under the RCP3.0 scenario (Figure 7). Based on these simple simulations on a single real landscape, it appears that CO2 enrichment can substantially mitigate the negative effects of elevated temperatures on forest productivity, although its ability to mitigate drought is less obvious. However, there are consequences for forest composition because there are winner and loser species under climate change. For example, the CO2 enrichment of the RCP 6.0 scenario appears to enhance the advantage of the already abundant maple-beech-basswood-yellow birch group while depressing the relative abundance of the less common aspen-birch group (Figure 7). It appears that forests would become less diverse (simplified composition at the site level) and less aggregated under the RCP8.5 scenario compared to the RCP3.0 scenario, which may lessen their resilience [39]. Our results do not provide specific insight into how forests might respond to intermediate emissions scenarios (e.g., RCP6.0), but it is reasonable to expect that outcomes would be intermediate to the scenarios studied here. The species groups with high temperature and drought tolerance (red maple, ash and cherry) did increase quite dramatically under the RCP 6.0 scenario as expected, while the one species group with consistently low temperature and drought tolerance (paper birch and aspens) increased much less dramatically (Figure 7), providing some support to our hypothesis that disturbances will catalyze a shift in species composition based on tolerance to heart and water stress.
Our landscape experiment illustrates the power of a mechanistic landscape model to scale up physiological first principles that are typically derived and applied at leaf and plant scales to the landscape scale. Although empirical studies reveal the general response to elevated CO2 and O3 [10,11], such studies are unable to illuminate the interaction effects with other abiotic (e.g., temperature, wind, harvest) and biotic (e.g., insects) stressors. All processes that structure the landscape were simulated at a scale appropriate to the drivers and the mechanisms that underlie their behavior, and they each act somewhat independently on the vegetation state of cells (in our case, the biomass of the extant cohorts), with the interaction of all these processes across all the cells of the landscape representing the projected forest dynamics. Because most processes are linked mechanistically to climate and vegetation drivers, using this approach to predict the effects of environmental conditions without historical analog (e.g., climate change) is notably powerful and robust [40]. Reichstein et al. [41] point out that climate extremes such as droughts and heat waves have the potential to negate the expected increase in carbon stocks predicted by studies such as ours, and our mechanistic modeling approach is well-suited to integrate such climate extremes into the simulation of ecosystem response.
Our results, combined with those of Gustafson et al. [4], help suggest mechanisms for results reported by others. Duveneck et al. [42] and Wang et al. [43] simulated increased biomass in temperate US forests over the next century, attributing the increase to longer growing seasons caused by warming temperatures. Our results suggest that elevated CO2 may be an important contributing cause. Giardin et al. [44] simulated the effects of climate change on the growth of black spruce in Canada, and found negative impacts attributed to increased maintenance respiration associated with high summer temperatures and water stress that were only partially ameliorated by elevated CO2 concentrations. Because black spruce is slow-growing, easily subject to water stress, and loses approximately two-thirds of its gross primary productivity to respiration [45], elevated CO2 is unlikely to increase the low natural productivity of black spruce enough to offset the negative effects of temperature and water stress. Sanchez-Salguero et al. [46] reported a simulated decline in tree productivity in Spain under various RCP emissions scenarios, including RCP8.5, which was attributed to temperature and water stress effects on photosynthesis. However, their model did not simulate any CO2 effects on water use efficiency or photosynthesis, which our results suggest may have compromised their findings. Nemani et al. [47] used productivity efficiency models to show that climate changes (1982–1999) relaxed climatic limitations (temperature, water and light) on plant growth globally. This result from the last century is consistent with the results of Gustafson et al. [4], and our current results suggest that increasing CO2 concentrations can be expected to mitigate future climate constraints to some extent. These are but a few examples of the many studies for which the findings reported here can provide insight into the mechanisms behind their results.

5. Conclusions

Our results provided insight into our hypotheses. (1) We hypothesized that chronically elevated CO2 concentrations would increase growth rates even at high temperatures, and our results clearly support this. However, it should be noted that our model assumes that soil nutrients are not limited, and that actual growth rates on perhaps the majority of forested sites globally may be less than we project [48,49]; (2) We also hypothesized that increased drought length would produce a greater negative effect on growth than just a proportional decrease in precipitation. This hypothesis was not supported. Gustafson et al. [4] found that NSCfrac decreased by about 8% when monthly precipitation was reduced by 40%, and we found that increasing drought length from 1 year to 5 years decreased NSCfrac by only about 2%; (3) We also thought that there may be an interaction with CO2 such that drought effects are also mitigated by high CO2 concentrations by reducing stomatal water loss. Our results (Figure 4) suggest that elevated CO2 does not protect trees from drought; (4) Finally, we hypothesized that disturbance would increase landscape-wide productivity under elevated temperature and water stress and elevated CO2 by hastening a species composition change favoring species with greater heat and drought tolerance. Our results showed that drought tolerant species did not increase in biomass under climate change, while all species with an optimal temperature greater than 20 °C did increase in biomass (Figure 5 and Figure 6). Species groups with high drought and heat tolerance increased to a greater extent under the RCP 6.0 scenario than did the group with low tolerances. Together, these results support the hypothesis, but they cannot be considered definitive because we did not compare these results to a no-disturbance scenario.
We conclude that elevated CO2 can indeed mitigate the decrease in net photosynthesis resulting from increased respiration costs caused by increasing temperature, but the ability of CO2 to mitigate water and light stress is not as strong. Our results suggest that forest managers can expect that elevated CO2 in the future will increase forest productivity even as temperatures rise, and even if droughts become more frequent and of longer duration. However, they can also expect that forests will become more simplified as less competitive species experience a somewhat enhanced mortality.

Supplementary Materials

The following are available online at https://www.mdpi.com/1999-4907/9/11/664/s1, PnET-Succession input files for the landscape experiment.

Author Contributions

Conceptualization, E.J.G. and B.R.S.; Data curation, E.J.G.; Formal analysis, E.J.G., B.R.M. and B.R.S.; Funding acquisition, E.J.G.; Investigation, E.J.G.; Methodology, E.J.G. and B.R.M.; Project administration, E.J.G.; Resources, E.J.G.; Software, E.J.G. and B.R.M.; Supervision, E.J.G.; Validation, E.J.G.; Writing—original draft, E.J.G.; Writing—review and editing, B.R.M. and B.R.S.

Funding

This research received no external funding.

Acknowledgments

This study was funded by the Northern Research Station of the USDA Forest Service. We thank Meghan Graham MacLean and Yan Boulanger for critical reviews of the manuscript.

Conflicts of Interest

The authors declare no conflict of interest.

References

  1. IPCC. Climate Change 2013: The Physical Science Basis. Contribution of Working Group I to the Fifth Assessment Report of the Intergovernmental Panel on Climate Change; Cambridge University Press: Cambridge, UK, 2014; ISBN 978-1-107-05799-1. [Google Scholar]
  2. Shao, H.-B.; Li-Ye, C.; Cheruth, A.J.; Chang-Xing, Z. Water-deficit stress-induced anatomical changes in higher plants. C. R. Biol. 2008, 331, 215–225. [Google Scholar] [CrossRef] [PubMed]
  3. McDowell, N.G.; Fisher, R.A.; Xu, C.; Domec, J.C.; Hölttä, T.; Mackay, D.S.; Sperry, J.S.; Boutz, A.; Dickman, L.; Gehres, N.; et al. Evaluating theories of drought-induced vegetation mortality using a multimodel–experiment framework. New Phytol. 2013, 200, 304–321. [Google Scholar] [CrossRef] [PubMed]
  4. Gustafson, E.J.; Miranda, B.R.; De Bruijn, A.M.G.; Sturtevant, B.R.; Kubiske, M.E. Do rising temperatures always increase forest productivity? Interacting effects of temperature, precipitation, cloudiness and soil texture on tree species growth and competition. Environ. Model. Softw. 2017, 97, 171–183. [Google Scholar] [CrossRef]
  5. Way, D.A.; Oren, R. Differential responses to changes in growth temperature between trees from different functional groups and biomes: A review and synthesis of data. Tree Physiol. 2010, 30, 669–688. [Google Scholar] [CrossRef] [PubMed]
  6. Aber, J.D.; Ollinger, S.V.; Federer, C.A.; Reich, P.B.; Goulden, M.L.; Kicklighter, D.W.; Melillo, J.M.; Lathrop, R.G., Jr. Predicting the effects of climate change on water yield and forest production in the northeastern United States. Clim. Res. 1995, 5, 207–222. [Google Scholar] [CrossRef] [Green Version]
  7. Gustafson, E.J.; Sturtevant, B.R. Modeling forest mortality caused by drought stress: Implications for climate change. Ecosystems 2013, 16, 60–74. [Google Scholar] [CrossRef]
  8. Gustafson, E.J.; De Bruijn, A.M.G.; Miranda, B.R.; Sturtevant, B.R. Implications of mechanistic modeling of drought effects on growth and competition in forest landscape models. Ecosphere 2016, 7, e01253. [Google Scholar] [CrossRef] [Green Version]
  9. Franks, P.J.; Adams, M.A.; Amthor, J.S.; Barbour, M.M.; Berry, J.A.; Ellsworth, D.S.; Farquhar, G.D.; Ghannoum, O.; Lloyd, J.; McDowell, N.; et al. Sensitivity of plants to changing atmospheric CO2 concentration: From the geological past to the next century. New Phytol. 2013, 197, 1077–1094. [Google Scholar] [CrossRef] [PubMed]
  10. Dieleman, W.I.; Vicca, S.; Dijkstra, F.A.; Hagedorn, F.; Hovenden, M.J.; Larsen, K.S.; Morgan, J.A.; Volder, A.; Beier, C.; Dukes, J.S.; et al. Simple additive effects are rare: A quantitative review of plant biomass and soil process responses to combined manipulations of CO2 and temperature. Glob. Chang. Biol. 2012, 18, 2681–2693. [Google Scholar] [CrossRef] [PubMed]
  11. van der Kooi, C.J.; Reich, M.; Löw, M.; De Kok, L.J.; Tausz, M. Growth and yield stimulation under elevated CO2 and drought: A meta-analysis on crops. Environ. Exp. Bot. 2016, 122, 150–157. [Google Scholar] [CrossRef]
  12. De Bruijn, A.; Gustafson, E.J.; Sturtevant, B.R.; Foster, J.R.; Miranda, B.R.; Lichti, N.I.; Jacobs, D.F. Toward more robust projections of forest landscape dynamics under novel environmental conditions: Embedding PnET within LANDIS-II. Ecol. Model. 2014, 287, 44–57. [Google Scholar] [CrossRef]
  13. Scheller, R.M.; Domingo, J.B.; Sturtevant, B.R.; Williams, J.S.; Rudy, A.; Gustafson, E.J.; Mladenoff, D.J. Design, development, and application of LANDIS-II, a spatial landscape simulation model with flexible temporal and spatial resolution. Ecol. Model. 2007, 201, 409–419. [Google Scholar] [CrossRef]
  14. Gustafson, E.J.; Kubiske, M.E.; Sturtevant, B.R.; Miranda, B.R.; Hoshika, Y.; Paoletti, E. Extrapolating plot-scale CO2 and ozone enrichment experimental results to novel conditions and scales using mechanistic modeling. Ecol. Process. 2018, 7, 31. [Google Scholar] [CrossRef]
  15. Atkin, O.K.; Tjoelker, M.G. Thermal acclimation and the dynamic response of plant respiration to temperature. Trends Plant Sci. 2003, 8, 343–351. [Google Scholar] [CrossRef]
  16. Wythers, K.R.; Reich, P.B.; Bradford, J.B. Incorporating temperature-sensitive Q10 and foliar respiration acclimation algorithms modifies modeled ecosystem responses to global change. J. Geophys. Res. BioGeosci. 2013, 118, 1–14. [Google Scholar] [CrossRef]
  17. Gustafson, E.J.; De Bruijn, A.M.; Pangle, R.E.; Limousin, J.M.; McDowell, N.G.; Pockman, W.T.; Sturtevant, B.R.; Muss, J.D.; Kubiske, M.E. Integrating ecophysiology and forest landscape models to better project drought effects under climate change. Glob. Chang. Biol. 2015, 21, 843–856. [Google Scholar] [CrossRef] [PubMed]
  18. Watanabe, S.; Hajima, T.; Sudo, K.; Nagashima, T.; Takemura, T.; Okajima, H.; Nozawa, T.; Kawase, H.; Abe, M.; Yokohata, T.; et al. MIROC-ESM 2010: Model description and basic results of CMIP5-20c3m experiments. Geosci. Model Dev. 2011, 4, 845–872. [Google Scholar] [CrossRef]
  19. Saxton, K.E.; Rawls, W.J. Soil Water Characteristic Equations. 2004. Available online: https://www.ars.usda.gov/research/software/download/?softwareid=492&modecode=80-42-05-10ml (accessed on 2 April 2018).
  20. Searle, S.R.; Speed, F.M.; Milliken, G.A. Population Marginal Means in the Linear Model: An Alternative to Least Squares Means. Am. Stat. 1980, 34, 216–221. [Google Scholar]
  21. White, J.W.; Rassweiler, A.; Samhouri, J.F.; Stier, A.C.; White, C. Ecologists should not use statistical significance tests to interpret simulation model results. Oikos 2014, 123, 385–388. [Google Scholar] [CrossRef]
  22. Soil Survey Staff, Natural Resources Conservation Service, United States Department of Agriculture. Soil Survey Geographic (SSURGO) Database. 2013. Available online: http://sdmdataaccess.nrcs.usda.gov/ (accessed on 1 May 2018).
  23. Janowiak, M.K.; Iverson, L.R.; Mladenoff, D.J.; Peters, E.; Wythers, K.R.; Xi, W.; Brandt, L.A.; Butler, P.R.; Handler, S.D.; Shannon, P.D.; et al. Forest Ecosystem Vulnerability Assessment and Synthesis for Northern Wisconsin and Western Upper Michigan: A Report from the Northwoods Climate Change Response Framework Project; Gen. Tech. Rep. NRS-136; U.S. Department of Agriculture, Forest Service, Northern Research Station: Newtown Square, PA, USA, 2014; p. 247.
  24. Wilson, B.T.; Lister, A.J.; Riemann, R.I. A nearest-neighbor imputation approach to mapping tree species over large areas using forest inventory plots and moderate resolution raster data. For. Ecol. Manag. 2012, 271, 182–198. [Google Scholar] [CrossRef]
  25. Kittel, T.G.F.; Rosenbloom, N.A.; Kaufman, C.; Royle, J.A.; Daly, C.; Fisher, H.H.; Gibson, W.P.; Aulenbach, S.; Yates, D.N.; McKeown, R.; et al. VEMAP 2: U.S. Monthly Climate Change Scenarios, Version 2; ORNL DAAC: Oak Ridge, TN, USA, 2000; Available online: https://doi.org/10.3334/ORNLDAAC/567 (accessed on 2 April 2018).
  26. Scheller, R.M.; Domingo, J.B. LANDIS-II Base Fire v3.1: Extension User Guide; LANDIS-II Foundation: Madison, WI, USA, 2017; Available online: http://www.landis-ii.org/extensions/base-fire (accessed on 2 April 2018).
  27. Sturtevant, B.; Miranda, B.; Yang, J.; He, H.; Gustafson, E.; Scheller, R. Studying fire mitigation strategies in multi-ownership landscapes: Balancing the management of fire-dependent ecosystems and fire risk. Ecosystems 2009, 12, 445–461. [Google Scholar] [CrossRef]
  28. Scheller, R.M.; Domingo, J.B. LANDIS-II Base Wind v2.0: Extension User Guide; LANDIS-II Foundation: Madison, WI, USA, 2011; Available online: http://www.landis-ii.org/extensions/base-wind (accessed on 2 April 2018).
  29. Rich, R.L.; Frelich, L.E.; Reich, P.B. Wind-throw mortality in the southern boreal forest: Effects of species, diameter and stand age. J. Ecol. 2007, 95, 1261–1273. [Google Scholar] [CrossRef]
  30. Gustafson, E.J.; Miranda, B.R.; Sturtevant, B.R. Linear Wind Disturbance v1.0 Extension User Guide; LANDIS-II Foundation: Madison, WI, USA, 2016; Available online: http://www.landis-ii.org/extensions/linear-wind (accessed on 2 April 2018).
  31. Johnson, E.A.; Miyanishi, K. (Eds.) Plant Disturbance Ecology; Academic Press: Burlington, MA, USA, 2007; pp. 59–101. ISBN 978012088778. [Google Scholar]
  32. About Tornadoes. Available online: http://www.wunderground.com/resources/education/tornadoFAQ.asp?MR=1 (accessed on 23 October 2018).
  33. Gustafson, E.J.; Shifley, S.R.; Mladenoff, D.J.; He, H.S.; Nimerfro, K.K. Spatial simulation of forest succession and timber harvesting using LANDIS. Can. J. For. Res. 2000, 30, 32–43. [Google Scholar] [CrossRef]
  34. He, H.S.; DeZonia, B.E.; Mladenoff, D.J. An aggregation index (AI) to quantify spatial patterns of landscapes. Landsc. Ecol. 2000, 15, 591–601. [Google Scholar] [CrossRef]
  35. Charney, N.D.; Babst, F.; Poulter, B.; Record, S.; Trouet, V.M.; Frank, D.; Enquist, B.J.; Evans, M.E.; Calcagno, V. Observed forest sensitivity to climate implies large changes in 21st century North American forest growth. Ecol. Lett. 2016, 19, 1119–1128. [Google Scholar] [CrossRef] [PubMed]
  36. Dickson, R.E.; Lewin, K.F.; Isebrands, J.G.; Coleman, M.D.; Heilman, W.E.; Riemenschneider, D.E.; Sober, J.; Host, G.E.; Zak, D.R.; Hendrey, G.R.; et al. Forest Atmosphere Carbon Transfer and Storage (FACTS-II) the Aspen Free-Air CO2 and O3 Enrichment (FACE) Project: An Overview; USDA Forest Service Gen. Tech. Rep. NC-214, North Central Research Station: St. Paul, MN, USA, 2000. [Google Scholar]
  37. Girardin, M.P.; Bouriaud, O.; Hogg, E.H.; Kurz, W.; Zimmermann, N.E.; Metsaranta, J.M.; de Jong, R.; Frank, D.C.; Esper, J.; Büntgen, U.; et al. No growth stimulation of Canada’s boreal forest under half-century of combined warming and CO2 fertilization. Proc. Nat. Acad. Sci. USA 2016, 113, E8406–E8414. [Google Scholar] [CrossRef] [PubMed]
  38. Wythers, K.R.; Reich, P.B.; Tjoelker, M.G.; Bolstad, P.B. Foliar respiration acclimation to temperature and temperature variable Q10 alter ecosystem carbon balance. Glob. Chang. Biol. 2005, 11, 435–449. [Google Scholar] [CrossRef]
  39. McCann, K.S. The diversity–stability debate. Nature 2000, 405, 228–233. [Google Scholar] [CrossRef] [PubMed]
  40. Gustafson, E.J. When relationships estimated in the past cannot be used to predict the future: Using mechanistic models to predict landscape ecological dynamics in a changing world. Landsc. Ecol. 2013, 28, 1429–1437. [Google Scholar] [CrossRef]
  41. Reichstein, M.; Bahn, M.; Ciais, P.; Frank, D.; Mahecha, M.D.; Seneviratne, S.I.; Zscheischler, J.; Beer, C.; Buchmann, N.; Frank, D.C.; et al. Climate extremes and the carbon cycle. Nature 2013, 500, 287–295. [Google Scholar] [CrossRef] [PubMed]
  42. Duveneck, M.; Thompson, J.R.; De Bruijn, A.; Gustafson, E. Recovery dynamics and climate change effects to future New England forests. Landsc. Ecol. 2016, 32, 1385–1397. [Google Scholar] [CrossRef]
  43. Wang, W.J.; He, H.S.; Thompson, F.R.; Fraser, J.S.; Dijak, W.D. Changes in forest biomass and tree species distribution under climate change in the Northeastern United States. Landsc. Ecol. 2016, 32, 1399–1413. [Google Scholar] [CrossRef]
  44. Giardin, M.P.; Hogg, E.H.; Bernier, P.Y.; Kurz, W.A.; Guo, X.J.; Cyr, G. Negative impacts of high temperatures on growth of black spruce forests intensify with the anticipated climate warming. Glob. Chang. Biol. 2016, 22, 627–643. [Google Scholar] [CrossRef] [PubMed]
  45. Hermle, S.; Lavigne, M.B.; Bernier, P.Y.; Bergeron, O.; Paré, D. Component respiration, ecosystem respiration and net primary production of a mature black spruce forest in northern Quebec. Tree Phys. 2010, 30, 527–540. [Google Scholar] [CrossRef] [PubMed] [Green Version]
  46. Sánchez-Salguero, R.; Camarero, J.J.; Gutiérrez, E.; González Rouco, F.; Gazol, A.; Sangüesa-Barreda, G.; Andreu-Hayles, L.; Linares, J.C.; Seftigen, K. Assessing forest vulnerability to climate warming using a process-based model of tree growth: Bad prospects for rear-edges. Glob. Chang. Biol. 2017, 23, 2705–2719. [Google Scholar] [CrossRef] [PubMed]
  47. Nemani, R.R.; Keeling, C.D.; Hashimoto, H.; Jolly, W.M.; Piper, S.C.; Tucker, C.J.; Myneni, R.B.; Running, S.W. Climate-driven increases in global terrestrial net primary production from 1982 to 1999. Science 2003, 300, 1560–1563. [Google Scholar] [CrossRef] [PubMed]
  48. Oren, R.; Ellsworth, D.S.; Johnsen, K.H.; Phillips, N.; Ewers, B.E.; Maier, C.; Schäfer, K.V.R.; McCarthy, H.; Hendrey, G.; McNulty, S.G.; et al. Soil fertility limits carbon sequestration by forest ecosystems in a CO2-enriched atmosphere. Nature 2001, 411, 411–469. [Google Scholar] [CrossRef] [PubMed]
  49. De Graaff, M.; Van Groenigen, K.; Six, J.; Hungate, B.; Van Kessel, C. Interactions between plant growth and soil nutrient cycling under elevated CO2: A meta-analysis. Glob. Chang. Biol. 2006, 12, 2077–2091. [Google Scholar] [CrossRef]
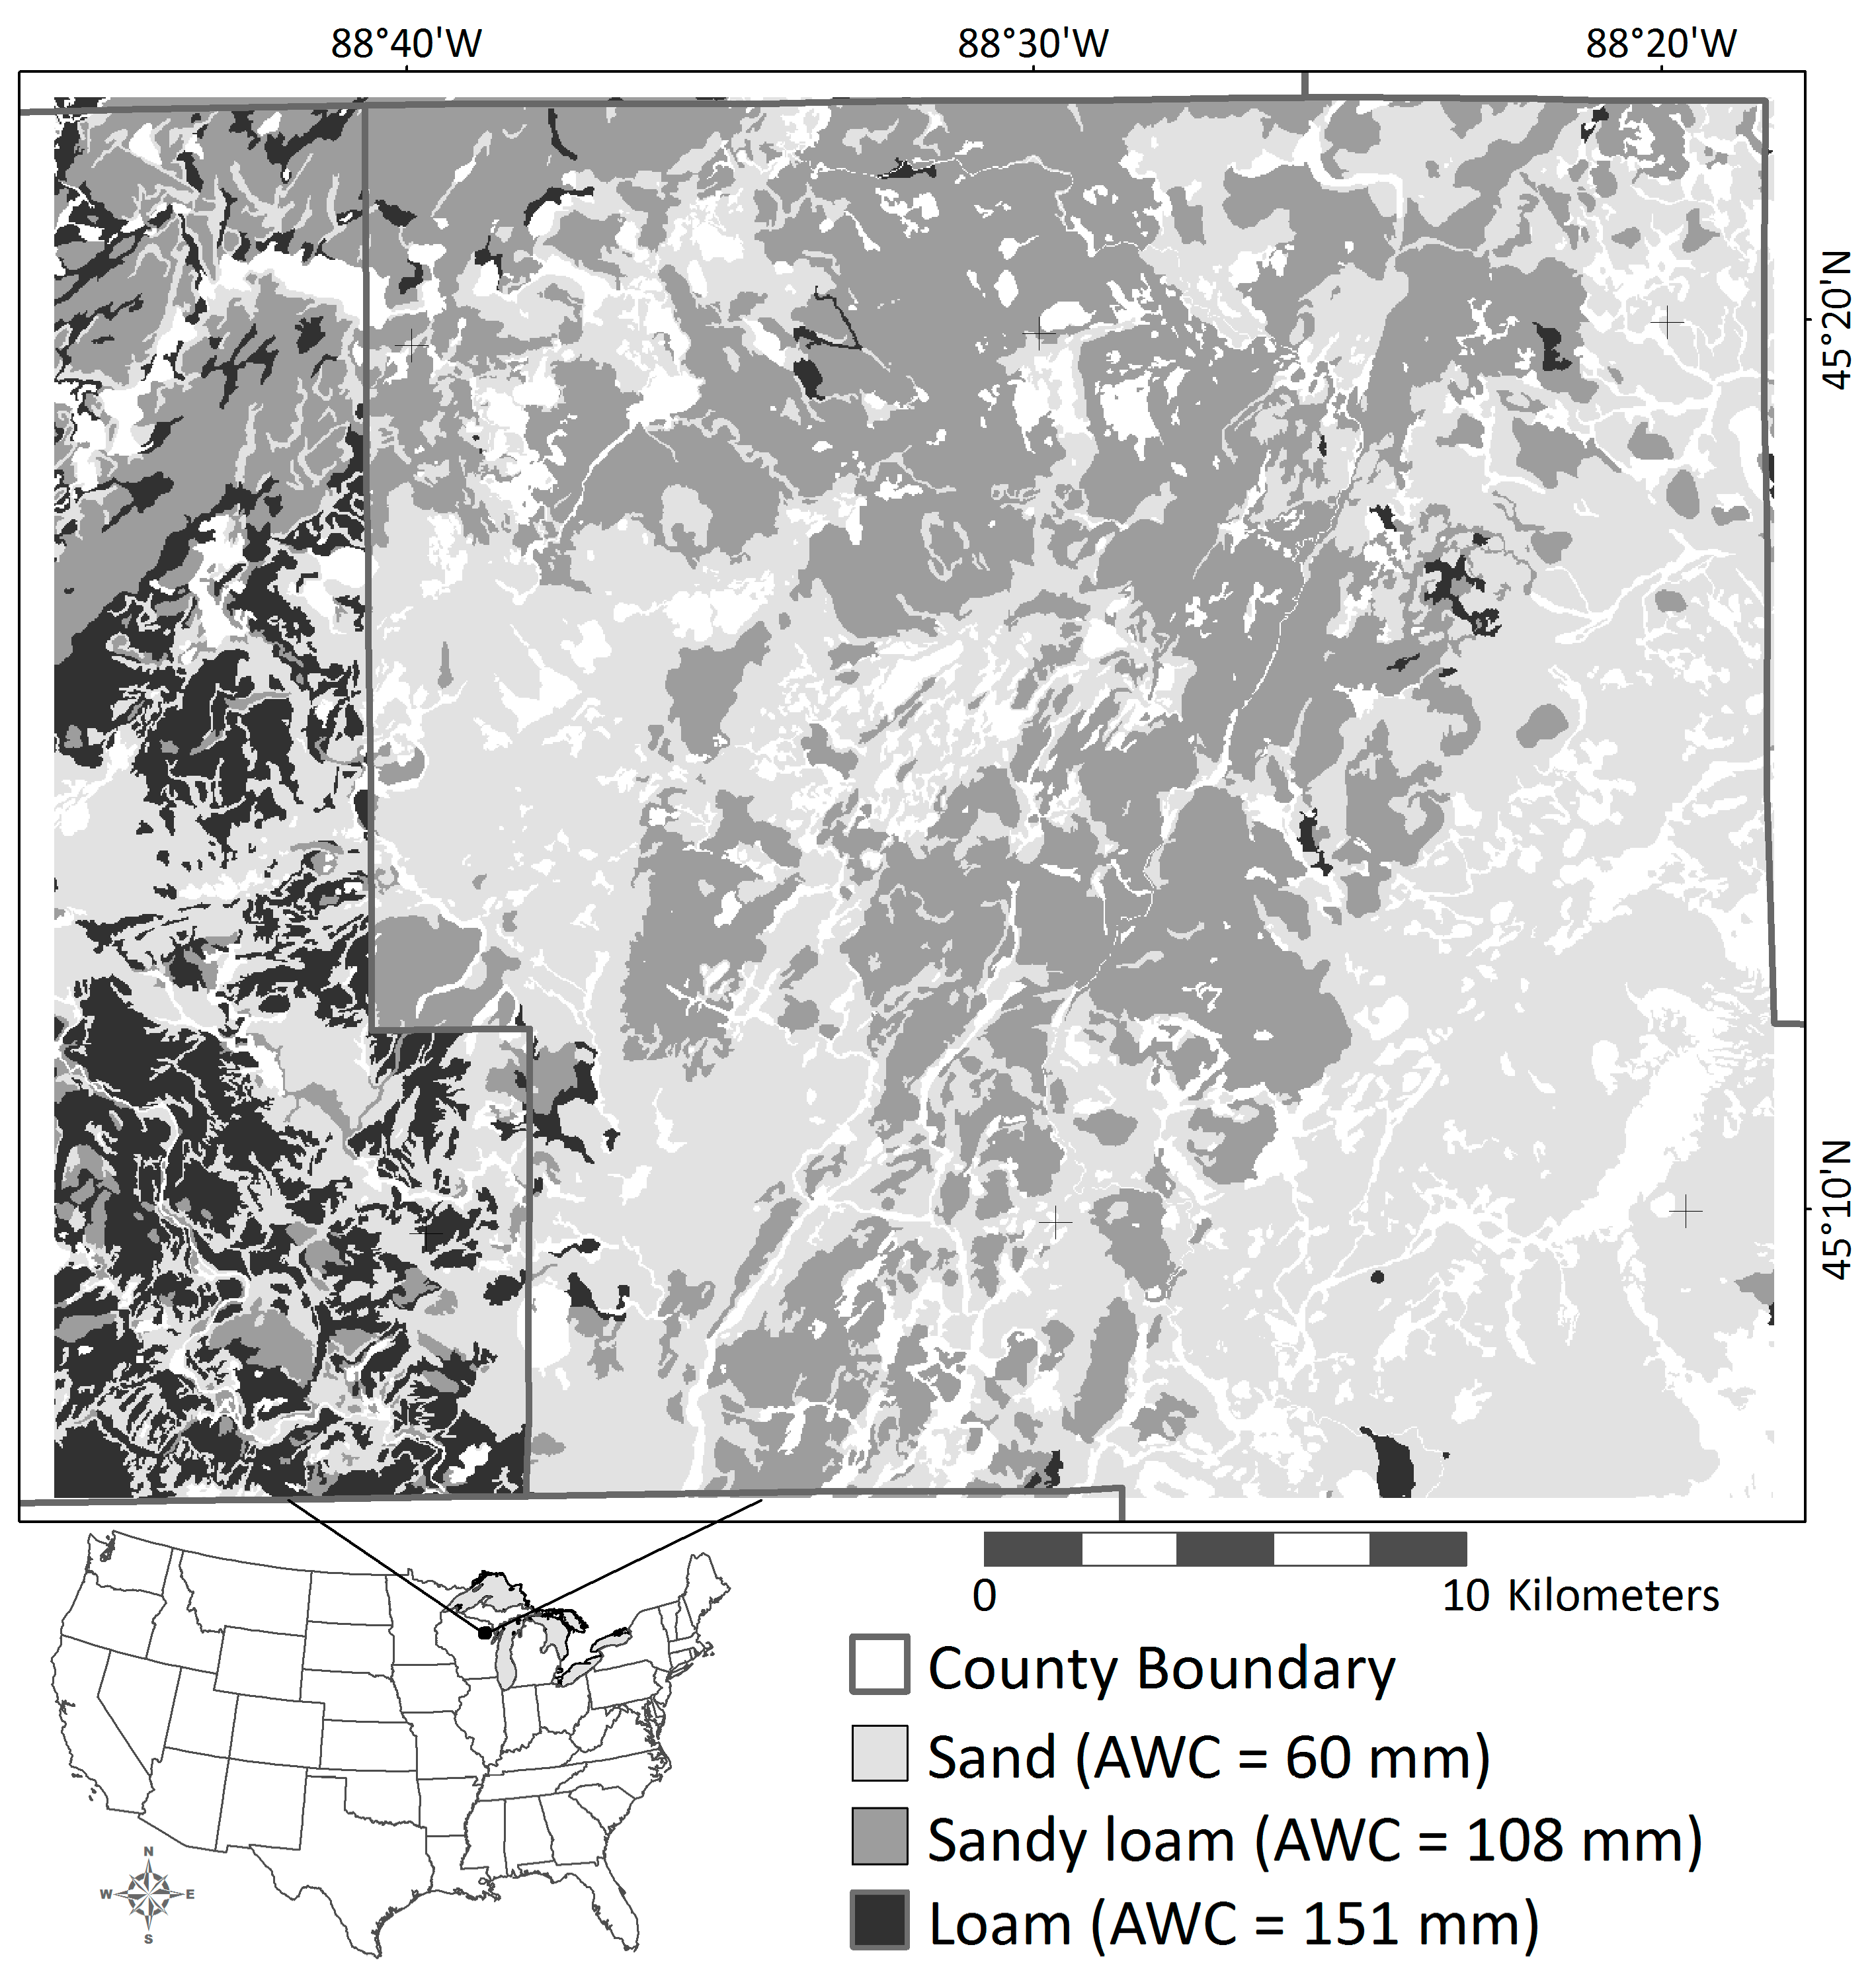
Figure 1. Soil types (and Available Water Capacity) used in the study area in Oconto county (Wisconsin, USA), to allow comparison with Gustafson et al. [4]. Non-forested areas are unshaded and were not included in the simulations. Used with permission.
Forests 09 00664 g001
Figure 2. Mean and 99% confidence intervals (error bars) of (a) average annual net photosynthesis (R2 = 0.015), (b) woody biomass (r2 = 0.014), (c) cohort energy reserves (r2 = 0.003) and (d) competitive exclusion (r2 = 0.008) of cohorts over 100 simulated years in response to the treatment levels, adjusted using least squares techniques. There was no evidence of important interactions except perhaps between temperature and AWC (Available Water Capacity) and drought and AWC in (d).
Forests 09 00664 g002
Figure 3. Mitigating effect of CO2 on the negative temperature effect for the four response variables. Note axis inversion in (d).
Forests 09 00664 g003
Figure 4. Mitigating effect of CO2 on the negative drought length effect for the four response variables. Note axes inversions in (d).
Forests 09 00664 g004aForests 09 00664 g004b
Figure 5. The effect of climate (rows) and drought length (columns) on productivity (mean species biomass) by drought tolerance groups. Error bars show one standard deviation.
Forests 09 00664 g005aForests 09 00664 g005b
Figure 6. The effect of climate (rows) and drought length (columns) on productivity (mean species biomass) by optimal temperature groups. Error bars show one standard deviation.
Forests 09 00664 g006
Figure 7. The effect of climate (rows) and drought length (columns) on productivity (mean species biomass) by forest type groups. Mixed swamp conifers and mixed oaks were very uncommon and are not shown. Error bars show one standard deviation.
Forests 09 00664 g007
Figure 8. Change in mean richness measures on forested cells through simulated time.
Forests 09 00664 g008
Figure 9. Change in Aggregation Index (measure of clumpiness) through simulated time on maps classified by forest type.
Forests 09 00664 g009
Table 1. Alternative levels of species life history traits used to create random species assemblages for the site-level experiment, as in Gustafson et al. [4].
Life History TraitParameterLowMidHigh
ProductivityFolN (% wt.) 12.22.52.8
Shade intoleranceHalfSat
(μmol/m2/s) 2
275437.5600
Drought toleranceH3/H4 (MPa) 3−0.98/−1.37−1.07/−1.47−1.16/−1.57
Optimal temperaturePsnTOpt (°C) 4192327
1 Foliar nitrogen; determines maximum photosynthetic capacity (Amax) in PnET-Succession. 2 Light level when photosynthesis is one-half of its rate in full sunlight. Lower values indicate greater shade tolerance. 3 H3 indicates the water potential below which photosynthesis begins to decline; H4 is the water potential below which photosynthesis stops. 4 Optimal temperature for photosynthesis.
Table 2. Levels of the experimental treatment factors.
TreatmentParameterLowMidHigh
TemperatureMonthly min. and max. temperature (°C) 1+0+3+6
CO2Mean monthly CO2 concentration (ppm)400575750
Drought lengthDrought length (yr)135
Soil textureAWC (mm) 260.5107.5150.8
1 Implemented as monthly temperature relative to the baseline climate. 2 Maximum available water capacity, calculated as field capacity—wilting point.
Table 3. Selected life history attributes of species used in the landscape experiment.
SpeciesLon-Gevity (Years)FolN (%)Drought Tolerance Class 1Shade Tolerance Class 1PsnTOpt (°C)Forest Type
Abies balsamea1500.9S-intolS-tol19SpruceFir
Acer rubrum2002.2S-tolS-tol26RedMaple
A. saccharum3002.1S-intolTol23SmapBchBassYbirch
Betula alleghaniensis3002.2S-intolS-tol21SmapBchBassYbirch
B. papyrifera1302.4IntolS-intol21Aspen-birch
Carya cordiformis2002.5S-intolS-intol25Rare
Fagus grandifolia2502.0S-tolTol23SmapBchBassYbirch
Fraxinus americana2002.5S-tolInterm.25CherryAsh
F. nigra1502.6IntolS-intol23Rare
F. pennsylvanica2002.5S-tolInterm.25CherryAsh
Picea glauca2001.1S-tolInterm.21SpruceFir
P. mariana2001.0S-tolInterm.20MxdSwampConif
Pinus banksiana1001.3TolIntol20JackPine
P. resinosa2501.5TolS-intol21PineOakHemlock
P. strobus3001.8S-tolInterm.21PineOakHemlock
Populus balsamifera1502.4IntolIntol19Aspen-birch
P. grandidentata902.5IntolIntol22Aspen-birch
P. tremuloides902.5IntolIntol21Aspen-birch
Prunus serotina1502.5S-tolS-intol25CherryAsh
Quercus alba3002.7TolS-intol26MixedOak
Q. ellipsoidalis2002.6TolS-intol21MixedOak
Q. macrocarpa3002.7TolInterm.23MixedOak
Q. rubra2102.6S-tolInterm.24PineOakHemlock
Q. velutina2002.3S-tolInterm.24MixedOak
Thuja occidentalis4001.0S-intolInterm.20MxdSwampConif
Tilia americana2002.5S-tolS-tol23SmapBchBassYbirch
Tsuga canadensis4501.4S-intolTol21PineOakHemlock
1 Classes: Tolerant, Somewhat tolerant, Intermediate, Somewhat intolerant, Intolerant.
Table 4. Levels of the landscape-scale experimental treatment factors, resulting in 4 combinations of levels.
Treatment FactorLowHigh
Emission scenarioRCP3.0RCP8.5
CO2 (ppm) *381–443381–1962
Approx. temperature rise (°C) *+1.5+8
Length of droughts (yrs)35
* CO2 and temperature are not separate treatment factors, but are derived from the emissions scenario, varying monthly through time.