Article

Differences in the Response to Acute Drought and Phytophthora cinnamomi Rands Infection in Quercus ilex L. Seedlings

by
Francisco J. Ruiz Gómez
1,*,
Alejandro Pérez-de-Luque
2,
Rafael Sánchez-Cuesta
1,
José L. Quero
1 and
Rafael M. Navarro Cerrillo
1
1
Departamento de Ingeniería Forestal, Laboratorio de Ecofisiología de Sistemas Forestales ECSIFOR—ERSAF, Universidad de Córdoba, Campus de Rabanales, Crta, IV, km. 396, E-14071 Córdoba, Spain
2
Área de Genómica y Biotecnología, IFAPA, Centro Alameda del Obispo, Avda. Menéndez Pidal s/n, Apdo 3092, 14080 Córdoba, Spain
*
Author to whom correspondence should be addressed.
Forests 2018, 9(10), 634; https://doi.org/10.3390/f9100634
Submission received: 6 September 2018 / Revised: 5 October 2018 / Accepted: 10 October 2018 / Published: 12 October 2018
(This article belongs to the Special Issue Phytophthora Infestations in Forest Ecosystems)

Abstract

:
The sustainability of “dehesas” is threatened by the Holm oak decline. It is thought that the effects of root rot on plant physiology vary depending on external stress factors. Plant growth and biomass allocation are useful tools to characterize differences in the response to drought and infection. The study of physiological responses together with growth patterns will clarify how and to what extent root rot is able to damage the plant. A fully factorial experiment, including drought and Phytophtora cinnamomi Rands infection as factors, was carried out with Quercus ilex L. seedlings. Photosynthesis, biomass allocation and root traits were assessed. Photosynthetic variables responded differently to drought and infection over time. The root mass fraction showed a significant reduction due to infection. P. cinnamomi root rot altered the growth patterns. Plants could not recover from the physiological effects of infection only when the root rot coincided with water stress. Without additional stressors, the strategy of our seedlings in the face of root rot was to reduce the biomass increment and reallocate resources. Underlying mechanisms involved in plant-pathogen interactions should be considered in the study of holm oak decline, beyond the consideration of water stress as the primary cause of tree mortality.

1. Introduction

Holm oak (Quercus ilex L.) is a native species, widely distributed in the central-western part of the Mediterranean basin. This tree can be considered a key species due to its ecological and socioeconomic importance, and it shows a high rate of phenotypic plasticity in relation to conditions such as temperature, elevation, and soil composition [1]. It is considered a drought-tolerant species and thus can play an important role against desertification [2]. The most representative examples of its socioeconomic relevance are the “dehesas” and “montados” agroforestry systems, which are Mediterranean Savannah-like ecosystems, present mainly in Spain and Portugal [3,4].
Since the 1990s, oak decline has been recorded in Europe [5], holm oak being the species most affected in the Mediterranean area. In south-western Europe (Spain and Portugal), Holm oak ecosystems are threatened by management practices, climatic change, and biotic agents. This makes them some of the most vulnerable ecosystems in the Mediterranean area [6,7].
Habitat projection models for the south-west Iberian peninsula indicate that an increase in extreme rain events alongside extended drought periods, and rising mean temperatures are likely to influence the future decline of holm oak in the region [2,7].
The severity of root rot and decline symptoms in Q. ilex, including mortality, has been related to water stress, both drought and waterlogging, which, depending on microsite conditions, can occur sequentially [1,8]. Regarding biotic factors, root rot oomycetes, mainly Phytophthora cinnamomi Rands, are considered a causal agent or triggering factor in holm oak decline [9,10,11]. Quercus ilex is considered the most susceptible species of the genus to the root rot [12].
Although some unspecific responses were detected in previous histological studies of infected roots, like cell wall thickening, phenolic compound accumulation on the middle lamella and mucilage secretion of parenchymatous cells [13,14], the main changes in plant status caused by P. cinnamomi infection are related not to defensive responses (e.g., pathogen associated molecular pattern (PAMP)-triggered immunity, effectors-triggered immunity, hypersensitive response, hormonal signaling…), but to physiological ones (e.g., stomatal closure, photosynthesis rate and water imbalance on plants) [11,15,16,17]. Root rot and water stress both impact tree health although some aspects of their relationship are unclear, such as the increase of water use efficiency on inoculated trees with strongly reduced water potential [16]. Not only drought, but also waterlogging treatments have been demonstrated to have significant effects on the mortality of infected plants [8,15,18]. Little has been published on physiological changes in holm oak plants as a response to P. cinnamomi infection, with high variability of results depending on the experimental conditions. Some reports have shown strong differences in photosynthesis and water potentials [15,17], while others have shown no significant effects [19,20,21], depending on whether the plants were subjected to continuous and acute waterlogging, drought stress, or only slight stress. All of the above highlight the relevance of studying the possible differences in the responses of holm oak to water stress and pathogen infection.
Variables related to plant morphology and biomass have been demonstrated to be powerful tools in the analysis of ecological, ontological, or physiological differences among species, ecotypes, or stress conditions [22,23]. The changes in plant growth patterns are related to physiological responses to stress conditions; in particular, biomass allocation is a key factor [24]. Root traits were found to be related to different key processes that vary in changing environmental conditions (for example, photosynthesis and photosynthates allocation, drought tolerance strategies, water potentials, transpiration rates…) [25,26,27,28].
The main objective of this study was to characterize the effects of acute water stress and P. cinnamomi infection in seedlings of Quercus ilex L. subsp. ballota, both individually and in combination, focusing on physiological, growth, and biomass allocation changes. We hypothesized that the effects and plant responses would differ according to whether the seedlings were water stressed, inoculated, or both, and that there would be significant variation in the magnitude of the responses, depending on the type of stress. To reach our main objective, we defined three specific goals: (i) to describe changes in physiological plant status due to either P. cinnamomi infection or drought; (ii) to evaluate plant growth changes related to drought stress and P. cinnamomi infection, analyzing biomass allocation, and (iii) to determine and characterize differences in the effects of water stress (drought) and P. cinnamomi infection on Q. ilex roots. This will clarify how and to what extent root rot is able to severely damage the plant, thereby helping the development of more accurate strategies to palliate the consequences of holm oak decline.

2. Materials and Methods

2.1. Plant Material

Seedlings of Quercus ilex subsp. ballota were used in this experiment. Acorns were collected in a warm-temperate holm oak forest in Arenas del Rey (Granada, Spain, ETRS89, UTM 30N: 417 586, 4 095 930, elevation 490 m.a.s.l.). The site is characterized by dry summers and wet, mild winters: the mean temperatures over the last 30 years are 24.7 °C (warmest month) and 11.5 °C (coldest month), and the average annual rainfall is 489.3 mm. This parental tree was chosen because it was considered drought tolerant in previous studies [29].
The acorns were sown in a peat-perlite-vermiculite growth medium (4-2-1 by vol.), in black plastic containers (2.5 L). These were placed in a growth chamber (25 °C, 60% RH, photoperiod 14/10 light/dark) until acorn germination. Then, the seedlings were placed in a greenhouse at the University of Córdoba-Campus Rabanales (Córdoba, Spain; ETRS89, UTM 30N: 348 360, 4 198 200), in semi-controlled conditions (25 ± 7 °C, 60 ± 10% RH), and were watered twice a week to saturate the growth medium. For three months, artificial light (HPS lamps, 400 W, 48,000 lumen, ≥600 µmol (photons) m−2 s−1 at 50 cm above the table surface) was provided, to extend the photoperiod to 12 h and ensure that the photosynthetic photon flux density (PPFD) exceeded 1000 µmol (photons) m−2 s−1. This value is considered to be enough to light-saturate Q. ilex leaves [30]. Before the experiment, seedlings were selected that were homogeneous in morphology (height, H = 31.79 ± 0.92 cm; diameter at the root collar, Øi = 6.98 ± 0.16 mm; total leaf area, LAt = 202.6 ± 9.3 cm2; mean values with standard error), instantaneous chlorophyll fluorescence, and photosynthetic efficiency of photosystem II (Ft = 3205 ± 409; QY = 66.4 ± 5.2%; FluorPen FP100 fluorescence analyzer, Photon Systems, spol. s.r.o., Drásov, Czech Republic).

2.2. Experimental Design and Inoculation

The experiment had a completely randomized design in which inoculation (2 levels: with and without) and watering (2 levels: with and without) were the main factors, resulting in four different treatments: “Control” (pots watered and mock-inoculated), “Inoculation” (pots watered and inoculated with P. cinnamomi), “Drought” (Pots non-watered and mock-inoculated), and “I × D” (Pots non-watered and inoculated with P. cinnamomi). Each of the four treatments had 10 replicates, providing a total of 40 experimental units. The pots were placed in black plastic trays, five pots of the same treatment in each tray, and the trays were distributed randomly in the greenhouse.
Inoculation was carried out with carrot agar (CA) liquid inoculum at a concentration of >30 Infective Units (IU)/μL of P. cinnamomi chlamydospores [31]. The P. cinnamomi strain was isolated from Q. ilex roots in a previous survey in Puebla de Guzman (Huelva, Spain). The pathogen was grown in 9-cm-diameter Petri dishes containing CA medium for 15 days. Prior to inoculum preparation, the surface of the CA containing the pathogen mycelium was well rinsed and the CA was mixed with demineralized water. The concentration of IU (chlamydospores) was evaluated using a Neubauer chamber. A false inoculum was made by mixing the same number of CA plates, but without P. cinnamomi, with water. The methodology used for the inoculation treatment was adapted from the work of Turco et al. [21]. Three holes were made in the substrate of each pot, using a 10-mL syringe with a trimmed end. Then, approximately 15 mL of inoculum or false inoculum were placed in each hole (45 mL in each pot) and subsequently covered with the substrate extracted previously with the trimmed syringe.
Before inoculation, the pots were watered to substrate saturation, the plants were inoculated and the pots were subsequently weighed to obtain their weight at the field capacity of the substrate. The watering regime of the “Control” and “Inoculation” treatments consisted of a first manual watering 72 h after inoculation, and subsequent watering every 48 h with 100 mL of water. To boost the induction of water stress in the treatments that did not include watering, the environmental conditions of the greenhouse were altered to increase the evapotranspiration rate of the plants (T = 28 ± 3 °C; RH = 40 ± 10%).

2.3. Parameters Measured

The physiological status of the plants was evaluated through the stomatal conductance and the rate and efficiency of photosynthesis, at the beginning of the experiment (0 days post-inoculation—dpi) and at 7, 15, 22, and 30 dpi. Thirty days after inoculation, the plants were harvested and their water status, aboveground and belowground fractions, and root distribution parameters were characterized. The description and units of each measured or calculated variable are shown in Table 1.
The volumetric water content (ϴ) of the pot substrate was measured during the experiment, in five pots per treatment, using time domain reflectometry probes (Decagon ECH2O Ec-5-Decagon Devices, Inc., Washington, WA, USA), previously calibrated for the specific pot substrate composition (accuracy ± 1%, resolution 0.1% of ϴ). Prior to harvest, the midday stem water potential (Ψm) of three leaves per pot was measured using an SKPM 1400 pressure chamber (Skye Instruments, Ltd.; Llandrindod Wells, Powys, UK) [31]. The minimum Ψm considered was −6 MPa, due to the technical limitations of the pressure chamber; in Q. ilex the minimum values of Ψm before sap flux failure range between −4 and −6 MPa [32].
The maximum quantum efficiency of photosystem II (QY) was measured using a Hansatech PEA portable chlorophyll fluorimeter (Hansatech Instrument, Ltd.; King’s Lynn, Norfolk, UK), for dark-adapted leaves after covering them for 20 min with portable leaf clips (Hansatech Instrument, Ltd., Narborough, UK). Five fully-expanded leaves per plant were measured at 0, 7, 15, 22, and 30 dpi.
The net photosynthesis rate (A) and stomatal conductance (Gs) were measured in three fully-expanded leaves of each plant, using a portable infrared CO2 gas analyzer (LiCor Li6400XT, Li-Cor, Inc.; Lincoln, NE, USA) fitted with a 6-cm2 leaf cuvette. The measurements were taken using a CO2 concentration of 390 ± 1.7 ppm, a flow of 300 ± 1.2 cm3 min−1, and PPFD >1000 µmol (photons) m−2 s−1. When a leaf did not fit completely in the leaf cuvette, a photograph of it was taken using a digital camera (HP Photosmart R827, Hewlett Packard Inc., Palo Alto, CA, USA). In order to correct the measurements according to the actual leaf area, the photographs taken at the moment of each measurement were analyzed using ImageJ image analysis software [33]. All the measurements of physiological variables were taken at 11:20–13:20 h UTC (Universal Time Coordinates), considering a 2-h window around the solar noon (13:20–15:20 h CET—Central European Time).
After the physiological measurements, the stems and leaves were excised from the root collar and the root ball was extracted from each pot. A subsample of fine roots was collected for pathogen isolation and, subsequently, the root ball was carefully washed with tap water on a 0.5-mm sieve, avoiding the loss of fine roots [34]. The fine and very fine roots lost in this process were recovered from the detached substrate using tweezers; subsequently, the root fraction was scanned in a Regent LA1600+ densitometer (Regent Instruments Inc., Quebec, QC, Canada).
The plant biomass was estimated for the stem, leaves, and roots to assess biomass allocation changes, using gravimetric methodology. The stems and leaves were dried immediately after excision (85 °C for 48 h; JP Selecta Conterm, Barcelona, Spain), in paper bags of known weight. The root fraction was dried after scanning, following the same procedure conducted for the aboveground biomass. All the dried samples were cooled in a desiccator at room temperature for 30 min prior to weighing. All the biomass fractions were expressed as dry biomass (stem dry weight, SDW, leaves dry weight, LDW, and root dry weight, RDW, in g).

2.4. Pathogen Isolation

To confirm the presence or absence of P. cinnamomi in the root system, a representative subsample of fine roots was collected for each plant, prior to root-ball detachment. Fifty pieces of fine and very fine roots (Ø < 2 mm), approximately 1 cm in length, were excised randomly from different regions of the root-ball. They were surface-disinfected by immersion in 70% ethanol for 10 s, washed in sterilized-deionized water, trimmed, and placed in 9-cm Petri dishes containing the PARPBH selective medium [35]. They were stored at room temperature, in darkness, for 14 days and were assessed every 48 h.
The colonies that grew were sub-cultured and sown in selective PARPBH medium and Carrot Agar (CA) to obtain axenic cultures. The colonies were observed under a microscope to identify the genus or species according to their morphology, following the indications of Erwin and Ribeiro [36]. The pathogen P. cinnamomi was recovered and isolated from fine roots of all the samples of the inoculation treatments and was not isolated from any of the studied roots from mock-inoculated plants. No other oomycete species were isolated from the samples.

2.5. Data Analysis

The effects of the factors on the root variables were calculated, according to Olmo et al. [27], as the ratio of the mean value of a root trait under the treatment to its mean value under control conditions. A ratio greater than 1 means that the treatment increased the value of this trait and thus was considered (+), and (−) for values between 0 and 1.
The scanned images of roots were analyzed with WinRHIZO Pro 2004a software (Regent Instruments Inc., Quebec, QC, Canada) to estimate root traits, for plasticity index (Pi) calculation. The Pi of each variable was calculated as described by Valladares and Sánchez-Gómez [37], through the expression (1):
Pi = [ i = 1 n ( X i m a x X i m i n ) / X i m a x ] / n
where Xi-max represents the maximum value of the variables avoiding statistically extreme outliers, Xi-min represents the minimum value of the variables avoiding statistically extreme outliers, and n represents the number of the variables used to calculate the Pi.
The Pi varies between 0 and 1. The mean root Pi was calculated as the average plasticity of all the root variables, to compare treatments.
To represent the differences in stem biomass avoiding the influence of aboveground biomass differences, SDW was divided by total aboveground biomass to calculate relative SDW proportion. This operation resulted in a better understanding of stem biomass changes.
The normality and homoscedasticity of the variables were assessed using the Shapiro-Wilk and Levene tests, respectively. Variables that did not fit a normal distribution were transformed by applying log(x) or 1/x [38], and the normality of the transformed variables was re-analyzed. After the normality test, two-way Analysis of Variance (ANOVA) was carried out, considering inoculation and watering as the independent factors. When no interaction between factors was detected in the two-way ANOVA, the Student’s t test was used to study the effects of inoculation and watering on biomass variables. Repeated measures ANOVA (RMANOVA) was carried out for the physiological variables and ϴ, using dpi as the repeated measure and considering the watering and inoculation treatments as between-subject factors. To avoid test failure due to noncompliance with the ANOVA assumptions, Greisser-Greenhouse correction of the degrees of freedom was used for univariate within-subjects’ analysis. The post-hoc comparison of treatments, in all other cases, was carried out using Tukey’s High Significant Difference (HSD) test. Null hypotheses were rejected at the p < 0.05 level. All the statistical analyses were performed using IBM SPSS Statistics 19 (IBM Corp., Armonk, NY, USA).

3. Results

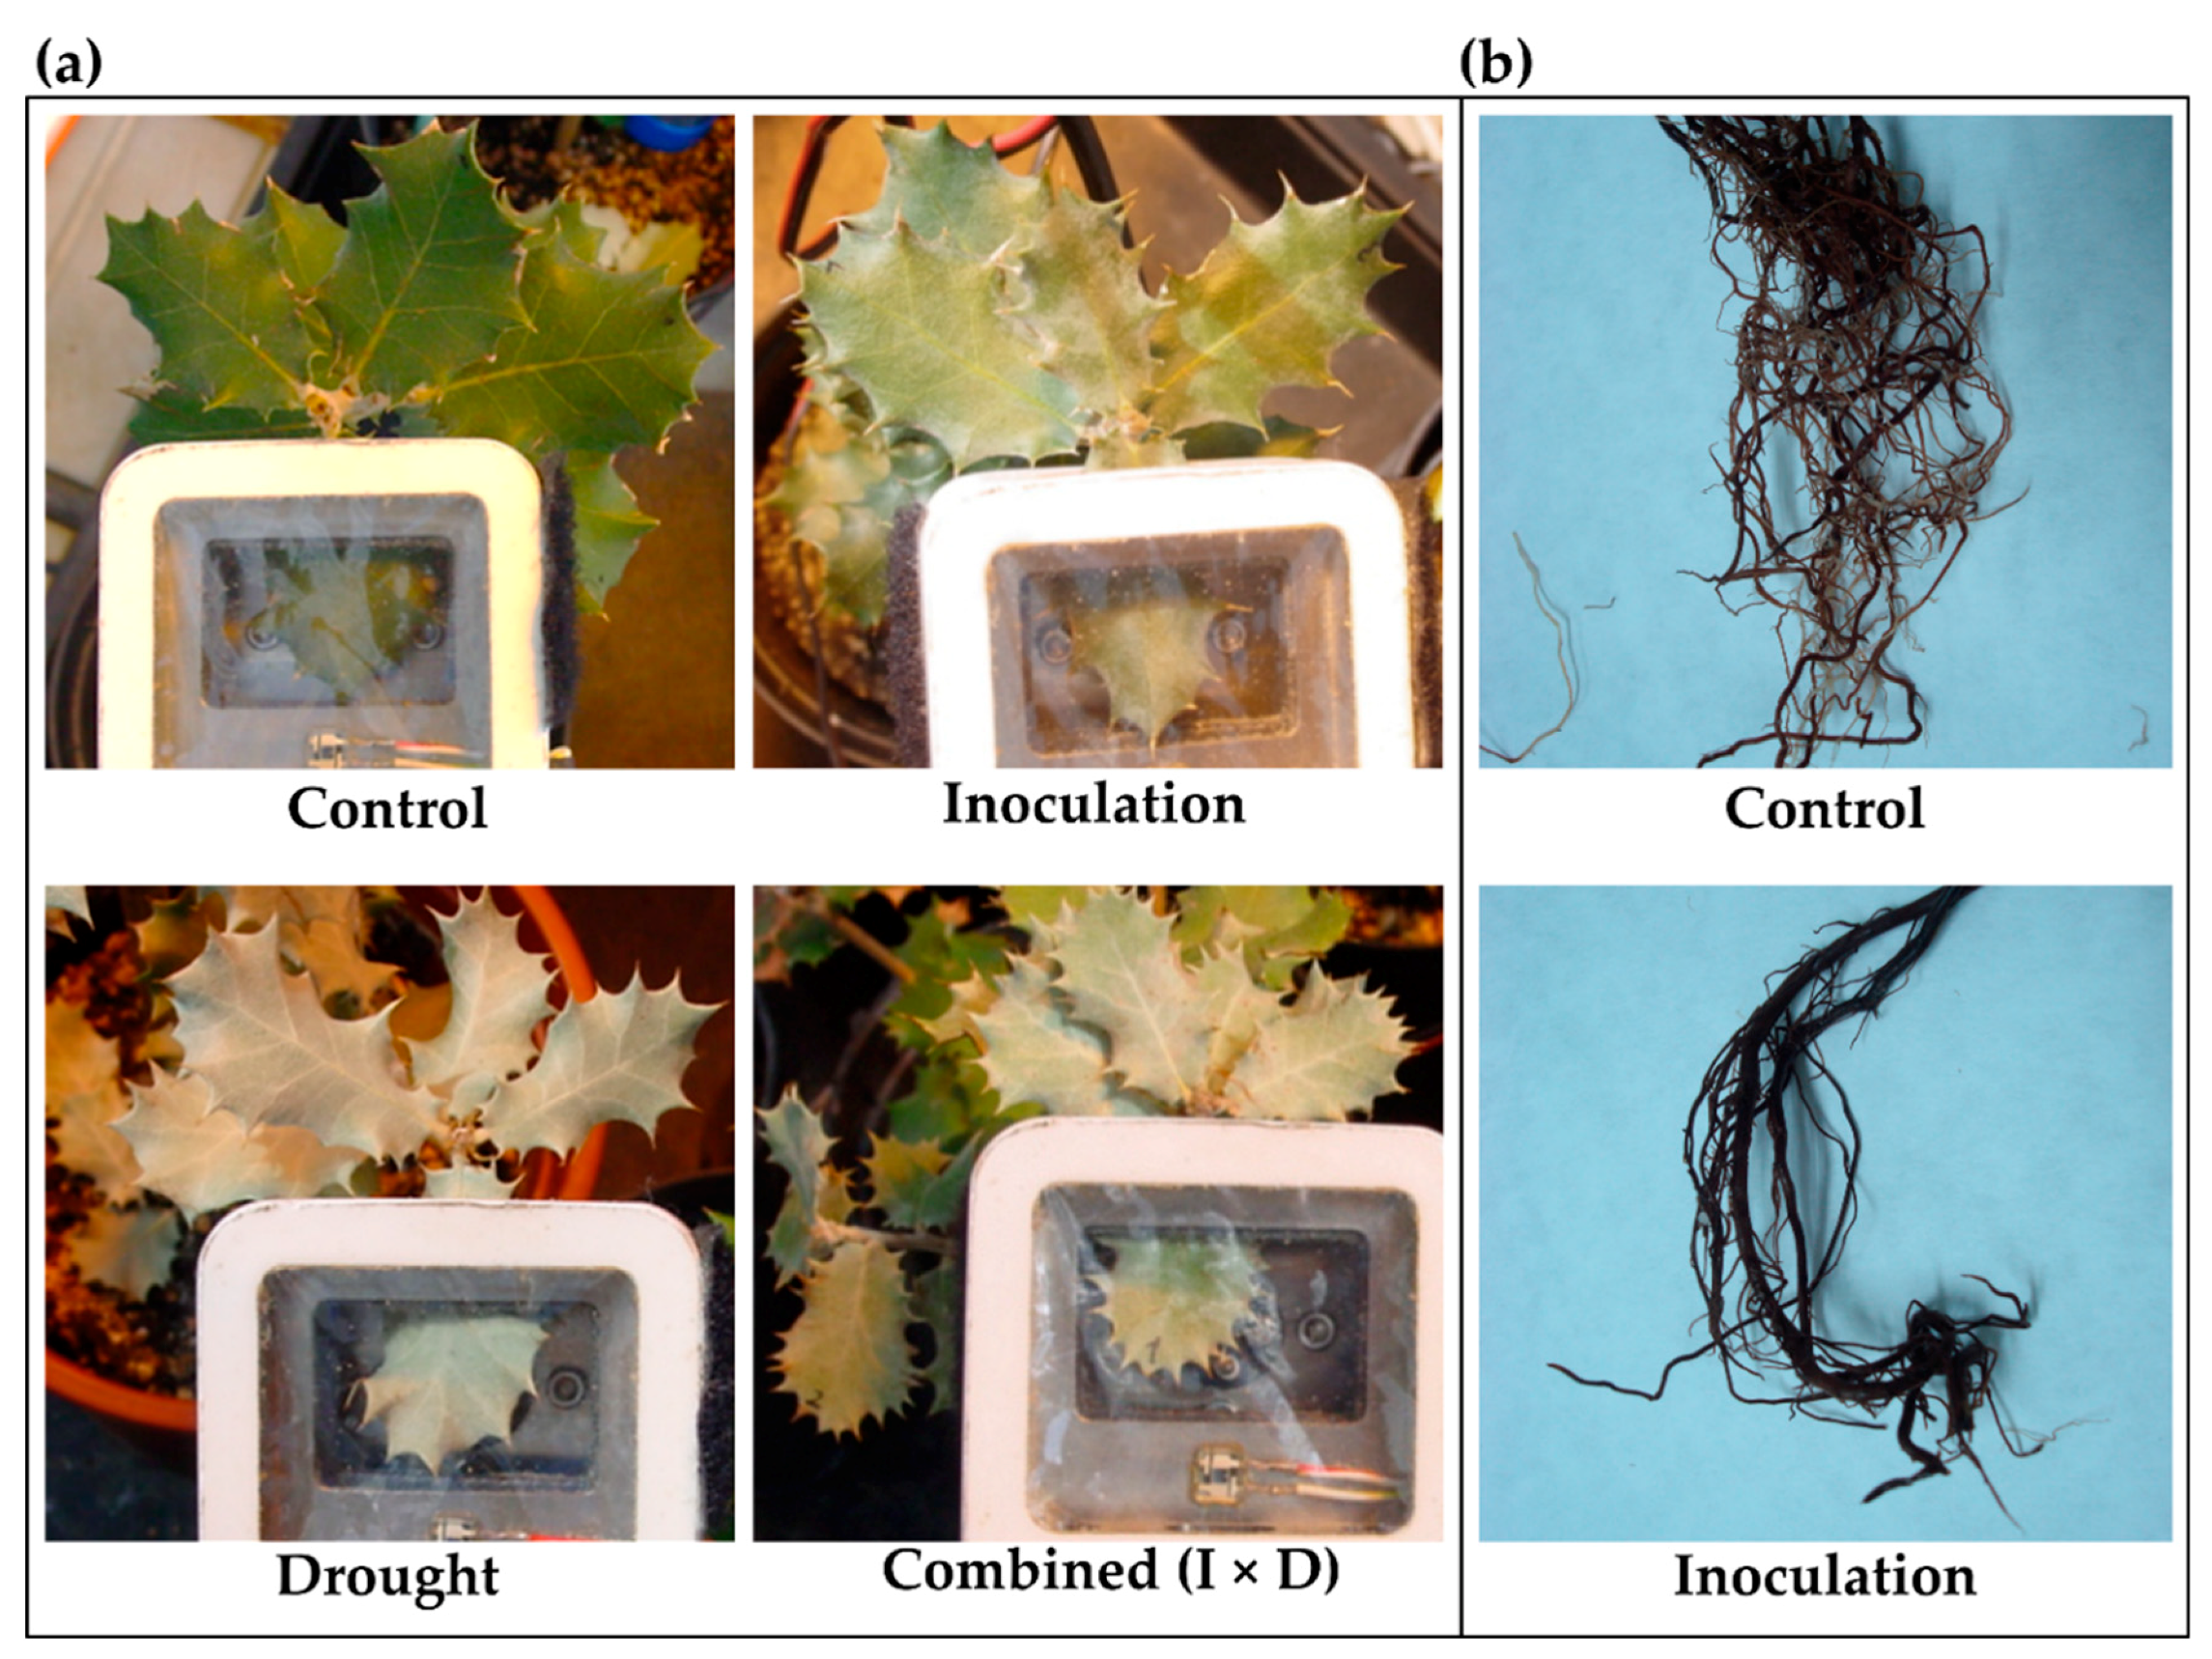
3.1. Plant and Root Symptoms
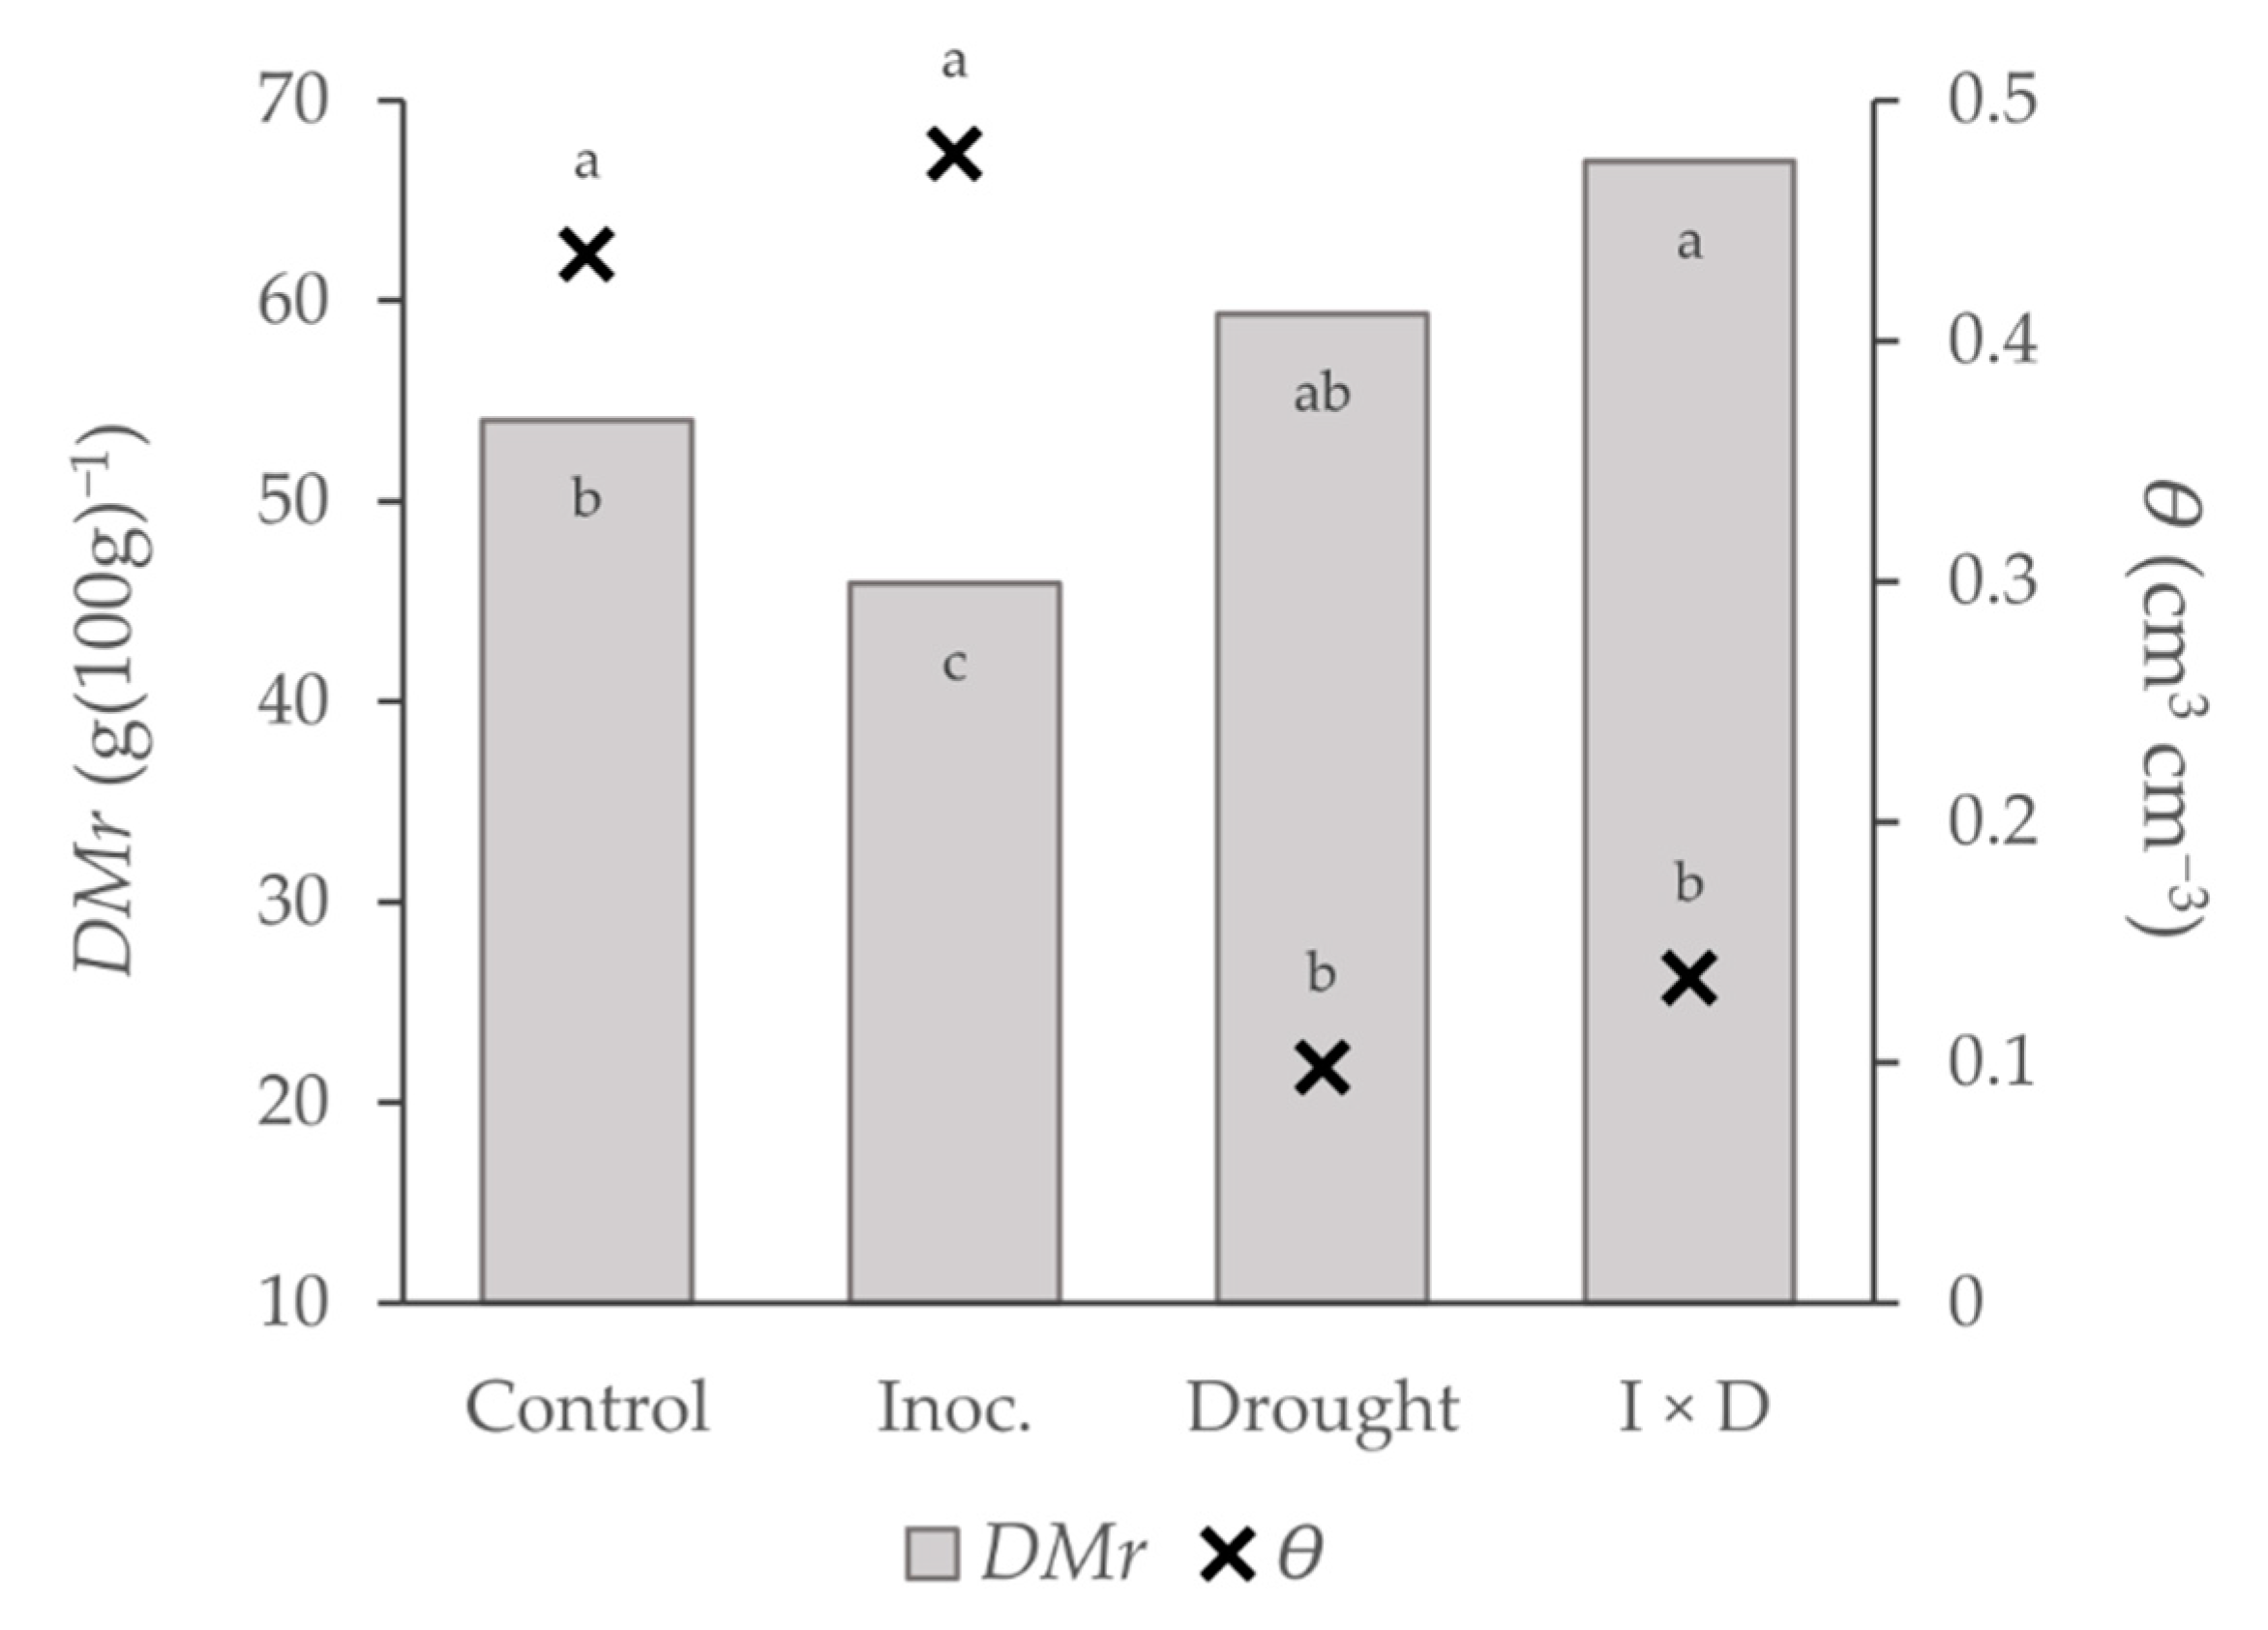
Plants of the “Drought” and combined (“I × D”) treatments presented strong chlorosis and wilting of the leaves at the end of the assay. In the “Inoculation” treatment (watered), the symptoms were more variable—with chlorosis and partial wilting in several plants, while others had only slight symptoms in the upper part of the stem. No plants from the “Inoculation” (watered) treatment were dead after 30 days. No chlorosis or wilting was seen in plants from the “Control” treatment (Figure 1).
The root system of plants from the “Drought” and combined (“I × D”) treatments exhibited taproot necrosis and root frailty. The plants from the “Inoculation” treatment (watered) showed root rot symptoms—consisting of dark-brown coloration, necrotic lesions in tips, and root softness—when compared with control plants. Another important symptom was the lack of fine lateral roots on the coarse roots (Ø > 2 mm).

3.2. Water Status

The RMANOVA showed significant differences in the volumetric water content of the substrate (ϴ) regarding watering (F = 91.7; p < 0.001) and inoculation (F = 6.5; p < 0.05). Time (dpi) strongly influenced ϴ (F = 373.8; p < 0.01) (Table 2, Figure 2a), with a significant effect of the interaction between dpi and the watering treatment (dpi × D; F = 60.9; p < 0.001).
The differences due to inoculation were not influenced by dpi. At the end of the experiment, water stressed plants (Drought” and “I × D” treatments) presented values of ϴ around 0.1 cm3 cm−3, and midday water potential (Ψm) values equal or below −6 MPa, with differences only between watered and non-watered plants (Supplementary Material, Table S1).
The root dry matter content (DMr) was influenced by a significant interaction between the watering and inoculation treatments (Table 3). Although no significant differences in DMr due to the inoculation factor were found at 30 dpi, plants of the “Inoculation” (watered) treatment had a significantly lower value than “Control” plants, without differences between the “I × D” and “Drought” treatments (Figure 3).

3.3. Photosynthesis

At 30 dpi, only the watering treatment had a significant effect on the net photosynthesis rate (A) and Gs (Figure 2b,c; Supplementary Material, Table S1), while QY differed significantly only between the “Control” and “I × D” treatments (Figure 2d). However, significant effects of both inoculation and watering on A and Gs were found when the time-trend was analyzed (RMANOVA, Table 2). The time after inoculation did not influence A or Gs, but A varied significantly among the dpi depending on the water stress level, as shown by the significant interaction between dpi and the watering factor for this variable. No significant differences in A were found between treatments until day 22, when the value was lower for the “I × D” plants, coinciding with the lower values of Gs. At this time, a significant change in the trend was found in all physiological variables for the “Inoculation” treatment (inoculated and watered plants) (Figure 2). The QY was not affected significantly by the watering treatment, but it was by the inoculation and the interaction between factors, being significantly influenced by dpi and, as in the case of A as well, by the interaction between dpi and drought. The QY values for the “I × D” treatment at 15 and 22 dpi were significantly lower than those of the “Drought” treatment, for which QY and Gs did not decrease until the end of the experiment, when the substrate showed values of ϴ around 0.1 cm3 cm−3.

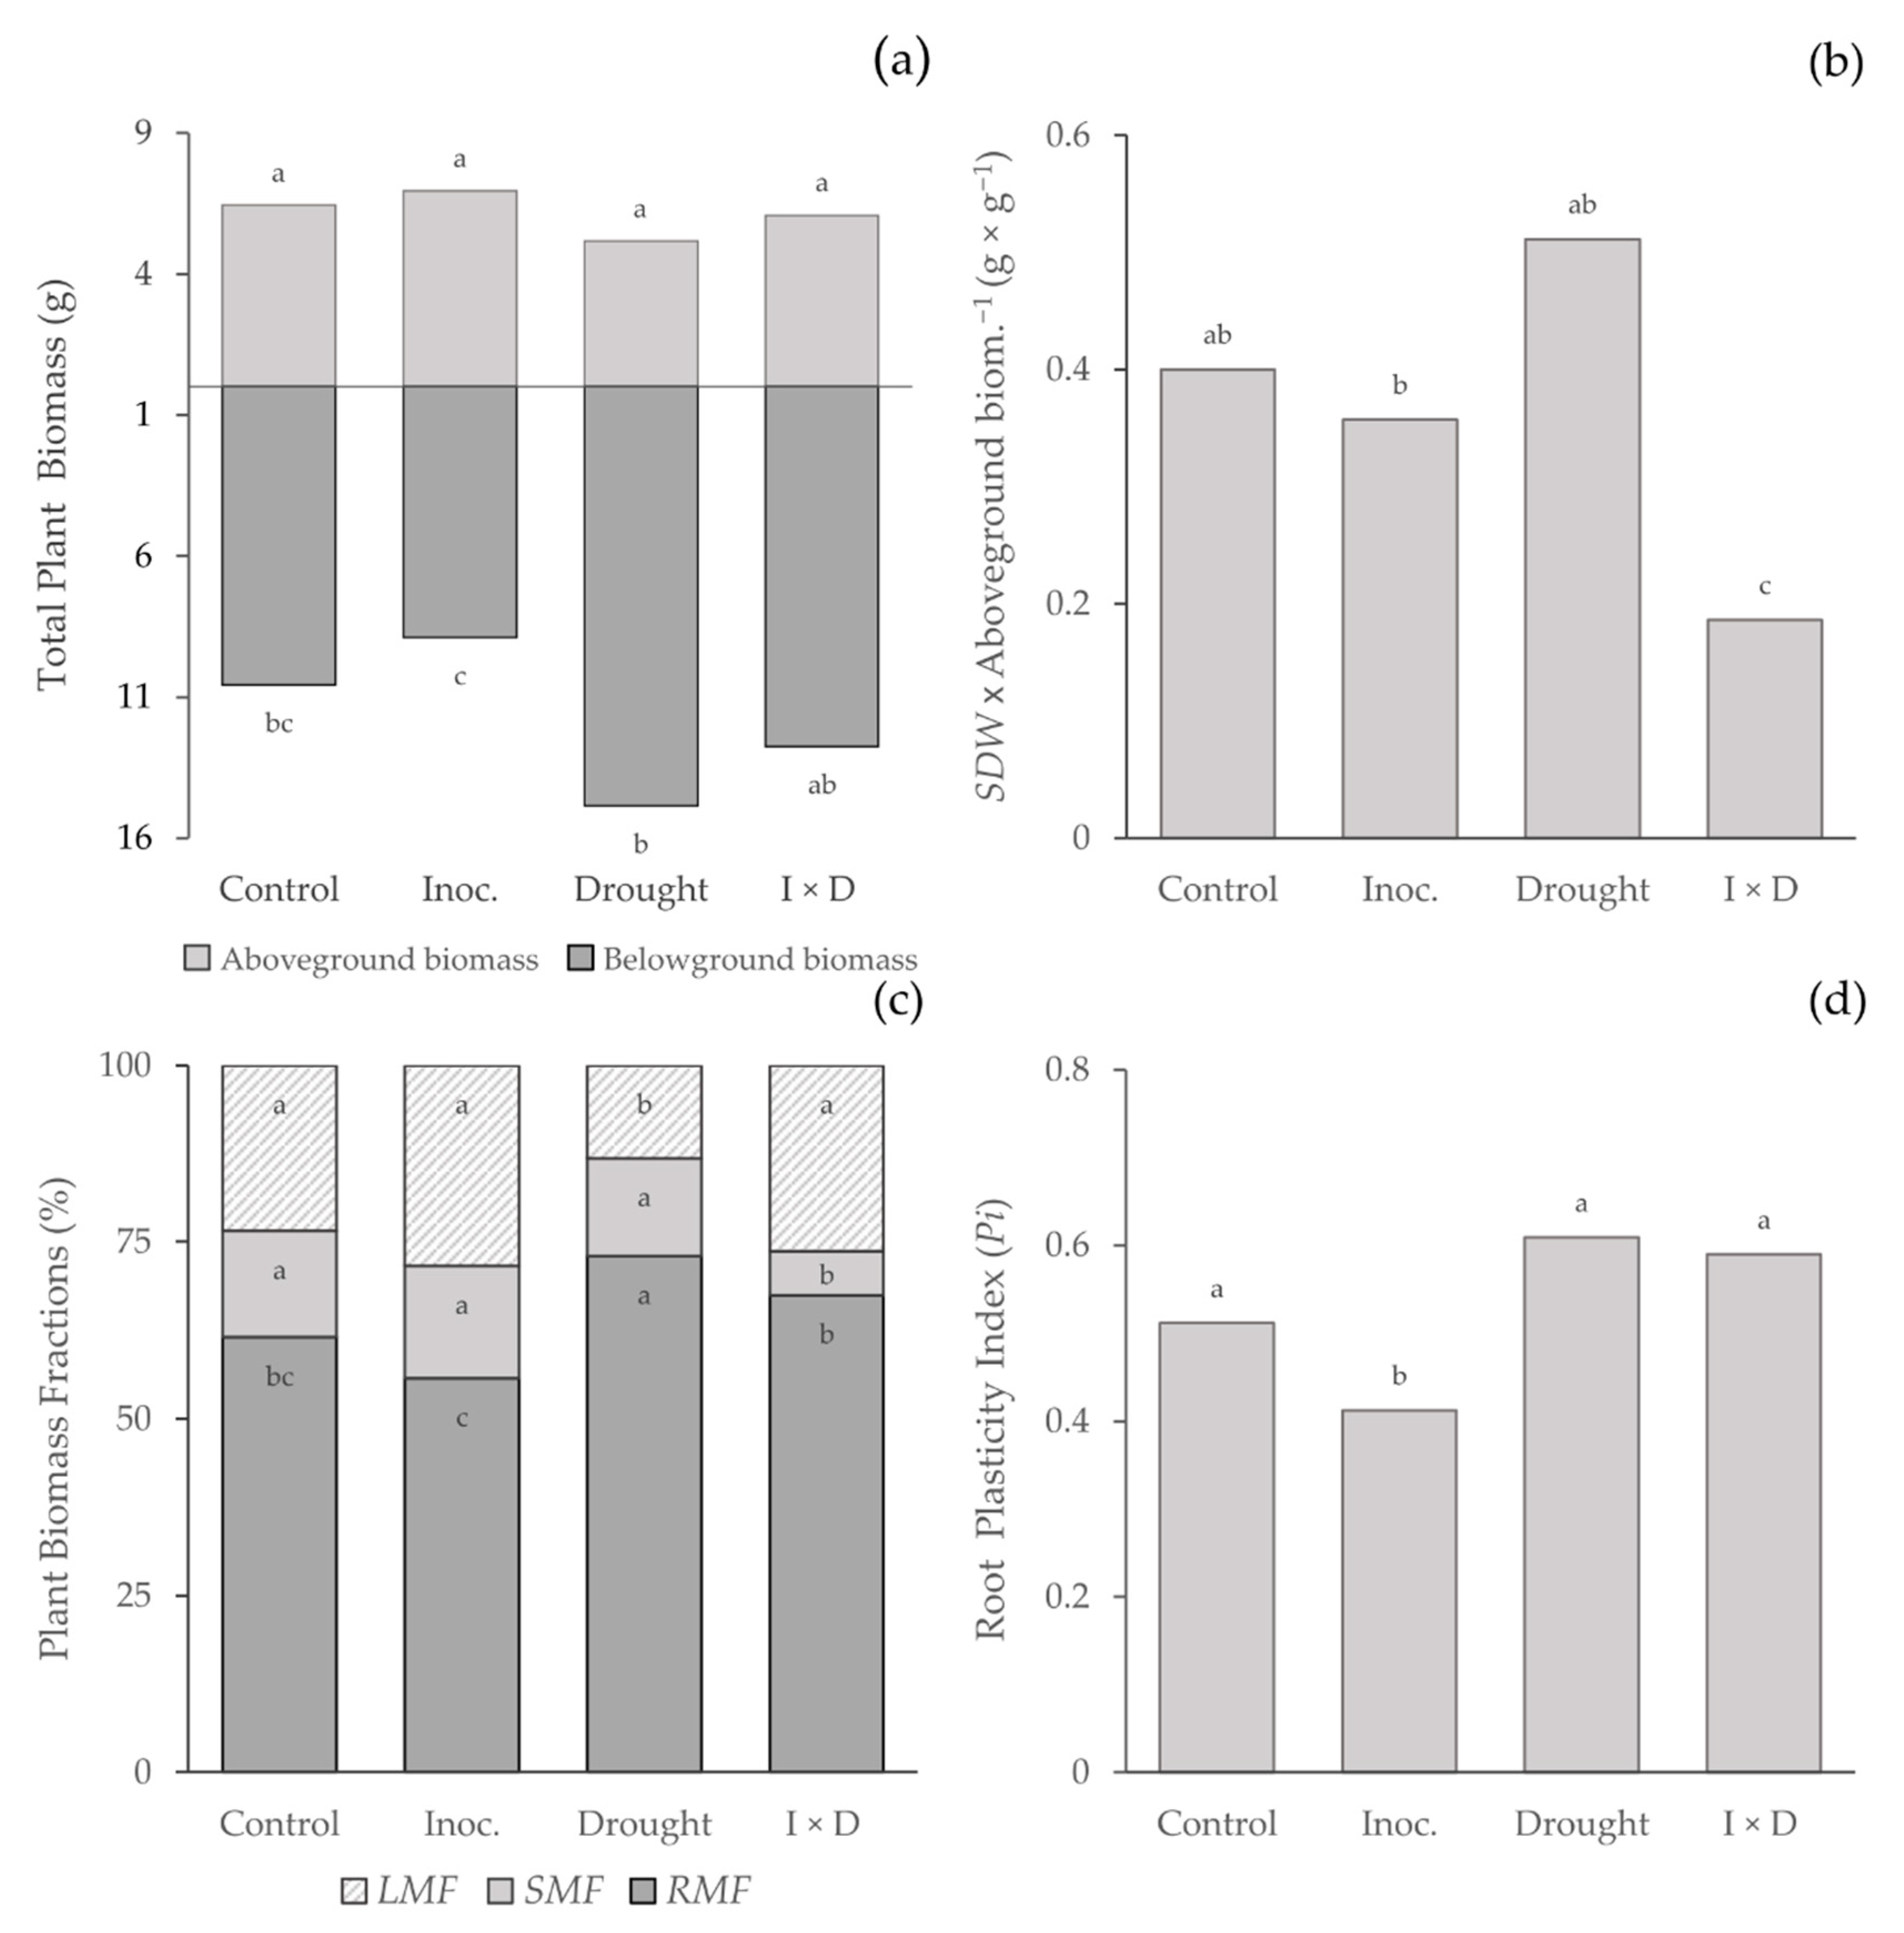
3.4. Growth and Biomass Allocation

The root biomass (RDW) was higher in water-stressed plants (t = 2.2, df = 28, p < 0.05) but did not differ significantly when inoculation was considered (Figure 4a; Table 3). However, despite a lack of statistical significance, inoculation gave the lowest values of RDW, for both watering treatments (Figure 4a; Supplementary Material, Table S1).
Aboveground biomass (leaves plus stem) did not differ significantly among treatments, but the factor inoculation had a negative influence on SDW, with a significant interaction between the two experimental factors (Table 3). The relative proportion of SDW, regarding aboveground biomass (Figure 4b), was lower for the “I × D” treatment, SDW representing, on average, 45.6% of the total aboveground biomass in mock-inoculated plants (“Control” and “Drought”) and 27.2% for the inoculated ones. For the plants of the “I × D” treatment, on average, both SDW (F = 4.6; p < 0.01) and relative SDW (F = 3.6; p < 0.01) were significantly lower than for the “Drought” treatment plants.
The biomass fractions (RMF, SMF, and LMF) were significantly influenced by both inoculation and watering, but the interaction between them was only significant for SMF (Table 3). The RMF decreased due to the effect of inoculation (t = −2.7, df = 38, p < 0.05) and increased due to water stress (t = 5.4, df = 38, p < 0.001), while LMF increased significantly due to inoculation (t = 3.4, df = 38, p < 0.01). The graphical comparison of fractions and treatments (Figure 4c) shows different trends in the aboveground (SMF, LMF) and root (RMF) fractions. All the biomass allocation parameters differed between the “Drought” and “I × D” treatments. The “Drought” treatment gave the maximum value of RMF (0.73 ± 0.02) and the minimum value of LMF (0.13 ± 0.01).
The minimum value of RMF occurred in the “Inoculation” treatment (0.56 ± 0.01), but without differences from the “Control” treatment. The values of RMF and SMF for the “I × D” treatment were lower than those of the “Drought” treatment, the plants of the “I × D” treatment showing a clear decrease in SMF (F = 8.3; p < 0.001). The average Pi for all the studied variables shows that the roots of watered plants had lower plasticity (t = 4.5, df = 110, p < 0.001). When the means of the Pi were compared for each of the four treatments in a one-way ANOVA, significant differences appeared (F = 7.87; p < 0.001), the mean Pi of the “Inoculation” treatment having the lowest value (Figure 4d).

4. Discussion

Although previous authors have proposed this idea as a hypothesis [16,18,21], to the best of our knowledge this is the first work to evidence differences in the physiological response of Quercus ilex to the stress of combining P. cinnamomi and drought, in comparison with each stress applied separately. All the studied variables responded to the experimental conditions, showing differences between both factors. The main changes on physiology presented different trends due to water stress induction in inoculated plants. The seedlings inoculated with P. cinnamomi recovered if no additional stress was induced. The differential responses of physiological parameters, growth, and biomass allocation were influenced by inoculation and water supply, without an interaction between them in most cases.

General Symptoms and Stress Indicators

The plant symptoms as a result of P. cinnamomi inoculation described here were similar to those reported for leaves [11,17] and roots [14,16] of holm oak seedlings in previous work. The root rot symptoms were differentiated from water stress damage in roots mainly by the color and general aspect of the root ball, the aboveground symptoms being less specific (i.e., chlorosis and wilting) (Figure 1).
Regarding water balance, ϴ was increased in inoculated pots where the infected (damaged) roots were less able to take up water. Time-trend analysis showed this significant effect, but only non-watered plants underwent water stress. Previous works have reported the early accumulation of pectidic and mucilaginous materials in xylem vessels of fine Q. ilex roots as a result of P. cinnamomi infection, and also the invasion of pathogenic structures in xylem cells in advanced stages of infection [14], this obstruction of conductive vessels causing the reduction of xylem conductance. In small plants, when water availability alternates between low and high, blocked vessels display the two stages characteristic of active vessels, alternating between embolism due to evaporative stress and refill by reverse osmosis [39]. In well-irrigated plants, the refill of blocked vessels in coarse roots is related to higher Ψ, and could be the cause of a high moisture content in root tissue [40], the blockage of vessels causing different effects in water stressed plants, in which reverse osmosis did not occur. However, the high DMr of the “I × D” treatment plants seems to be in conflict with this hypothesis (Figure 3), which might be a consequence of the combined effect of acute drought, inducing root growth.
Leaf water potential (Ψ) is often used as a water stress indicator [41]. This variable was only affected significantly by drought in our study (Table 2 and Table 3), agreeing with Turco et al. [21]—who found that Ψ in Q. ilex seedlings was not changed by P. cinnamomi inoculation. Holm oak is considered an isohydric species [42], the detection of the first drought stress symptoms resulting in quick stomatal closure. However, in this work, inoculated seedlings responded to the root rot with early partial stomatal closure and a reduction in their photosynthetic activity at 7 dpi, at which time the pathogen would not have invaded to a significant extent the xylem vessels [14]. At this time, growth cessation and loss of root uptake ability due to root rot occurred [14,16]. This imbalance might be related to alterations in plant osmoregulation, and thus to the increase in root tissue water content in the “Inoculation” treatment plants, agreeing with previous studies in other species [43]. Oßwald et al. [16] indicated that the infection of woody plants by Phytophthora spp. could trigger a generalized dysfunction in plant water status related to hormonal changes, with an alteration in the balance between abscisic acid (ABA) and other plant hormones involved in stomatal regulation.

Physiological Changes

Water stress produced significant reductions in A, Gs, and QY at the end of the experiment, agreeing with the expected response of Q. ilex to water stress [42], but analyzing time-trend, inoculated plants responded in a different way, without influence of inoculation in photosynthetic efficiency (QY), when the influence of time (dpi) was eliminated (Table 2). The early reduction in photosynthetic activity as a result of inoculation, supported by the results of RMANOVA, might be related to the lower values of root biomass and root proportion in inoculated plants and agrees with other results which evidenced an early cessation of root growth, only 24 h after inoculation [14]. Also, it must be considered that A represents net CO2 assimilation. A high QY accompanied by low rates of A could result from the increase of secondary metabolism activity, which increased intracellular leaf CO2 concentration [44].
At 15 dpi, Inoculated plants had recovered their photosynthetic activity, their Gs and QY being equal to those of “Control” plants at 30 dpi, but plants of the “I × D” treatment did not exhibit photosynthetic activity after 22 dpi. Other works obtained similar results when inoculated plants were not subjected to acute water stress, without important changes in physiology, nor mortality of seedlings [15,19,45]. Turco et al. [21] did not find changes in the final physiological status of Q. ilex seedlings due to P. cinnamomi infection under slight drought conditions. In their work, inoculated plants (both watered and water-stressed) recovered their water status after 14 dpi, only being water-stressed after 42 days.
Root rot caused by P. cinnamomi intensifies the damage resulting from physiological stress [15]. The plant responses detected in previous works as a result of P. cinnamomi inoculation [14], should be linked to changes in the secondary metabolism, agreeing with the suggestions of other authors about the involvement of secondary metabolites in stomatal closure or osmotic imbalance [16,46]. These changes might be related with the reduction of carbon compounds storage in roots under water stress [47]. However, when the normal metabolism of plants was only altered by pathogen infection, the responses detected in roots [14,48] could be considered as evidence of a set of physiological and morphological changes which led to a recovery of our seedlings after 15 days, time in which the first infection cycle is completed [14].
The effects of P. cinnamomi root rot are not homogeneous throughout the root system; they depend on root diameter distribution [49] and other factors such as availability of inoculum. In infected plants, some functional roots could still be active, or new fine roots could grow as a response to root uptake reduction [45], taking up water and preventing total stomatal closure in well-irrigated plants. Previous work with Q. ilex described the maintenance of root growth independently of soil moisture and the ability to increase the growth of smaller-diameter fractions, leading to a tendency towards a thinning of roots, as a response to water deficiency in the plant [50]. All this evidence might explain the recovery of plants receiving the “Inoculation” treatment in our experiment at 15 dpi. According to our physiological data (A, Gs, and QY), the alterations of plant physiology produced by the “Inoculation” treatment were uncoupled from water stress; this indicates that root rot by itself was not enough to seriously disturb the functionality of the vascular system in our infected and well-watered seedlings, at least up to 30 dpi.

Biomass allocation

The root volume and biomass increments of Q. ilex seedlings in response to water stress are consistent with other results [51,52], increasing total root biomass and root mass fraction. These changes in response to drought are considered an adaptative response of drought tolerant plants [22,24,27], such as holm oak [21]. Hence, if we consider that root rot due to P. cinnamomi infection reduces water uptake as a consequence of fine roots loss [11,16], a response to water stress similar to the one triggered by drought could be expected in inoculated plants—increasing fine root turnover and root biomass in secondary roots. But, if no water stress signaling was triggered, the fine root “rot/growth” rate would have altered this response in inoculated plants.
Detailed evaluation of the aboveground biomass showed a decrease in the proportion of stem, relative to the overall aboveground biomass, and a lack of differences in leaf biomass, confirmed by the effects of the combined treatment (“I × D”) (Figure 4b,c). Evaluating the plant fractions, it might be considered that the main effects of the treatments were observed in roots—the aboveground biomass not being sensitive to the effects of either treatment, except in the case of stem growth decline, which agreed with the lower SMF in “I × D” plants. Jönsson [53] reached a similar conclusion for Quercus robur L. infected with Phytophthora quercina T.Jung & T.I. Burgess and Phytophthora cactorum (Lebert & Cohn) J. Schröt. since the aboveground biomass showed no significant response to the fine root loss produced.
One of the main symptoms associated with the root rot caused by P. cinnamomi is the lack of lateral fine roots [13,14,49,54,55,56,57], as described in this work. However, our data do not show a significant reduction of fine roots or effects on related traits in the inoculation treatments (“Inoculation” and “I × D”). One of the main objectives of our work was to assess biomass allocation differences in plants, since we recovered all the fine roots found in the substrate. We considered that 30 days is too short a time for the significant disappearance of excised or rotted roots in the pot substrate, neither with controlled watering (without flooding) nor without watering. Nevertheless, root rot symptoms and lateral root excisions were clearly identified in the “Inoculation” treatment, which might explain the significant increment in the number of tips in coarse roots (roots of >2 mm Ø, data not shown).
The Pi is frequently calculated to assess differences in the tolerance of stress factors between species or phenotypes, and to indicate the variability of different root traits in limiting conditions [27,37]. In our case, Pi might explain some of the differences in the root changes, agreeing with the idea of the reduction of the plant’s ability to explore the soil due to P. cinnamomi infection. The “Inoculation” treatment gave lower Pi values, statistically different from the rest, with the maximum value corresponding to “Drought” (Figure 4d). High plasticity levels are correlated with tolerance of stress factors; Bongers et al. [22] found, for functional traits correlated with a drier climate and stress conditions, that greater phenotypic plasticity was related to traits associated with rapid recovery and growth after drought. Stress caused by P. cinnamomi inoculation provoked lower plasticity of root traits than water stress, agreeing with the high susceptibility of Q. ilex to P. cinnamomi [12] and the high tolerance of this species to hydric stress [42]. Thus, it can be hypothesized that, without additional stressors, the strategy of our seedlings in the face of root rot was to reduce the biomass increment and reallocate resources to the equilibration of osmotic and hormonal imbalances, enabling them to recover their physiological status after the first infection cycle. On the other hand, changes in physiology and decreases in root plasticity caused by root infection could reduce the drought tolerance of Q. ilex plants, this being another possible cause of tree decline.

5. Conclusions

This work shows that the responses of Q. ilex to P. cinnamomi infection and water stress are different. P. cinnamomi root rot altered mainly the growth patterns of plants, while the plants could not recover from the physiological effects of infection only when the root rot coincided with water stress. It must be considered that the experiment showed the response of plants growing in ideal conditions, subjected to acute stress, being possible that plants adapted to drought in field conditions respond in a different way. In addition, no long-term impact in plant survival could be deduced from our results. However, we demonstrated the existence of underlying mechanisms of plant responses different to the one that they show against water stress, which could drive the plant recovery after one cycle of infection.
The differing responses of the roots to drought and infection were reflected in the early reduction of photosynthetic activity and relative changes in biomass allocation under water deprivation; the effects of the pathogen, without additional stress, focused on the reduction of plant growth and of the ability of the root system to explore the substrate, confirmed by the low Pi.
The infection of Q. ilex seedlings by P. cinnamomi was not enough, in this case, to kill the plants or to cause permanent damage to their physiological status. The differing degrees of susceptibility among provenances [29] should be considered as one of the causes of this observation, but, doubtless, the pathogen aggravated the consequences of hydric stress, since the results provide no evidence to support the induction of acute water stress by root rot.

Supplementary Materials

The following are available online at https://www.mdpi.com/1999-4907/9/10/634/s1, Table S1: Means of all the studied variables with standard error at 30 dpi, Table S2: Statistics of Repeated Measures ANOVA.

Author Contributions

F.J.R.G., R.M.N.C. and A.P.-d.-L. designed the study; F.J.R.G., J.L.Q. and R.S.-C. performed the experiment and laboratory analysis; F.J.R.G., R.M.N.C. and A.P.L. conducted the statistical analysis; R.M.N.C. and J.L.Q. obtained the funds for the research; F.J.R.G., A.P.L., R.M.N.C., R.S.-C. and J.L.Q. participated in the writing and editing of the manuscript.

Funding

This study was conducted with support from the projects QUERCUSAT (CGL2013-40790-R), ESPECTRAMED (CGL2017-86161-R), and ENCINOMICA (BIO2015-64737-R), funded by the Spanish Ministry of Economy, Industry and Competitivity. The first author is a recipient of a fellowship from the Spanish Ministry of Education (FPU fellowship, FPU13/00231).

Acknowledgments

The authors thank the “Consejería de Medio Ambiente, Junta de Andalucía” for its support in acorn collection, and the “Campus de Excelencia Internacional en Agroalimentaión-CeiA3” through the “Servicio Centralizado de Apoyo a la Investigación-SCAI” (University of Córdoba) for their services.

Conflicts of Interest

The authors declare no conflict of interest

References

  1. De Rigo, D.; Cadullo, G. Quercus ilex in Europe: Distribution, habitat, usage and threats. In European Atlas of Forest Tree Species; Publication Office of the European Union: Luxembourg, 2016; pp. 152–153. [Google Scholar]
  2. Quercus, L.; Gil-Pelegrín, E.; Peguero-Pina, J.J.; Sancho-Knapik, D. Oaks Physiological Ecology. Exploring the Functional Diversity of Genus; Tree Physiology; Springer International Publishing: Cham, Switzerland, 2017; Volume 7, ISBN 978-3-319-69098-8. [Google Scholar]
  3. Guzmán Álvarez, J.R. The image of a tamed landscape: Dehesa through history in Spain. Cult. Hist. Digit. J. 2016, 5, 003. [Google Scholar] [CrossRef]
  4. Pinto-Correia, T.; Azeda, C. Public policies creating tensions in Montado management models: Insights from farmers’ representations. Land Use Policy 2017, 64, 76–82. [Google Scholar] [CrossRef] [Green Version]
  5. Thomas, F.M.; Blank, R.; Hartmann, G. Abiotic and biotic factors and their interactions as causes of oak decline in Central Europe. For. Pathol. 2002, 32, 277–307. [Google Scholar] [CrossRef]
  6. Consejería de Agricultura y Pesca. Caracterización Socioeconómica de la Dehesa en Andalucía; Secretaría General Técnica, Servicio de Publicaciones y Divulgación; Junta de Andalucía Consejería de Agricultura y Pesca: Sevilla, Spain, 2008. [Google Scholar]
  7. Gea-Izquierdo, G.; Fernández-de-Uña, L.; Cañellas, I. Growth projections reveal local vulnerability of Mediterranean oaks with rising temperatures. For. Ecol. Manag. 2013, 305, 282–293. [Google Scholar] [CrossRef]
  8. Swiecki, T.J.; Berndhart, E.A. Testing and implementing methods for managing Phytophthora root diseases in California native habitats and restoration sites. In Proceedings of the Sudden Oak Death Sixth Science Symposium, San Francisco, CA, USA, 20–23 June 2016; p. 53. [Google Scholar]
  9. Brasier, C.M.; Robredo, F.; Ferraz, J.F.P. Evidence for Phytophthora cinnamomi involvement in Iberian oak decline. Plant Pathol. 1993, 42, 140–145. [Google Scholar] [CrossRef]
  10. Brasier, C.M. Phytophthora cinnamomi and oak decline in southern Europe. Environmental constraints including climate change. Ann. Sci. For. 1996, 53, 347–358. [Google Scholar] [CrossRef]
  11. Hardham, A.R.; Blackman, L.M. Phytophthora cinnamomi. Mol. Plant. Pathol. 2018, 19, 260–285. [Google Scholar] [CrossRef] [PubMed]
  12. Moralejo, E.; García-Muñoz, J.A.; Descals, E. Susceptibility of Iberian trees to Phytophthora ramorum and P. cinnamomi. Plant Pathol. 2009, 58, 271–283. [Google Scholar] [CrossRef]
  13. Ruiz Gómez, F.J.; Sanchez-Cuesta, R.; Navarro-Cerrillo, R.M.; Perez-de-Luque, A. A method to quantify infection and colonization of holm oak (Quercus ilex) roots by Phytophthora cinnamomi. Plant Methods 2012, 8, 39. [Google Scholar] [CrossRef] [PubMed]
  14. Ruiz Gómez, F.J.; Navarro-Cerrillo, R.M.; Sánchez-Cuesta, R.; Pérez-de-Luque, A. Histopathology of infection and colonization of Quercus ilex fine roots by Phytophthora cinnamomi. Plant Pathol. 2015, 64, 605–616. [Google Scholar] [CrossRef]
  15. Corcobado, T.; Cubera, E.; Juárez, E.; Moreno, G.; Solla, A. Drought events determine performance of Quercus ilex seedlings and increase their susceptibility to Phytophthora cinnamomi. Agric. For. Meteorol. 2014, 192–193, 1–8. [Google Scholar] [CrossRef]
  16. Oßwald, W.; Fleischmann, F.; Rigling, D.; Coelho, A.C.; Cravador, A.; Diez, J.; Dalio, R.J.; Horta Jung, M.; Pfanz, H.; Robin, C.; et al. Strategies of attack and defence in woody plant–Phytophthora interactions. For. Pathol. 2014, 44, 169–190. [Google Scholar] [CrossRef]
  17. Sghaier-Hammami, B.; Valero-Galvàn, J.; Romero-Rodríguez, M.C.; Navarro-Cerrillo, R.M.; Abdelly, C.; Jorrín-Novo, J. Physiological and proteomics analyses of Holm oak (Quercus ilex subsp. ballota [Desf.] Samp.) responses to Phytophthora cinnamomi. Plant Physiol. Biochem. 2013, 71, 191–202. [Google Scholar] [CrossRef] [PubMed]
  18. Corcobado, T.; Cubera, E.; Moreno, G.; Solla, A. Quercus ilex forests are influenced by annual variations in water table, soil water deficit and fine root loss caused by Phytophthora cinnamomi. Agric. For. Meteorol. 2013, 169, 92–99. [Google Scholar] [CrossRef]
  19. León, I.; García, J.; Fernández, M.; Vázquez-Piqué, J.; Tapias, R. Differences in root growth of Quercus ilex and Quercus suber seedlings infected with Phytophthora cinnamomi. Silva Fenn. 2017, 51. [Google Scholar] [CrossRef]
  20. Maurel, M.; Robin, C.; Capron, G.; Desprez-Loustau, M.-L. Effects of root damage associated with Phytophthora cinnamomi on water relations, biomass accumulation, mineral nutrition and vulnerability to water deficit of five oak and chestnut species. For. Pathol. 2001, 31, 353–369. [Google Scholar] [CrossRef]
  21. Turco, E.; Close, T.J.; Fenton, R.D.; Ragazzi, A. Synthesis of dehydrin-like proteins in Quercus ilex L. and Quercus cerris L. seedlings subjected to water stress and infection with Phytophthora cinnamomi. Physiol. Mol. Plant Pathol. 2004, 65, 137–144. [Google Scholar] [CrossRef]
  22. Bongers, F.J.; Olmo, M.; Lopez-Iglesias, B.; Anten, N.P.R.; Villar, R. Drought responses, phenotypic plasticity and survival of Mediterranean species in two different microclimatic sites. Plant Biol. 2017, 19, 386–395. [Google Scholar] [CrossRef] [PubMed]
  23. Poorter, H.; Jagodzinski, A.M.; Ruiz-Peinado, R.; Kuyah, S.; Luo, Y.; Oleksyn, J.; Usoltsev, V.A.; Buckley, T.N.; Reich, P.B.; Sack, L. How does biomass distribution change with size and differ among species? An analysis for 1200 plant species from five continents. New Phytol. 2015, 208, 736–749. [Google Scholar] [CrossRef] [PubMed] [Green Version]
  24. Poorter, H.; Niklas, K.J.; Reich, P.B.; Oleksyn, J.; Poot, P.; Mommer, L. Biomass allocation to leaves, stems and roots: Meta-analyses of interspecific variation and environmental control: Tansley review. New Phytol. 2012, 193, 30–50. [Google Scholar] [CrossRef] [PubMed]
  25. Chen, H.; Dong, Y.; Xu, T.; Wang, Y.; Wang, H.; Duan, B. Root order-dependent seasonal dynamics in the carbon and nitrogen chemistry of poplar fine roots. New For. 2017, 48, 587–607. [Google Scholar] [CrossRef]
  26. Lopez-Iglesias, B.; Villar, R.; Poorter, L. Functional traits predict drought performance and distribution of Mediterranean woody species. Acta Oecol. 2014, 56, 10–18. [Google Scholar] [CrossRef]
  27. Olmo, M.; Lopez-Iglesias, B.; Villar, R. Drought changes the structure and elemental composition of very fine roots in seedlings of ten woody tree species. Implications for a drier climate. Plant Soil 2014, 384, 113–129. [Google Scholar] [CrossRef]
  28. Roumet, C.; Birouste, M.; Picon-Cochard, C.; Ghestem, M.; Osman, N.; Vrignon-Brenas, S.; Cao, K.; Stokes, A. Root structure–function relationships in 74 species: Evidence of a root economics spectrum related to carbon economy. New Phytol. 2016, 210, 815–826. [Google Scholar] [CrossRef] [PubMed]
  29. Navarro Cerrillo, R.M.; Ruiz Gómez, F.J.; Cabrera-Puerto, R.J.; Sánchez-Cuesta, R.; Palacios Rodriguez, G.; Quero Pérez, J.L. Growth and physiological sapling responses of eleven Quercus ilex ecotypes under identical environmental conditions. For. Ecol. Manag. 2018, 415, 58–69. [Google Scholar] [CrossRef]
  30. Quero, J.L.; Villar, R.; Marañón, T.; Zamora, R. Interactions of drought and shade effects on seedlings of four Quercus species: Physiological and structural leaf responses. New Phytol. 2006, 170, 819–834. [Google Scholar] [CrossRef] [PubMed] [Green Version]
  31. Scholander, P.F.; Bradstreet, E.D.; Hemmingsen, E.A.; Hammel, H.T. Sap pressure in vascular plants: Negative hydrostatic pressure can be measured in plants. Science 1965, 148, 339–346. [Google Scholar] [CrossRef] [PubMed]
  32. Tognetti, R.; Longobucco, A.; Miglietta, F.; Raschi, A. Transpiration and stomatal behaviour of Quercus ilex plants during the summer in a Mediterranean carbon dioxide spring. Plant Cell Environ. 1998, 21, 613–622. [Google Scholar] [CrossRef]
  33. Schneider, C.A.; Rasband, W.S.; Eliceiri, K.W. NIH Image to ImageJ: 25 Years of Image Analysis. Available online: https://www.nature.com/articles/nmeth.2089 (accessed on 14 March 2018).
  34. Phillips, J.M.; Hayman, D.S. Improved procedures for clearing roots and staining parasitic and vesicular-arbuscular mycorrhizal fungi for rapid assessment of infection. Trans. Br. Mycol. Soc. 1970, 55, 158–161. [Google Scholar] [CrossRef]
  35. Jeffers, S.N. Comparison of two media selective for Phytophthora and Pythium species. Plant Dis. 1986, 70, 1038–1043. [Google Scholar] [CrossRef]
  36. Erwin, D.C.; Ribeiro, O.K. Phytophthora Diseases Worldwide; APS Press: St. Paul, NY, USA, 1996; ISBN 978-0-89054-212-5. [Google Scholar]
  37. Valladares, F.; Sánchez-Gómez, D. Ecophysiological traits associated with drought in Mediterranean tree seedlings: Individual responses versus interspecific trends in eleven species. Plant Biol. 2006, 8, 688–697. [Google Scholar] [CrossRef] [PubMed]
  38. Milton, J.S.; Tsokos, J.O. Statistical Methods in the Biological and Health Sciences; McGraw-Hill: New York, NY, USA, 1983; ISBN 978-0-07-042359-6. [Google Scholar]
  39. Canny, M. Tyloses and the maintenance of transpiration. Ann. Bot. 1997, 80, 565–570. [Google Scholar] [CrossRef]
  40. Borghetti, M.; Grace, J.; Raschi, A. Water transport in plants under climatic stress. In Proceedings of the International Workshop, Firenze, Italy, 29–31 May 1990. [Google Scholar]
  41. Urban, L.; Aarrouf, J.; Bidel, L.P.R. Assessing the effects of water deficit on photosynthesis using parameters derived from measurements of leaf gas exchange and of chlorophyll a fluorescence. Front. Plant Sci. 2017, 8, 2068. [Google Scholar] [CrossRef] [PubMed]
  42. Quero, J.L.; Sterck, F.J.; Martínez-Vilalta, J.; Villar, R. Water-use strategies of six co-existing Mediterranean woody species during a summer drought. Oecologia 2011, 166, 45–57. [Google Scholar] [CrossRef] [PubMed]
  43. Aigbe, S.O.; Remison, S.U. The Influence of root rot on dry matter partition of three cassava cultivars planted in different agro-ecological environments. Asian J. Plant Pathol. 2010, 4, 82–89. [Google Scholar] [CrossRef]
  44. Else, M.A.; Janowiak, F.; Atkinson, C.J.; Jackson, M.B. Root signals and stomatal closure in relation to photosynthesis, chlorophyll a fluorescence and adventitious rooting of flooded tomato plants. Ann. Bot. 2009, 103, 313–323. [Google Scholar] [CrossRef] [PubMed]
  45. Tuset, J.J.; Hinarejos, C.; Mira, J.L.; Cobos, J.M. Implicación de Phytophthora cinnamomi Rands en la enfermedad de la «seca» de encinas y alcornoques. Bol. Sanid. Veg. Plagas 1996, 22, 491–499. [Google Scholar]
  46. Robin, C.; Capron, G.; Desprez-Loustau, M.L. Root infection by Phytophthora cinnamomi in seedlings of three oak species. Plant Pathol. 2001, 50, 708–716. [Google Scholar] [CrossRef]
  47. Simova-Stoilova, L.P.; Romero-Rodríguez, M.C.; Sánchez-Lucas, R.; Navarro-Cerrillo, R.M.; Medina-Aunon, J.A.; Jorrín-Novo, J.V. 2-DE proteomics analysis of drought treated seedlings of Quercus ilex supports a root active strategy for metabolic adaptation in response to water shortage. Front. Plant Sci. 2015, 6, 627. [Google Scholar] [CrossRef] [PubMed]
  48. Redondo, M.A.; Perez-Sierra, A.; Abad-Campos, P.; Torres, L.; Solla, A.; Reig-Arminana, J.; Garcia-Breijo, F. Histology of Quercus ilex roots during infection by Phytophthora cinnamomi. Trees-Struct. Funct. 2015, 29, 1943–1957. [Google Scholar] [CrossRef]
  49. Blaschke, H. Decline symptoms on roots of Quercus robur. For. Pathol. 1994, 24, 386–398. [Google Scholar] [CrossRef]
  50. Manes, F.; Vitale, M.; Donato, E.; Giannini, M.; Puppi, G. Different ability of three Mediterranean oak species to tolerate progressive water stress. Photosynthetica 2006, 44, 387–393. [Google Scholar] [CrossRef]
  51. Leiva, M.J.; Fernández-Alés, R. Variability in seedling water status during drought within a Quercus ilex subsp. ballota population, and its relation to seedling morphology. For. Ecol. Manag. 1998, 111, 147–156. [Google Scholar] [CrossRef]
  52. Villar-Salvador, P.; Planelles, R.; Enrı́quez, E.; Rubira, J.P. Nursery cultivation regimes, plant functional attributes, and field performance relationships in the Mediterranean oak Quercus ilex L. For. Ecol. Manag. 2004, 196, 257–266. [Google Scholar] [CrossRef]
  53. Jönsson, U. Phytophthora species and oak decline—Can a weak competitor cause significant root damage in a nonsterilized acidic forest soil? New Phytol. 2004, 162, 211–222. [Google Scholar] [CrossRef]
  54. Cahill, D. Cellular and histological changes induced by Phytophthora cinnamomi in a group of plant species ranging from fully susceptible to fully resistant. Phytopathology 1989, 79, 417–424. [Google Scholar] [CrossRef]
  55. Sánchez, M.; Caetano, P.; Ferraz, J.; Trapero, A. Phytophthora disease of Quercus ilex in south-western Spain. For. Pathol. 2002, 32, 5–18. [Google Scholar] [CrossRef]
  56. Sánchez, M.E.; Andicoberry, S.; Trapero, A. Pathogenicity of three Phytophthora spp. causing late seedling rot of Quercus ilex ssp. ballota. For. Pathol. 2005, 35, 115–125. [Google Scholar] [CrossRef]
  57. Vettraino, A.M.; Belisario, A.; Maccaroni, M.; Vannini, A. Evaluation of root damage to English walnut caused by five Phytophthora species. Plant Pathol. 2003, 52, 491–495. [Google Scholar] [CrossRef]
Figure 1. Plant symptoms after 30 dpi. (a) Leaf symptoms for the different treatments (b) Detail of roots showing root rot symptoms of inoculated plants in comparison to control. “I × D” = Pots non-watered and inoculated with P. cinnamomi Rands.
Forests 09 00634 g001
Figure 2. Physiological characterization of Quercus ilex L. seedlings during the experiment. (a) Volumetric water content (ϴ). (b) Net photosynthesis (A). (c) Stomatal conductance (Gs). (d) Photosynthetic efficiency of Photosystem II (QY). Points with the same letter are not significantly different for the analyzed dpi (p > 0.05). In sets of points where there were no significant differences for dpi according to the ANOVA test, the letters are not presented. Differences between values of the same days are represented only when significant at p < 0.05 (*), p < 0.01 (**) and p < 0.001 (***).
Forests 09 00634 g002
Figure 3. Mean volumetric water content (ϴ) of soil (points) and mean dry matter of roots (columns) at 30 dpi. Treatments with the same letter for each variable are not significantly different (p > 0.05).
Forests 09 00634 g003
Figure 4. Plant biomass analysis (a) Biomass distribution per treatment. Upside mean aboveground (Stem and leaves) biomass. Downside mean belowground (root) biomass. (b) Relative stem biomass with respect to total aboveground biomass, per treatment. (c) Plant fractions for each treatment. LMF = Leaf mass fraction. SMF = Stem mass fraction. RMF = Root mass fraction. (d) Average plasticity index for each treatment. Error bars show ±SE. Bars with the same letter are not significantly different (p > 0.05).
Forests 09 00634 g004
Table 1. Description of studied variables.
VariableAbv.UnitsDescription
Water status
Volumetric Water contentϴcm3 (cm)−3Relative humidity of pot substrate
Midday Water potentialΨmMPaWater potential of leaves at midday (at solar noon)
Dry Matter of rootDMrg (100 g)−1Dry matter of root relative to 100 g of fresh weight
Plant growth and biomass allocation
Net PhotosynthesisAμmol CO2 m−2 s−1Mean estimate of photosynthetic rate of leaves
Stomatal ConductanceGsmmol H2O m−2 s−1Mean estimate leaf stomatal conductance
Photosynthetic EfficiencyQYMax. quantum efficiency of photosystem II (Fv/Fm)
Root Dry WeightRDWgWeight of root system after oven drying (root biomass)
Stem Dry WeightSDWgWeight of stem after oven drying (stem biomass)
Leaf Dry WeightLDWgWeight of leaves after oven drying (leaves biomass)
Root Mass FractionRMFg (g)−1Root biomass relative to total plant biomass
Stem Mass FractionSMFg (g)−1Stem biomass relative to total plant biomass
Leaf Mass FractionLMFg (g)−1Leaves biomass relative to total plant biomass
Table 2. Repeated-measures ANOVA (RMANOVA) results for the effect of inoculation and water stress on physiological variables and volumetric water content. The degrees of freedom (df), type III sum of squares are shown for each variable. Geisser-Greenhouse adjusted probabilities were used for the within-subject analysis. Values of sum of squares are highlighted in bold type when significant (* p < 0.05; ** p < 0.01; *** p < 0.001).
FactorsdfExperimental Variable
AGsQYϴ
Between-subjects source
Inoculation (I)131.531 ***0.016 **0.183 **0.047 *
Drought (D)186.041 ***0.010 *0.0010.660 **
I × D10.3940.0000.351 ***0.002
Error1631.6980.0230.3040.058
Within-subjects source
Days (dpi)422.8210.0070.262 ***0.901 ***
dpi × I43.2540.0030.0150.002
dpi × D477.014 ***0.0070.162 **0.147 ***
dpi × I × D48.2790.0010.0510.001
Error64139.5180.0510.4720.02
Table 3. Two-way ANOVA results for variables measured 30 dpi. Values of F statistic are highlighted in bold type when significant (* p < 0.05; ** p < 0.01; *** p < 0.001; n/s, not significant). R2 represents corrected ANOVA model adjustment. (+) or (−) mean that the factor has a positive or negative effect, respectively.
Factors
VariableInoculation (I)Drought (D)I × DR2
Ψm2.46763.7 *** (−)2.40.99 ***
DMr0.025.1 *** (+)8.0 **0.61 ***
RDW0.74.3 * (+)0.00.24 **
SDW5.0 * (−)3.35.5 *0.46 ***
RMF10 ** (−)41.7 *** (+)0.0 n/s0.76 ***
SMF5.0 * (−)12.4 ** (−)7.6 **0.61 ***
LMF18.8 *** (+)8.8 ** (−)3.9 n/s0.66 ***

