Article

Forty-Eight Years of Forest Succession: Tree Species Change across Four Forest Types in Mid-Missouri

by
Benjamin O. Knapp
* and
Stephen G. Pallardy
School of Natural Resources, University of Missouri, Columbia, MO 65211, USA
*
Author to whom correspondence should be addressed.
Forests 2018, 9(10), 633; https://doi.org/10.3390/f9100633
Submission received: 30 August 2018 / Revised: 26 September 2018 / Accepted: 11 October 2018 / Published: 12 October 2018
(This article belongs to the Section Forest Ecology and Management)

Abstract

:
In the central and eastern United States, many forest ecosystems have undergone recent shifts in composition and structure that may conflict with contemporary management objectives. Long-term forest inventory data were used to determine patterns of forest succession over a 48-year period for four forest types in mid-Missouri: bottomlands, dry ridge and slope, glade-like, and mesic slopes. All forest types increased in stand basal area and overstory quadratic mean diameter through time, with concomitant decreases in the number of midstory trees. Sugar maple (Acer saccharum Marshall) increased in importance value on dry ridge and slope and mesic slope forest types, largely due to the accumulation of trees in smaller diameter classes. White oak (Quercus alba L.) increased in overstory basal area in dry ridge and slope plots through the duration of the study, whereas black oak (Quercus velutina Lam.) and Shumard oak (Quercus shumardii Buckley) decreased in overstory density and basal area through time. Oak stems were nearly absent from the midstory across forest types in the recent sampling, suggesting future challenges for maintaining oak-dominated canopies following attrition of canopy trees through time on upland forest types. In glade-like plots, eastern redcedar (Juniperus virginiana L.) increased in both overstory density and basal area through time, and Shumard oak decreased in density. The importance value of chinkapin oak (Quercus muehlenbergii Engelm.) in the overstory decreased through time in glade-like plots, largely due to the increase in density of eastern redcedar rather than the loss of chinkapin oak from the overstory. The patterns of succession in this forest landscape of mid-Missouri suggest that forest management may be needed to address two common contemporary concerns: (1) the need for increasing oak advance reproduction and recruitment to maintain oak as a canopy species; and (2) reducing eastern redcedar encroachment for glade restoration and management.

1. Introduction

Temporal change is a fundamental characteristic of forested ecosystems and has been widely studied in relation to natural processes, such as forest succession and natural disturbance (e.g., [1,2,3]), and anthropogenic influence, such as legacy effects of past land use or modern silvicultural manipulation (e.g., [4,5]). Given the extent of anthropogenic influence, contemporary trajectories of forest change are complex and inexorably linked to both natural processes and human influence [6]. Relatively rapid recent changes in abiotic (e.g., climate extremes) and biotic (e.g., introductions of non-native species, increased activity of native pests or pathogens) conditions have altered the rates or pathways of forest change through large-scale mortality events and new species interactions [7]. Consequently, the challenges of managing forest resources to maintain ecological function and meet management needs have been exacerbated by the dynamic uncertainties of contemporary forest change [8].
The Central Hardwood Forest Region of the United States has been variously defined but generally includes most of the area within the states of Missouri, Illinois, Indiana, Ohio, Kentucky, Tennessee, Pennsylvania, and West Virginia, as well as portions of Iowa, Wisconsin, and Arkansas [9,10,11]. The region is dominated by deciduous trees, particularly oak (Quecrus spp.) and hickory (Carya spp.) species, with the dominance of these genera inversely related to a west–east productivity gradient [12]. Similar to other areas of the eastern United States, much of the Central Hardwood Region has experienced oak regeneration deficiencies, resulting in shifts in composition away from oak dominance through time [13,14,15,16]. The region lacks age-class diversity within its forests, the majority of which are approaching approximately 80 years old [17]. Thus, as canopy mortality occurs, successional patterns may be progressing in relative synchrony across broad regions of the central and eastern US. The potential loss of oak dominance concerns many practitioners due to the economic, ecological, and cultural significance of the genus [11].
Along the western edge of the Central Hardwood Forest Region, including much of Missouri (MO), site productivity is relatively low and oak dominance is particularly high. Although there have traditionally been fewer concerns with oak regeneration due to the low site productivity and reduced competitive pressure from other species, the abundance of oak regeneration is variable across the region [18,19], and mesic species have increased in regeneration layers [20,21]. In recent decades, reductions in oak abundance have been notable in Missouri [16]. Since the period of European settlement in the early 1800s, forest compositional and structural changes, including increased densities of small diameter trees, have been associated with fire suppression and exclusion practices [22]. Changes in fire regime in Missouri have been coincident with the loss in the extent of savannas, woodlands, glades, and other unique habitats [23,24,25]. These habitats are commonly associated with species of conservation concern [26], and thus their restoration and maintenance have become increasingly important management objectives.
Few studies have empirically quantified successional dynamics within mid-Missouri. In 1968, a series of permanent vegetation plots were established in Boone County, MO, to characterize and evaluate a variety of ecosystem attributes across a range of site conditions [27,28,29]. The initial analyses identified species associations across site conditions to define forest types. The presence of sugar maple (Acer saccharum Marshall) in the midstory of upland forest types was speculated to eventually result in a shift to sugar maple dominance of oak forests [27]. The permanent plots were resampled at approximately 10–15 year intervals, with subsequent analyses further supporting an accumulation of sugar maple within the midstory layer and evidence of reduced oak dominance within the overstory of upland forest types [30,31].
By resampling the plots in 2016, the dataset was extended to nearly 50 years of successional change in four forest types of mid-Missouri. The goal here was to describe those changes, focusing on temporal shifts in species composition and dominance. The specific objectives included: (1) quantifying changes in stand structure (density, basal area, quadratic mean diameter of the overstory, and density by size class of the midstory) through time across four forest types; (2) describing compositional shifts through time across size classes for each forest type; (3) identifying tree species gaining or losing dominance within each forest type; and (4) quantifying changes in density and basal area through time for each species identified as having changed in dominance. Results from this work demonstrate trajectories of forest succession when no management is practiced within portions of the western Central Hardwood Forest Region and thus may be used to identify opportunities for management intervention.

2. Materials and Methods
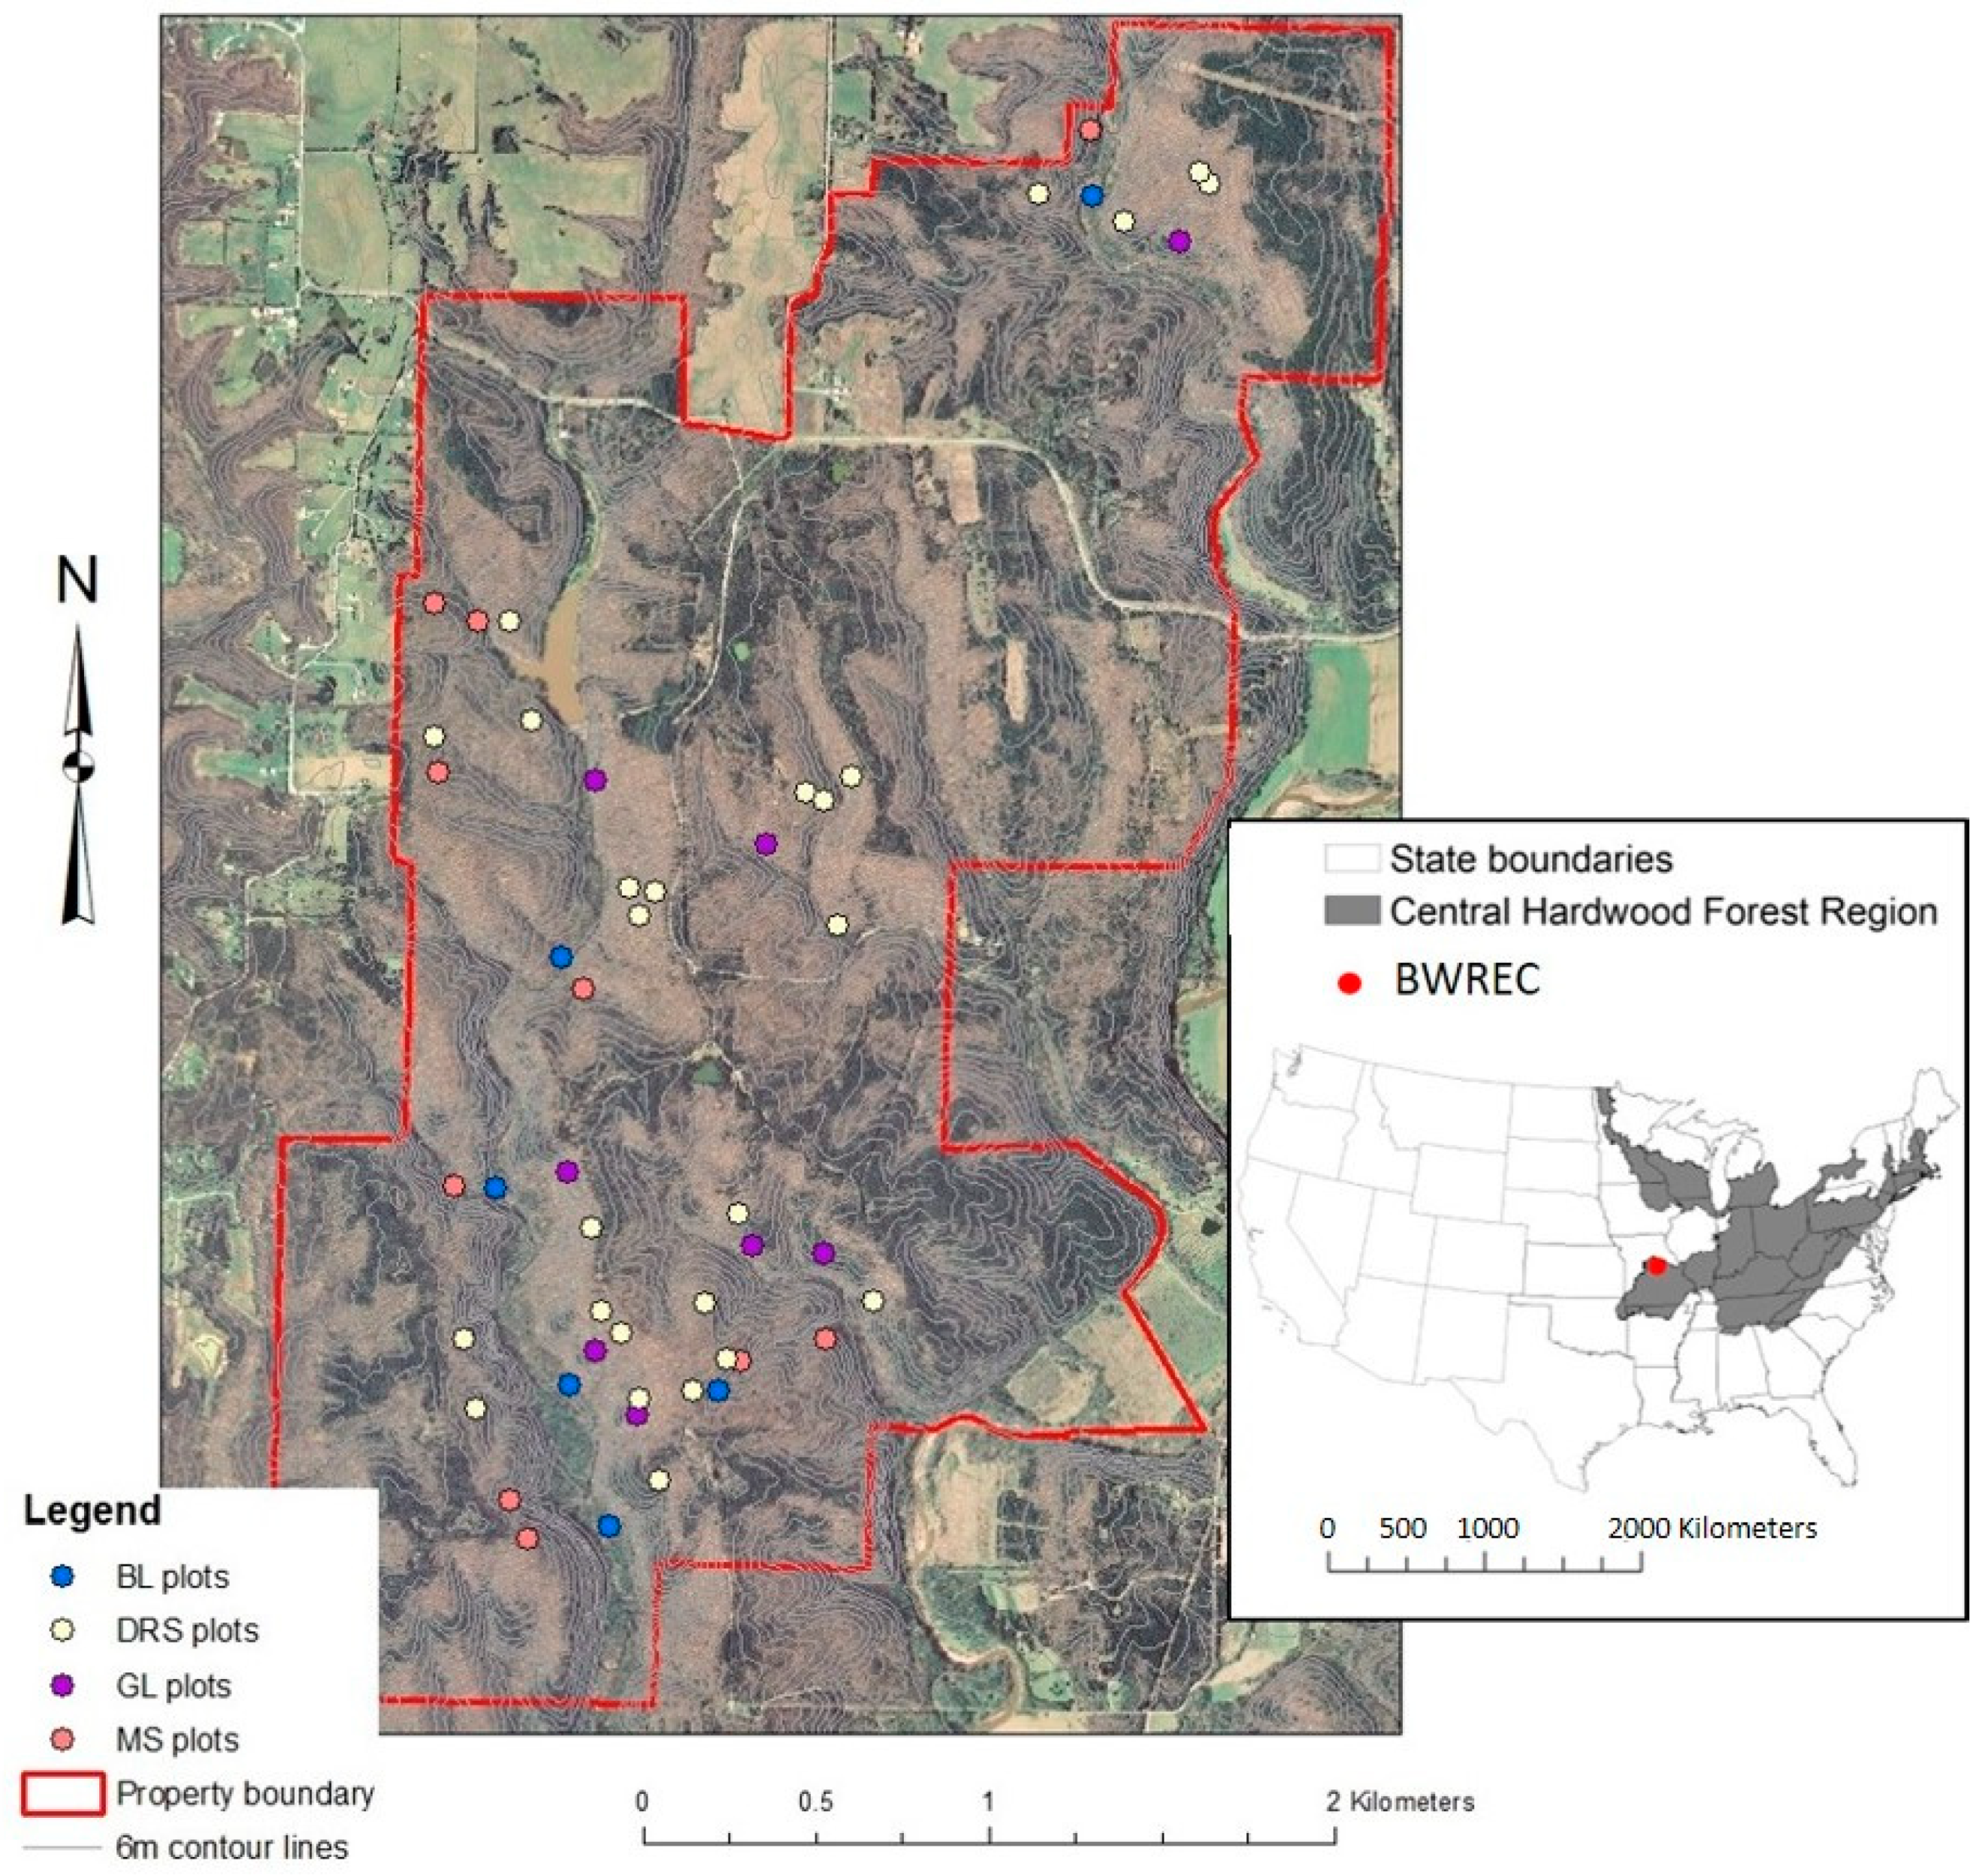
2.1. Study Site

The study was located in the University of Missouri’s Baskett Wildlife Research and Education Center (BWREC, formerly Ashland Wildlife Area) in Boone County, MO (38°45′44″ N, 92°11′40″ W). BWREC is an approximately 900 ha property that has been managed by the University of Missouri since the 1930s. Prior to public acquisition, the area had consisted of several farms; aerial photographs from 1939 reveal that many of the ridges and some valleys were cleared for agriculture, and the forested areas were likely widely grazed throughout. Described in 1938 as an arboretum and wildlife experimental area, BWREC has since been maintained to fulfill research and education missions of the university.
The BWREC is located within the Outer Ozark Border Subsection of the Ozark Highlands Ecological Section [32]. The climate of the region is warm, humid, and continental [33], with mean maximum monthly temperature of 31.2 °C in July, mean minimum monthly temperature of −6.8 °C in January, and mean annual precipitation of 103.9 cm during the study period (National Climatic Data Center, 1970 to 2016, Columbia Regional Airport station). The area is characterized by rugged topography, with ridges separated by steep slopes into narrow floodplains and valleys. Elevation ranges from approximately 160 m above sea level in the Cedar Creek drainage to approximately 250 m along ridges running north–south through the property. In some instances, single slopes cover nearly the full elevation relief. Soils of the area were primarily derived from limestones, with loess caps on ridge tops and side slopes. Agricultural land use was most intense on the ridge tops, resulting in heavy soil erosion. Throughout the property, limestone bedrock is at or near the surface, to varying depths, along many of the side slopes, resulting in distinct, local changes in soil character and vegetation community. Upland forests of the region are strongly dominated by oak species, with white oak (Quercus alba L.) most abundant but sharing dominance with black oak (Q. velutina Lam.) on drier sites, northern red oak (Q. rubra L.) on more mesic sites, and chinkapin oak (Q. muehlenbergii Engelm.) dominant on glade-like habitats.

2.2. Plot Establishment and Vegetation Sampling

In 1968, a network of 75 permanent vegetation sampling plots was established throughout BWREC, with the objective to ‘obtain as broad a representation as possible of the existing environmental variations within the area’ [27]. Originally designed for ecological gradient analysis, plot locations were stratified by geography, topography, and stand age, and no plots were established in locations that were clear of trees in 1939. Each plot was fixed-area and circular, with an iron post driven into the ground at plot center. To sample overstory vegetation, all trees ≥10 cm diameter at breast height (DBH) within 16.1 m from plot center (0.08 ha) were measured for DBH and species were recorded. In 2016, each overstory tree was marked with an aluminum tag for future measurement. Midstory trees were sampled within smaller, nested plots originating from plot center. Prior to 2016, midstory trees were sampled within 11.3 m (0.04 ha) from plot center; in 2016, each midstory tree was marked with an aluminum tag and sampled within 8.0 m (0.02 ha) from plot center. Midstory trees were tallied by species in the following DBH classes: Class 1 = 0.01–1.25 cm; Class 2 = 1.26–3.75 cm; Class 3 = 3.76–6.25 cm; Class 4 = 6.26–8.75 cm. Through time, several of the plots were removed from the network for various reasons, such as impact from other research projects (harvesting, herbicide, etc.) or loss of plot monumentation. Of the original 75 plots, 50 had been sampled in all five measurement periods (1968, 1982, 1992, 2004, and 2016) and are included in this analysis (Figure 1).
Each plot was categorized by forest type based on species composition and topo-edaphic factors [27,30,31]. The most recent analyses used nonmetric multi-dimensional scaling ordination to classify plots as bottomland (BL, n = 6 plots), dry ridge and slope (DRS, n = 26 plots), glade-like (GL, n = 8 plots), and mesic slope (MS, n = 10 plots) forest types [30], which are the forest type classifications used in this analysis. Bottomland forest plots were located on floodplain terraces, primarily within the Brushy Creek drainage, on flat terrain. Soils were of the Cedargap-Dameron complex, described as very deep, well-drained soil formed in silty alluvium with chert fragments. The dry ridge and slope forest type was common on upper slopes and ridges, generally with shallow soils and low nutrient and water holding capacity. Soils of the slopes were commonly of the Bardley-Clinkenbeard complex, which is very stony, well-drained soil derived from slope alluvium over cherty limestone residuum, with ridges of the Weller soil series, moderately well-drained silt loam of eroded loess. The glade-like plots commonly occurred along slopes with shallow soils and limestone near or at the surface, with greater pH, calcium, and magnesium. These plots commonly occurred on soils of the Rocheport-Bonnefemme complex, shallow silt loams with varying depth to bedrock, derived from loess over limestone residuum. The mesic slope plots occurred along similar soil types as the dry ridge and slope plots but commonly at lower slope positions or protected aspects and are associated with greater organic matter, soil pH, and nutrient availability [30]. Soil descriptions are derived from Web Soil Survey (https://websoilsurvey.sc.egov.usda.gov/; accessed on 1 January 2018).

2.3. Data Analyses

Changes in forest structure through time (Objective 1) were tested with repeated measures, mixed linear models using the PROC MIXED procedure in SAS software (SAS 9.4, SAS Institute Inc., Cary, NC, USA). Stand-level variables (density (trees/ha), basal area (m2/ha), and quadratic mean diameter (cm) for overstory trees and density (trees/ha) by size class for midstory trees) were calculated for each plot. Forest type was treated as a fixed effect within the models, and year was considered a repeated effect with a compound symmetry covariance structure. Degrees of freedom were calculated with the Satterthwaite adjustment. In the absence of a significant year by forest type interaction effect, significance of pair-wise comparisons of marginal means was determined with the Tukey’s Honestly Significant Difference (HSD) adjustment.
Patterns of change through time in the forest community were described for the overstory and midstory layers using nonmetric multidimensional scaling ordination (Objective 2) (PC-ORD 6.08 Software, MjM Software Design, Gleneden Beach, OR, USA). For the ordination, the importance value of each species was calculated for each plot and summarized by forest type and year. The importance value (IV) of overstory trees was calculated as the average of the relative contribution to total density (i.e., relative density, RD) and the relative contribution to total basal area (i.e., relative basal area, RBA) per species within each plot, and the IV for midstory trees was calculated as the RD per species within each plot. Species that occurred within fewer than 2% of the plots were not included in the analyses. The ordination used the Bray-Curtis distance measure, random starting coordinates, and a maximum of 500 iterations. The procedure stepped down from six to one dimensions, and the final dimensionality was determined when additional axes did not result in proportional reduction in stress [34]. The ordination included forest type by year separated into overstory and midstory forest layers. To show species-level changes in composition from 1968 to 2016, the RD of each of the ten most important overstory species was determined by 2 cm DBH class for trees >10 cm DBH.
To identify which species significantly changed over the study period, the difference in overstory IV from 1968 to 2016 was calculated for each species, and paired t-tests were used to determine if the change in importance value was significantly different from zero for each species (Objective 3) using the PROC TTEST procedure in SAS. The contribution of RD and RBA to the change in IV was determined for each overstory species that significantly changed through time.
For each overstory species that significantly changed in IV through time, subsequent tests analyzed changes in density and basal area of overstory trees through time using repeated measures mixed linear models (Objective 4) using the PROC MIXED procedure in SAS. Each model was analyzed separately by forest type, with year considered a repeated effect with compound symmetry covariance matrix. Degrees of freedom were calculated with the Satterthwaite adjustment, and pair-wise comparisons were made with Tukey’s HSD adjustment. For all mixed linear models, square root or log transformations were made to meet assumptions of constant variance and normality, if necessary. For species with significant changes in important values, the midstory means of the number of trees per hectare were calculated by forest type and year. Due to the absence of many of the species across later years, statistical analyses were not conducted on the midstory abundance by species. Statistical significance was considered if p < 0.05.

3. Results

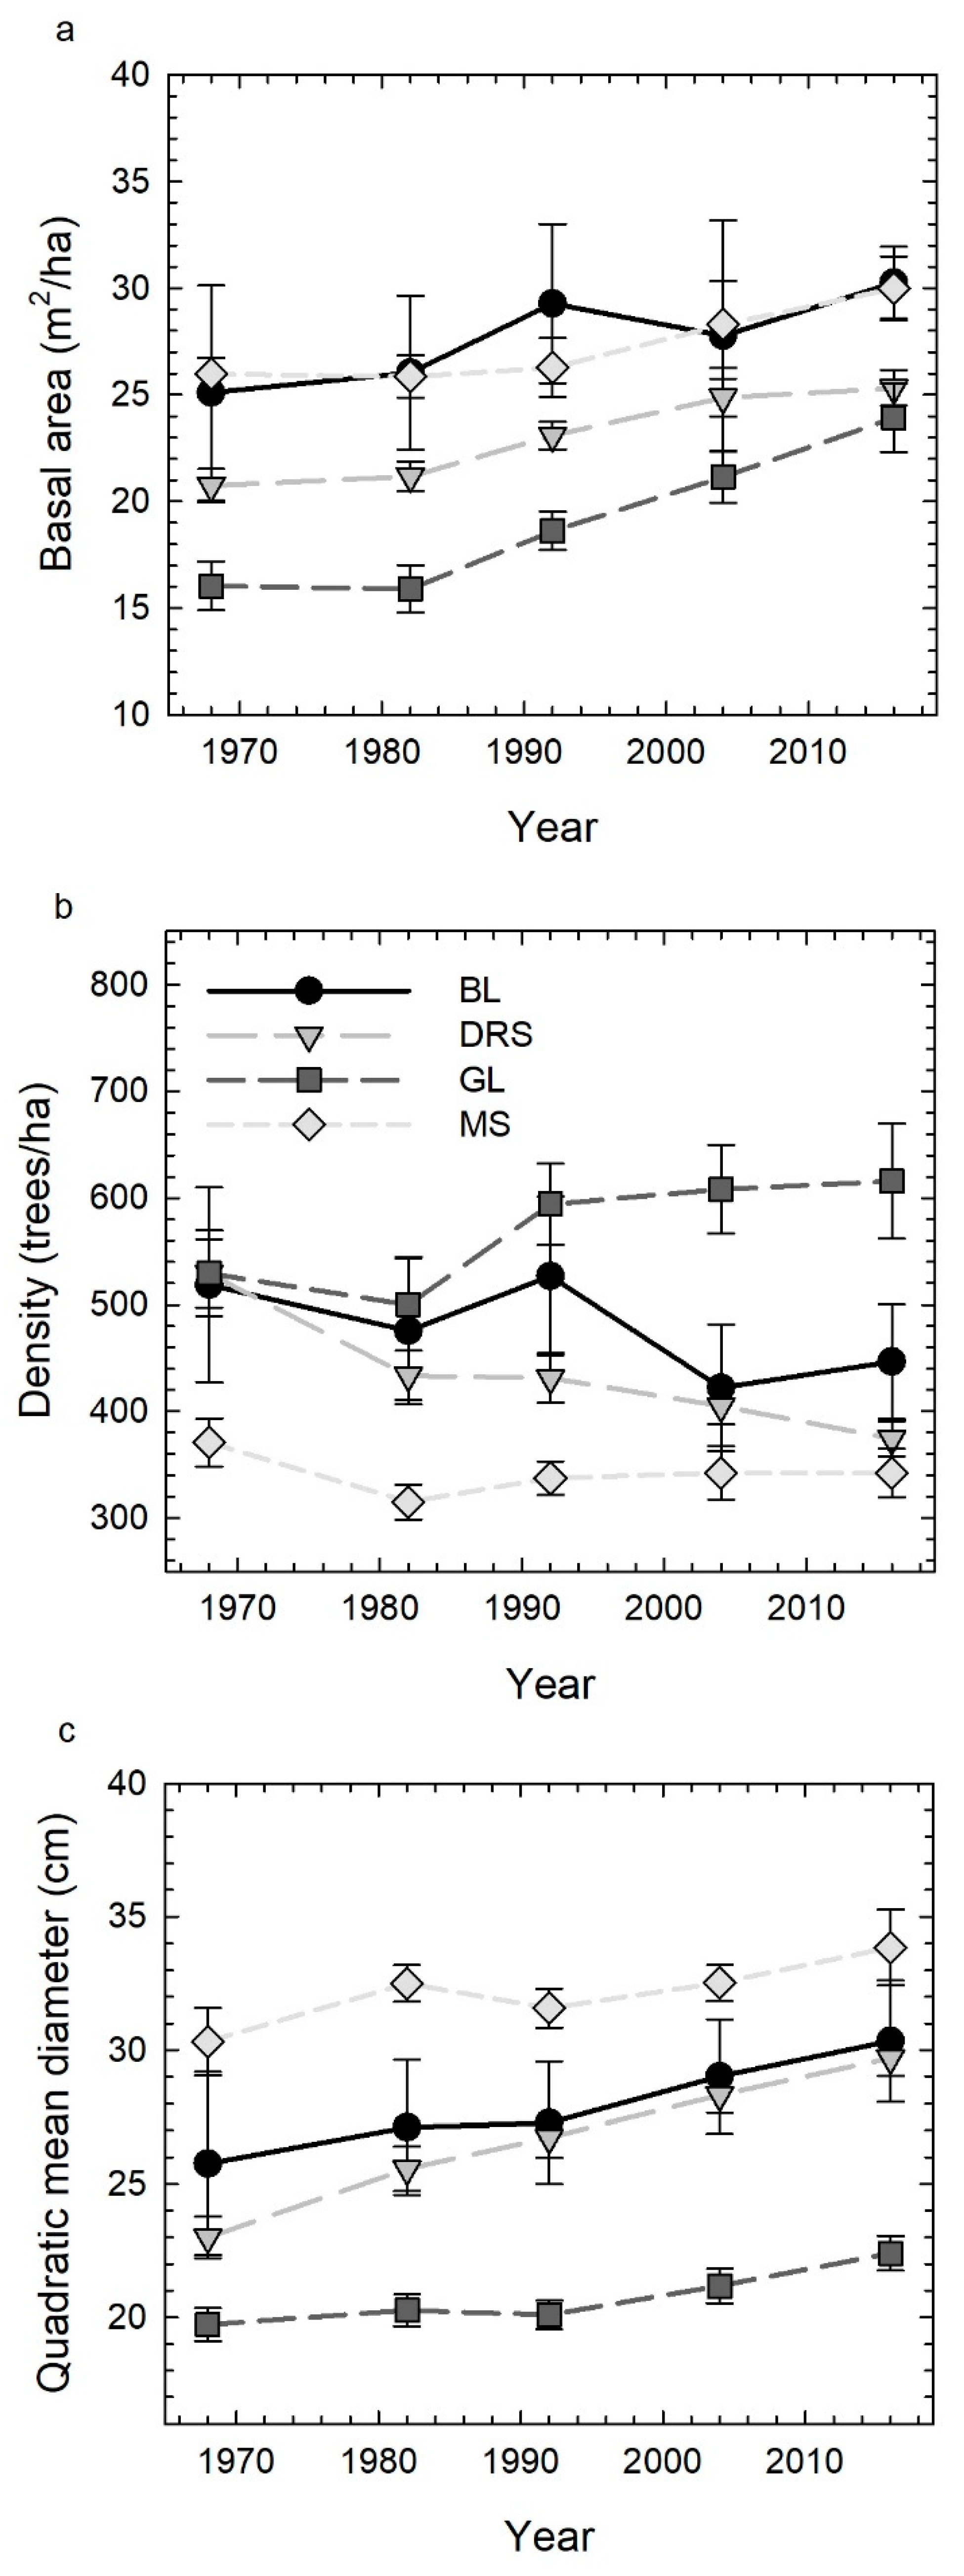
3.1. Forest Structure through Time

Throughout the 48-year study period, basal area across forest types increased through time, with no interaction effect between forest type and year (F12,230 = 0.91; p = 0.537) (Table 1 and Figure 2). Basal area was greatest for bottomland and mesic slope forest types and lowest for the glade-like forest type (Table 1). The pattern was similar for quadratic mean diameter, which increased through time across all forest types, with no interaction between forest type and year (F12,230 = 0.77; p = 0.684). Quadratic mean diameter was greatest for the mesic slope forest type and lowest for the glade-like forest type. There was no significant interaction effect between forest type and year for density (F12,230 = 1.73; p = 0.062), despite an apparent pattern of decreasing density for the dry ridge and slope forest type and increasing density for the glade-like forest type (Figure 2). Across years, the glade-like forest type had the greatest density, and the mesic slope forest type had the least (Table 1).
For midstory trees, there were no interaction effects between forest type and year for any size class (p ≥ 0.155) or for all midstory trees combined (F12,230 = 1.58; p = 0.099). Although the total density of midstory stems decreased significantly through time, most of the reduction occurred in Class 1 and Class 2, the smallest midstory trees (Figure 3). The density of midstory trees fluctuated through time for each size class but remained relatively stable for Class 4, with no significant difference in density in 1968 (159 trees per hectare) and in 2016 (155 trees per hectare) (t = 0.22; p = 0.995). Midstory density differed among forest types only for Class 1 (F3228 = 3.64; p = 0.014), in which the bottomland forest type had greater density than the dry ridge and slope forest type (t = 2.83; p = 0.026), and for Class 4 (F3224 = 2.65; p = 0.049), in which the glade-like forest type had greater density than the dry ridge and slope forest type (t = 2.80; p = 0.028).

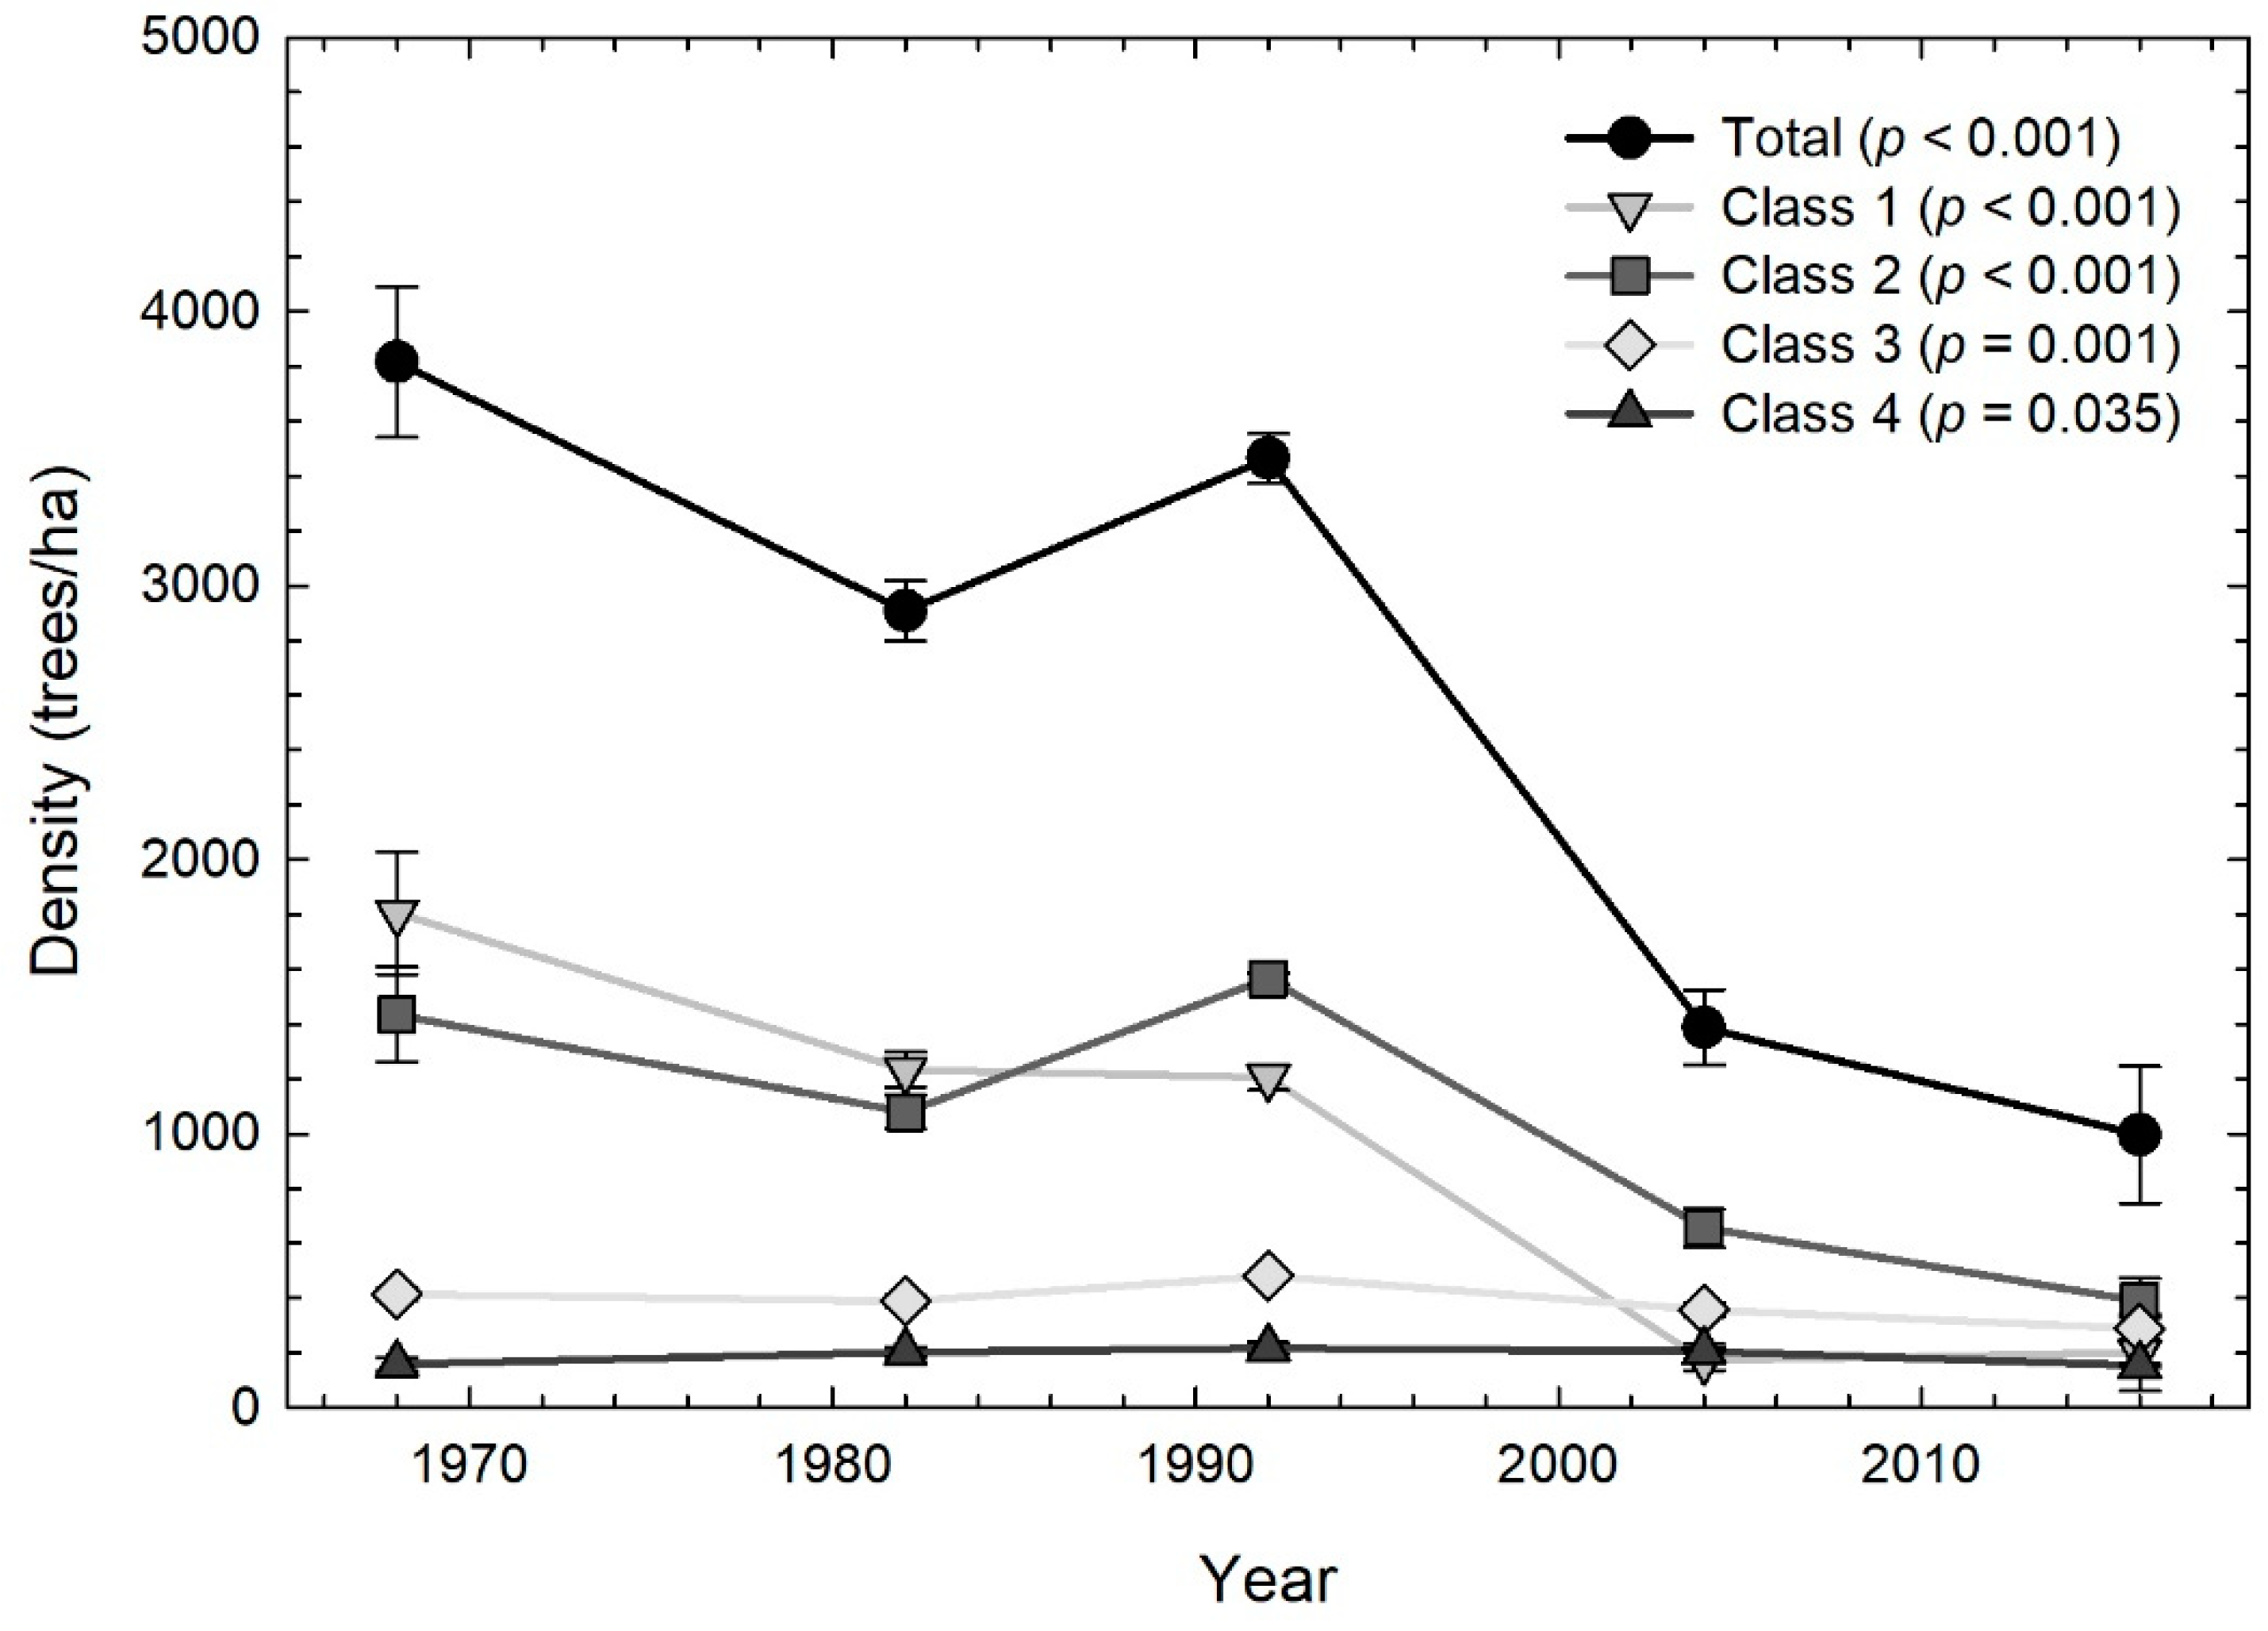
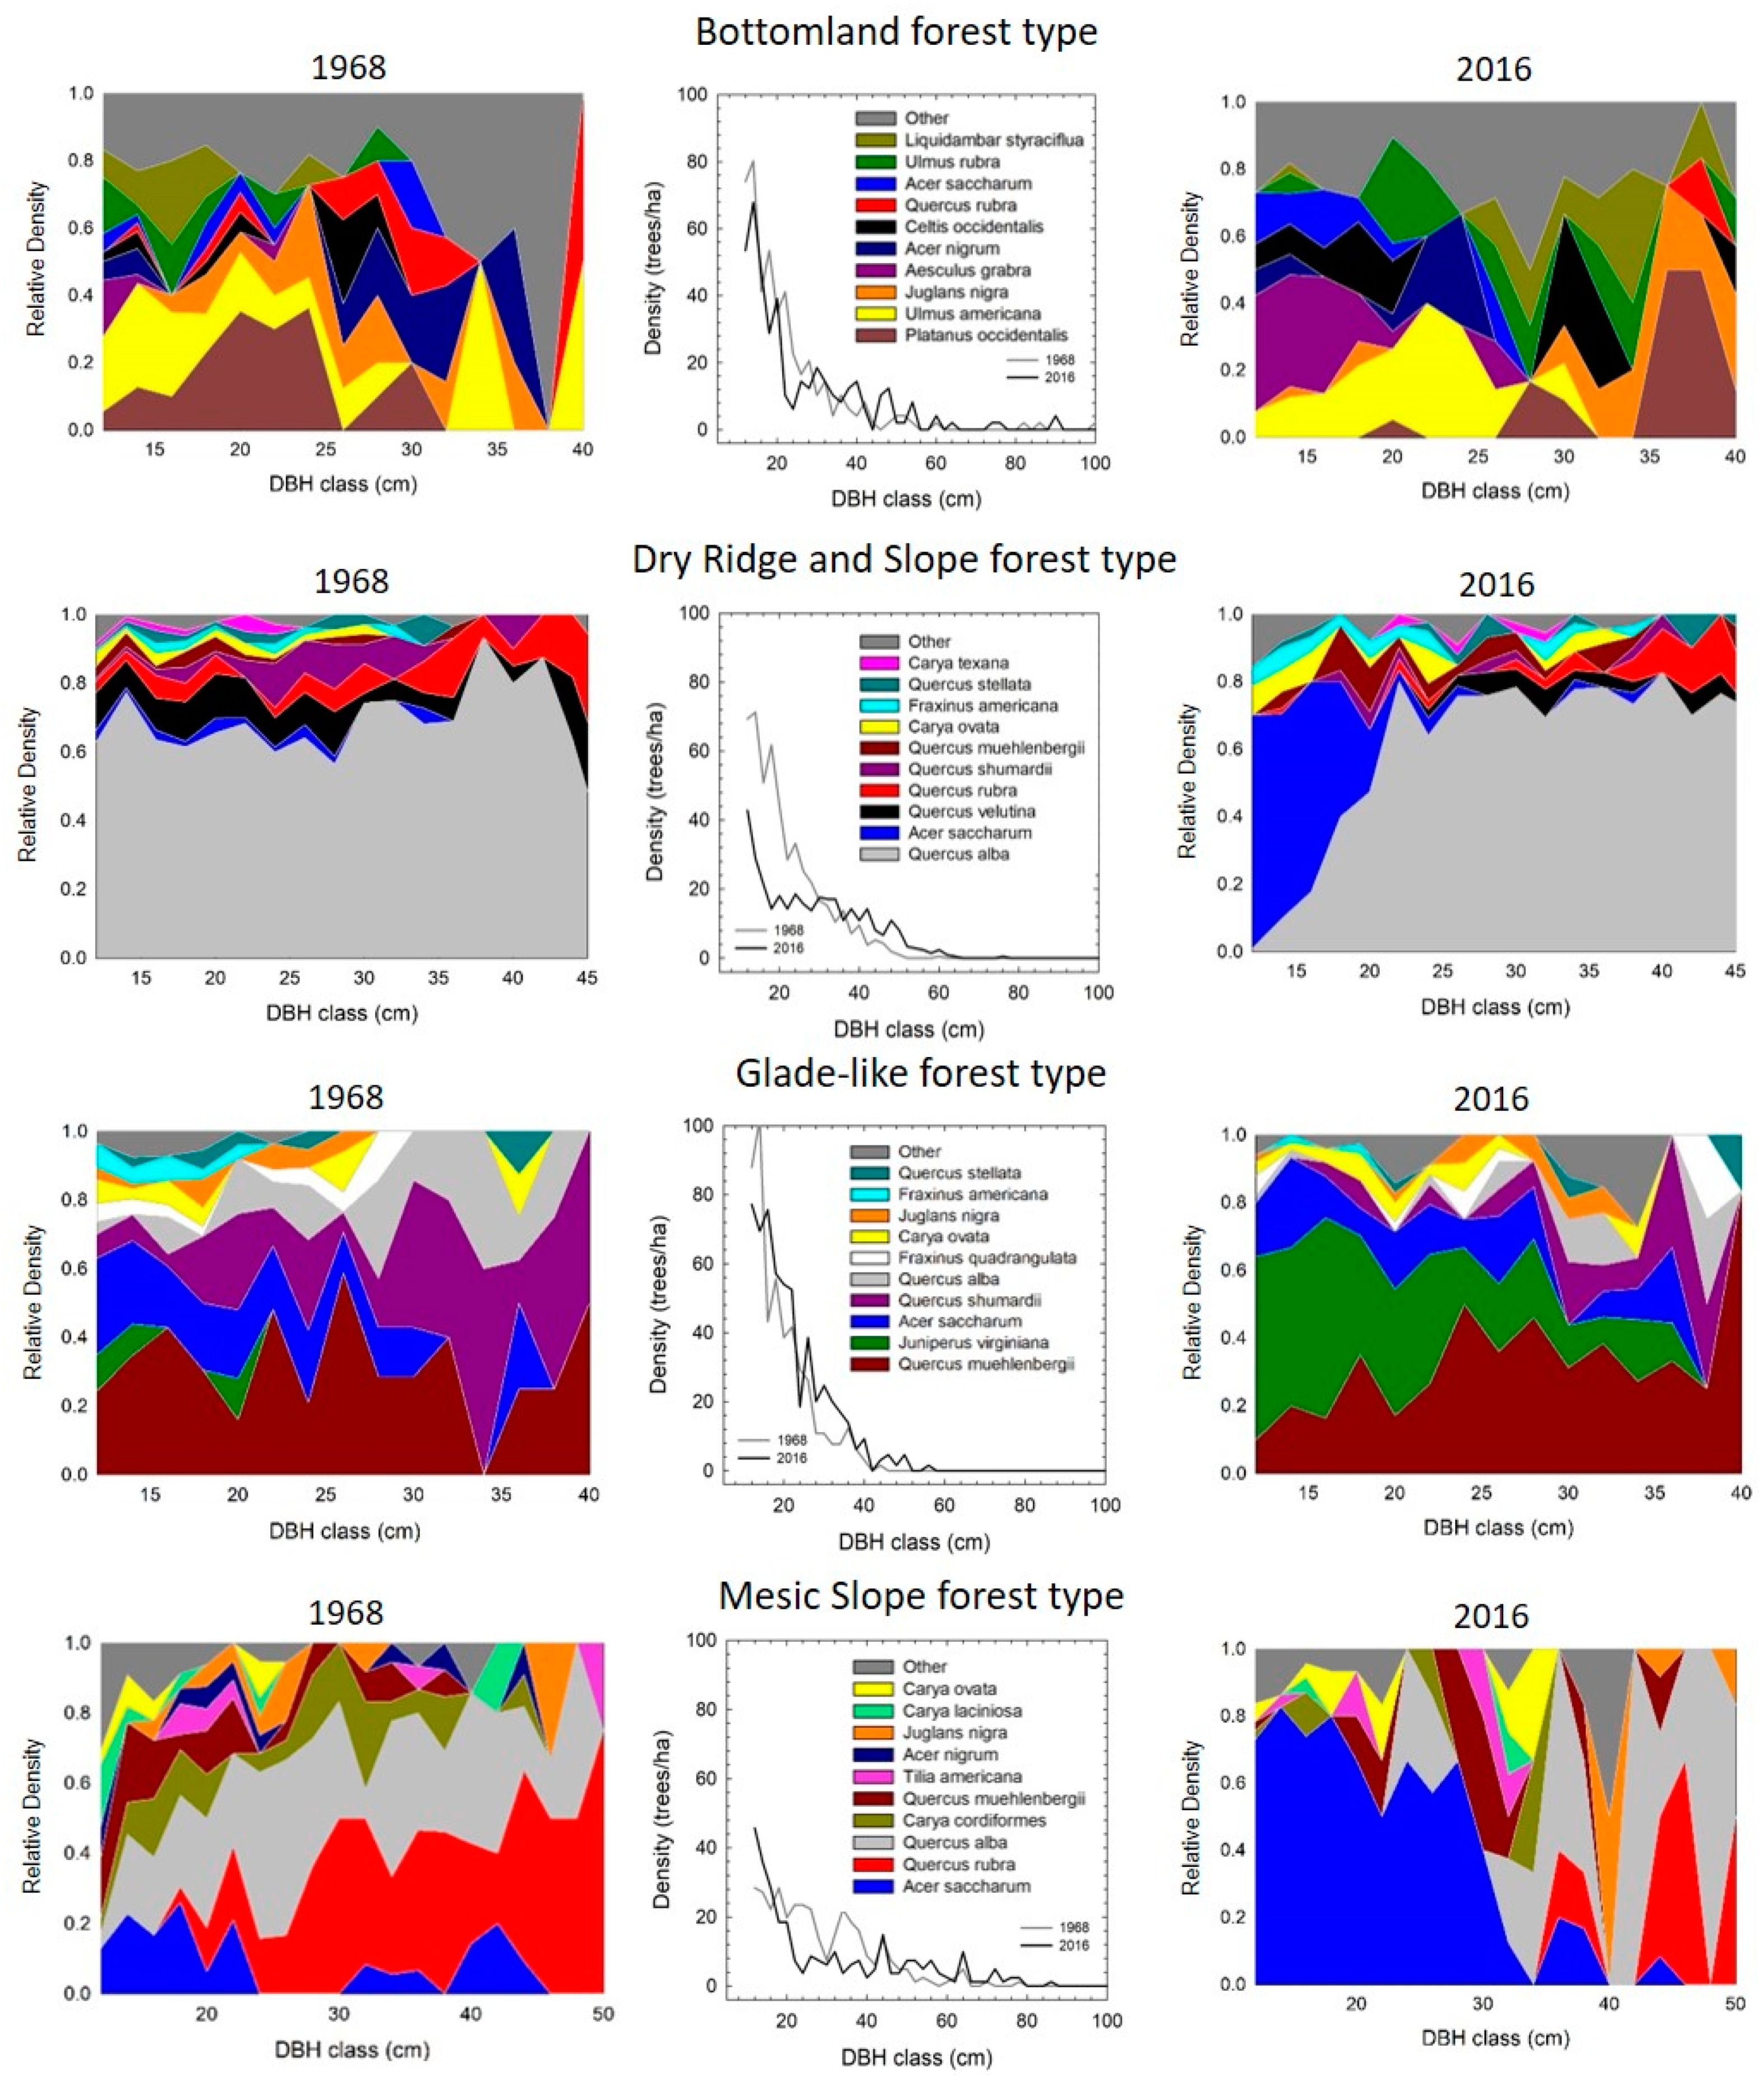
3.2. Forest Composition by Size Class

The nonmetric multidimensional scaling ordination was best fit with three axes, with a final stress of 5.53 through 64 iterations. The solution resulted in a cumulative r2 of 0.901, with Axis 1 accounting for 39.8% of the variation in the ordination, Axis 2 accounting for an additional 35.2% of the variation, and Axis 3 accounting for an additional 15.1% of the variation (Figure 4). Axis 1 was most strongly positively correlated with white oak, along with upland oak species including black oak and northern red oak, as well as bottomland species such as black walnut (Juglans nigra L.) and shellbark hickory (Carya laciniosa (Michx. f.) G. Don) (Table 2). Axis 1 was most strongly negatively associated with sugar maple as well as mesic understory species such as ironwood (Ostrya virginiana (Mill.) K. Koch), hornbeam (Carpinus caroliniana Walter), and dogwood (Cornus florida L.) (Table 2). The overstory and midstory layers of each forest type separated along Axis 1, and the dry ridge and slope and mesic slope forest types trended toward more negative positions along Axis 1 through time (Figure 4). Axis 2 was positively associated with species common to the bottomland forest type, and Axis 3 was negatively associated with species common in the glade-like forest type.
The bottomland forest type had the greatest number of species within the overstory. American sycamore (Platanus occidentalis L.) and American elm (Ulmus americana L.) were the most dominant species, with the greatest RD for each found at larger size classes in 2016 than in 1968 (Figure 5). Within smaller size classes (<20 cm DBH), Ohio buckeye (Aesculus glabra Willd.) had a notable increase in RD by 2016. In 1968, the dry ridge and slope forest type was clearly dominated by white oak across all size classes of the overstory. The greatest apparent change by 2016 was the increase in sugar maple in small size classes, with RD of sugar maple decreasing along the diameter distribution to approximately the 20 cm size class. An increase in the RD of sugar maple from 1968 to 2016 was also pronounced within small size classes of the mesic slope forest type. The mesic slope forest type was composed of primarily white oak and northern red oak in 1968, with these species dominating the larger size classes in 2016 (Figure 5). The glade-like forest type was dominated by chinkapin oak and Shumard oak (particularly in larger size classes) in 1968, with low RD of eastern redcedar. By 2016, the RD of Shumard oak had decreased, with an increase in RD of eastern redcedar in the smaller size classes (Figure 5).

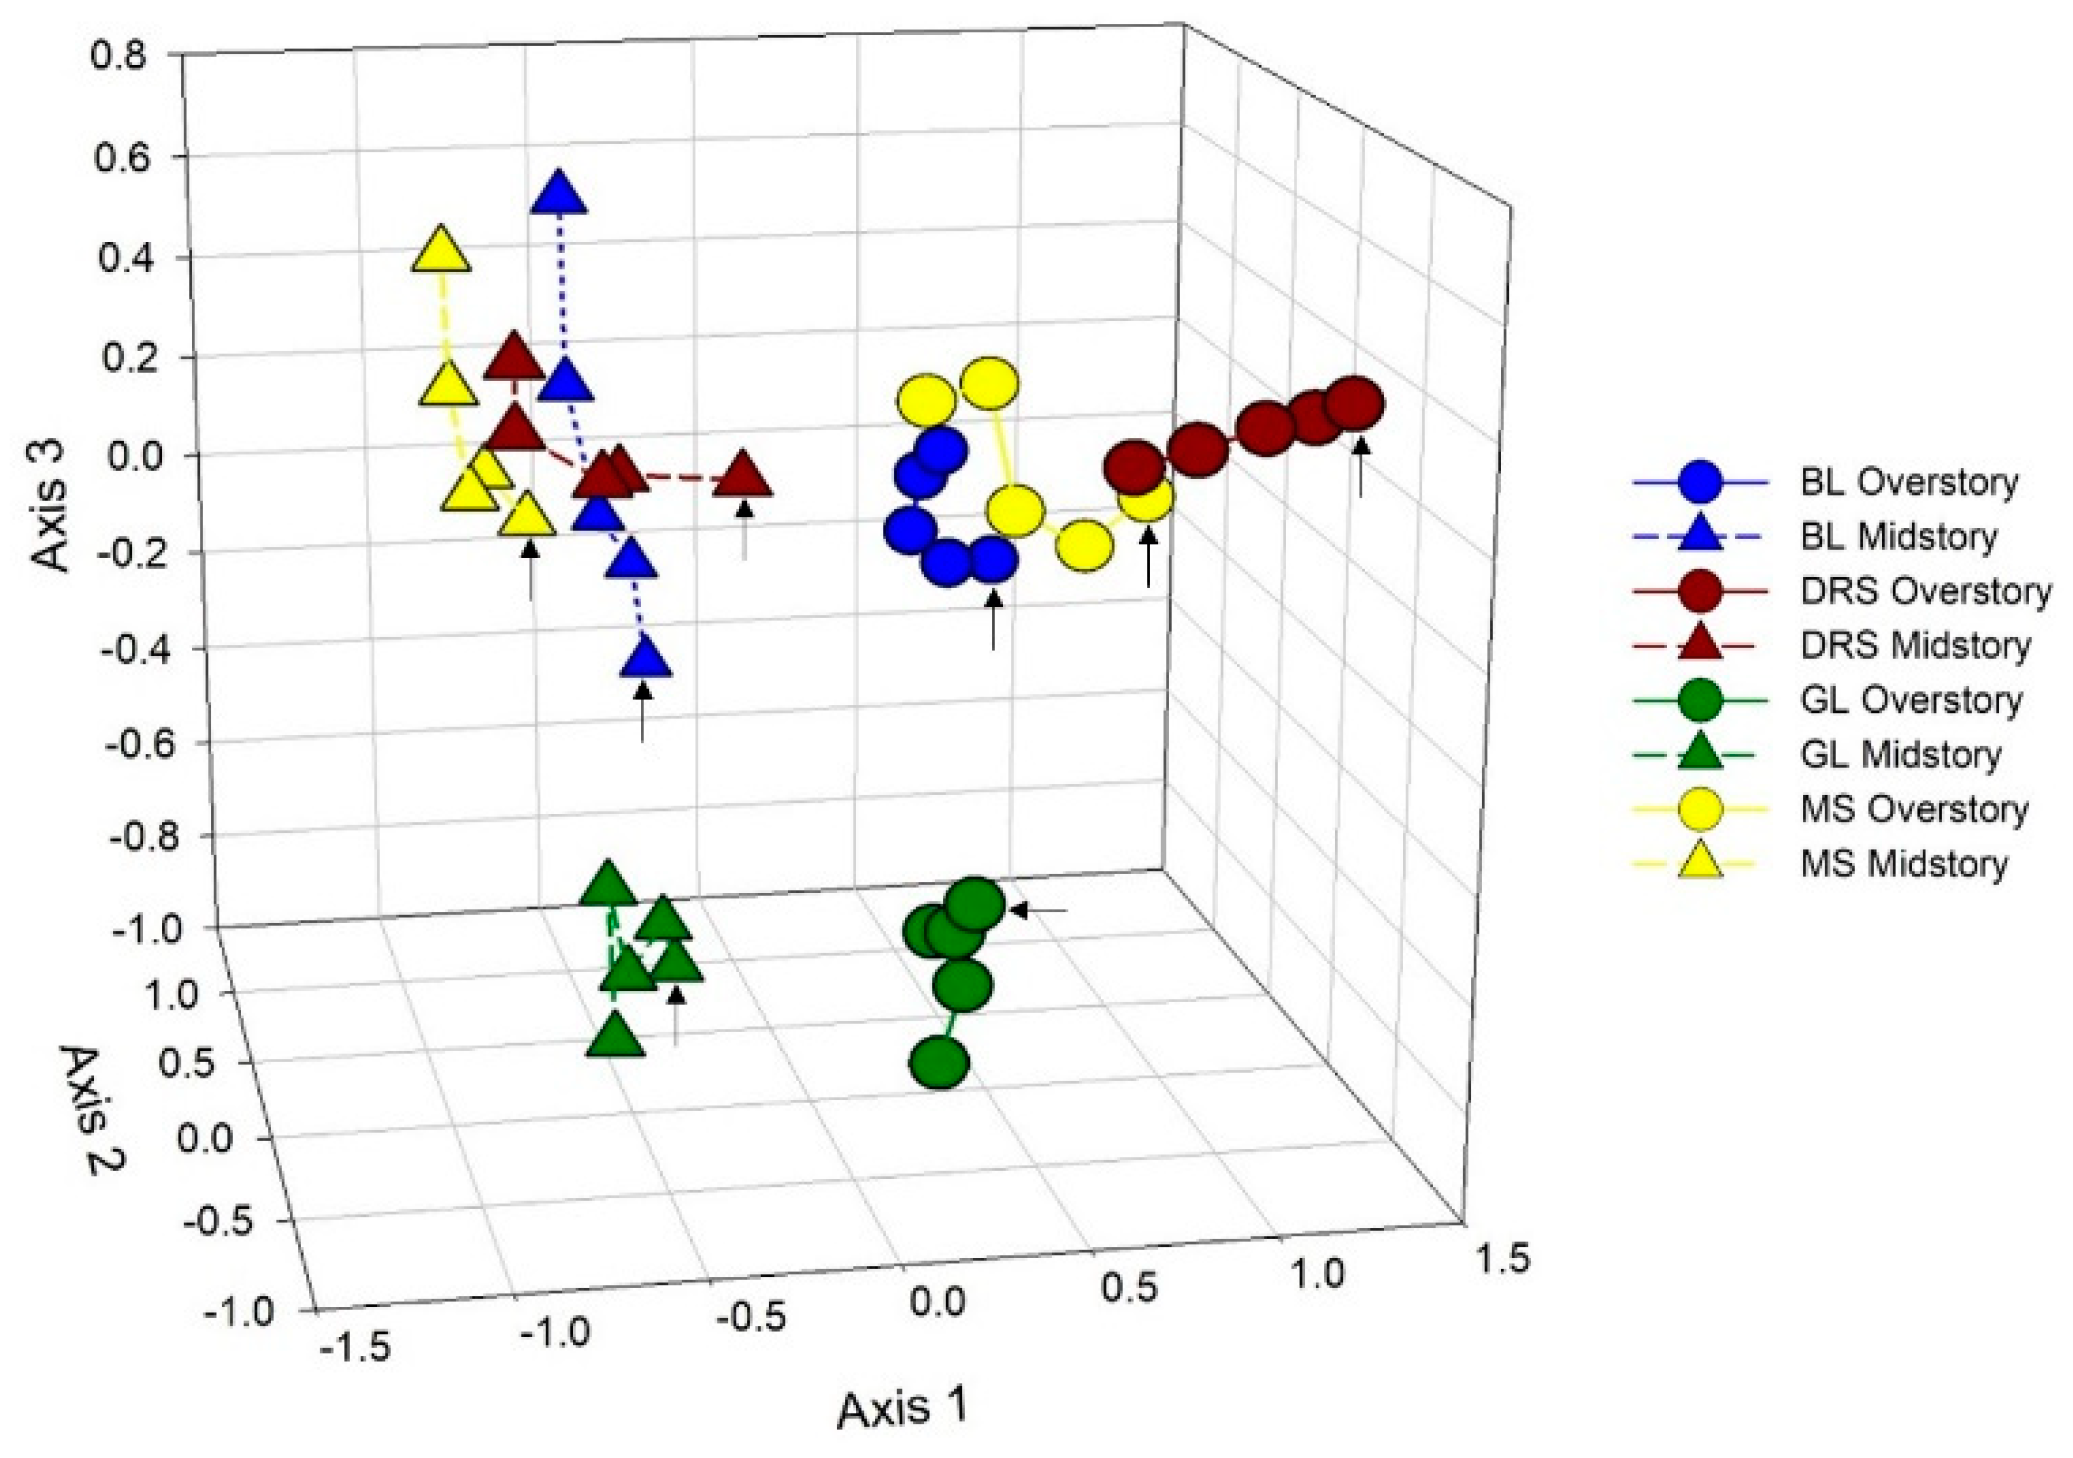
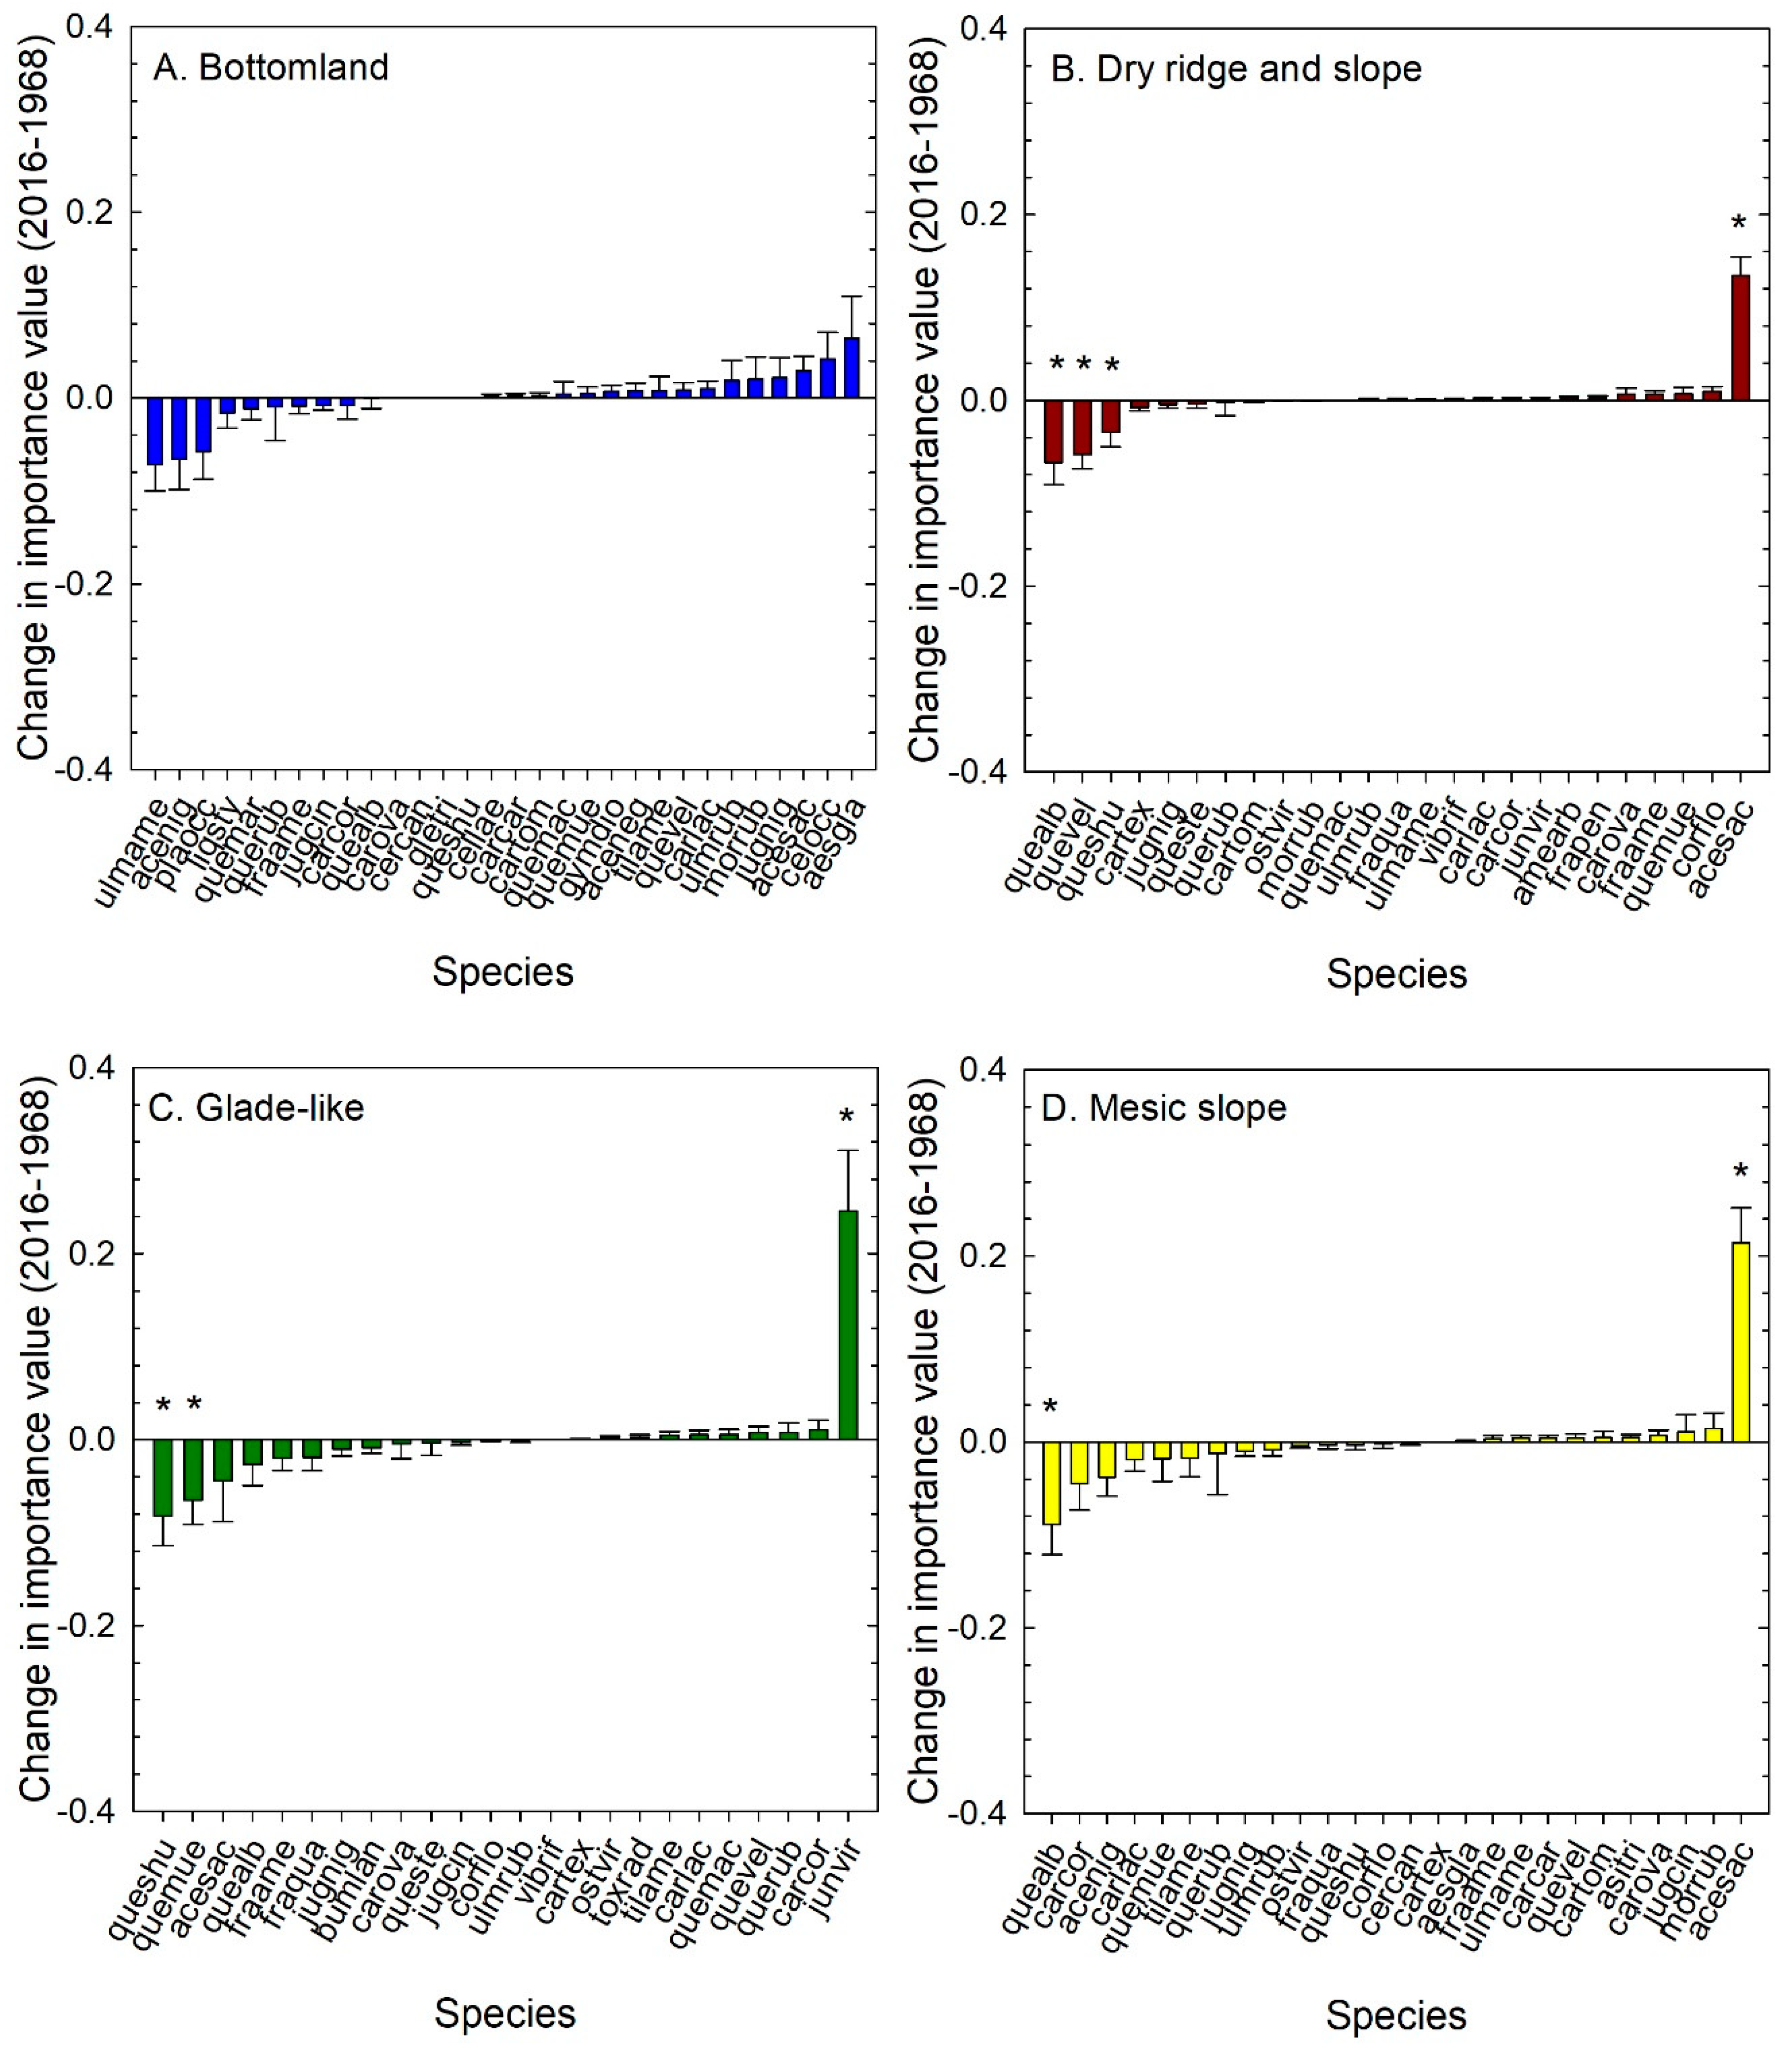
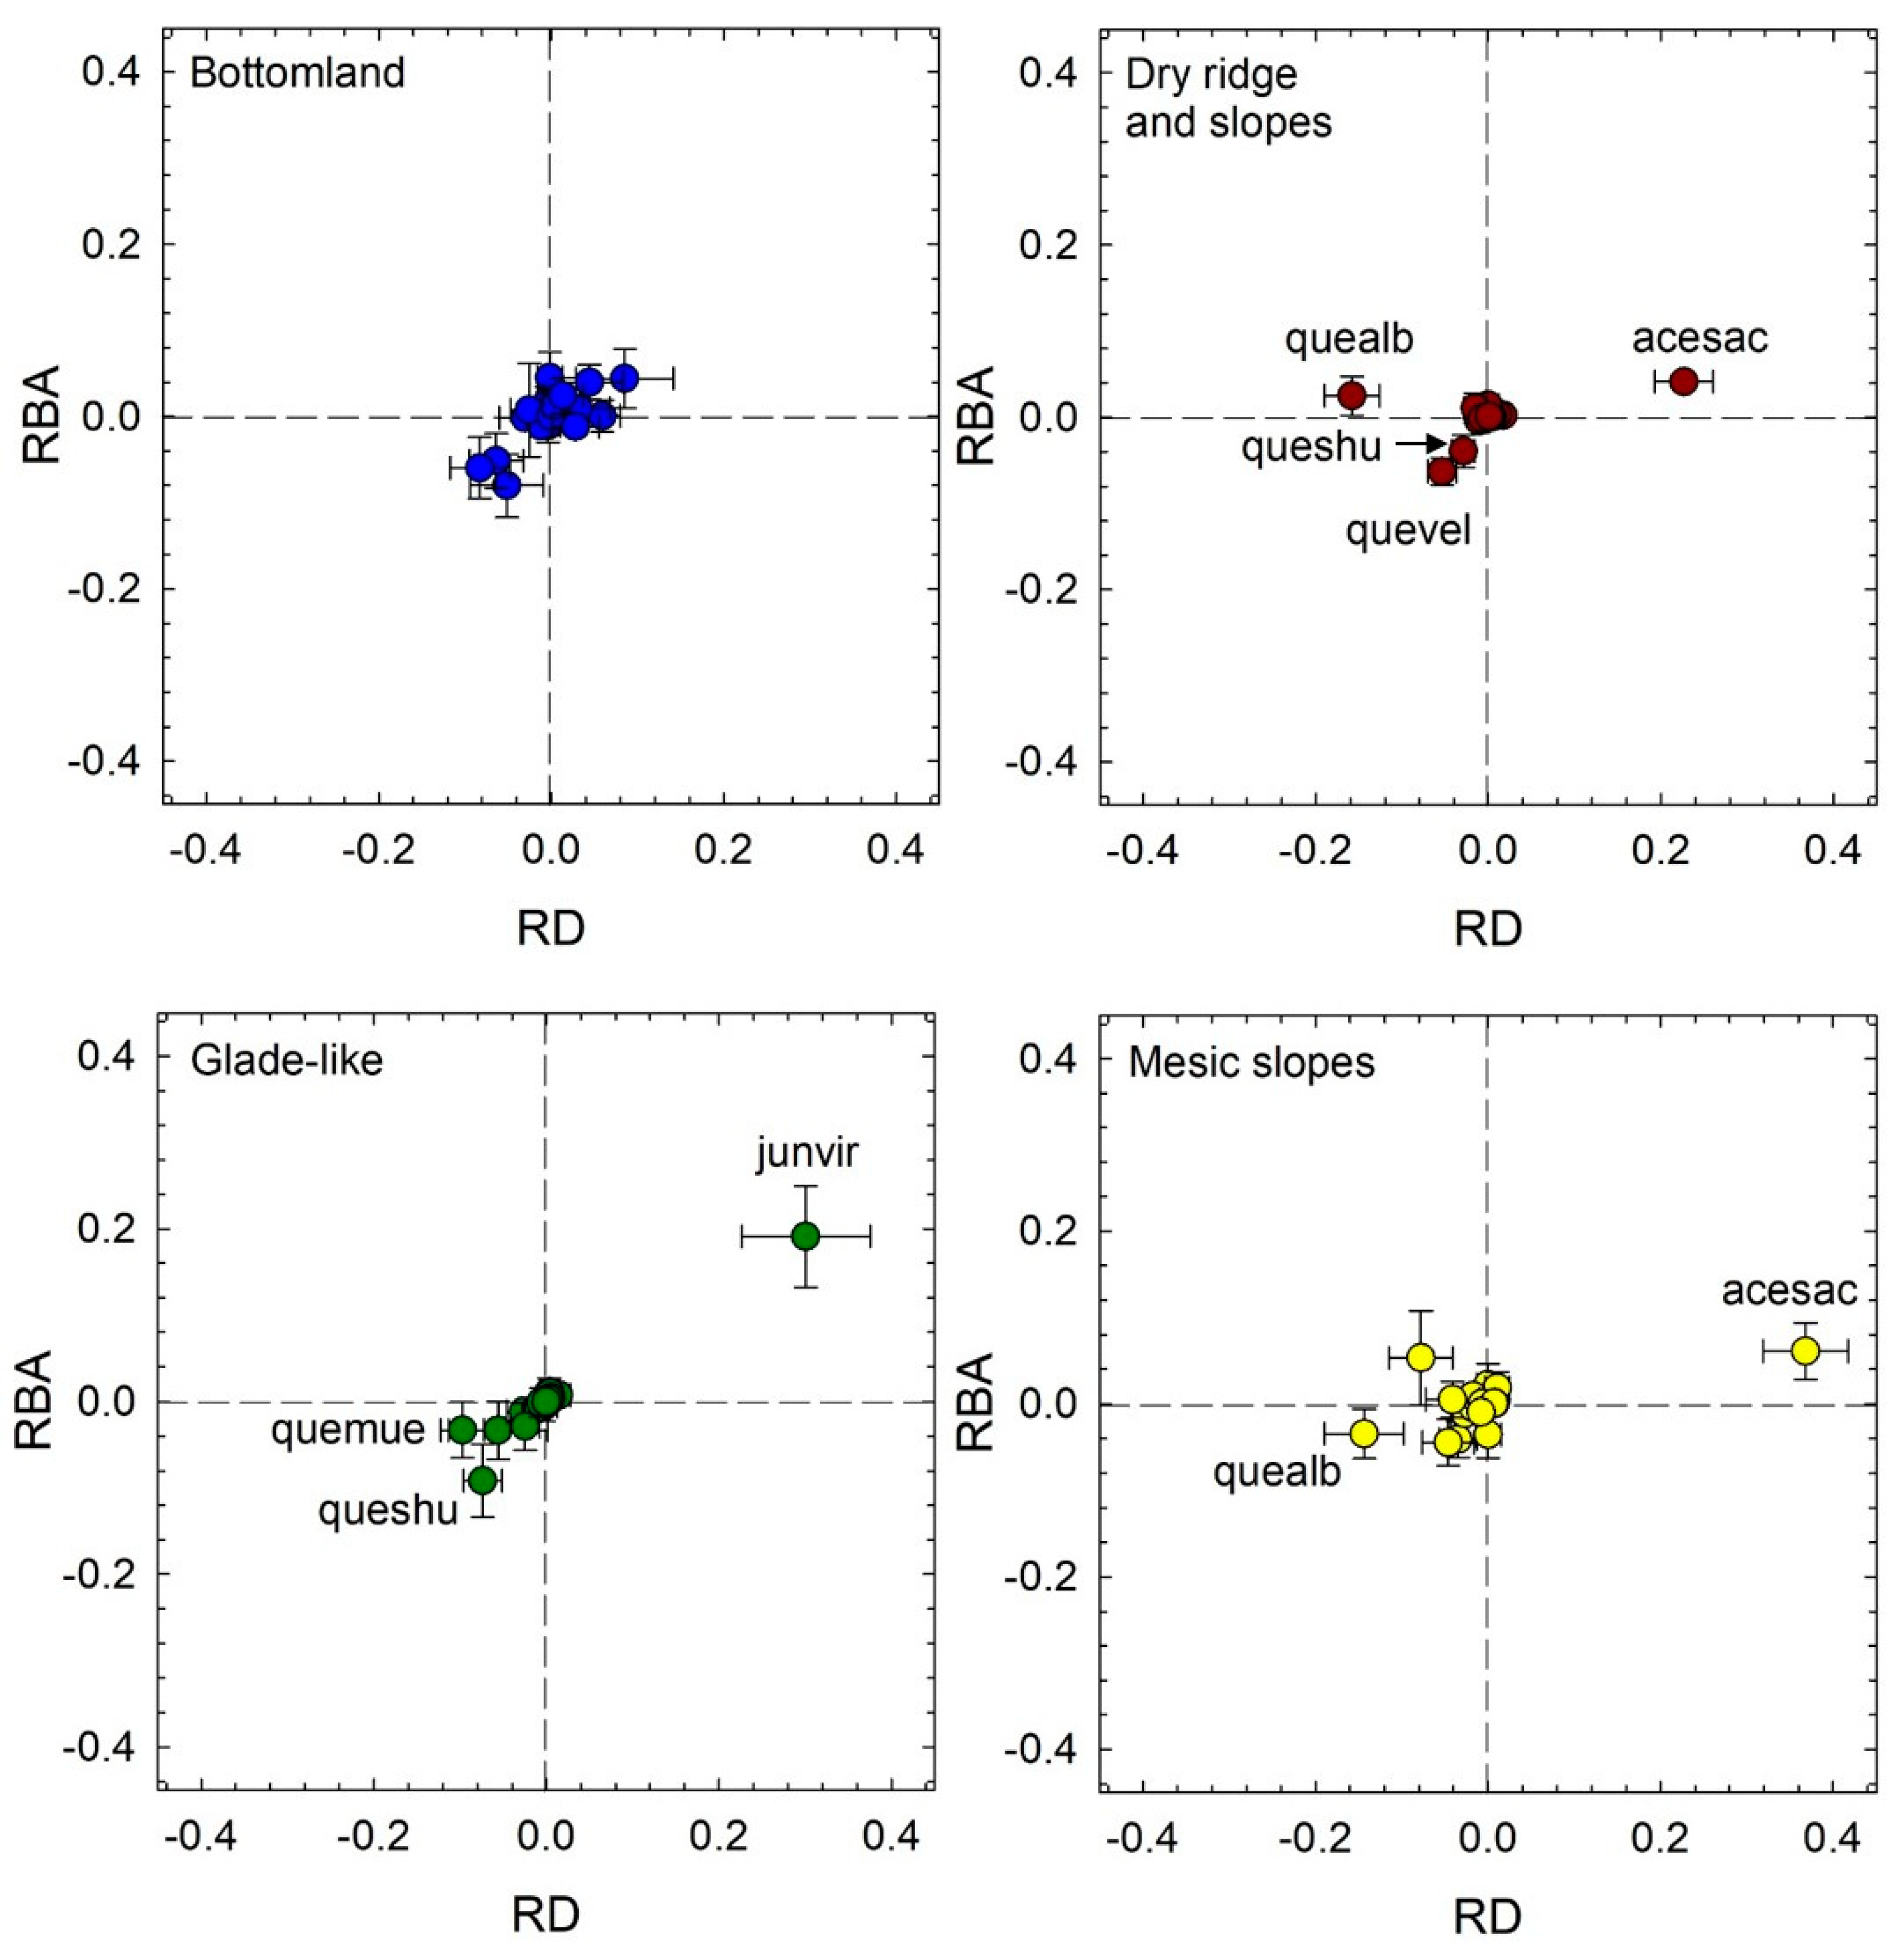
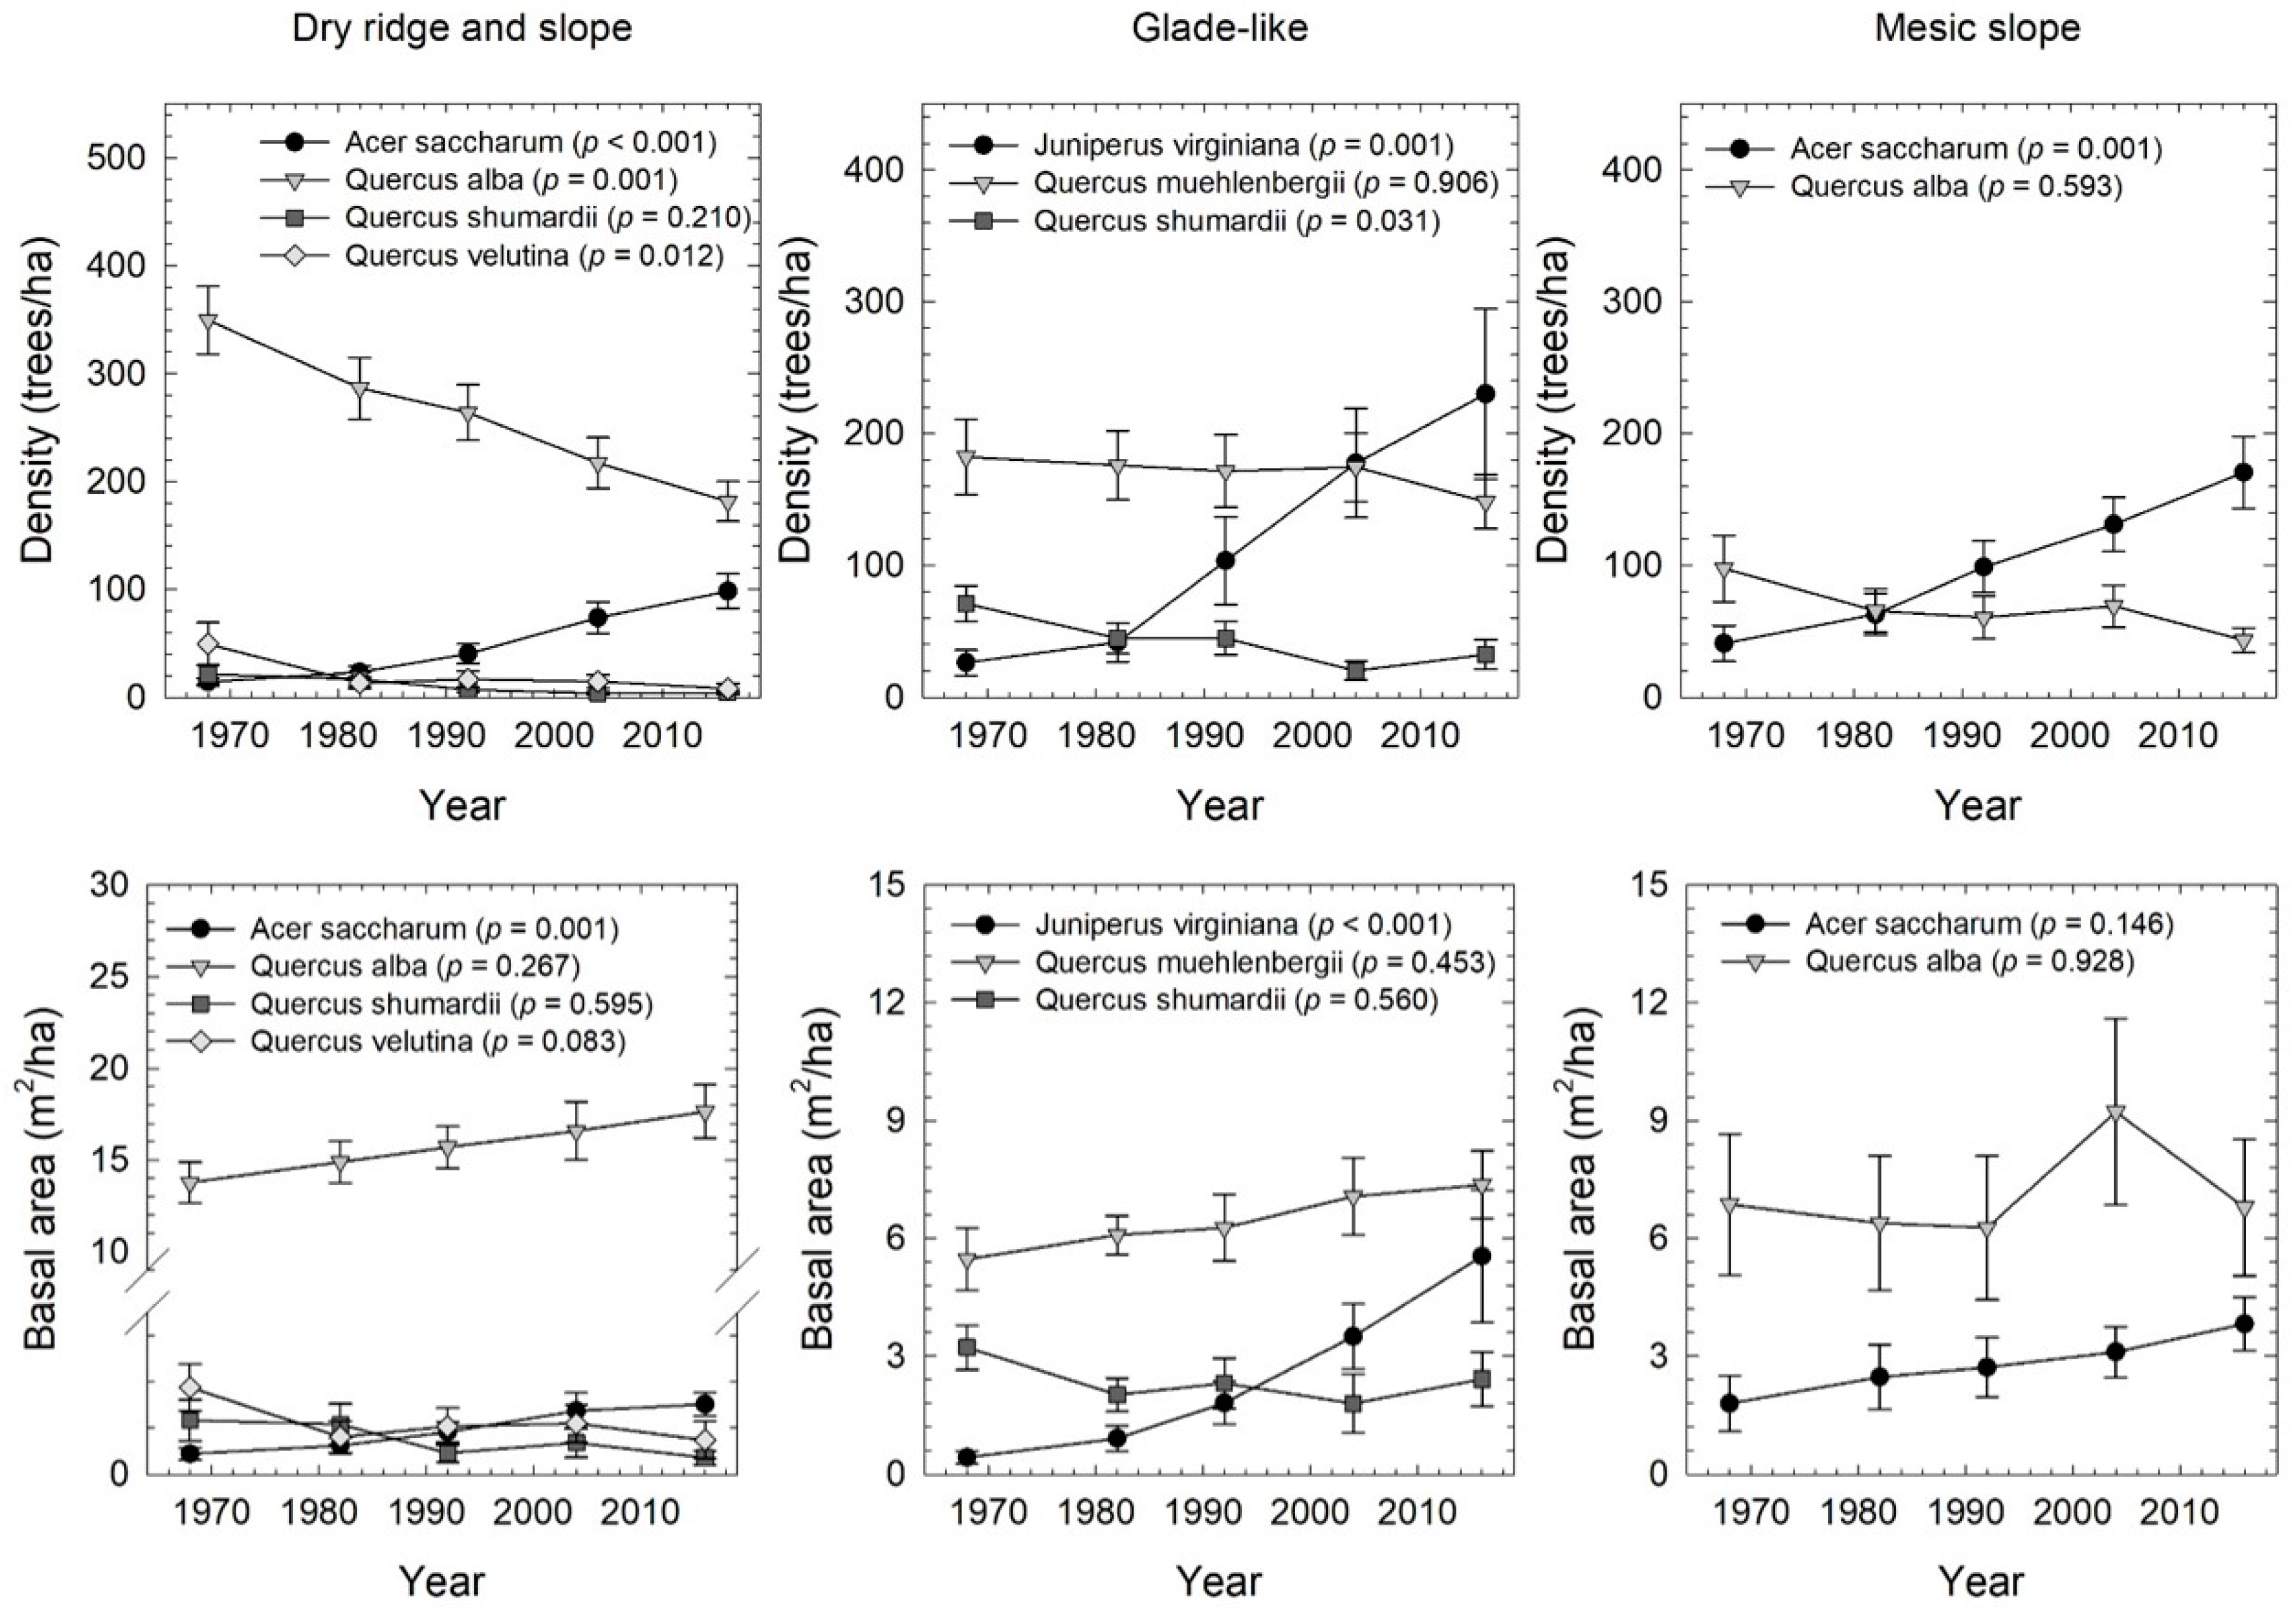
3.3. Tree Species Change through Time

In the relatively small number of plots of the bottomland forest type, no overstory tree species significantly changed in IV from 1968 to 2016 (Figure 6). Sugar maple significantly increased in IV in both dry ridge and slope (t = 6.53, p < 0.001) and mesic slope (t = 2.76, p = 0.022) forest types. In both cases, the change in RD was greater than the change in RBA (Figure 7), the latter of which did not significantly change through time in the mesic slope forest type (t = 1.85, p = 0.097), reflecting the accumulation of smaller sugar maple stems in both forest types. In the dry ridge and slope forest type, white oak (t = 2.73, p = 0.011), black oak (t = 3.79, p = 0.001), and Shumard oak (t = 2.17, p = 0.040) each significantly decreased in importance during the study period. In dry ridge and slope and mesic slope forest types, white oak decreased in RD (t = 5.03, p < 0.001; t = 3.13, p = 0.012, respectively) but not in RBA (t = 1.11, p = 0.278; t = 1.19, p = 0.264, respectively). Black oak and Shumard oak decreased in both RD and RBA in the dry ridge and slope forest type (Figure 7). In the glade-like forest type, eastern redcedar significantly increased in IV (t = 3.75, p = 0.007), with increases in both RD (t = 4.04, p = 0.005) and RBA (t = 3.25, p = 0.014). In this forest type, both chinkapin oak and Shumard oak decreased in IV (t = 2.47, p = 0.043; t = 2.61, p = 0.035, respectively), with the change for each species related to decreases in RD (t = 3.90, p = 0.006; t = 3.32, p =0.013, respectively) rather than RBA (t = 1.01, p = 0.344; t = 2.16, p = 0.068, respectively).
Changes in density and basal area were quantified through time for species with significant change in IV from 1968 through 2016. For the dry ridge and slope forest type, sugar maple significantly increased in both density and basal area (Figure 8). Both white oak and black oak significantly decreased in density, but their changes in basal area were not significant, despite a trend of increasing basal area for white oak. Shumard oak did not change in density or basal area through time. On mesic slopes, sugar maple significantly increased in density, by approximately four times, but did not significantly change in basal area. The changes in white oak density and basal area were not significant through time (Figure 8). For the glade-like forest type, eastern redcedar significantly increased in both density and basal area, predominantly after 1982. Shumard oak declined significantly in density, but chinkapin oak did not significantly change in density or basal area (Figure 8).
Among midstory trees, the density of sugar maples decreased through time in Classes 1 and 2 but increased through time in Classes 3 and 4 in the dry ridge and slope forest type (Table 3). A similar pattern was observed for the mesic slope forest type, in which sugar maple was sparse in the smallest size class by 2016 but abundant across the other size classes. Among the oaks, white oak was most abundant in 1968, across size classes, but nearly no oaks were present in the midstory by 2016. In the mesic slope forest type, white oak was nearly absent from all size classes through time. Similarly, in the glade-like forest type Shumard oak was not present in the midstory by 2004, although a few chinkapin oak were found in larger midstory size classes (Table 3). Eastern redcedar decreased in the smallest size class through time but was present in larger size classes.

4. Discussion

4.1. Patterns of Forest Change though Time

The BWREC study plots were previously categorized into four forest types based on tree species composition [27,30,31]. In the current analysis, the forest types clustered in ordination space, and the species correlations with the axes helped to explain the ordination of forest types. For example, Axis 1 was positively correlated with white oak and negatively correlated with sugar maple, contributing to several observed patterns, including: the separation of the dry ridge and slope plots from the mesic slope plots; the shift towards the negative on Axis 1 through time for the dry ridge and slope and the mesic slope plots; and the separation of the overstory from the midstory layers within each of the forest types. Axis 3 was negatively correlated with species associated with glade-like habitats, including eastern redcedar, blue ash (Fraxinus quadrangulata Michx.), and chinkapin oak, whereas Axis 2 was positively associated with bottomland species such as Ohio buckeye, boxelder (Acer negundo L.), and hackberry (Celtis occidentalis L.).
Over the past half century, the forests of the BWREC have generally displayed patterns of increasing stand basal area and shifting composition towards more mesic tree species within upland forest types. The patterns of forest change are largely representative of those reported throughout other portions of the state [21,22] and are related to past land use practices in the region. The BWREC property was predominantly private farmland that was consolidated and placed under public management in the late 1930s. Comprised mostly of second-growth forests that originated around the turn of the 20th century, subsistence practices that included open grazing and frequent burning likely occurred across the area prior to public acquisition [31]. The forests resulting from these practices have since developed with a lack of management and fire, allowing for increased stem densities through time [22]. By the time the plots were established in 1968, however, the data on overstory forest structure suggested that the stands had already formed a closed canopy, with existing trees continuing to increase in size and stands continuing to increase in basal area through time [35,36].
The earliest paper to report forest structure and composition based on these plots suggested a future shift in species dominance to sugar maple [27], yet change in overstory composition has been gradual. Generally, reductions in the importance value of oak species in the canopy were related more strongly to declining RD than RBA, indicating continued growth of residual trees in the canopy. This pattern was particularly apparent for white oak on the dry ridge and slope forest type, whereas the species in the red oak group that changed in importance value (black oak and Shumard oak) indicated reduction in both relative tree density and relative basal area. In general, species in the red oak group are shorter lived than those in the white oak group, with red oak mortality in the Missouri Ozark region associated with a complex of interacting factors that include harsh growing conditions, insects and pathogens, and drought events [37,38,39,40,41]. An extreme drought in 2012 preceded elevated levels of canopy tree mortality at BWREC, with 26.5% of canopy black oaks experiencing mortality in 2013 in portions of the property [42]. Thus, the rate of canopy composition change is partially dependent on the rate of attrition of existing trees, which favors the longer-lived white oak species on these sites.
Of the species that increased in importance value, sugar maple exhibited strong increases in relative density but comparatively low increases in relative basal area, with patterns showing the accumulation of sugar maple in smaller overstory diameter classes. Sugar maple abundance is low throughout much of Missouri and is generally restricted to sites with relatively greater pH and water holding capacity [43,44]. The distribution of sugar maple within the state is primarily concentrated in the Outer Ozark Border Subsection [32], with karst geology of limestone or dolomite and loess caps common in the uplands. Historical records based on witness trees from General Land Office surveyor notes indicated that sugar maple was present at low abundance (5.5%) in the county that contains BWREC at the time of settlement [45]. Results from the recent sampling show a substantial increase in the abundance of sugar maple over recent decades, with the greatest abundance on the more mesic sites. Additionally, sugar maple stems have increased in diameter through time; for example, in dry ridge and slope plots, sugar maples were primarily restricted to the midstory layer in 1968 but have become abundant through 20 cm DBH in 2016.
A recent publication described a wave of sugar maple saplings moving up diameter classes through time at BWREC, noting an absence of sugar maple seedlings and small saplings [30]. Although the current analysis did not include seedlings, the number of small size-class midstory sugar maple stems has continued to diminish on dry ridge and slope and mesic plots, almost to the point of disappearance. In addition to previous possible explanations for the absence of new sugar maple regeneration over the past few decades, such as herbivory or low light levels as forest density increases [30], recent studies have documented very high abundance of non-native earthworms (Oligochaeta) in the study area [46,47]. Earthworms strongly affect the distribution, condition, and abundance of organic matter throughout the forest floor and soil profile, with concomitant changes in soil nutrient dynamics, microbial communities, and substrate condition [48,49,50]. At BWREC, increased turnover rates and reduced storage of soil C have been attributed to the abundance of invasive earthworms [47]. Changes to the mineral soil and forest floor caused by earthworms in the forests of the northern and eastern United States have caused reductions in the diversity of understory plant communities and in the abundance of tree seedlings, including sugar maples [51,52,53,54]. Thus, earthworms are recognized as a potentially important driver of change in hardwood forests [55], although the role of earthworms on forest dynamics in Missouri is poorly understood.
Eastern redcedar was the species that exhibited the greatest increase in importance value during the study period, but it was abundant within only the glade-like forest type. Glade habitats are characterized by shallow soils with bedrock at or near the surface, generally with sparse tree presence and an abundance of herbaceous flora [56,57,58]. Commonly underlain with limestone or dolomite within Missouri, these habitats include calcicole species such as blue ash and chinkapin oak. In the absence of frequent fire, eastern redcedar encroaches on glade habitats [56,59]. Although present in 1968, eastern redcedar in the overstory of glade-like plots was restricted to low abundance in small diameter classes, and stand basal area was relatively low. Through time, eastern redcedar increased in both density and basal area. It is likely that the slow initial increase in basal area was attributable to the time required for eastern redcedar seedlings and saplings to grow into the overstory size class before contributing to basal area. Given the shade intolerance of eastern redcedar, the recent decline in small saplings may be due to competition as stand density has increased through time, although the potential effects of invasive earthworms on eastern redcedar regeneration are unknown.
The bottomland forest type had the greatest number of overstory species, with none showing significant change in importance value during the study period. The low sample size (six plots) and fewer clearly dominant species may have reduced the statistical ability to detect compositional change. In general, the bottomland plots showed increasing basal area and quadratic mean diameter through time, with canopy species such as American sycamore, sweetgum (Liquidambar styraciflua L.), and black walnut moving into larger diameter classes. Smaller diameter classes showed increases of shade tolerant species such as sugar maple and Ohio buckeye, with the midstory ordination moving along Axis 3 through time indicating an increase in pawpaw (Asimina triloba (L.) Dunal) as an understory species.

4.2. Management Implications

These long-term forest inventory plots were established to document change in the absence of forest management, and the patterns observed over the past half century show structural and compositional changes that have important implications to forest management objectives. The increase in shade tolerant species, particularly sugar maple, in small diameter classes suggests future shifts in species dominance, as has been reported in other forests of the eastern US [14,15,16]. However, early observations of sugar maple increase in these study plots [27] have not yet resulted in major changes in the composition of the dominant overstory. Located in the southwestern portion of the sugar maple range, it is not clear if environmental conditions, such as generally rocky soils and periodic extreme climatic events, will limit the development of sugar maple from becoming dominant canopy trees in this region [43]. Previous studies have cited episodic drought as limiting to sugar maple [60,61], and moisture availability is generally lower in this portion of the range than elsewhere [62]. Following a recent extreme drought at BWREC in 2012, however, sugar maple was reported to have low mortality relative to other tree species [63], although the mortality was disproportionately observed in large-diameter sugar maple trees [42]. Thus, the effects of interactions between site characteristics and climate on sugar maple development and future dominance in this region are not fully understood.
Regardless of the potential longevity of sugar maple as a canopy species, the lack of oak reproduction and recruitment creates challenges for sustaining oak forests in this region through time. Successful regeneration of upland oak forests usually relies upon the development of oak advance reproduction prior to canopy disturbance or the sprouting of established trees following disturbance, although the contribution of the latter decreases with tree size and age [11,64,65,66,67]. Although oak species vary with respect to shade tolerance, the development of oak advance reproduction is generally suppressed by high levels of stand density [68,69]. Thus, the accumulation of sugar maple in the midstory, along with continued gains in stand-level basal area through time, suggests that stand density may be limiting oak regeneration. Several studies have also shown that oak advance reproduction is more common on sites of relatively low quality, in part due to the competitiveness of oak on such sites [19,70,71]. Despite a greater relative abundance of canopy oak on the dry ridge and slope plots than the mesic slope plots, the absence of oak within the midstory was common to both site types at BWREC.
In many upland forests of Missouri, conditions that include relatively poor soils and few strong competitors provide silvicultural flexibility for regenerating oak; for example, successful oak regeneration has been achieved using regeneration harvests that create a range of residual densities, from single-tree selection to clearcutting, in the Missouri Ozarks [18,72]. In the BWREC study region, however, increasing the abundance of oak advance reproduction likely requires deliberate forest management. Silvicultural practices that control competing regeneration and create favorable light environments can encourage the accumulation of oak advance reproduction [11,64,69,73]. Considerable research has explored the role of fire in the development and management of oak ecosystems [13,14,74], with prescribed burning used to reduce competitors and favor oak advance reproduction [75]. Alternative approaches may use herbicides to reduce the abundance of competitors, particularly with stem injection techniques that target the accumulation of non-desirable midstory species [76,77,78]. Even with silvicultural intervention, the development of oak advance reproduction can be a lengthy process [64]. As the forests of the region continue to age (and potentially experience additional episodic climate extremes), canopy attrition will reduce the dominance of oak if there is not compensatory development of an oak regeneration component.
Throughout Missouri, glade habitats are of conservation concern due largely to the loss of rare or endemic species associated with the encroachment of eastern redcedar following fire exclusion (e.g., [79,80,81]). Eastern redcedar can aggressively occupy open sites [82], as demonstrated at BWREC by the sustained increase in basal area of this species through time in glade-like plots. Reintroducing prescribed burning is considered critical for glade restoration and has been shown to increase fauna associated with glade habitats [83]. However, once eastern redcedar has become established, prescribed burning alone may be ineffective at reducing its abundance. For example, prescribed burning over a 30-year period stopped further encroachment of eastern redcedar but did not restore open conditions in glades of southern Missouri [84]. Thus, restoration of glade habitats is often associated with mechanical removal of eastern redcedar in initial stages, with repeated prescribed burning to maintain open conditions [58,85]. At BWREC, the glade-like forest type was classified primarily by the tree species associates, as well as shallow soil and exposed limestone near the surface. Future research is warranted to determine if ground flora and the faunal communities are indicative of glade habitats in considering the restoration potential of these sites.

5. Conclusions

Long-term forest monitoring provides valuable information about ecological succession and informs management decision-making. Similar to many other forest ecosystems of the central and eastern US, upland forests of mid-Missouri have increased densities over the past half century, with evidence of compositional shifts toward maple dominance. Although large overstory trees are currently comprised primarily of oak species, the lack of oak as advance reproduction or midstory stems suggests the potential for future problems with canopy replacement of oak following eventual overstory mortality. Species of the red oak group, which are generally shorter-lived than species of the white oak group in this region, are showing greater evidence of canopy attrition in the upland forests. In the glade-like forest type, the encroachment of eastern redcedar has resulted in increased basal area and stem densities through time. Results suggest that forest management may be necessary to reach objectives of maintaining oak dominance on upland sites or restoring glade habitats. Further, the lack of small saplings in the midstory supports previous documentation of an apparently recent sugar maple regeneration failure, warranting additional research on the effects of non-native earthworms on forest dynamics in this region.

Supplementary Materials

The following are available online at https://www.mdpi.com/1999-4907/9/10/633/s1, Table S1: Species codes, Latin names, and common names for overstory species.

Author Contributions

Both authors contributed to the conceptualization, interpretation, and writing of the manuscript. Data collection and management were completed by B.O.K. (recent sampling) and S.G.P. (sampling in 1982 through 2004). Major contributions towards data analyses were made by B.O.K. with minor contributions by S.G.P.

Funding

This project was supported by the National Institute of Food and Agriculture, U.S. Department of Agriculture, McIntire Stennis project 233870.

Acknowledgments

The installation and maintenance of this project was supported by many individuals over the past 50 years, including John Rochow, Tim Nigh, John Mehuys, Julia Rhoads, Joan Smith, Kevin Hosman, Angela George, Bennett Wickenhauser, and Matthew Easton.

Conflicts of Interest

The authors declare no conflict of interest.

References

  1. Finegan, B. Forest succession. Nature 1984, 312, 109. [Google Scholar] [CrossRef]
  2. Attiwill, P.M. The disturbance of forest ecosystems: The ecological basis for conservative management. For. Ecol. Manag. 1994, 63, 247–300. [Google Scholar] [CrossRef]
  3. Odum, E.P. The strategy of ecosystem development. Science 1969, 164, 262–270. [Google Scholar] [CrossRef] [PubMed]
  4. Foster, D.; Swanson, F.; Aber, J.; Burke, I.; Brokaw, N.; Tilman, D.; Knapp, A. The importance of land-use legacies to ecology and conservation. BioScience 2003, 53, 77–88. [Google Scholar] [CrossRef]
  5. Dupouey, J.L.; Dambrine, E.; Laffite, J.D.; Moares, C. Irreversible impact of past land use on forest soils and biodiversity. Ecology 2002, 83, 2978–2984. [Google Scholar] [CrossRef]
  6. Christensen, N.L. An historical perspective on forest succession and its relevance to ecosystem restoration and conservation practice in North America. For. Ecol. Manag. 2014, 330, 312–322. [Google Scholar] [CrossRef]
  7. Allen, C.D.; Breshears, D.D.; McDowell, N.G. On underestimation of global vulnerability to tree mortality and forest die-off from hotter drought in the Anthropocene. Ecosphere 2015, 6, 1–55. [Google Scholar] [CrossRef]
  8. Millar, C.I.; Stephenson, N.L.; Stephens, S.L. Climate change and forests of the future: Managing in the face of uncertainty. Ecol. Appl. 2007, 17, 2145–2151. [Google Scholar] [CrossRef] [PubMed]
  9. Braun, E.L. Deciduous Forests of Eastern North America; Hafner Publishing Company: New York, NY, USA, 1950; p. 596. [Google Scholar]
  10. Fralish, J.S. The Central Hardwood Forest: Its boundaries and physiographic provinces. In Proceedings of the 13th Central Hardwood Forest Conference, Urbana-Champaign, IL, USA, 1–3 April 2002; Van Sambeek, J.W., Dawson, J.O., Ponder, F., Jr., Loewenstein, E.F., Fralish, J.S., Eds.; General Technical Report NC-234; U.S. Department of Agriculture, Forest Service, North Central Research Station: St. Paul, MN, USA, 2003; pp. 1–20. [Google Scholar]
  11. Johnson, P.S.; Shifley, S.R.; Rogers, R. The Ecology and Silviculture of Oaks, 2nd ed.; CAB International: New York, NY, USA, 2009; p. 580. [Google Scholar]
  12. Hanberry, B.B.; Nowacki, G.J. Oaks were the historical foundation genus of the east-central United States. Quat. Sci. Rev. 2016, 145, 94–103. [Google Scholar] [CrossRef]
  13. Abrams, M.D. Fire and the development of oak forests. BioScience 1992, 42, 346–353. [Google Scholar] [CrossRef]
  14. McEwan, R.W.; Dyer, J.M.; Pederson, N. Multiple interacting ecosystem drivers: Toward an encompassing hypothesis of oak forest dynamics across eastern North America. Ecography 2011, 34, 244–256. [Google Scholar] [CrossRef]
  15. Nowacki, G.J.; Abrams, M.D. The demise of fire and “mesophication” of forests in the eastern United States. BioScience 2008, 58, 123–138. [Google Scholar] [CrossRef]
  16. Fei, S.; Kong, N.; Steiner, K.C.; Moser, W.K.; Steiner, E.B. Change in oak abundance in the eastern United States from 1980 to 2008. For. Ecol. Manag. 2011, 262, 1370–1377. [Google Scholar] [CrossRef]
  17. Shifley, S.R.; Moser, W.K.; Nowak, D.J.; Miles, P.D.; Butler, B.J.; Aguilar, F.X.; DeSantis, R.D.; Greenfield, E.J. Five anthropogenic factors that will radically alter forest conditions and management needs in the northern United States. For. Sci. 2014, 60, 914–925. [Google Scholar] [CrossRef]
  18. Kabrick, J.M.; Zenner, E.K.; Dey, D.C.; Gwaze, D.; Jensen, R.G. Using ecological land types to examine landscape-scale oak regeneration dynamics. For. Ecol. Manag. 2008, 255, 3051–3062. [Google Scholar] [CrossRef]
  19. Kabrick, J.M.; Villwock, J.L.; Dey, D.C.; Keyser, T.L.; Larsen, D.R. Modeling and mapping oak advance reproduction density using soil and site variables. For. Sci. 2014, 60, 1107–1117. [Google Scholar] [CrossRef]
  20. Olson, M.G.; Knapp, B.O.; Kabrick, J.M. Dynamics of a temperate deciduous forest under landscape-scale management: Implications for adaptability to climate change. For. Ecol. Manag. 2017, 387, 73–85. [Google Scholar] [CrossRef]
  21. Hanberry, B.B.; Dey, D.C.; He, H.S. Regime shifts and weakened environmental gradients in open oak and pine ecosystems. PLoS ONE 2012, 7, e41337. [Google Scholar] [CrossRef] [PubMed]
  22. Hanberry, B.B.; Kabrick, J.M.; He, H.S. Densification and state transition across the Missouri Ozarks landscape. Ecosystems 2014, 17, 66–81. [Google Scholar] [CrossRef]
  23. Guyette, R.P.; Muzika, R.M.; Dey, D.C. Dynamics of an anthropogenic fire regime. Ecosystems 2002, 5, 472–486. [Google Scholar]
  24. Batek, M.J.; Rebertus, A.J.; Schroeder, W.A.; Haithcoat, T.L.; Compas, E.; Guyette, R.P. Reconstruction of early nineteenth-century vegetation and fire regimes in the Missouri Ozarks. J. Biogeogr. 1999, 26, 397–412. [Google Scholar] [CrossRef]
  25. Nelson, P.W. Fire-adapted communities natural communities of the ozark highlands at the time of european settlement and now. In Proceedings of the 4th Fire in Eastern Oak Forests Conference, Springfield, MO, USA, 17–19 May 2011; Dey, D.C., Stambaugh, M.C., Clark, S.L., Schweitzer, C.J., Eds.; General Technical Report NRS-P-102; U.S. Department of Agriculture, Forest Service, Northern Research Station: Newtown Square, PA, USA, 2012; pp. 92–102. [Google Scholar]
  26. Ware, S. Rock outcrop plant communities (glades) in the Ozarks: A synthesis. Southwest. Nat. 2002, 47, 585–597. [Google Scholar] [CrossRef]
  27. Rochow, J.J. A vegetational description of a mid-Missouri forest using gradient analysis techniques. Am. Midl. Nat. 1972, 87, 377–396. [Google Scholar] [CrossRef]
  28. Rochow, J.J. Mineral nutrient pool and cycling in a Missouri forest. J. Ecol. 1975, 63, 985–994. [Google Scholar] [CrossRef]
  29. Rochow, J.J. Litter fall relations in a Missouri forest. Oikos 1974, 25, 80–85. [Google Scholar] [CrossRef]
  30. Belden, A.C.; Pallardy, S.G. Successional trends and apparent Acer saccharum regeneration failure in an oak-hickory forest in central Missouri, USA. Plant Ecol. 2009, 204, 305–322. [Google Scholar] [CrossRef]
  31. Pallardy, S.G.; Nigh, T.A.; Garrett, H.E. Changes in forest composition in central Missouri: 1968–1982. Am. Midl. Nat. 1988, 120, 380–390. [Google Scholar] [CrossRef]
  32. Nigh, T.A.; Schroeder, W.A. Atlas of Missouri Ecoregions; Missouri Department of Conservation: Jefferson City, MO, USA, 2002; p. 212. [Google Scholar]
  33. Critchfield, H.J. General Climatology; Prentice-Hall: Englewood Cliffs, NJ, USA, 1966; p. 446. [Google Scholar]
  34. McCune, B.; Grace, J.B.; Urban, D.L. Analysis of Ecological Communities; MjM Software Design: Gleneden Beach, OR, USA, 2002. [Google Scholar]
  35. Peet, R.K.; Christensen, N.L. Competition and tree death. BioScience 1987, 37, 586–595. [Google Scholar] [CrossRef]
  36. Oliver, C.D. Forest development in North America following major disturbances. For. Ecol. Manag. 1980, 3, 153–168. [Google Scholar] [CrossRef]
  37. Kabrick, J.M.; Dey, D.C.; Jensen, R.G.; Wallendorf, M. The role of environmental factors in oak decline and mortality in the Ozark Highlands. For. Ecol. Manag. 2008, 255, 1409–1417. [Google Scholar] [CrossRef] [Green Version]
  38. Shifley, S.R.; Fan, Z.; Kabrick, J.M.; Jensen, R.G. Oak mortality risk factors and mortality estimation. For. Ecol. Manag. 2006, 229, 16–26. [Google Scholar] [CrossRef] [Green Version]
  39. Fan, Z.; Fan, X.; Crosby, M.K.; Moser, W.K.; He, H.; Spetich, M.A.; Shifley, S.R. Spatio-temporal trends of oak decline and mortality under periodic regional drought in the Ozark Highlands of Arkansas and Missouri. Forests 2012, 3, 614–631. [Google Scholar] [CrossRef]
  40. Voelker, S.L.; Muzika, R.-M.; Guyette, R.P. Individual tree and stand level influences on the growth, vigor, and decline of red oaks in the Ozarks. For. Sci. 2008, 54, 8–20. [Google Scholar]
  41. Jenkins, M.A.; Pallardy, S.G. The influence of drought on red oak group species growth and mortality in the Missouri Ozarks. Can. J. For. Res. 1995, 25, 1119–1127. [Google Scholar] [CrossRef]
  42. Wood, J.D.; Knapp, B.O.; Muzika, R.M.; Stambaugh, M.C.; Gu, L. The importance of drought–pathogen interactions in driving oak mortality events in the Ozark Border region. Environ. Res. Lett. 2018, 13, 015004. [Google Scholar] [CrossRef]
  43. Nigh, T.A.; Pallardy, S.G.; Garrett, H.E. Sugar maple-environment relationships in the River Hills and central Ozark Mountains of Missouri. Am. Midl. Nat. 1985, 114, 235–251. [Google Scholar] [CrossRef]
  44. Stevens, J.H. Site Quality Factors Affecting Acer saccharum, Quercus rubra, and Quercus alba Abundance and Height Growth Rates in Young Even-Aged Stands Located in Central Missouri. Master’s Thesis, University of Missouri, Columbia, MO, USA, 2013. [Google Scholar]
  45. Howell, D.L.; Kucera, C.L. Composition of pre-settlement forests in three counties of Missouri. Bull. Torrey Bot. Club 1956, 83, 207–217. [Google Scholar] [CrossRef]
  46. Wenk, E.S.; Callaham, M.A.; O’Brien, J.J.; Hanson, P.J. Soil macroinvertebrate communities across a productivity gradient in deciduous forests of eastern North America. Northeast. Nat. 2016, 23, 25–44. [Google Scholar] [CrossRef]
  47. McFarlane, K.J.; Torn, M.S.; Hanson, P.J.; Porras, R.C.; Swanston, C.W.; Callaham, M.A.; Guilderson, T.P. Comparison of soil organic matter dynamics at five temperate deciduous forests with physical fractionation and radiocarbon measurements. Biogeochemistry 2013, 112, 457–476. [Google Scholar] [CrossRef]
  48. Groffman, P.M.; Bohlen, P.J.; Fisk, M.C.; Fahey, T.J. Exotic earthworm invasion and microbial biomass in temperate forest soils. Ecosystems 2004, 7, 45–54. [Google Scholar] [CrossRef]
  49. Burtelow, A.E.; Bohlen, P.J.; Groffman, P.M. Influence of exotic earthworm invasion on soil organic matter, microbial biomass and denitrification potential in forest soils of the northeastern United States. Appl. Soil Ecol. 1998, 9, 197–202. [Google Scholar] [CrossRef]
  50. Suárez, E.R.; Fahey, T.J.; Yavitt, J.B.; Groffman, P.M.; Bohlen, P.J. Patterns of litter disappearance in a northern hardwood forest invaded by exotic earthworms. Ecol. Appl. 2006, 16, 154–165. [Google Scholar] [CrossRef] [PubMed]
  51. Hale, C.M.; Frelich, L.E.; Reich, P.B. Changes in hardwood forest understory plant communities in response to European earthworm invasions. Ecology 2006, 87, 1637–1649. [Google Scholar] [CrossRef]
  52. Bohlen, P.J.; Scheu, S.; Hale, C.M.; McLean, M.A.; Migge, S.; Groffman, P.M.; Parkinson, D. Non-native invasive earthworms as agents of change in northern temperate forests. Front. Ecol. Environ. 2004, 2, 427–435. [Google Scholar] [CrossRef]
  53. Corio, K.; Wolf, A.; Draney, M.; Fewless, G. Exotic earthworms of great lakes forests: A search for indicator plant species in maple forests. For. Ecol. Manag. 2009, 258, 1059–1066. [Google Scholar] [CrossRef]
  54. Holdsworth, A.R.; Frelich, L.E.; Reich, P.B. Effects of earthworm invasion on plant species richness in northern hardwood forests. Conserv. Biol. 2007, 21, 997–1008. [Google Scholar] [CrossRef] [PubMed]
  55. Webster, C.R.; Dickinson, Y.L.; Burton, J.I.; Frelich, L.E.; Jenkins, M.A.; Kern, C.C.; Raymond, P.; Saunders, M.R.; Walters, M.B.; Willis, J.L. Promoting and maintaining diversity in contemporary hardwood forests: Confronting contemporary drivers of change and the loss of ecological memory. For. Ecol. Manag. 2018, 421, 98–108. [Google Scholar] [CrossRef]
  56. Nelson, P.W. The Terrestrial Natural Communities of Missouri; Missouri Natural Areas Committee: Jefferson City, MO, USA, 2005; p. 550. [Google Scholar]
  57. Kucera, C.L.; Martin, S.C. Vegetation and soil relationships in the glade region of the southwestern Missouri Ozarks. Ecology 1957, 38, 285–291. [Google Scholar] [CrossRef]
  58. Van Zandt, P.A.; Collins, E.; Losos, J.B.; Chase, J.M. Implications of food web interactions for restoration of Missouri Ozark glade habitats. Restor. Ecol. 2005, 13, 312–317. [Google Scholar] [CrossRef]
  59. Baskin, J.M.; Baskin, C.C. Vegetation of limestone and dolomite glades in the Ozarks and Midwest regions of the United States. Ann. Mo. Bot. Gard. 2000, 87, 286–294. [Google Scholar] [CrossRef]
  60. Kolb, T.E.; McCormick, L.H. Etiology of sugar maple decline in four Pennsylvania stands. Can. J. For. Res. 1993, 23, 2395–2402. [Google Scholar] [CrossRef]
  61. Horsley, S.B.; Long, R.P.; Bailey, S.W.; Hallett, R.A.; Wargo, P.M. Health of eastern North American sugar maple forests and factors affecting decline. North. J. Appl. For. 2002, 19, 34–44. [Google Scholar]
  62. Putnam, R.C.; Reich, P.B. Climate and competition affect growth and survival of transplanted sugar maple seedlings along a 1700-km gradient. Ecol. Monogr. 2017, 87, 130–157. [Google Scholar] [CrossRef] [Green Version]
  63. Gu, L.; Pallardy, S.G.; Hosman, K.P.; Sun, Y. Drought-influenced mortality of tree species with different predawn leaf water dynamics in a decade-long study of a central US forest. Biogeosciences 2015, 12, 2831–2845. [Google Scholar] [CrossRef]
  64. Larsen, D.R.; Johnson, P.S. Linking the ecology of natural oak regeneration to silviculture. For. Ecol. Manag. 1998, 106, 1–7. [Google Scholar] [CrossRef]
  65. Morrissey, R.C.; Jacobs, D.F.; Seifert, J.R.; Fischer, B.C.; Kershaw, J.A. Competitive success of natural oak regeneration in clearcuts during the stem exclusion stage. Can. J. For. Res. 2008, 38, 1419–1430. [Google Scholar] [CrossRef]
  66. Dey, D.C.; Johnson, P.S.; Garrett, H.E. Modeling the regeneration of oak stands in the Missouri Ozark Highlands. Can. J. For. Res. 1996, 26, 573–583. [Google Scholar] [CrossRef]
  67. Sander, I.L.; Johnson, P.S.; Rogers, R. Evaluating Oak Advance Reproduction in the Missouri Ozarks; General Technical Report NC-251; U.S. Department of Agriculture, Forest Service, North Central Experiment Station: St. Paul, MN, USA, 1984; p. 16.
  68. Larsen, D.R.; Metzger, M.A.; Johnson, P.S. Oak regeneration and overstory density in the Missouri Ozarks. Can. J. For. Res. 1997, 27, 869–875. [Google Scholar] [CrossRef]
  69. Loftis, D.L. A shelterwood method for regenerating red oak in the Southern Appalachians. For. Sci. 1990, 36, 917–929. [Google Scholar]
  70. Iverson, L.R.; Peters, M.P.; Bartig, J.L.; Rebbeck, J.; Hutchinson, T.F.; Matthews, S.N.; Stout, S. Spatial modeling and inventories for prioritizing investment into oak-hickory restoration. For. Ecol. Manag. 2018, 424, 355–366. [Google Scholar] [CrossRef]
  71. Fei, S.; Steiner, K.C. Relationships between advance oak regeneration and biotic and abiotic factors. Tree Physiol. 2008, 28, 1111–1119. [Google Scholar] [CrossRef] [PubMed] [Green Version]
  72. Loewenstein, E.F.; Johnson, P.S.; Garrett, H.E. Age and diameter structure of a managed uneven-aged oak forest. Can. J. For. Res. 2000, 30, 1060–1070. [Google Scholar] [CrossRef]
  73. Brose, P.H.; Van Lear, D.H.; Keyser, P.D. A shelterwood—Burn technique for regenerating productive upland oak sites in the Piedmont region. South. J. Appl. For. 1999, 23, 158–163. [Google Scholar]
  74. Arthur, M.A.; Alexander, H.D.; Dey, D.C.; Schweitzer, C.J.; Loftis, D.L. Refining the oak-fire hypothesis for management of oak-dominated forests of the eastern United States. J. For. 2012, 110, 257–266. [Google Scholar] [CrossRef]
  75. Brose, P.H.; Dey, D.C.; Phillips, R.J.; Waldrop, T.A. A meta-analysis of the fire-oak hypothesis: Does prescribed burning promote oak reproduction in eastern North America? For. Sci. 2013, 59, 322–334. [Google Scholar] [CrossRef]
  76. Brose, P.H.; Gottschalk, K.W.; Horsley, S.B.; Knopp, P.D.; Kochenderfer, J.N.; McGuinness, B.J.; Miller, G.W.; Ristau, T.E.; Stoleson, S.H.; Stout, S.L. Prescribing Regeneration Treatments for Mixed-Oak Forests in the Mid-Atlantic Region; General Technical Report NRS-33; U.S. Department of Agriculture, Forest Service, Northern Research Station: Newtown Square, PA, USA, 2008; p. 100.
  77. Kochenderfer, J.D.; Kochenderfer, J.N.; Miller, G.W. Manual Herbicide Applicaiton Methods for Managing Vegetation in Appalachian Hardwood Forests; General Technical Report NRS-96; U.S. Department of Agriculture, Forest Service, Northern Research Station: Newtown Square, PA, USA, 2012; p. 59.
  78. Lhotka, J.M.; Loewenstein, E.F. Effect of midstory removal on understory light availability and the 2-year response of underplanted cherrybark oak seedlings. South. J. Appl. For. 2009, 33, 171–177. [Google Scholar]
  79. Brisson, J.A.; Strasburg, J.L.; Templeton, A.R. Impact of fire management on the ecology of collared lizard (Crotaphytus collaris) populations living on the Ozark Plateau. Anim. Conserv. 2003, 6, 247–254. [Google Scholar] [CrossRef]
  80. Young, C.C.; Morrison, L.W.; Haack, J.L. Habitat relationships and management implications for Lesquerella filiformis Rollins (missouri bladderpod) on a xeric limestone prairie. J. Torrey Bot. Soc. 2009, 136, 233–241. [Google Scholar] [CrossRef]
  81. Templeton, A.R.; Neuwald, J.L.; Brazeal, H.; Robertson, R.J. Invited Minireview: Restoring demographic processes in translocated populations: The case of collared lizards in the Missouri Ozarks using prescribed forest fires. Isr. J. Ecol. Evol. 2007, 53, 179–196. [Google Scholar] [CrossRef]
  82. Barger, N.N.; Archer, S.R.; Campbell, J.L.; Huang, C.Y.; Morton, J.A.; Knapp, A.K. Woody plant proliferation in North American drylands: A synthesis of impacts on ecosystem carbon balance. J. Geophys. Res. Biogeosci. 2011, 116. [Google Scholar] [CrossRef] [Green Version]
  83. Comer, C.E.; Bell, A.L.; Oswald, B.P.; Conway, W.C.; Burt, D.B. Vegetation and avian response to prescribed fire on glade habitats in the Missouri Ozarks. Am. Midl. Nat. 2010, 165, 91–104. [Google Scholar] [CrossRef]
  84. Miller, J.E.D.; Damschen, E.I.; Ratajczak, Z.; Özdoğan, M. Holding the line: Three decades of prescribed fires halt but do not reverse woody encroachment in grasslands. Landsc. Ecol. 2017, 32, 2297–2310. [Google Scholar] [CrossRef]
  85. McCarty, K. Landscape-scale restoration in Missouri savannas and woodlands. Restor. Manag. Notes 1998, 16, 22–32. [Google Scholar] [CrossRef]
Figure 1. Location of vegetation sampling plots at Baskett Wildlife Research and Education Center (BWREC). Aerial image was taken in 2007. Plots shown by forest type: BL = Bottomland, DRS = Dry Ridge and Slope, GL = Glade-like, and MS = Mesic Slope. Inset shows the location of BWREC within the Central Hardwood Forest Region (map modified from [11]).
Forests 09 00633 g001
Figure 2. Stand structure through time for four forest types at BWREC, showing mean (±one standard error) for: (a) basal area (m2/ha), (b) density (trees/ha), and (c) quadratic mean diameter (cm). Forest types include bottomland (BL), dry ridge and slope (DRS), glade-like (GL), and mesic slope (MS).
Forests 09 00633 g002
Figure 3. Midstory density (trees/ha; mean ± one standard error) through time for four size classes (Class 1 = 0–1.25 cm; Class 2 = 1.26–3.75 cm; Class 3 = 3.76–6.25 cm; Class 4 = 6.26–8.75 cm) and total (all midstory trees combined), pooled across four forest types at BWREC. The p-values indicate significance of change through time for each size class; pair-wise comparisons are not shown to increase legibility.
Forests 09 00633 g003
Figure 4. Three-dimensional nonmetric multidimensional scaling ordination of the overstory and midstory for each forest type through time. The arrow at each point indicates the community in 1968, with the line connecting each subsequent point through time (1968, 1982, 1992, 2004, 2016). Forest types include bottomland (BL), dry ridge and slope (DRS), glade-like (GL), and mesic slope (MS).
Forests 09 00633 g004
Figure 5. Diameter distributions (center panel) and relative density (trees per hectare) across 2 cm diameter at breast height (DBH) classes for the top 10 most dominant species in 1968 and in 2016 for each forest type. Note that legend and x-axes differ for each forest type.
Forests 09 00633 g005
Figure 6. Change in importance value from 1968 to 2016 (mean and one standard error) for each overstory species in (A) bottomland, (B) dry ridge and slope, (C) glade-like, and (D) mesic slope forest types. Positive values are increase in importance value and negative values are decrease. ‘*’ indicates species for which change in importance value is significantly different from zero. Species abbreviations are defined in Table S1.
Forests 09 00633 g006
Figure 7. Change in relative density (RD; x-axis) and relative basal area (RBA; y-axis), each of which contribute to calculated importance value, from 1968 to 2016 for all overstory species occurring within each forest type. Species labels are provided only for species with significant changes in importance value from 1968 to 2016.
Forests 09 00633 g007
Figure 8. Changes in density (trees/ha) and basal area (m2/ha) through time for each overstory species that significantly changed in importance value from 1968 to 2016 for each forest type. The p-values indicate significance of change through time for each species; pair-wise comparisons are not shown to increase legibility.
Forests 09 00633 g008
Table 1. Marginal means (one standard error (SE)) by forest type and by year for basal area (m2/ha), density (trees per hectare), and quadratic mean diameter (cm) at BWREC. Forest types include bottomland (BL), dry ridge and slope (DRS), glade-like (GL), and mesic slope (MS).
Basal Area (m2/ha)Density (Trees/ha)Quadratic Mean Diameter (cm)
Forest TypeMeanSEMeanSEMeanSE
BL27.7 A0.96477.9 B20.2227.9 B0.80
DRS23.0 B0.93434.6 B25.9626.7 B1.15
GL19.1 C1.54569.6 A23.1120.7 C0.48
MS27.3 A0.81341.4 C8.8532.1 A0.58
p-value<0.001 <0.001 <0.001
Year
196822.0 C2.28487.038.9024.7 C2.24
198222.2 C2.39431.141.0726.4 BC2.52
199224.3 BC2.28472.456.1426.4 BC2.37
200425.5 AB1.64444.257.2927.8 AB2.38
201627.4 A1.61444.861.1129.1 A2.40
p-value<0.001 0.246 <0.001
A,B,C—The same superscript letter within a column indicates no significant difference in pairwise comparison among forest types or years.
Table 2. Top five negative and positive species associations (Pearson correlation r) with each of the axes from nonmetric multidimensional scaling ordination.
Axis 1Axis 2Axis 3
RankSpeciesrSpeciesrSpeciesr
Negative
1Acer saccharum−0.721Carya ovata−0.623Juniperus virginiana−0.775
2Ostrya virginiana−0.659Carya texana−0.620Fraxinus quadrangulata−0.620
3Carpinus caroliniana−0.566Quercus stellata−0.574Sideroxylon lanuginosum−0.609
4Cornus florida−0.511Quercus shumardii−0.509Quercus muehlenbergii−0.561
5Cercis canadensis−0.475Quercus muehlenbergii−0.448Quercus shumardii−0.388
Positive
1Quercus alba0.736Aesculus glabra0.692Acer saccharum0.410
2Quercus velutina0.546Acer nigrum0.610Asimina triloba0.396
3Juglans nigra0.542Acer negundo0.543Cornus florida0.384
4Quercus rubra0.542Ulmus americana0.512Quercus alba0.357
5Carya laciniosa0.527Celtis occidentalis0.504Carya tomentosa0.304
Table 3. Mean density (trees/ha) for saplings by size class for species found to change in importance value in the overstory from 1968 through 2016. DBH classes: Class 1 = 0.01–1.25 cm; Class 2 = 1.26–3.75 cm; Class 3 = 3.76–6.25 cm; Class 4 = 6.26–8.75 cm.
SpeciesSize Class19681982199220042016
Dry Ridge and Slope
Acer saccharumClass 1505501344546
Class 2484605799425217
Class 378192259253250
Class 4355884133116
Quercus albaClass 150202200
Class 210481500
Class 3134251954
Class 483392060
Quercus shumardiiClass 1173100
Class 2111200
Class 310100
Class 400000
Quercus velutinaClass 127204260
Class 216113100
Class 362300
Class 410200
Glade-Like
Juniperus virginianaClass 1466250194530
Class 214416625916369
Class 34110616610679
Class 413729110043
Quercus muehlenbergiiClass 166413800
Class 21033428130
Class 3753431387
Class 4533447287
Quercus shumardiiClass 125251300
Class 2139900
Class 363300
Class 4136000
Mesic Slope
Acer saccharumClass 1525280325556
Class 21050533700278115
Class 3178290320210113
Class 423115136125115
Quercus albaClass 130500
Class 230000
Class 330000
Class 430000

