Early Survival and Growth Plasticity of 33 Species Planted in 38 Arboreta across the European Atlantic Area

 ,
,  ,
,  ,
,  ,
,  , ,
, ,  add
Show full author list
add
Show full author list
Abstract
1. Introduction
2. Materials and Methods
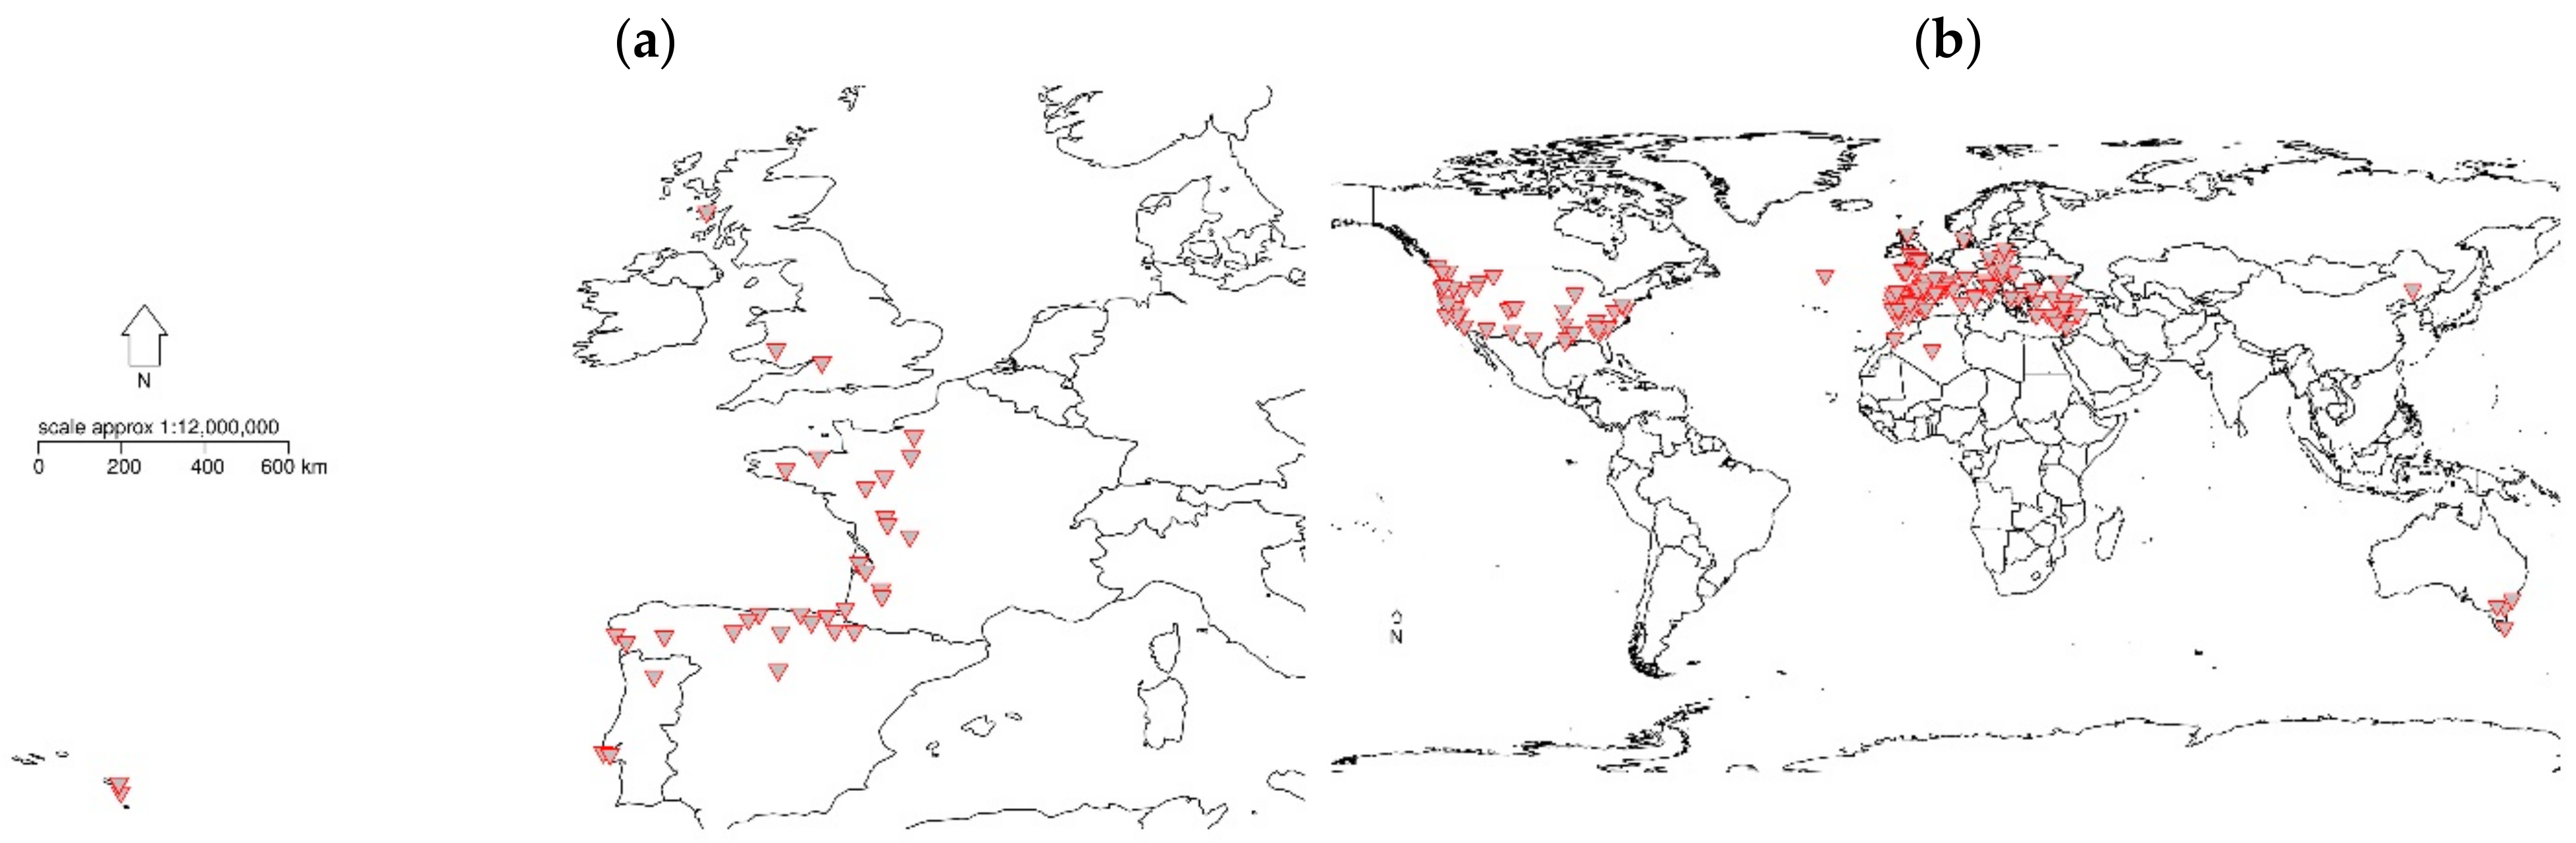
2.1. REINFFORCE Arboreta Network
2.2. Plant Assessment Data
2.3. Climate Data
2.4. Statistical Analysis
- The effect of meteorological conditions at the arboreta sites (Term A), expressing the plastic response of the genetic unit along the arboreta gradient.
- The effect of climatic transfer distance, (Term D) expressed by the differential between climate at the arboreta site and climate at the provenance site, revealing the plasticity-linked plant adaptation to site conditions.
- The interaction term A × D.
- Yijkl—Individual tree height for the lth tree for the jth Provenance from the kth Species, on the ith arboretum, or log-odds for survival;
- Ai and Ai2—the value of a Climate variable observed at the ith Arboretum;
- Dij and Dij2—the value of Climate distance for a climate variable between the ith arboretum and jth provenance site;
- Ai × Dij—the interaction between A and D terms;
- Sk—Species effect of the kth species;
- Ei—Site effect at the ith arboretum due to factors other than climate;
- Pj (Sk)—Provenance effect of the jth provenance nested within the kth corresponding species;
- eijkl—error term;
- with A, D, A × D being fixed effects, and S, E, P(S) being random effects.
2.5. Selecting Variables
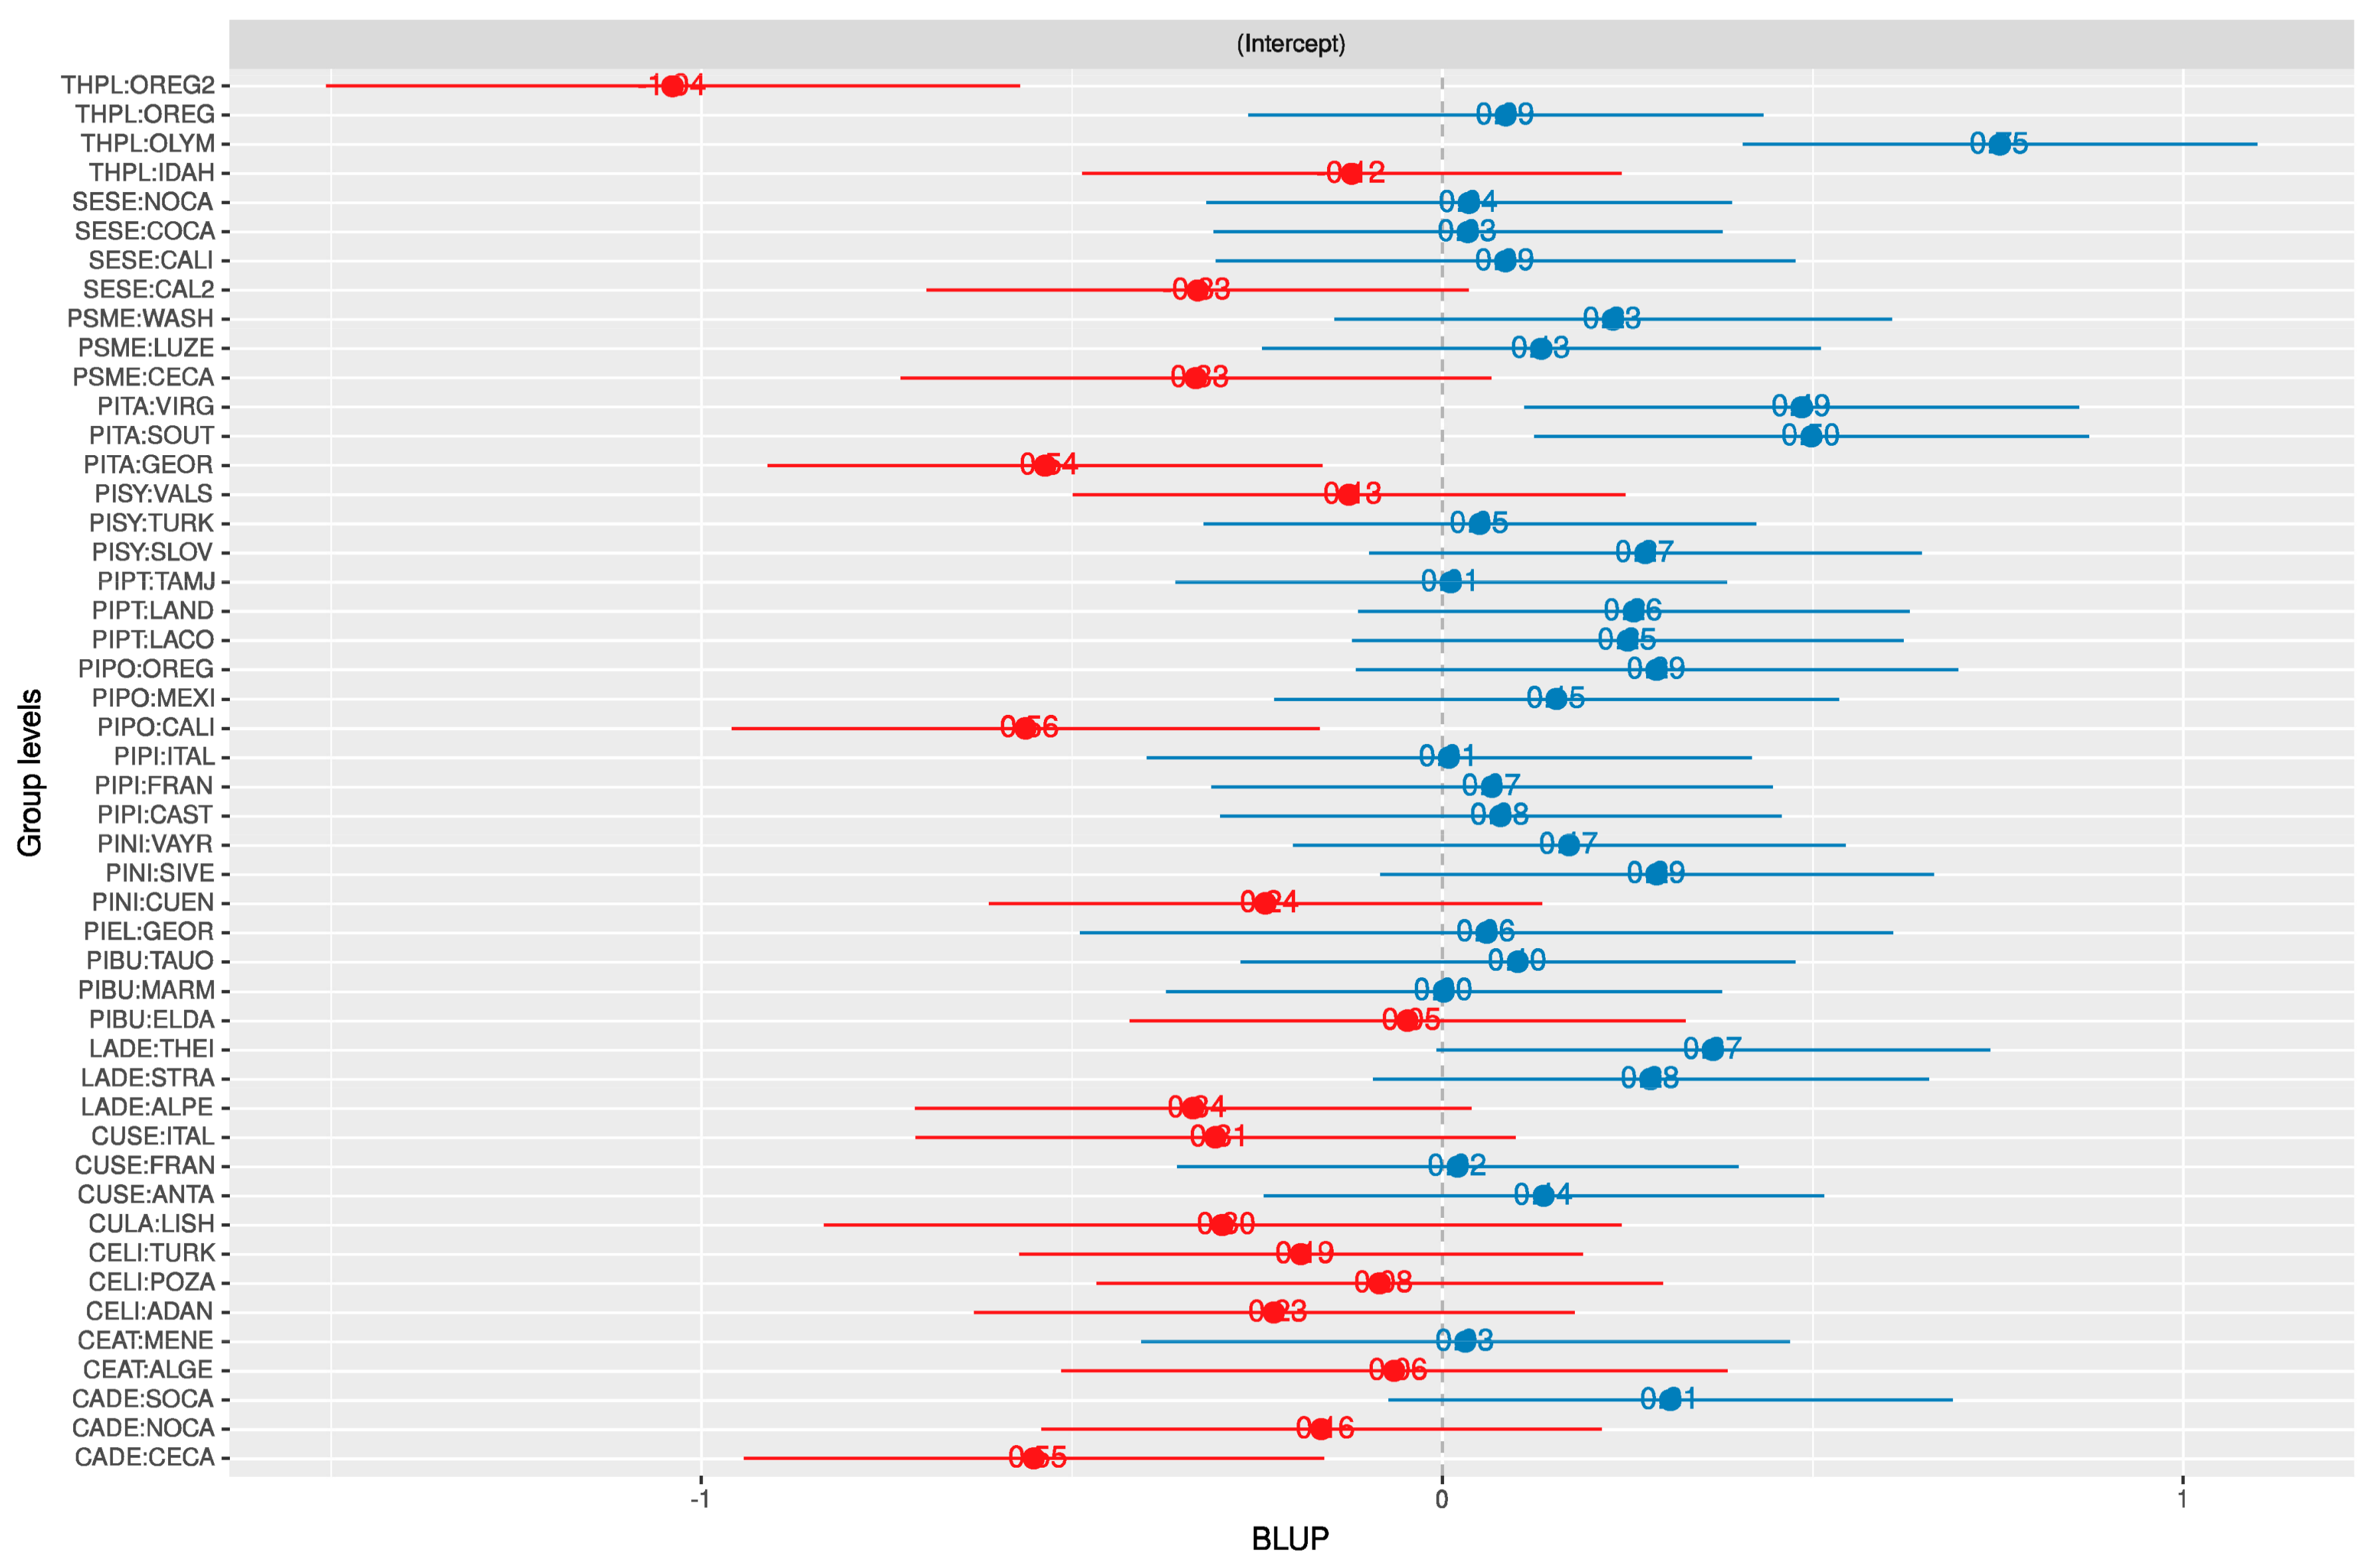
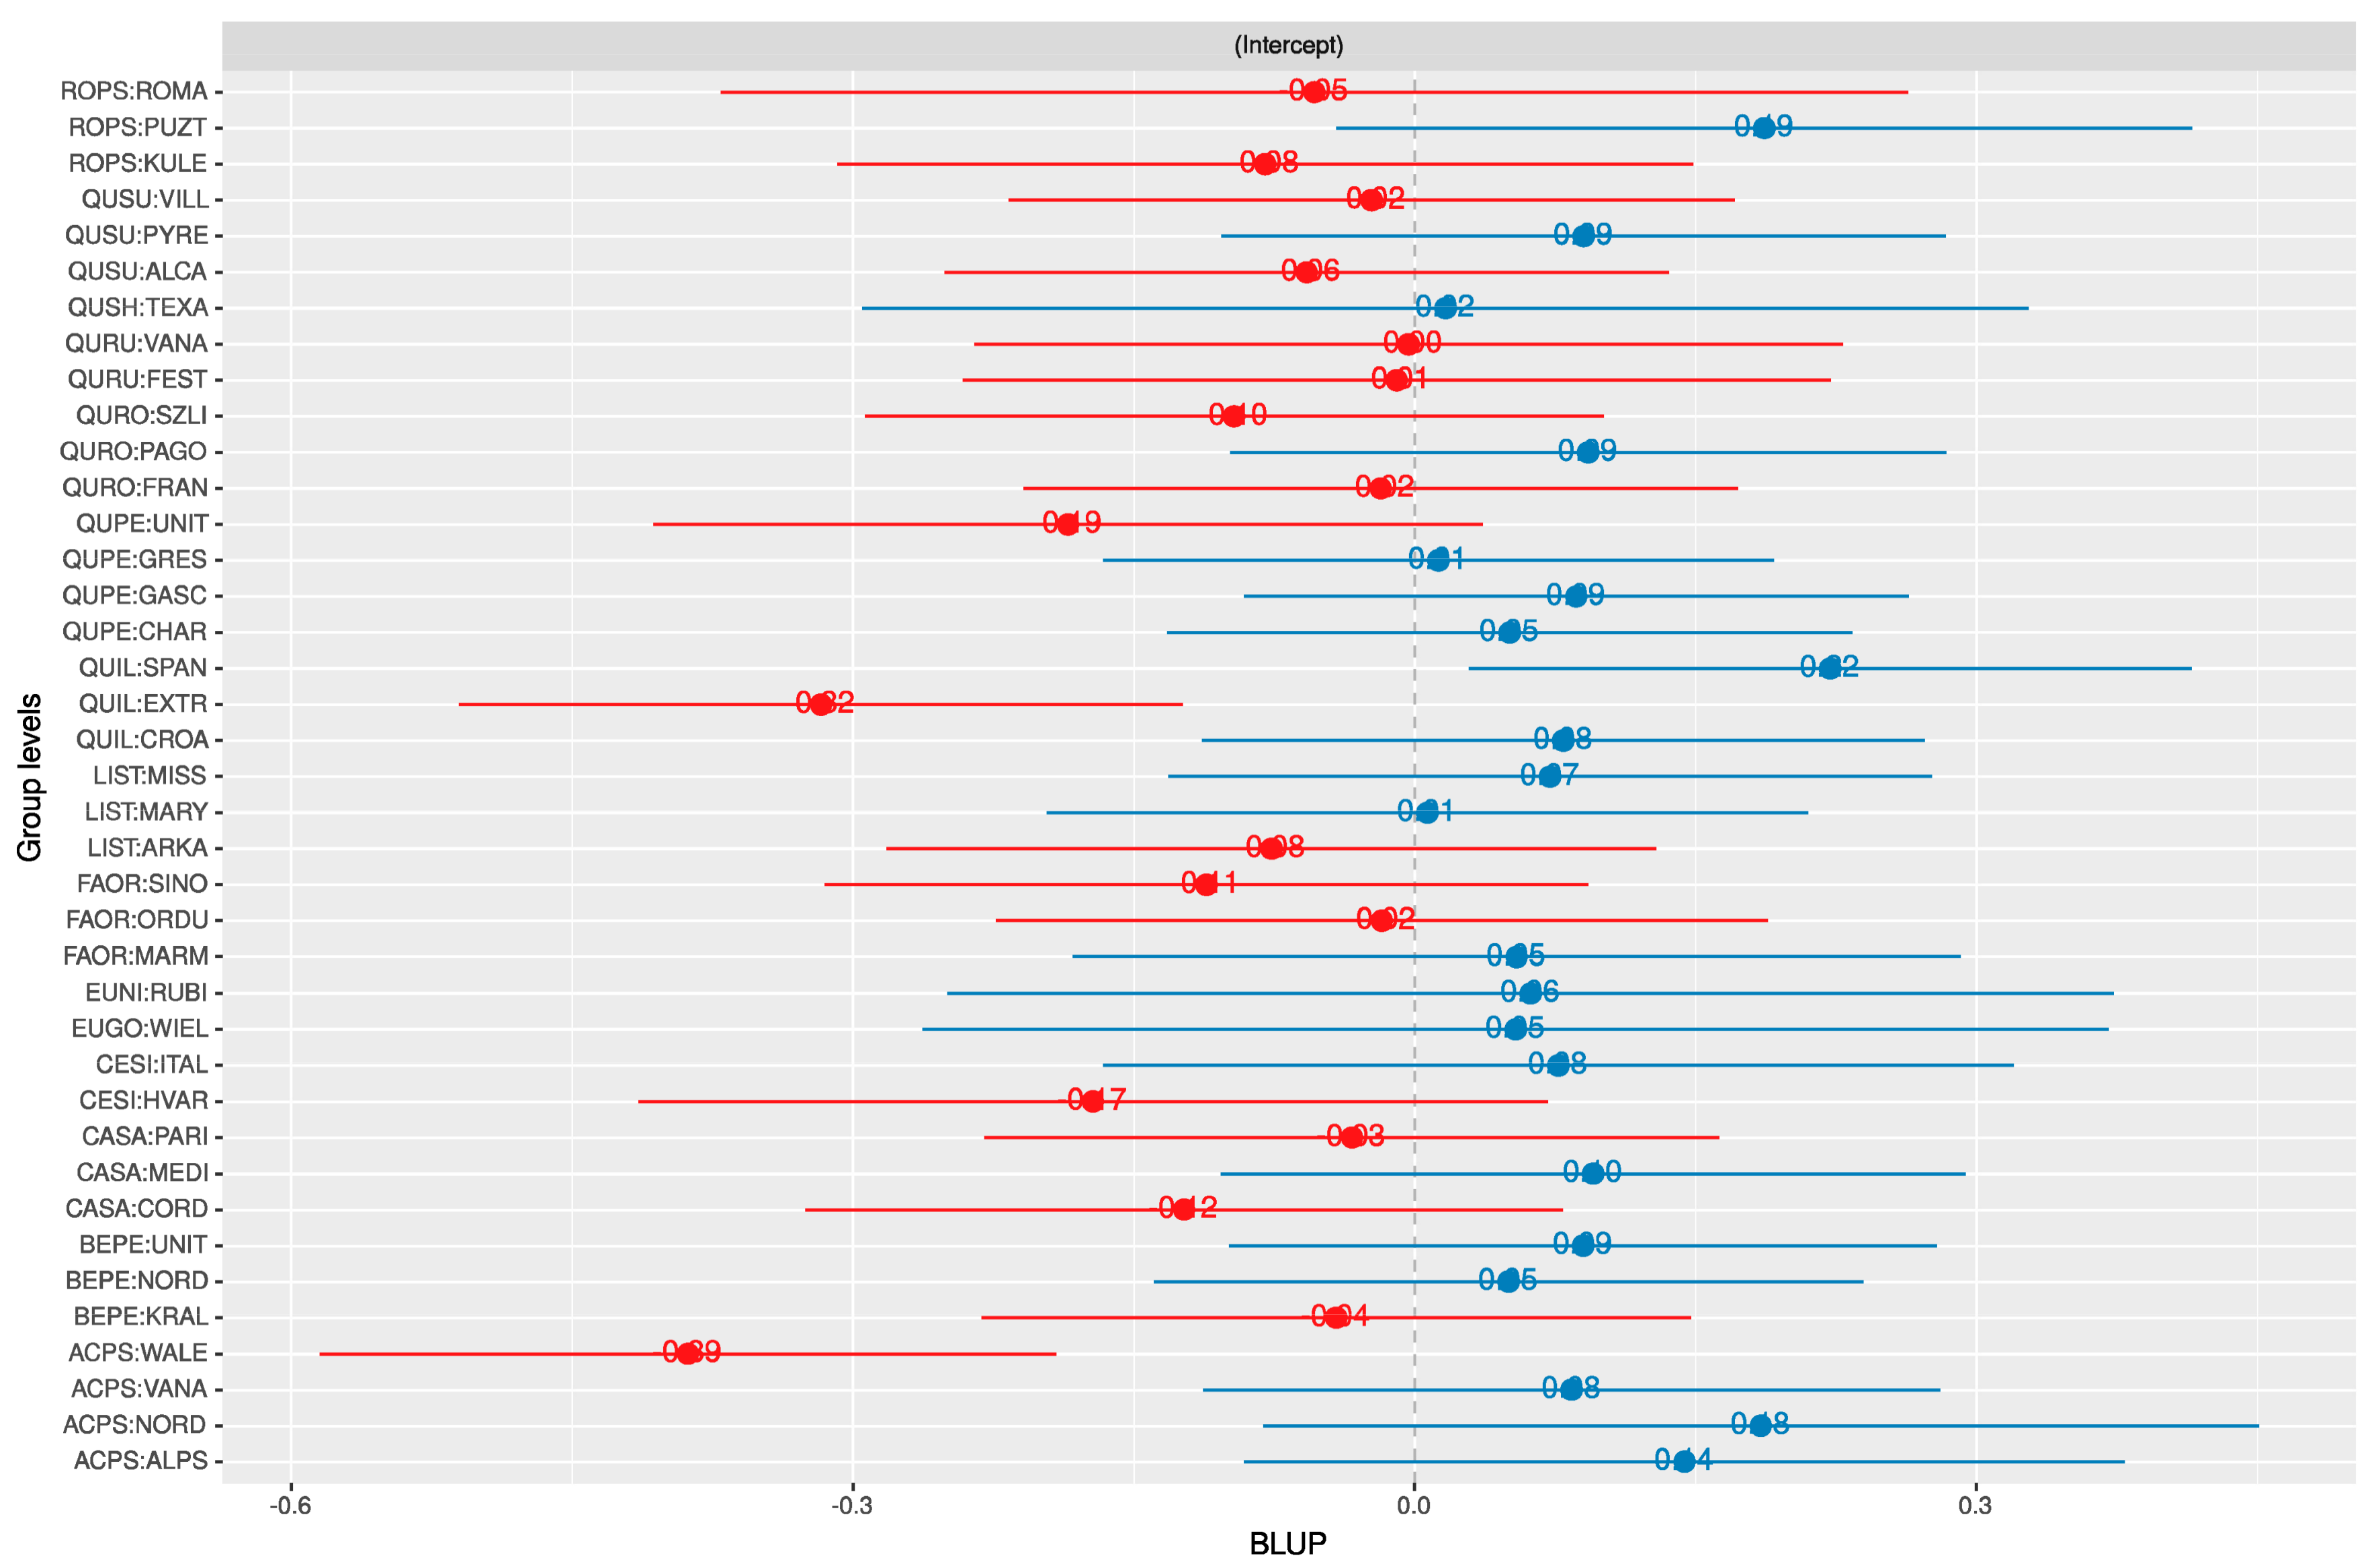
2.6. Random Effects
2.7. Model Selection
3. Results
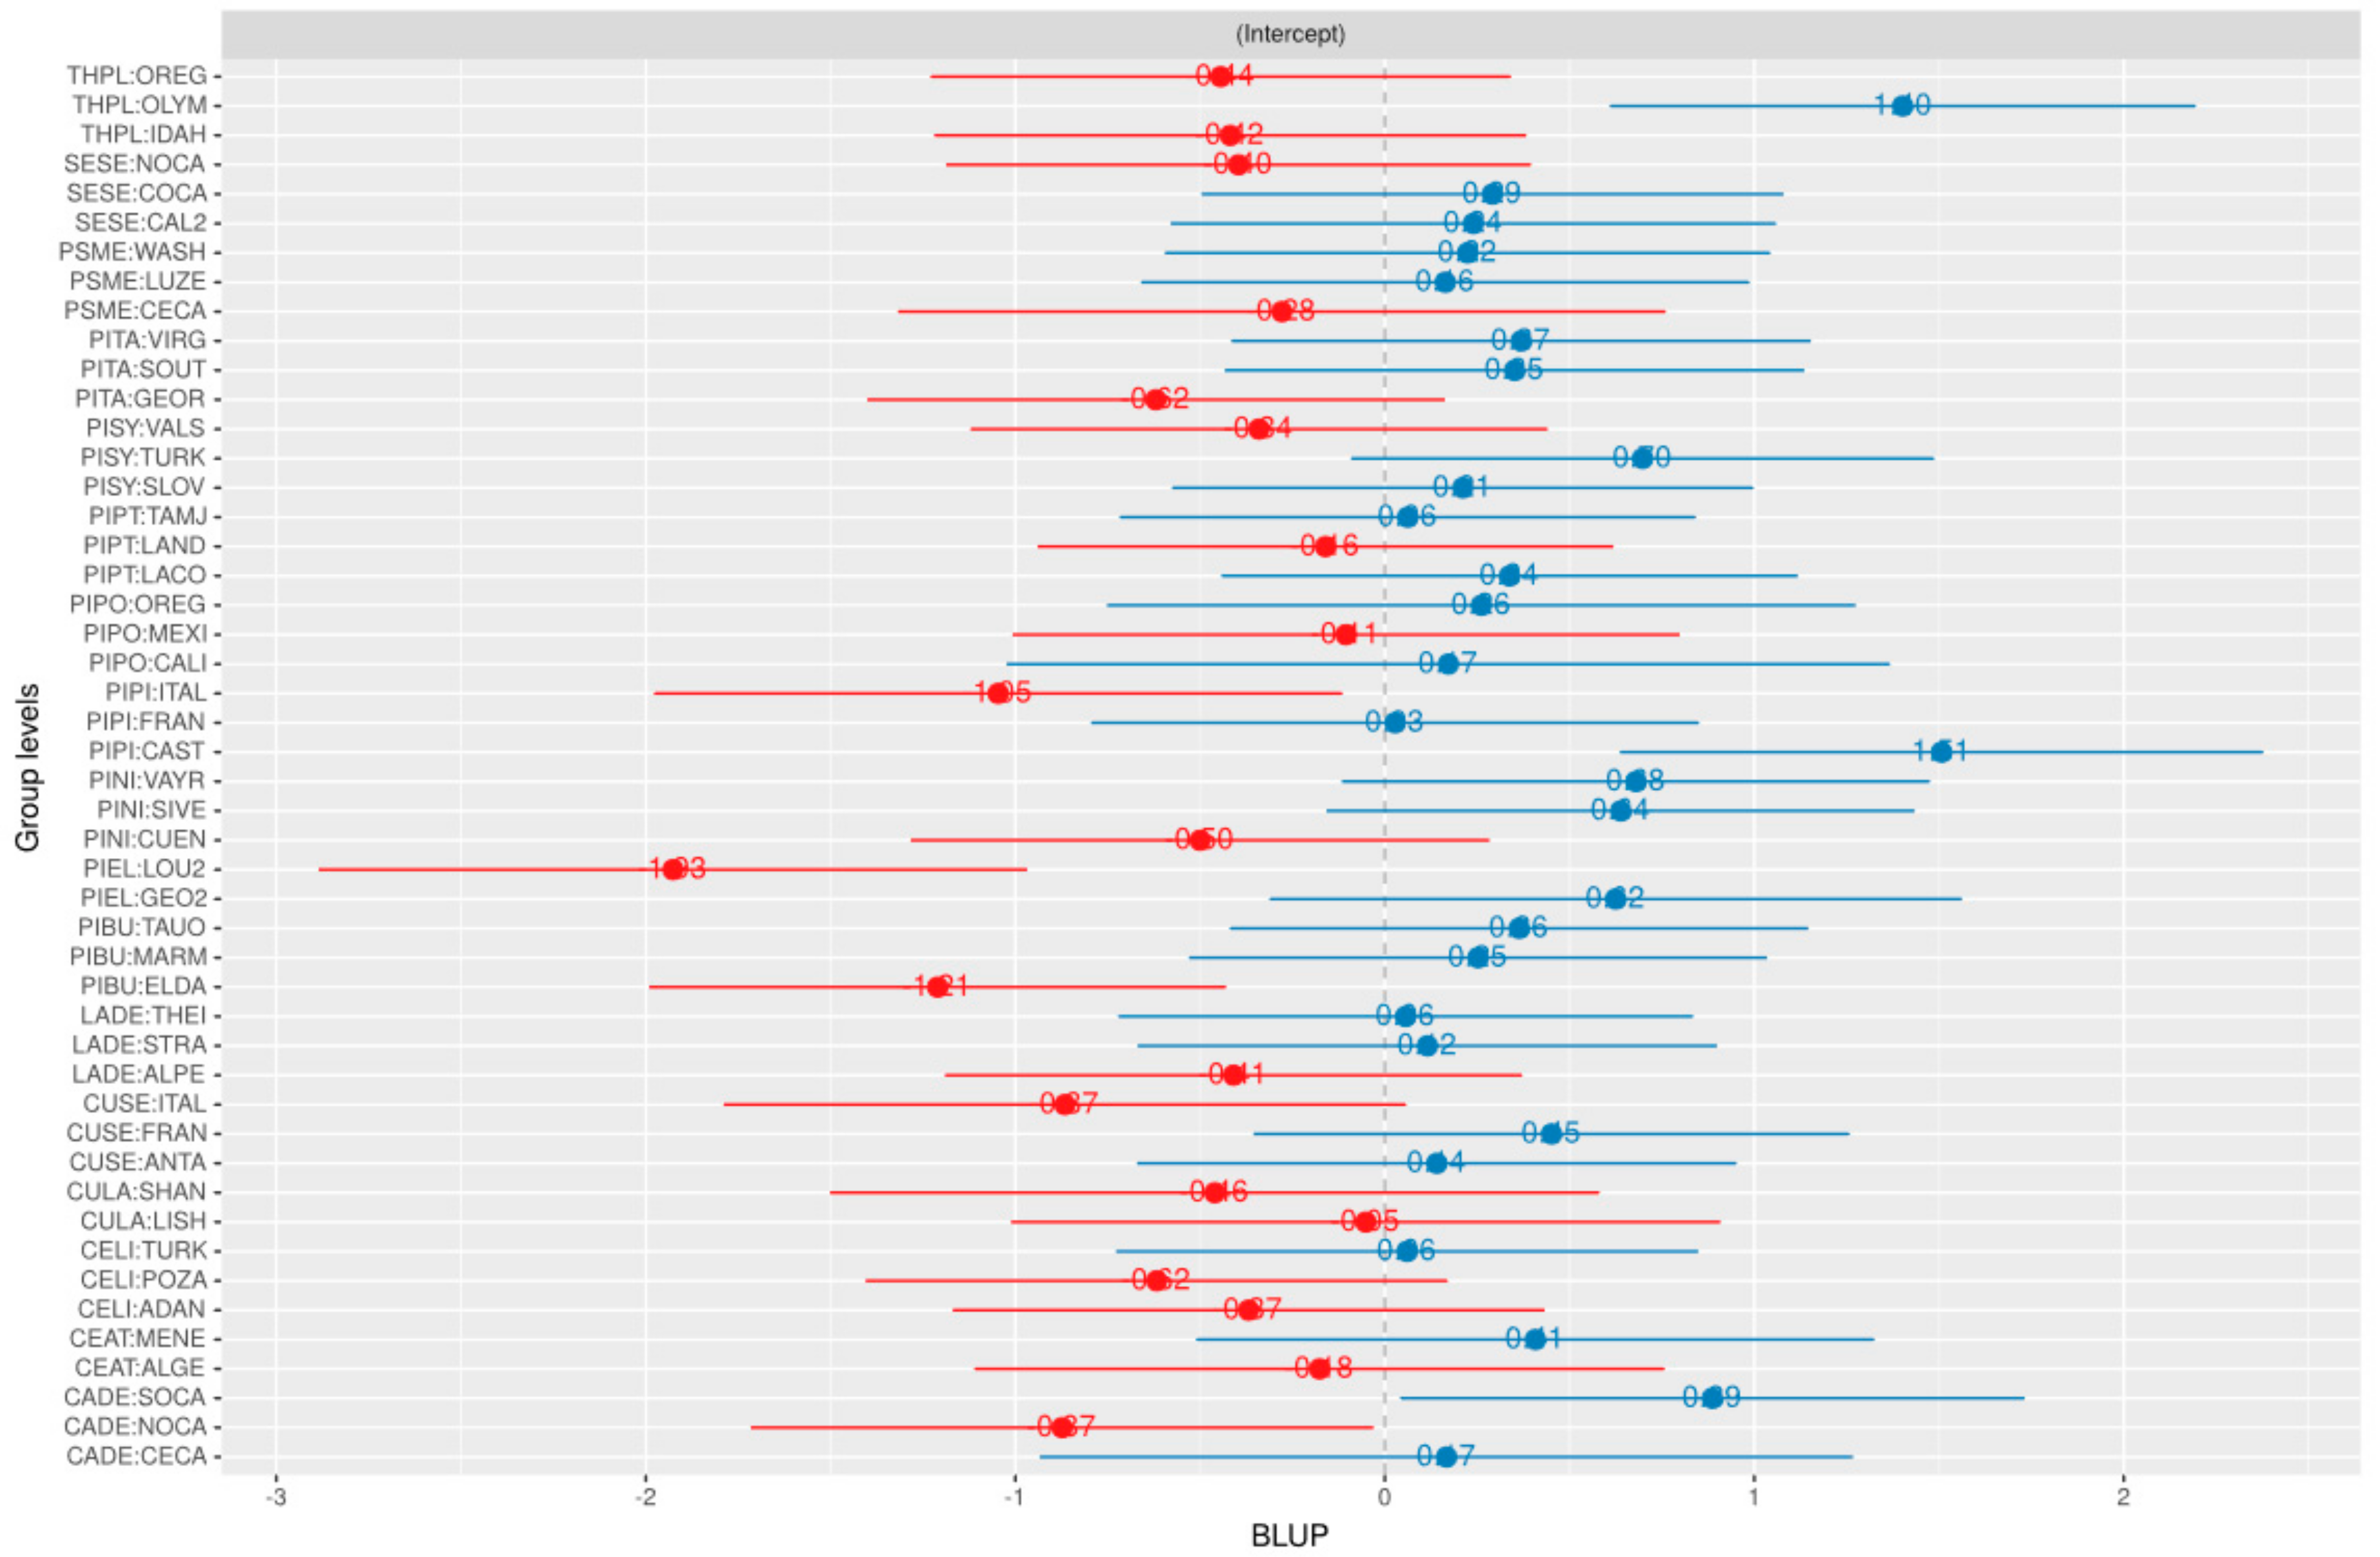
3.1. Random Effects
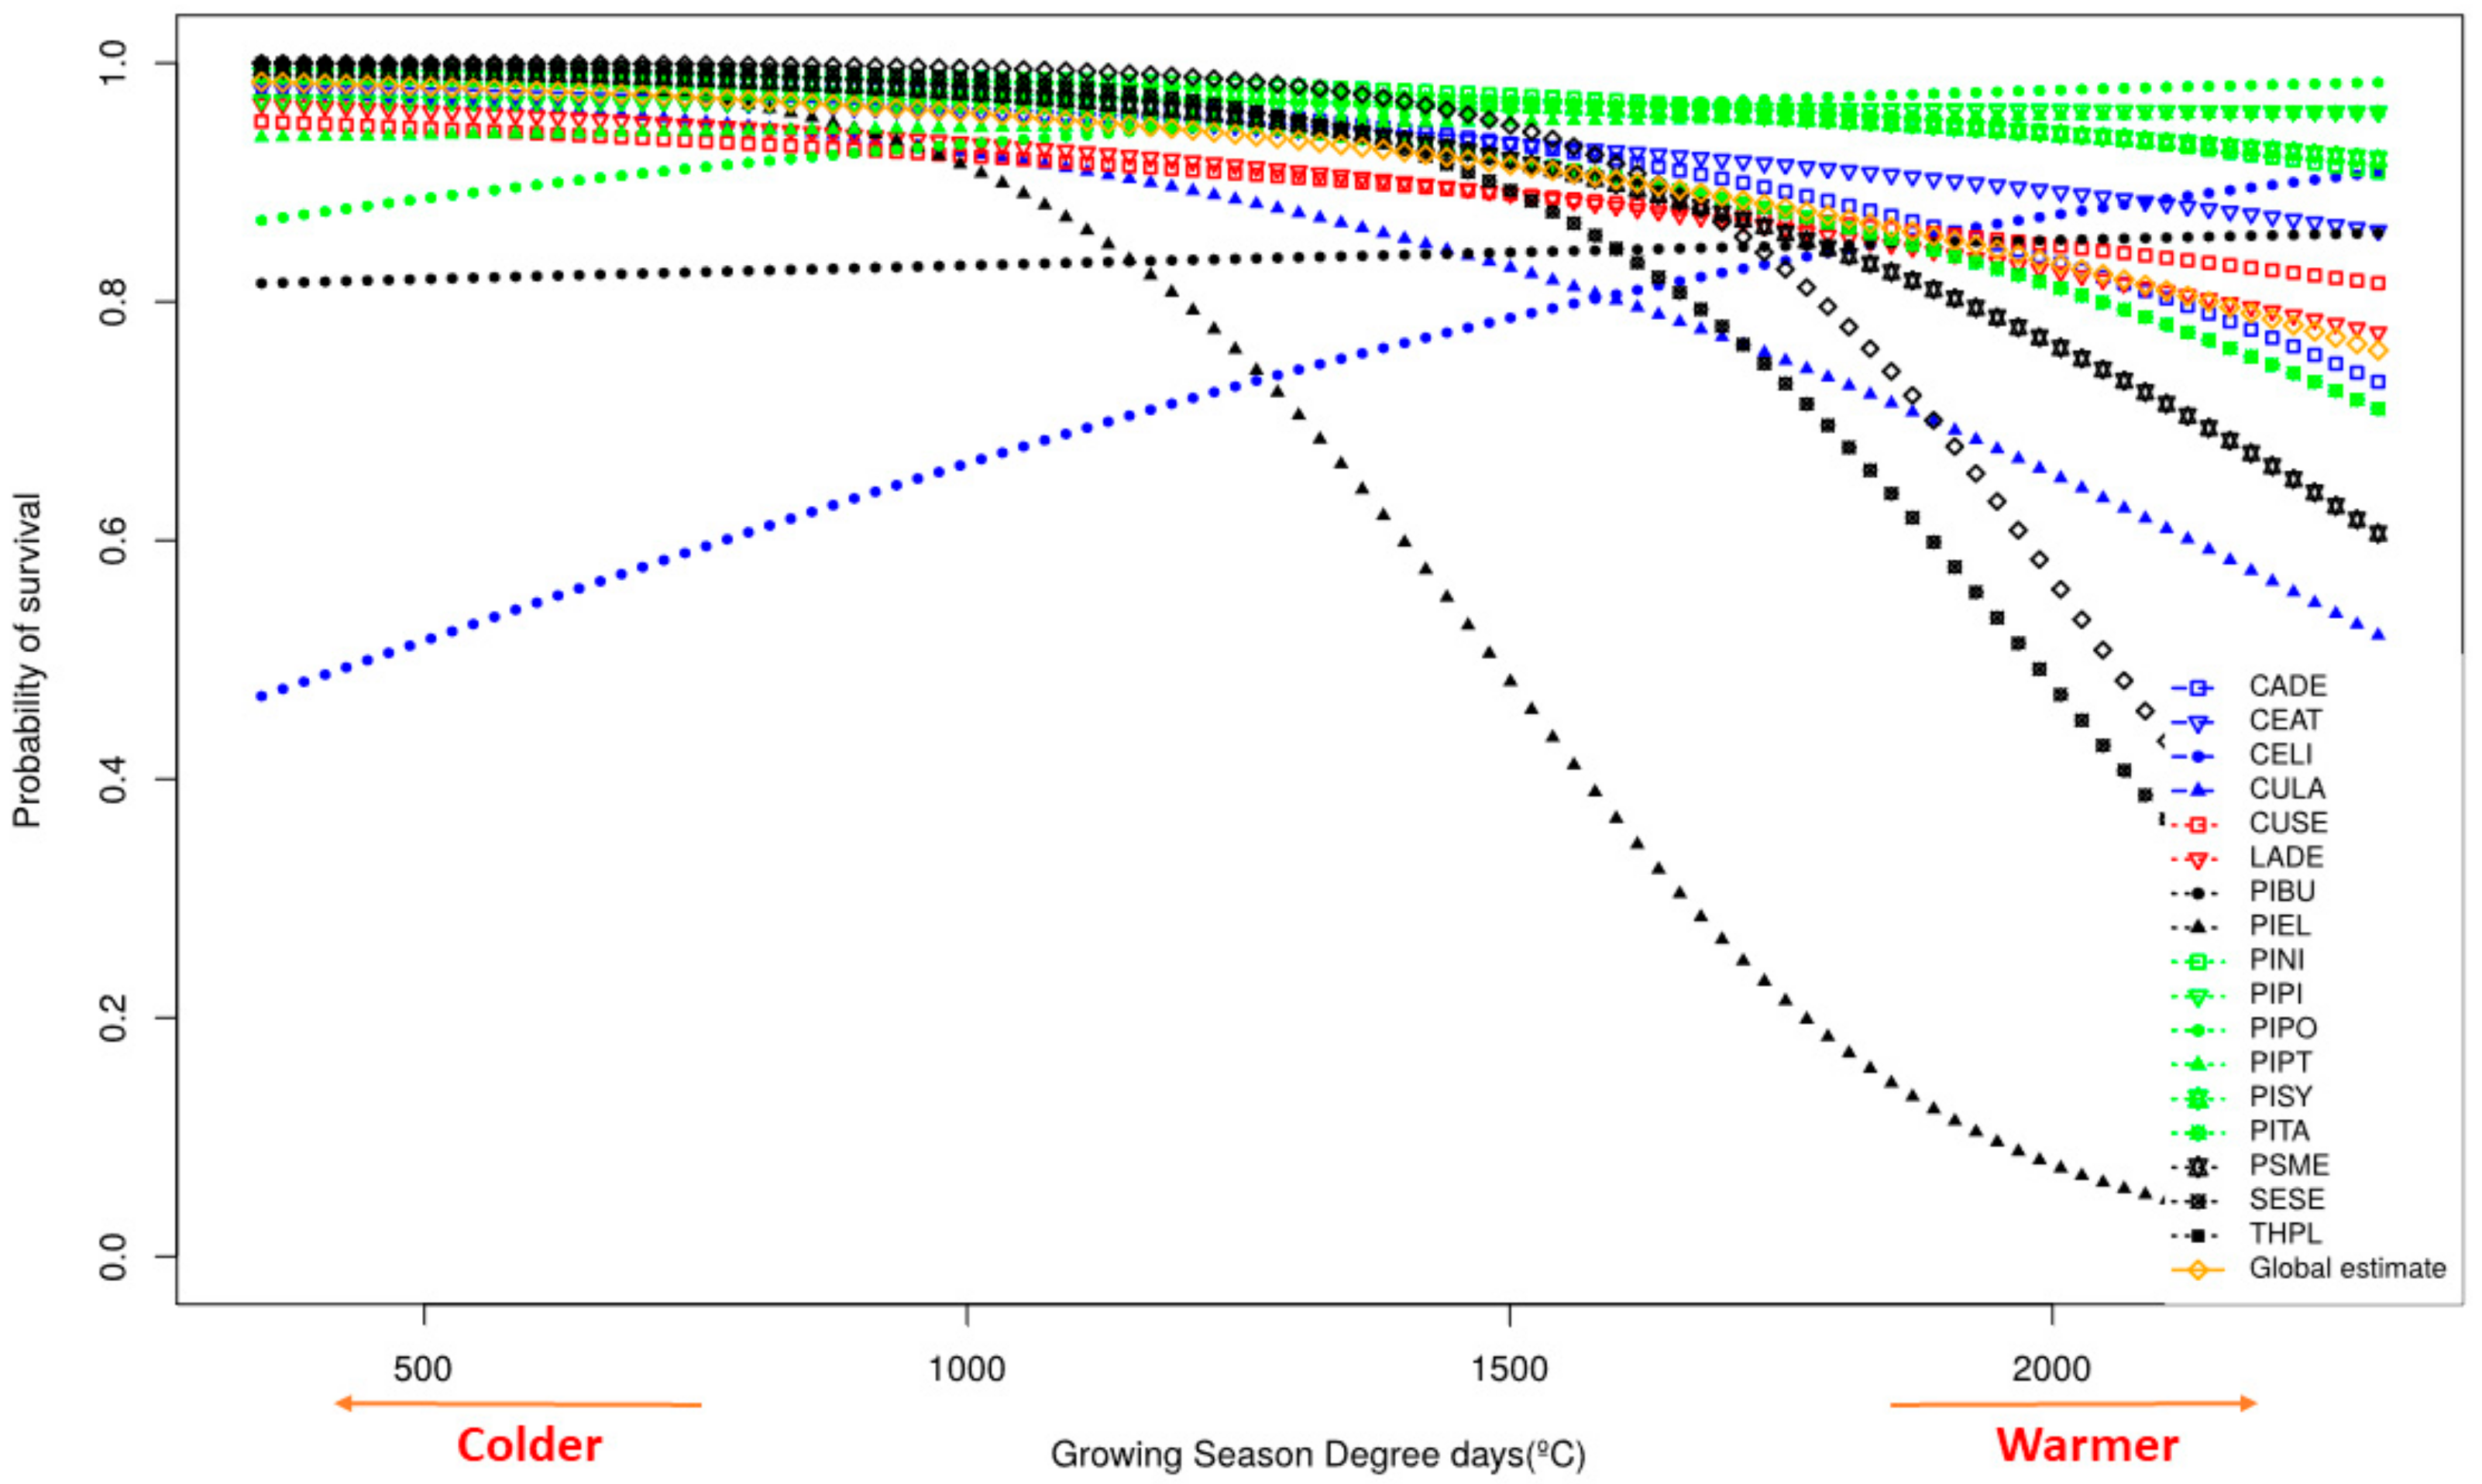
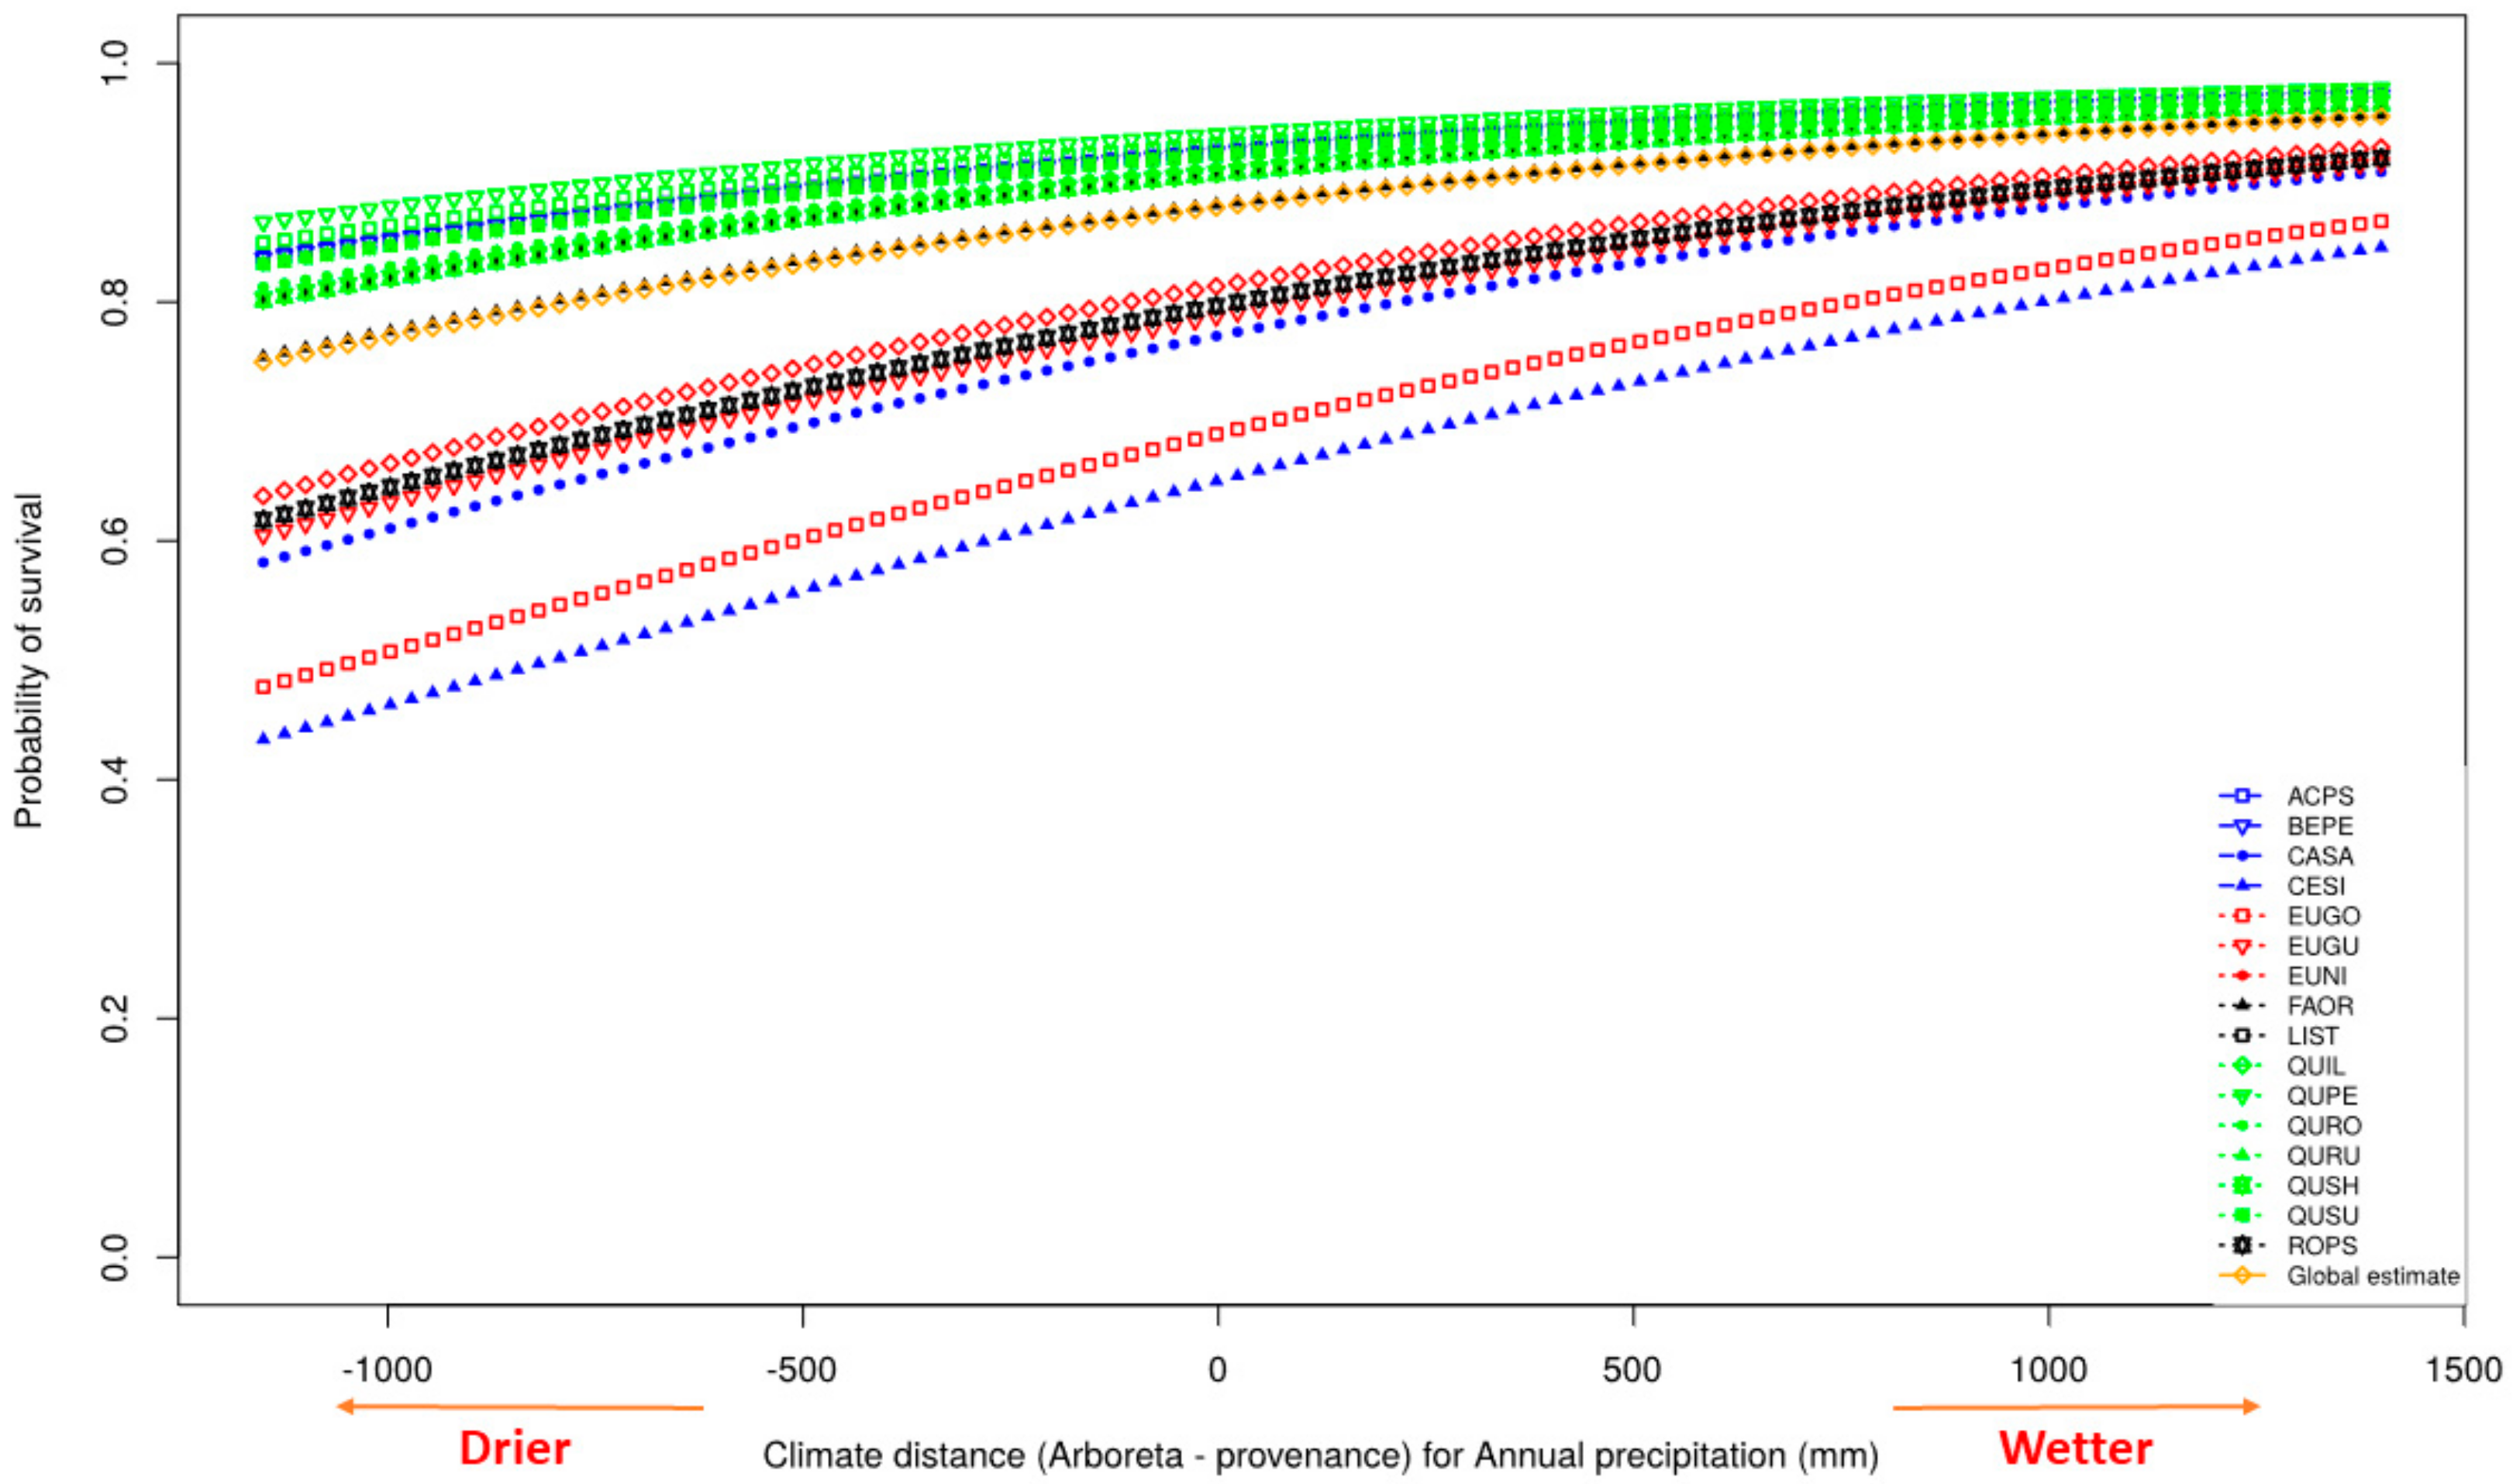
3.2. Survival
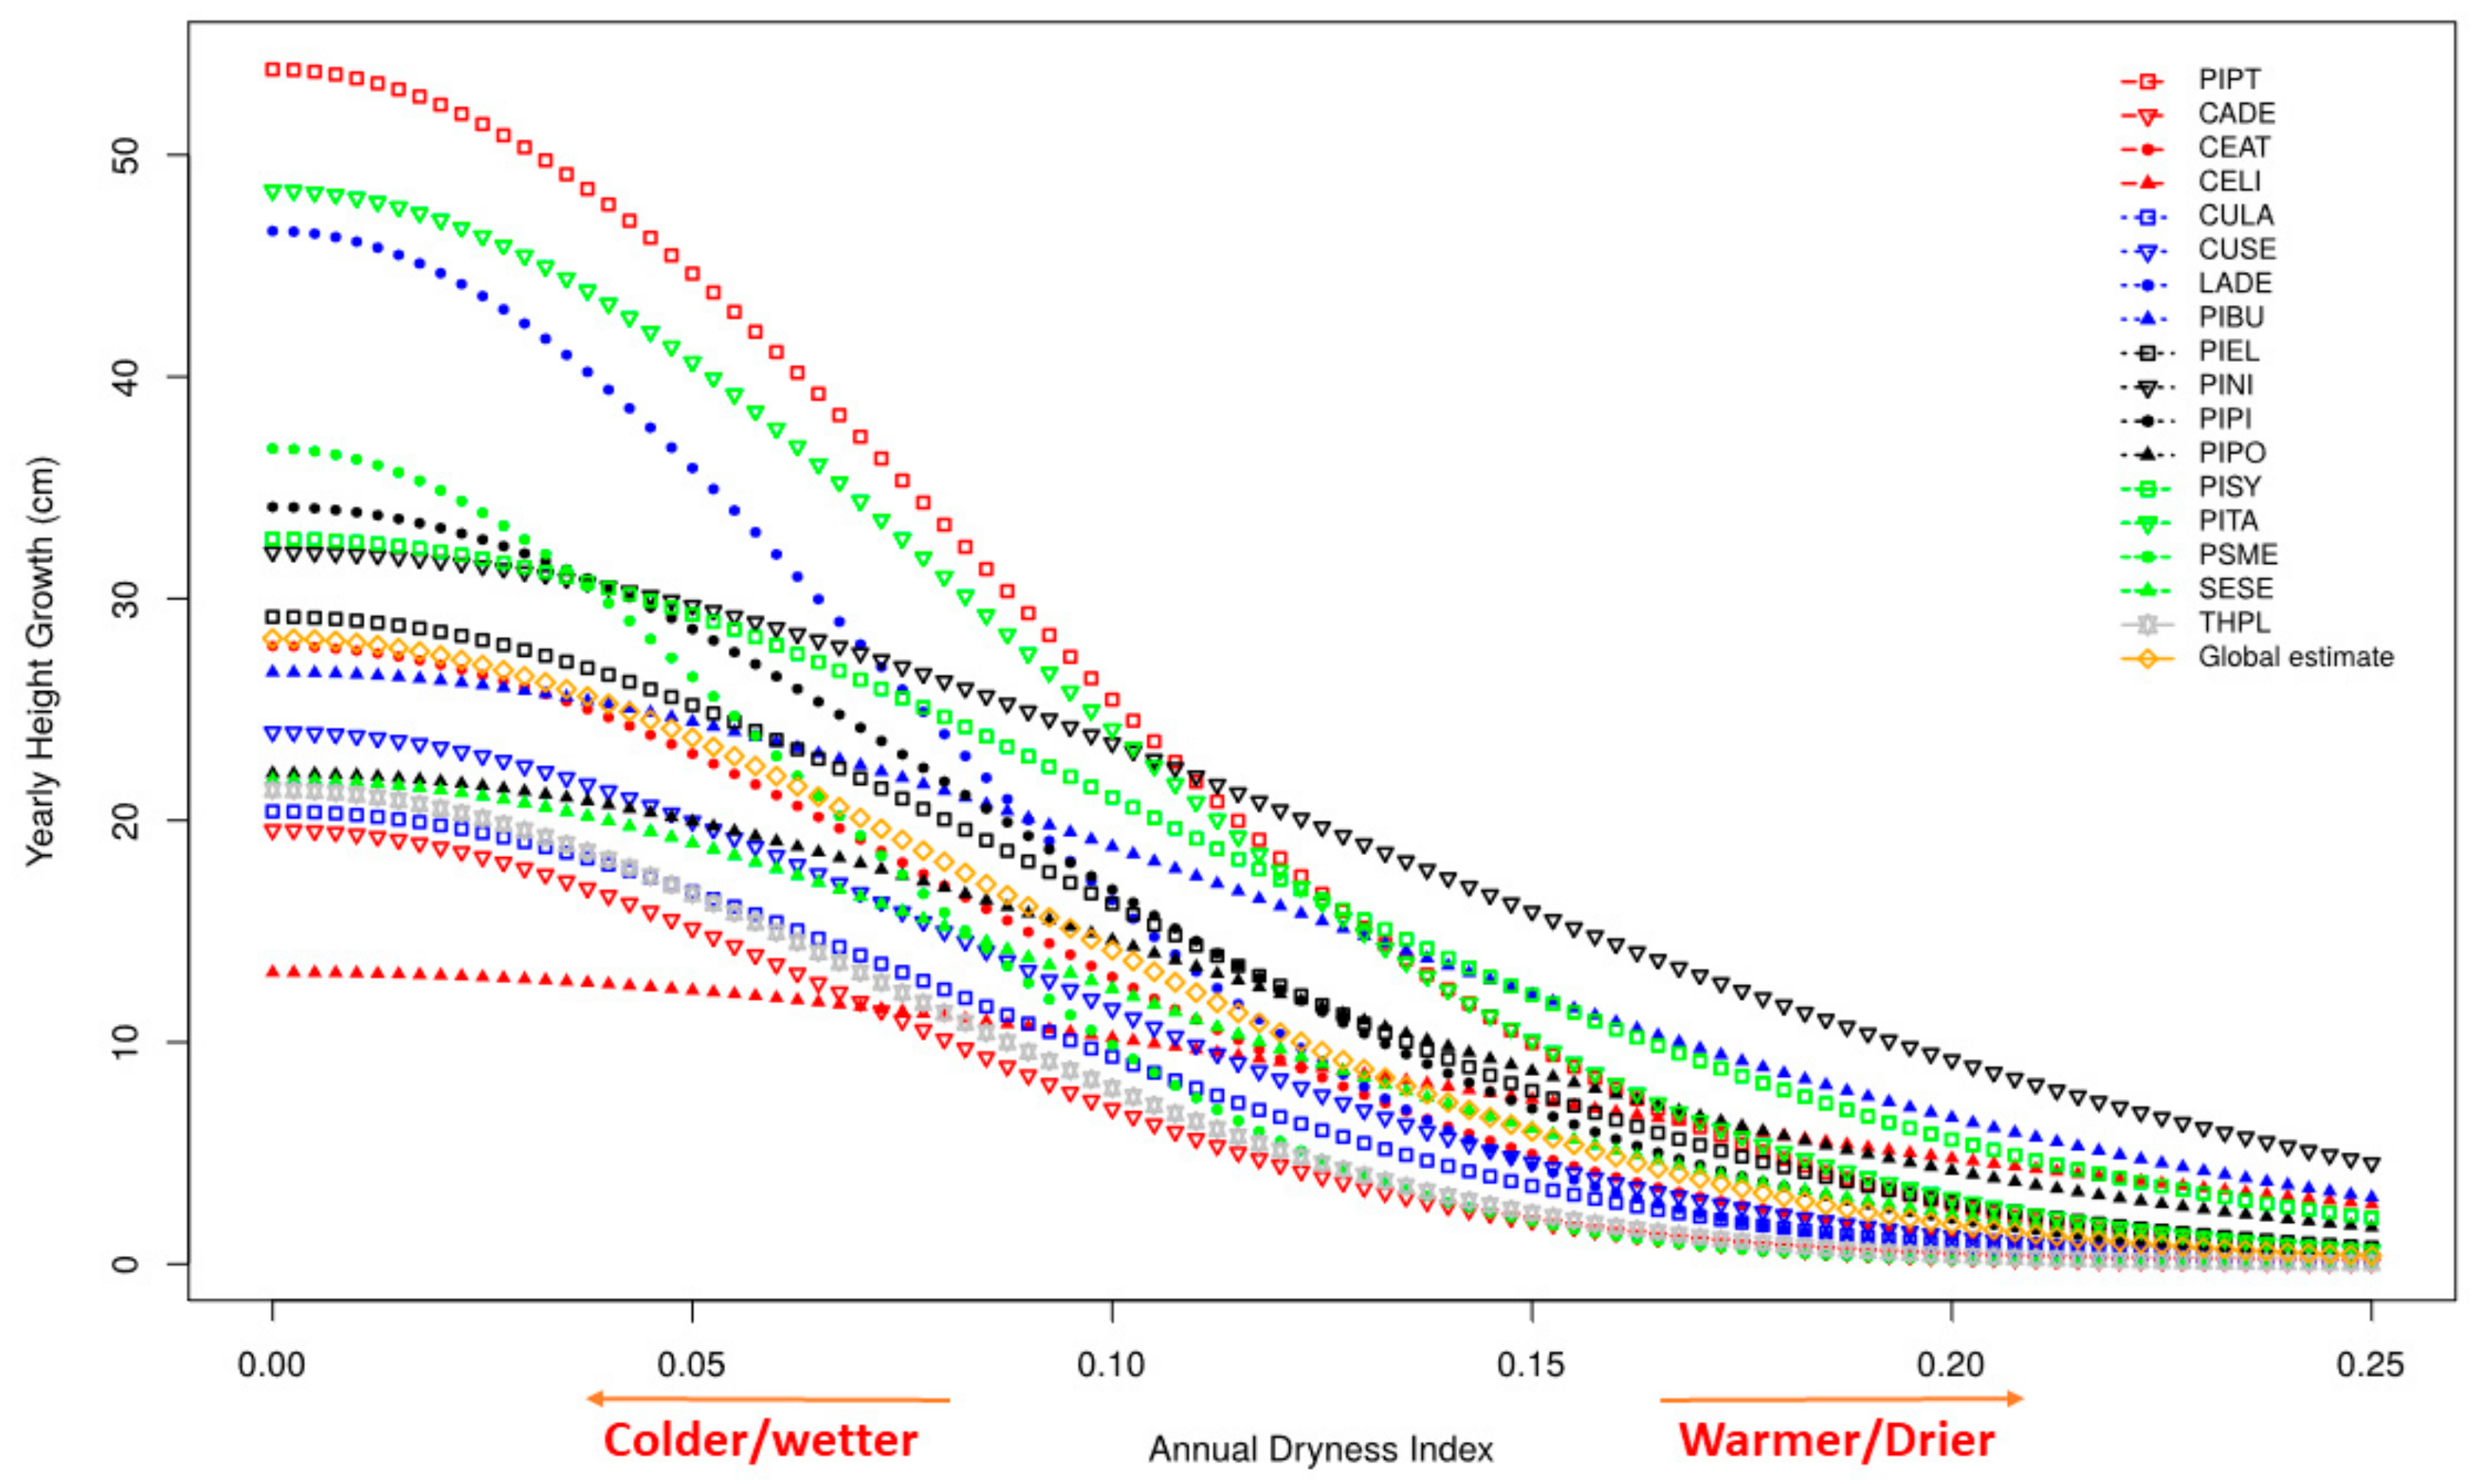
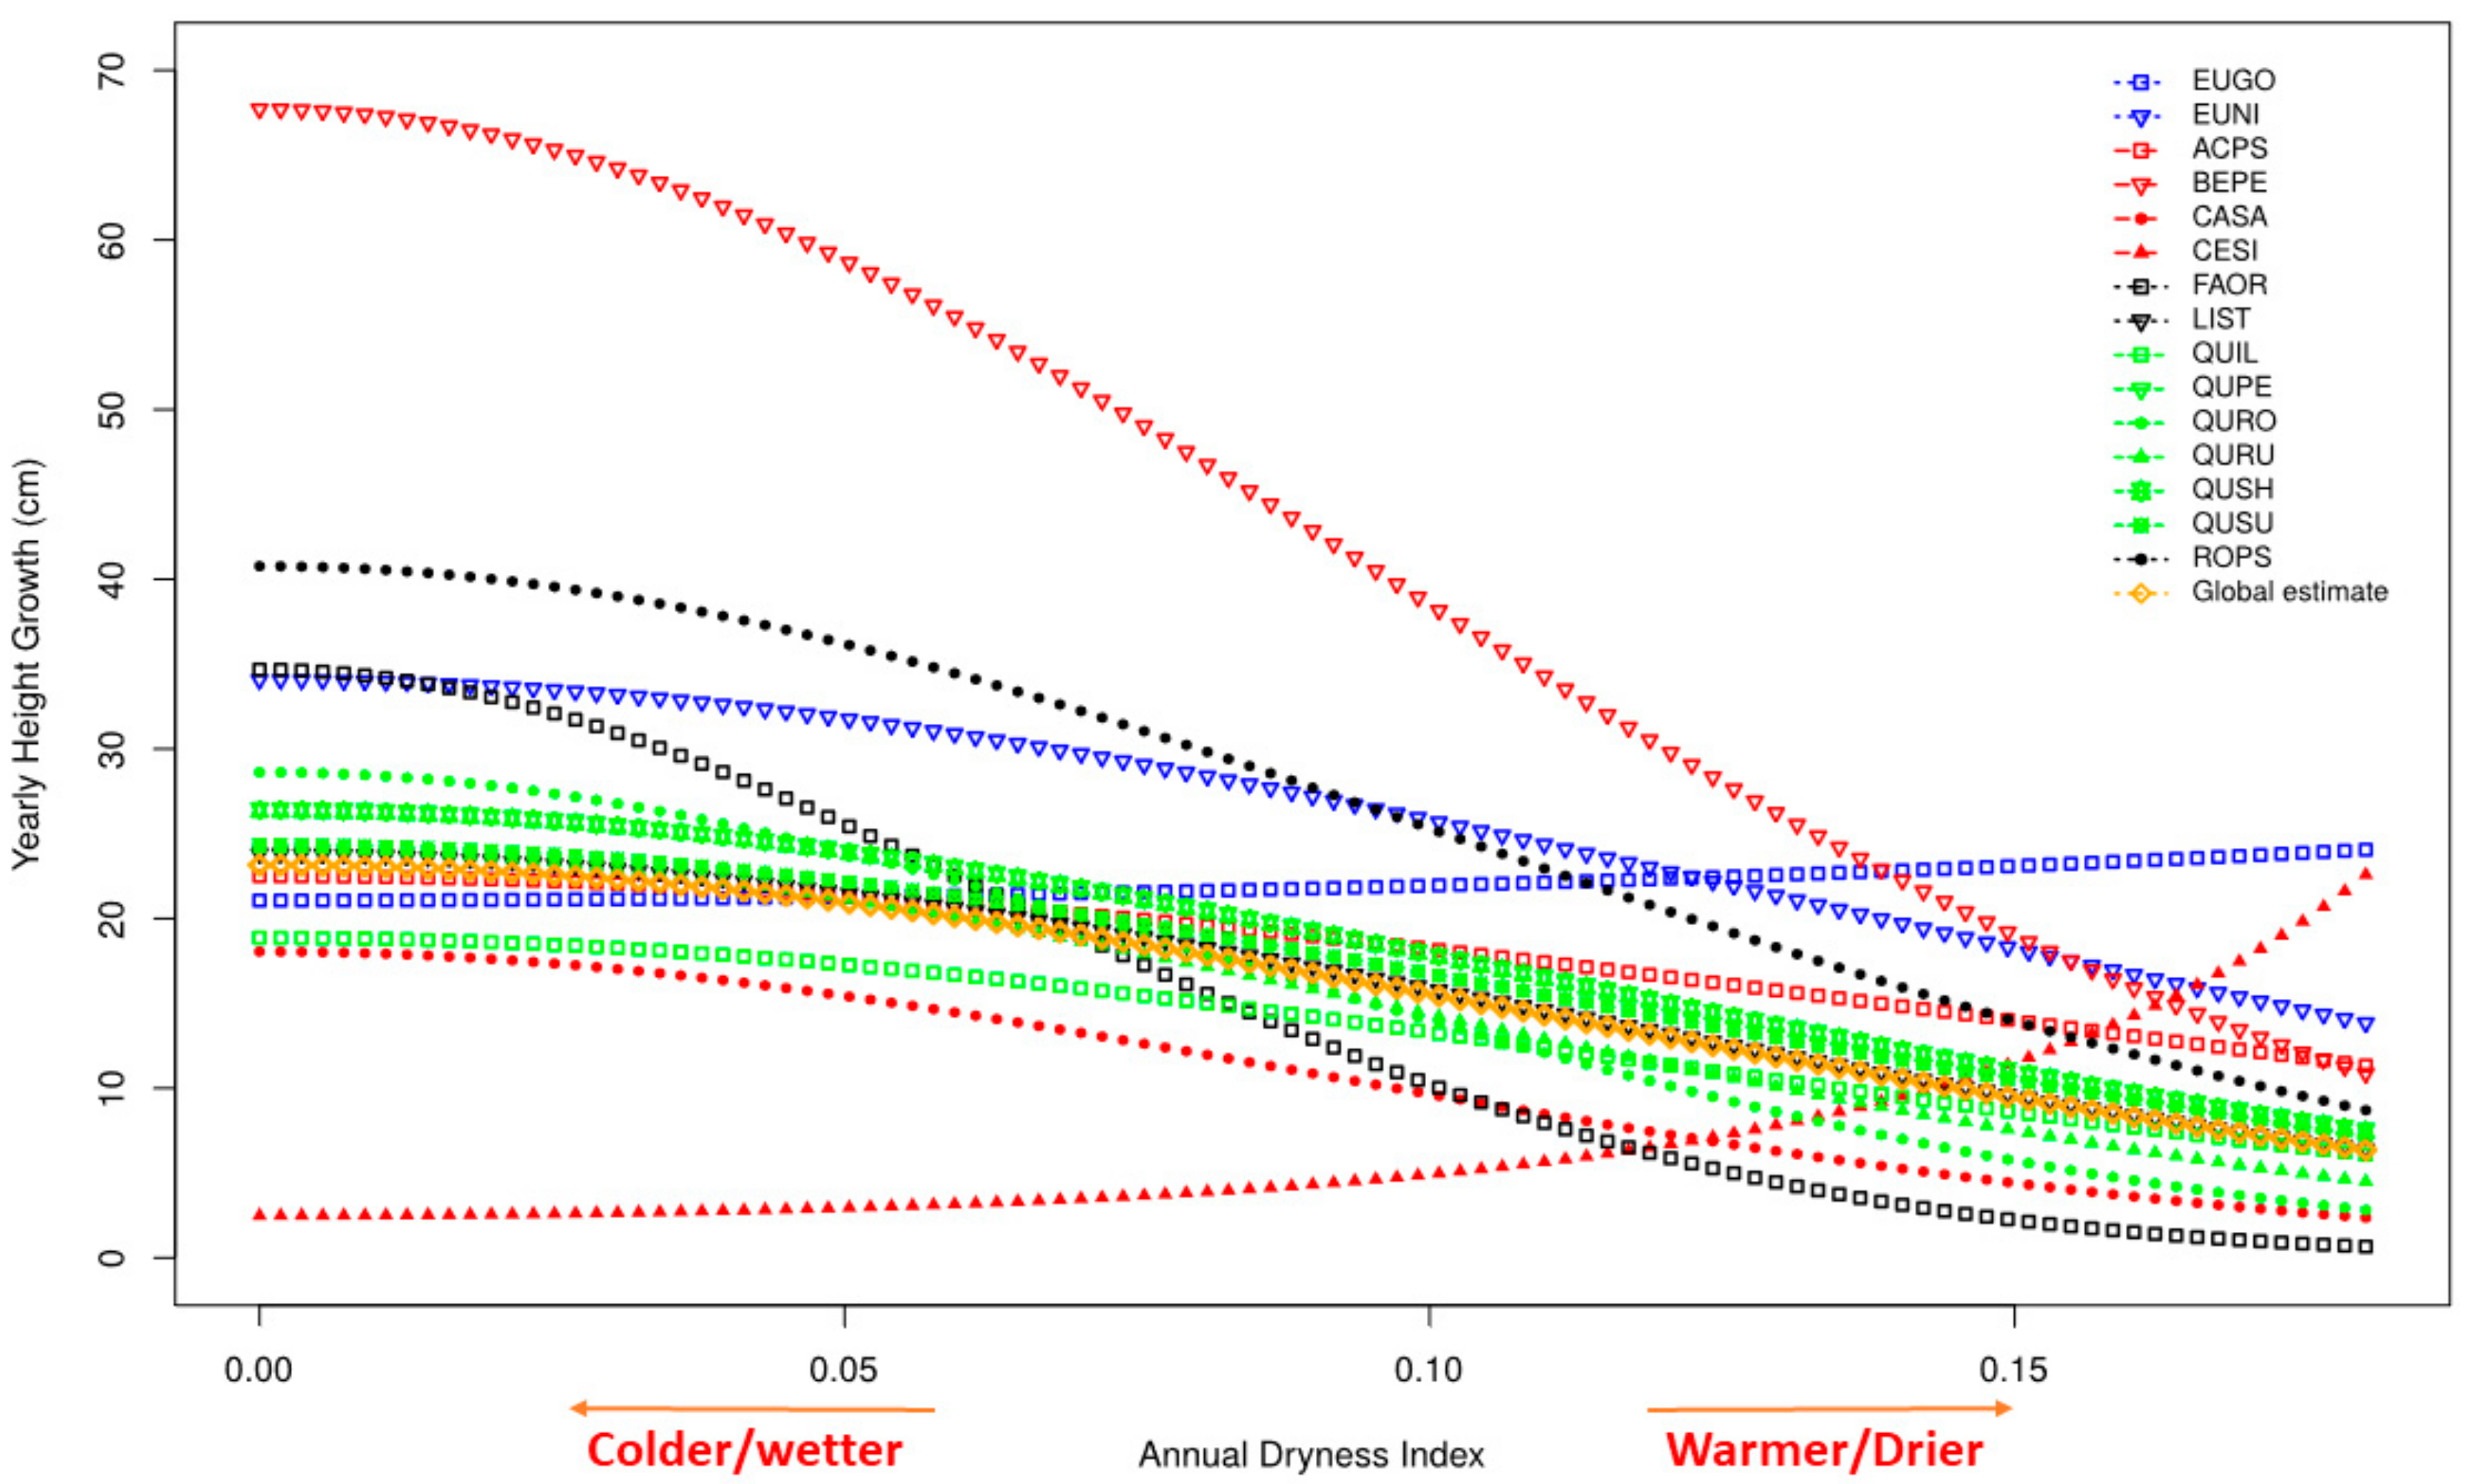
3.3. Growth
4. Discussion
4.1. Growth
4.2. Survival
4.3. Trade-Offs for Adaptation
5. Conclusions
Supplementary Materials
Author Contributions
Funding
Acknowledgments
Conflicts of Interest
References
- IPCC. Summary for Policymakers. In Climate Change 2014: Impacts, Adaptation, and Vulnerability. Part A: Global and Sectoral Aspects. Contribution of Working Group II to the Fifth Assessment Report of the Intergovernmental Panel on Climate Change; Field, C.B., Barros, V.R., Dokken, D.J., Mach, K.J., Mastrandrea, M.D., Bilir, T.E., Chatterjee, M., Ebi, K.L., Estrada, Y.O., Genova, R.C., et al., Eds.; Cambridge University Press: Cambridge, UK; New York, NY, USA, 2014; pp. 1–32. [Google Scholar]
- Erickson, V.; Aubry, C.; Berrang, P.; Blush, T.; Bower, A.; Crane, B.; Gwaze, D.; Hamlin, J.; Horning, M.; Johnson, R.; et al. Genetic resource Management and Climate Change: Genetic Options for Adapting National Forests to Climate Change. USDA For. Serv. For. Manag. 2012. Unnumbered publication. [Google Scholar]
- Regato, P. Adapting to Global Change Mediterranean Forests; IUCN-The World Conservation Union: Malaga, Spain, 2008; ISBN 978-2-8317-1098-3. [Google Scholar]
- Climate Change in Portugal–SIAM Scenarios–Impacts and Adaptation Measures. Available online: https://www.researchgate.net/publication/260554169_Climate_Change_in_Portugal_-_SIAM_Scenarios_-_Impacts_and_Adaptation_Measures (accessed on 10 August 2018).
- Natalini, F.; Alejano, R.; Vázquez-Piqué, J.; Cañellas, I.; Gea-Izquierdo, G. The role of climate change in the widespread mortality of holm oak in open woodlands of Southwestern Spain. Dendrochronologia 2016, 38, 51–60. [Google Scholar] [CrossRef]
- Ciesla, W.M.; Donaubauer, E. Decline and Dieback of Trees and Forests: A Global Overview; Food and Agriculture Organization United Nations (FAO): Rome, Italy, 1994; p. 120. [Google Scholar]
- Auclair, A.N.D. Extreme climatic fluctuations as a cause of forest dieback in the Pacific Rim. Water Air Soil Pollut. 1993, 66, 207–229. [Google Scholar] [CrossRef]
- De Boeck, H.J.; Van De Velde, H.; De Groote, T.; Nijs, I. Ideas and perspectives: Heat stress: More than hot air. Biogeosciences 2016, 13, 5821–5825. [Google Scholar] [CrossRef]
- Augspurger, C.K. Spring 2007 warmth and frost: Phenology, damage and refoliation in a temperate deciduous forest. Funct. Ecol. 2009, 23, 1031–1039. [Google Scholar] [CrossRef]
- Lindner, M.; Fitzgerald, J.B.; Zimmermann, N.E.; Reyer, C.; Delzon, S.; van der Maaten, E.; Schelhaas, M.-J.; Lasch, P.; Eggers, J.; van der Maaten-Theunissen, M.; et al. Climate change and European forests: What do we know, what are the uncertainties, and what are the implications for forest management? J. Environ. Manag. 2014, 146, 69–83. [Google Scholar] [CrossRef] [PubMed]
- Scharnweber, T.; Manthey, M.; Criegee, C.; Bauwe, A.; Schröder, C.; Wilmking, M. Drought matters–Declining precipitation influences growth of Fagus sylvatica L. and Quercus robur L. in north-eastern Germany. For. Ecol. Manag. 2011, 262, 947–961. [Google Scholar] [CrossRef]
- Salmela, M.J. Rethinking local adaptation: Mind the environment! For. Ecol. Manag. 2014, 312, 271–281. [Google Scholar] [CrossRef]
- Bréda, N.; Peiffer, M. Vulnerability to forest decline in a context of climate changes: New prospects about an old question in forest ecology. Ann. For. Sci. 2014, 71, 627–631. [Google Scholar] [CrossRef]
- Chakraborty, D.; Wang, T.; Andre, K.; Konnert, M.; Lexer, M.J.; Matulla, C.; Schueler, S. Selecting populations for non-analogous climate conditions using universal response functions: The case of douglas-fir in central Europe. PLoS ONE 2015, 10, e0136357. [Google Scholar] [CrossRef] [PubMed]
- Adams, S.H. The Impact of Changing Climate on Tree Growth and Wood Quality of Sitka Spruce. Ph.D. Thesis, University of Glasgow, Glasgow, UK, 2014. [Google Scholar]
- Hacura, J.; Gryc, V.; Vavrčík, H.; Hozová, J. The Effect OF Drought on Cell Wall Thickness and Radial Dimension of Tracheids of Picea abies (L.) karst. Wood Res. 2015, 60, 175–188. [Google Scholar]
- Biogeographical Regions. Available online: https://www.eea.europa.eu/data-and-maps/data/biogeographical-regions-europe-3 (accessed on 19 September 2018).
- Orazio, C.; Debets, R.C.; Cantero, L.D.L.A.; Casero, J.D.; Recio, C.P.; Bravo, F.; Bengoetxea, N.G.; González, A.A.; Jinks, R.; Paillassa, E.; et al. Arboretum and Demonstration Site Catalogue REINFFORCE (REsource INFrastructures for Monitoring, Adapting and Protecting European Atlantic FORests under Changing Climate); IEFC-EFIATLANTIC: Cestas, France, 2013; ISBN 978-2-9519296-1-9. [Google Scholar]
- Mareschal, B.; Brans, J.P.; Vincke, P. Prométhée: A New Family of Outranking Methods in Multicriteria Analysis; ULB Institutional Repository, ULB (Universite Libre de Bruxelles): Brussels, Belgium, 1984. [Google Scholar]
- Fick, S.E.; Hijmans, R.J. WorldClim 2: New 1-km spatial resolution climate surfaces for global land areas. Int. J. Clim. 2017, 37, 4302–4315. [Google Scholar] [CrossRef]
- Sáenz-Romero, C.; Lamy, J.B.; Ducousso, A.; Musch, B.; Ehrenmann, F.; Delzon, S.; Cavers, S.; Chałupka, W.; Dağdaş, S.; Hansen, J.K.; et al. Adaptive and plastic responses of Quercus petraea populations to climate across Europe. Glob. Chang. Biol. 2017, 23, 2831–2847. [Google Scholar] [CrossRef] [PubMed]
- Rehfeldt, G.E.; Worrall, J.J.; Marchetti, S.B.; Crookston, N.L. Adapting forest management to climate change using bioclimate models with topographic drivers. Forestry 2015, 88, 528–539. [Google Scholar] [CrossRef]
- Greer, B.T.; Still, C.; Howe, G.T.; Tague, C.; Roberts, D.A. Populations of aspen (Populus tremuloides Michx.) with different evolutionary histories differ in their climate occupancy. Ecol. Evol. 2016, 6, 3032–3039. [Google Scholar] [CrossRef] [PubMed]
- Matyas, C. Modeling climate change effects with provenance test data. Tree Physiol 1994, 14, 797–804. [Google Scholar] [CrossRef] [PubMed]
- Leites, L.P.; Robinson, A.P.; Rehfeldt, G.E.; Marshall, J.D.; Crookston, N.L. Height-growth response to climatic changes differs among populations of Douglas-fir: A novel analysis of historic data. Ecol. Appl. 2012, 22, 154–165. [Google Scholar] [CrossRef] [PubMed]
- Beauregard, F.; de Blois, S. Beyond a Climate-Centric View of Plant Distribution: Edaphic Variables Add Value to Distribution Models. PLoS ONE 2014, 9, e92642. [Google Scholar] [CrossRef] [PubMed]
- Sampson, D.A.; Wynne, R.H.; Seiler, J.R. Edaphic and climatic effects on forest stand development, net primary production, and net ecosystem productivity simulated for Coastal Plain loblolly pine in Virginia: Carbon fluxes of coastal plain loblolly pine. J. Geophys. Res. 2008, 113. [Google Scholar] [CrossRef]
- Ma, J.; Hu, Y.; Bu, R.; Chang, Y.; Deng, H.; Qin, Q. Predicting Impacts of Climate Change on the Aboveground Carbon Sequestration Rate of a Temperate Forest in Northeastern China. PLoS ONE 2014, 9, e96157. [Google Scholar] [CrossRef] [PubMed]
- Frank, D.C.; Poulter, B.; Saurer, M.; Esper, J.; Huntingford, C.; Helle, G.; Treydte, K.; Zimmermann, N.E.; Schleser, G.H.; Ahlström, A.; et al. Water-use efficiency and transpiration across European forests during the Anthropocene. Nat. Clim. Chang. 2015, 5, 579–583. [Google Scholar] [CrossRef]
- Sanchez, A.; Hughes, N.M.; Smith, W.K. Leaf/shoot level ecophysiology in two broadleaf and two needle-leaf species under representative cloud regimes at alpine treeline. J. Plant Ecol. 2016, 9, 762–772. [Google Scholar] [CrossRef]
- Orazio, C.; Stojnic, S.; Stojanović, D.; Gartzia, N.; Hayes, S. The Influence of Climate Change on European Forests and the Forest Sector. Available online: http://www.efiatlantic.efi.int/files/attachments/efiatlantic/2012_rokfor/efi_rokfor_climate_change_a4_210113.pdf (accessed on 8 August 2018).
- Wang, T.; O’Neill, G.A.; Aitken, S.N. Integrating environmental and genetic effects to predict responses of tree populations to climate. Ecol. Appl. 2010, 20, 153–163. [Google Scholar] [CrossRef] [PubMed]
- Kapeller, S.; Lexer, M.J.; Geburek, T.; Hiebl, J.; Schueler, S. Intraspecific variation in climate response of Norway spruce in the eastern Alpine range Selecting appropriate provenances for future climate. For. Ecol. Manag. 2012, 271, 46–57. [Google Scholar] [CrossRef]
- Valladares, F.; Matesanz, S.; Guilhaumon, F.; Araújo, M.B.; Balaguer, L.; Benito-Garzón, M.; Cornwell, W.; Gianoli, E.; van Kleunen, M.; Naya, D.E.; et al. The effects of phenotypic plasticity and local adaptation on forecasts of species range shifts under climate change. Ecol. Lett. 2014, 17, 1351–1364. [Google Scholar] [CrossRef] [PubMed]
- Yang, J.; Pedlar, J.H.; McKenney, D.W.; Weersink, A. The development of universal response functions to facilitate climate-smart regeneration of black spruce and white pine in Ontario, Canada. For. Ecol. Manag. 2015, 339, 34–43. [Google Scholar] [CrossRef]
- Eriksson, G.; Ekberg, I.; Clapham, D. Genetics Applied to Forestry; Department of Plant Biology and Forest Genetics, Swedish University of Agricultural Sciences: Uppsala, Sweden, 2013; ISBN 978-91-576-9187-3. [Google Scholar]
- Bates, D.; Mächler, M.; Bolker, B.; Walker, S. Fitting Linear Mixed-Effects Models Using lme4. J. Stat. Softw. 2015, 67. [Google Scholar] [CrossRef]
- Anandhi, A. Growing degree days–Ecosystem indicator for changing diurnal temperatures and their impact on corn growth stages in Kansas. Ecol. Indic. 2016, 61, 149–158. [Google Scholar] [CrossRef]
- Zuur, A.F.; Ieno, E.N.; Elphick, C.S. A protocol for data exploration to avoid common statistical problems. Methods Ecol. Evol. 2010, 1, 3–14. [Google Scholar] [CrossRef]
- Fine, P.V.A. Ecological and Evolutionary Drivers of Geographic Variation in Species Diversity. Annu. Rev. Ecol. Evol. Syst. 2015, 46, 369–392. [Google Scholar] [CrossRef]
- Franks, S.J.; Weber, J.J.; Aitken, S.N. Evolutionary and plastic responses to climate change in terrestrial plant populations. Evol. Appl. 2014, 7, 123–139. [Google Scholar] [CrossRef] [PubMed]
- Nakagawa, S.; Schielzeth, H. A general and simple method for obtaining R2 from generalized linear mixed-effects models. Methods Ecol. Evol. 2013, 4, 133–142. [Google Scholar] [CrossRef]
- Johnson, P.C.D. Extension of Nakagawa & Schielzeth’s R2 GLMM to random slopes models. Methods Ecol. Evol. 2014, 5, 944–946. [Google Scholar] [CrossRef] [PubMed]
- Austin, P.C.; Steyerberg, E.W. Interpreting the concordance statistic of a logistic regression model: Relation to the variance and odds ratio of a continuous explanatory variable. BMC Med. Res. Methodol. 2012, 12. [Google Scholar] [CrossRef] [PubMed]
- Coping with Climate Change: The Roles of Genetic Resources for Food and Agriculture; Food and Agriculture Organization of the United Nations: Rome, Italy, 2015; ISBN 978-92-5-108441-0.
- Keenan, R.J. Climate change impacts and adaptation in forest management: A review. Ann. For. Sci. 2015, 72, 145–167. [Google Scholar] [CrossRef]
- Wyka, T.P.; Oleksyn, J.; Żytkowiak, R.; Karolewski, P.; Jagodziński, A.M.; Reich, P.B. Responses of leaf structure and photosynthetic properties to intra-canopy light gradients: A common garden test with four broadleaf deciduous angiosperm and seven evergreen conifer tree species. Oecologia 2012, 170, 11–24. [Google Scholar] [CrossRef] [PubMed]
- Way, D.A.; Oren, R. Differential responses to changes in growth temperature between trees from different functional groups and biomes: A review and synthesis of data. Tree Physiol. 2010, 30, 669–688. [Google Scholar] [CrossRef] [PubMed]
- Melun, F.; Sud-ouest, S.; Sivaillan-Les-Lamberts, D. De Eucalyptus Gundal: Une Espèce Remarquable Pour la Production de Biomasse. Available online: https://www.fcba.fr/sites/default/files/gundal_fcba_info.pdf (accessed on 10 August 2018).
- Leslie, A.D.; Mencuccini, M.; Perks, M. The potential for Eucalyptus as a wood fuel in the UK. Appl. Energy 2012, 89, 176–182. [Google Scholar] [CrossRef]
- Dagley, C.M.; Berrill, J.-P.; Johnson, F.T.; Kerhoulas, L.P. Adaptation to Climate Change? Moving Coast Redwood Seedlings Northward and Inland; General Technical Report (GTR): PSW-GTR-258; U.S. Department of Agriculture, Forest Service: Albany, CA, USA, 2017. [Google Scholar]
- Resende, R.T.; Soares, A.A.V.; Forrester, D.I.; Marcatti, G.E.; dos Santos, A.R.; Takahashi, E.K.; e Silva, F.F.; Grattapaglia, D.; Resende, M.D.V.; Leite, H.G. Environmental uniformity, site quality and tree competition interact to determine stand productivity of clonal Eucalyptus. For. Ecol. Manag. 2018, 410, 76–83. [Google Scholar] [CrossRef]
- Kirilenko, A.P.; Sedjo, R.A. Climate change impacts on forestry. Proc. Natl. Acad. Sci. USA 2007, 104, 19697–19702. [Google Scholar] [CrossRef] [PubMed]
- Houle, G.; Delwaide, A. Population structure and growth-stress relationship of Pinus taeda in rock outcrop habitats. J. Veg. Sci. 1991, 2, 47–58. [Google Scholar] [CrossRef]
- Nedlo, J.E.; Martin, T.A.; Vose, J.M.; Teskey, R.O. Growing season temperatures limit growth of loblolly pine (Pinus taeda L.) seedlings across a wide geographic transect. Trees 2009, 23, 751–759. [Google Scholar] [CrossRef]
- Parker, K.C.; Jensen, C.; Parker, A.J. The Growth response of slash pine (Pinus elliottii) to climate in the Georgia Coastal Plain. Dendrochronologia 2014, 32, 127–136. [Google Scholar] [CrossRef]
- Gratani, L. Plant Phenotypic Plasticity in Response to Environmental Factors. Adv. Bot. 2014, 2014, 17. [Google Scholar] [CrossRef]
- Breed, M.F.; Stead, M.G.; Ottewell, K.M.; Gardner, M.G.; Lowe, A.J. Which provenance and where? Seed sourcing strategies for revegetation in a changing environment. Conserv. Genet. 2013, 14, 1–10. [Google Scholar] [CrossRef]


| Explanatory Variable | Code | Unit | Transformation |
|---|---|---|---|
| Mean daily air temperature | T_mean | °C | 1/100 |
| Mean Maximum daily temperature | T_max | °C | 1/100 |
| Mean Minimum daily temperature | T_min | °C | 1/100 |
| Extreme Minimum air temperature | Ext_T_min | °C | 1/100 |
| Extreme Maximum air temperature | Ext_T_max | °C | 1/100 |
| Annual Precipitation | p | mm | 1/1000 |
| Growing Season Precipitation | GSP | mm | 1/1000 |
| Summer Precipitation | SP | mm | 1/1000 |
| Growing Season Degree Days >5 °C | GSDD | °Cd | 1/10,000 |
| Degree Days >5 °C | DD5 | °C | 1/10,000 |
| Annual Dryness Index | ADI | √°Cd/mm | |
| Growing Season Dryness Index | GSDI | √°Cd/mm | |
| Dependent Variable | Code | Unit | Transformation |
| Yearly Height Growth | Height | cm | Log |
| Survival | Survival | Alive/Dead binary | LOGIT |
| Survival | ||||||
|---|---|---|---|---|---|---|
| Conifer | Broadleaf | |||||
| Fixed Part | Estimate | % Variance | p Value | Estimate | % Variance | p Value |
| Intercept | 4.661 | <0.001 | 1.918 | <0.001 | ||
| Precipitation Climate Distance/100 | −0.022 | 0.001 | ||||
| Site Growing Season Degree Days >5 °C | −1.527 | 0.026 | ||||
| Random Part | ||||||
| Site (Intercept) | 11.845 | 39.088 | ||||
| Species (Intercept) | 57.277 | 30.402 | ||||
| Provenances within Species (Intercept) | 4.352 | 30.510 | ||||
| Species (Slope) | 26.527 | |||||
| AIC | 12,497.9 | 10,932.6 | ||||
| C Index | 0.719 | 0.730 | ||||
| Yearly Height Growth (Log) | ||||||
|---|---|---|---|---|---|---|
| Conifer | Broadleaf | |||||
| Fixed Part | Estimate | % Variance | p Value | Estimate | % Variance | p Value |
| Intercept | 3.339 | <0.001 | 3.142 | <0.001 | ||
| Site ADI2 | −69.006 | <0.001 | −39.903 | 0.046 | ||
| Random Part | ||||||
| Site (Intercept) | 0.007 | 0.012 | ||||
| Species (Intercept) | 0.019 | 0.031 | ||||
| Provenances within Species (Intercept) | 0.015 | 0.002 | ||||
| Species (Slope) | 99.933 | 99.933 | ||||
| Residual | 0.026 | 0.023 | ||||
| AIC | 17,370.589 | 21,208.356 | ||||
| R2 marginal | 0.108 | 0.035 | ||||
| R2 conditional | 0.651 | 0.641 | ||||
© 2018 by the authors. Licensee MDPI, Basel, Switzerland. This article is an open access article distributed under the terms and conditions of the Creative Commons Attribution (CC BY) license (http://creativecommons.org/licenses/by/4.0/).
Share and Cite
Correia, A.H.; Almeida, M.H.; Branco, M.; Tomé, M.; Cordero Montoya, R.; Di Lucchio, L.; Cantero, A.; Diez, J.J.; Prieto-Recio, C.; Bravo, F.; et al. Early Survival and Growth Plasticity of 33 Species Planted in 38 Arboreta across the European Atlantic Area. Forests 2018, 9, 630. https://doi.org/10.3390/f9100630
Correia AH, Almeida MH, Branco M, Tomé M, Cordero Montoya R, Di Lucchio L, Cantero A, Diez JJ, Prieto-Recio C, Bravo F, et al. Early Survival and Growth Plasticity of 33 Species Planted in 38 Arboreta across the European Atlantic Area. Forests. 2018; 9(10):630. https://doi.org/10.3390/f9100630
Chicago/Turabian StyleCorreia, António Henrique, Maria Helena Almeida, Manuela Branco, Margarida Tomé, Rebeca Cordero Montoya, Luisa Di Lucchio, Alejandro Cantero, Julio J. Diez, Cristina Prieto-Recio, Felipe Bravo, and et al. 2018. "Early Survival and Growth Plasticity of 33 Species Planted in 38 Arboreta across the European Atlantic Area" Forests 9, no. 10: 630. https://doi.org/10.3390/f9100630
APA StyleCorreia, A. H., Almeida, M. H., Branco, M., Tomé, M., Cordero Montoya, R., Di Lucchio, L., Cantero, A., Diez, J. J., Prieto-Recio, C., Bravo, F., Gartzia, N., Arias, A., Jinks, R., Paillassa, E., PASTUSZKA, P., Rozados Lorenzo, M. J., Silva Pando, F. J., Traver, M. C., Zabalza, S., ... Orazio, C. (2018). Early Survival and Growth Plasticity of 33 Species Planted in 38 Arboreta across the European Atlantic Area. Forests, 9(10), 630. https://doi.org/10.3390/f9100630