Article

Rating a Wildfire Mitigation Strategy with an Insurance Premium: A Boreal Forest Case Study

by
Georgina Rodriguez-Baca
1,*,
Frédéric Raulier
1 and
Alain Leduc
2
1
Centre d’Étude de la Forêt, Faculté de foresterie, de géographie et de géomatique, Université Laval, 2405 rue de la Terrasse, Québec, QC G1V 0A6, Canada
2
Centre d’étude de la forêt, Université du Québec à Montréal, C. P. 8888, Succursale centre-ville, Montréal, QC H3C 3P8, Canada
*
Author to whom correspondence should be addressed.
Forests 2016, 7(5), 107; https://doi.org/10.3390/f7050107
Submission received: 10 March 2016 / Revised: 28 April 2016 / Accepted: 10 May 2016 / Published: 13 May 2016

Abstract

:
Risk analysis entails the systematic use of historical information to determine the frequency, magnitude and effects of unexpected events. Wildfire in boreal North America is a key driver of forest dynamics and may cause very significant economic losses. An actuarial approach to risk analysis based on cumulative probability distributions was developed to reduce the adverse effects of wildfire. To this effect, we developed spatially explicit landscape models to simulate the interactions between harvest, fire and forest succession over time in a boreal forest of eastern Canada. We estimated the amount of reduction of timber harvest necessary to build a buffer stock of sufficient size to cover fire losses and compared it to an insurance premium estimated in units of timber volume from the probability of occurrence and the amount of damage. Overall, the timber harvest reduction we applied was much more costly than the insurance premium even with a zero interest rate. This is due to the fact that the insurance premium is directly related to risk while the timber harvest reduction is not and, as a consequence, is much less efficient. These results, especially the comparison with a standard indicator such as an insurance premium, have useful implications at the time of choosing a mitigation strategy to protect timber supplies against risk without overly diminishing the provision of services from the forest. They are also promoting the use of insurance against disastrous events in forest management planning.

1. Introduction

Human activities depend on the sustainability of natural resources and proving sustainability requires making forecasts. In forest management, uncertainty is an important issue in the support of any planning decision and in evaluating the consequences of alternative strategies [1]. Uncertainty stems from known variability (risk), lack of knowledge (uncertainty), ignorance and indeterminacy [2]. Ignorance and indeterminacy are difficult to account for, cannot be anticipated and require scenario planning [3] or adaptive methods [2]. Risk and uncertainty are somewhat easier to evaluate beforehand with risk analysis methods [4]. Such analyses are required when there is a possibility that the outcome of an event can deviate from expectations and have a negative effect on an objective [5]. For instance, the negative effect of a disturbance on the profits from timber harvesting provides the cost of that disturbance [6]. Situations where risk and uncertainty are at the core of the problem—as it is in risk management—require different strategies and coherent risk measures [7]. The development of methods to account for risk and uncertainty has made considerable progress and they already play a role in environmental decision-making, particularly in cases of severe uncertainty due to extremely long planning horizons [8]. Although the application of risk analysis in forest planning remains rare [9], attention to risk analysis in forestry should grow even more in the coming years [10,11].
Forest managers should account for many different sources of risk and uncertainty, one of them being wildfire. Fire is a critical component of terrestrial and atmospheric dynamics [12] and is a primary driver of forest dynamics across the boreal forest region of North America. Fire is also a major source of risk and uncertainty that can cause important damages to timber resources [13]. Fire-dominated forests present challenges when designing forest management plans that maximize sustained and constant harvest volume flows because of the wide spatial and temporal variation in the frequency and severity of fire events [14]. In Canada, each year, fire burns large portions of the forest area which causes significant losses to management agencies [15]. Despite the uncertainty that characterizes forest management planning, most planning models used for strategic planning remain deterministic in North America [16,17]. Linear mathematical programming (LP) is the approach most often applied in practice to such planning problems [18,19], despite the fact that many other techniques exist [16], the assumption that all data are assumed to be known exactly and the fact that decisions made today with optimal solutions will probably be suboptimal in the future [20]. Incorporating a fire regime into timber harvest-level determination procedures leads to reductions in harvest levels when desiring a sustainable timber harvest [15,21,22]. Such reductions help implement a timber buffer stock, providing a contingency inventory in the case of unexpected timber losses. The implementation of such measures therefore implies losses of short-term revenues that must be thoroughly justified and understood.
Successful methods of dealing with uncertainty and risk need to be simple and comprehensible enough to be useful in planning and decision-making in forestry practice [23]. The best strategy for dealing with uncertainty depends on the risk preference of the decision makers, how much risk they are willing to face, and the degree of uncertainty involved. One example of a successful method is the cost-plus-loss analysis, which estimates the cost of sub-optimal decisions. It has been used effectively to justify the costs implied by sampling intensity in forest inventory [24,25], the cost of fire-fighting (examples provided in [14]) or the cost of forest planning [26]. In practice, the minimization of risk exposures and potential losses involves risk processes with one or more techniques considered in the context of financial and nonfinancial exposures [27]. Financial risk modelling refers to the use of formal econometric techniques to determine the aggregate risk of a financial portfolio that depends on the probability distributions of losses that can arise from damage. Actuaries combine the likelihood and size information to provide average, or expected losses [28]. For instance, Value at Risk (VaR) is a widely used risk measure [29], is easy to explain and easy to estimate [30,31]. In portfolio management, Bagajewicz and Barbaro [32] defined VaR as the worst expected loss under normal market conditions over a specific time interval and at a given confidence level. VaR has become a popular risk measure used by both regulated banks as well as investment practitioners. Although specific indicators such as VaR cannot guarantee the identification of the best risk-reduced solution, in many instances the use of different risk measures help identify potentially robust solutions.
With financial risk management, the expected loss is expressed in monetary terms. One loss-adaptation option is insurance [33]. Insurance transfers the cost of financing losses in exchange for a premium. For instance, a forest manager may seek to protect his planning decisions against wildfire and he can purchase an insurance policy from an insurer by paying a premium to receive a compensatory payment that should cover the loss generated by fire [27]. The determination of the premium to pay for the cover requires evaluating risk as an actuarial process of valuing the insurable risk, i.e., by summing the values at risk compounded at the start of the planning horizon. Such an insurance strategy covering losses caused by fires may be interesting if the interest rate is higher than the mean volume increment rate of the forest under study.
The idea of insurance in forestry is not new, it was proposed decades ago by Shepard [34,35] who noticed that the proper valuation of forest properties is a necessary prerequisite to any successful fire-insurance undertaking. Holecy and Hanewinkel [33] proposed an actuarial model calculating appropriate probabilities to estimate insurance premiums. Lankoande et al. [36] evaluated efficient wildfire insurance in the presence of government intervention through a subsidy for risk. Chen et al. [37] proposed an insurance instrument to protect timber owners against wildfire risks as a management instrument. Although insurance is an effective mechanism to lessen the burden of loss by wildfire and is simple to explain, studies in wildfire insurance still remain limited.
The main objective of this study was therefore to provide a comparative analysis of the alternative advantages produced by two different risk management strategies: insurance premium and timber harvest reduction to build a buffer stock of timber. In the context of planning and scheduling forest harvesting, the first aim of our study was thus to quantify potential harvest losses due to wildfire under an ecosystem-based management scenario in an eastern Canadian boreal forest. We used a linear programming (LP)-based timber harvest scheduling model to determine the maximum even-flow harvest volume a forest area can sustain over the planning horizon. Interaction between fire and harvest was simulated with a landscape dynamics model to evaluate harvest losses, insurance premium and amount of buffer stock required to cover such loss.

2. Materials and Methods
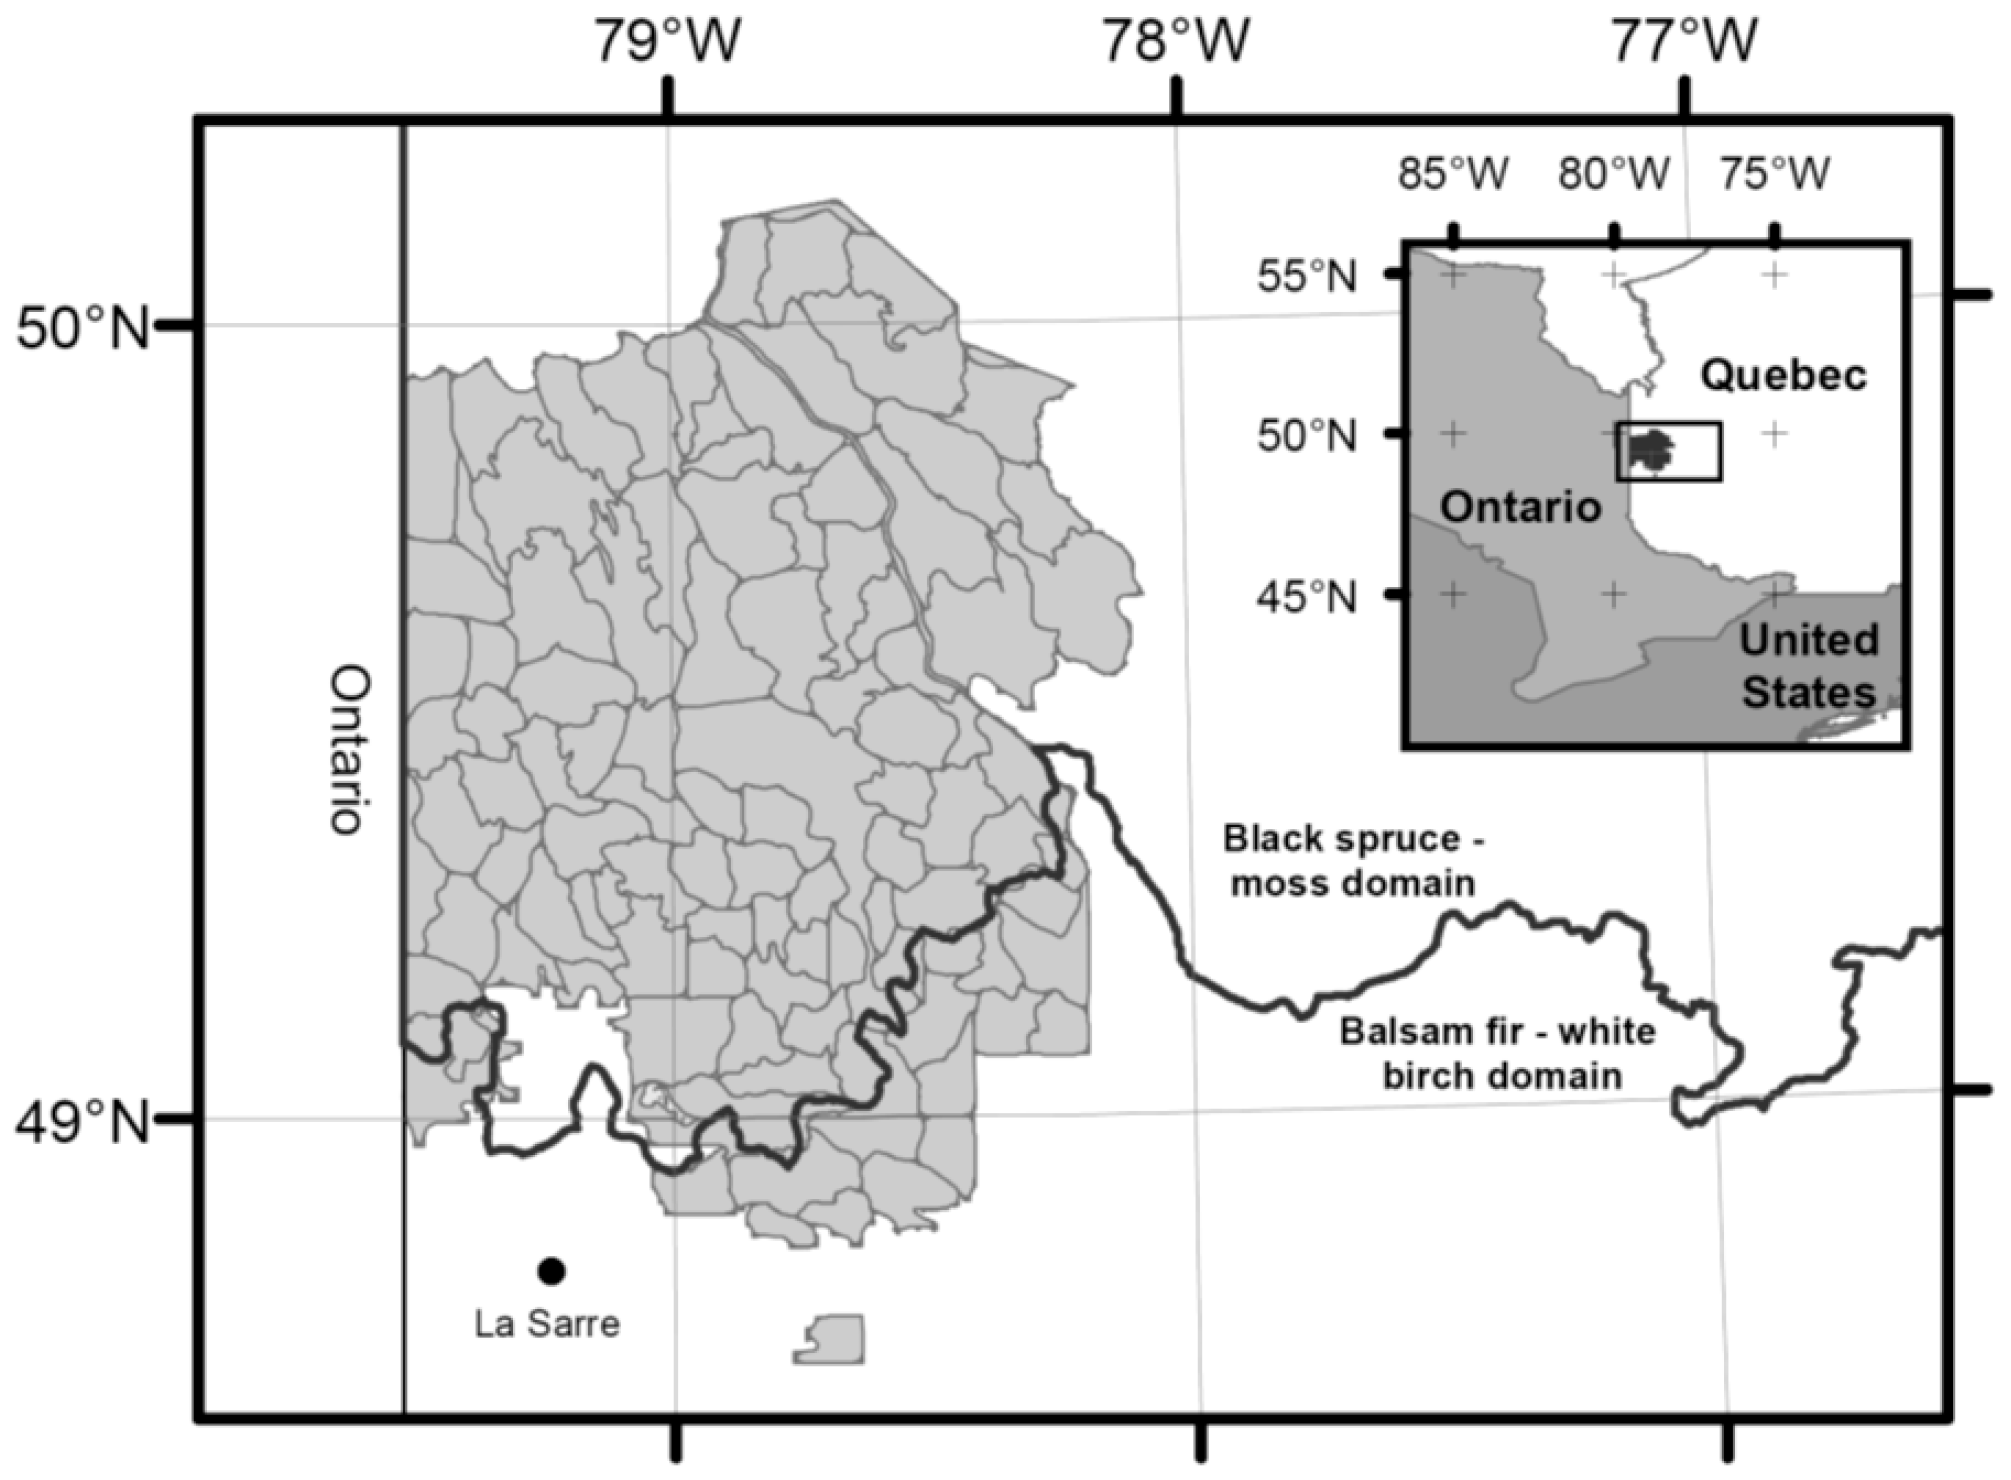
2.1. Study Area

The study area corresponds to the Forest Management Unit 085-51 located between 48°50′ N and 50°09′ N latitude, and between 78°05′ W and 79°31′ W longitude in western Quebec, Canada (Figure 1). It belongs to the bioclimatic domain of balsam fir-white birch to the south (14%) and black spruce-feather mosses to the north (86%) [38]. Mean annual temperature varies from −2.5 °C to 0 °C, and total precipitation from 700 to 800 mm. The area covers 1.08 million ha, of which 542,000 hectares are timber productive. Black spruce (Picea mariana (Mill.) B.S.P.) and jack pine (Pinus banksiana Lamb.) are the most abundant tree species and also the most economically important ones. Hardwoods such as trembling aspen (Populus tremuloides Michx) and white birch (Betula papyrifera Marsh.), and to a lesser extent, balsam poplar (Populus balsamifera) can also occur in mixture with black spruce. The forest dynamics in the region may be simplified into three main successional pathways either dominated by black spruce, jack pine or trembling aspen [39,40]. Fire dominates the natural disturbance regime in the study area [40,41]. Current (1920–2000) and past fire cycles (1850–1920) were estimated to be around 398 and 135 years [1]. Forest management planning should account for climate change as it should affect fire regimes in the boreal forest of North America [42]. For our study area, fire burn rate is projected to increase gradually over the period 2001–2100. Bergeron et al. [43] estimated that under B1 (2 × CO2) and A2 (3 × CO2) climate scenarios, fire cycles should lower to around 254 and 79 years respectively, values lying either in between the current and historical fire cycles [44] or below the historical fire cycle.

2.2. Timber Supply Model

We formulated the timber supply model as an optimization problem solved with linear programming, as it is the current practice in Quebec. No mitigation strategies were included at first against potential fire losses. The planning horizon was set to 150 years and divided into 30 periods of 5 years. The objective function of this model maximized harvest volume (i.e., Mm3/period) (Equation (1)). The first constraint provided an even flow of harvest volume over time (Equation (2)). For harvest planning purposes, the study area was divided into different spatially organized compartments (operating areas between 30 km2 and 150 km2) as a function of canopy closure and species composition [45] to emulate fire size distribution [46]. These operating areas are open to harvest when more than 30% of their timber productive area is eligible to harvest (Equation (3), [47]). Planting of jack pine after a clear-cut was limited to less than the actual plantation level (7500 ha per period (Equation (4))). A forest age structure was also targeted with a minimal abundance of three age classes (0–150 years: 63%, 150–275 years: 21% and more than 275 years: 16%) (Equation (5)) [41]. Two harvesting systems were implemented, careful logging around advanced regeneration [48] and irregular shelter-wood cuts (50% removal of merchantable volume; [49]). The areas planned to be harvested must be positive (Equation (6)).
Let
  • o : operational area  ( 1 107 )
  • s : successional pathway  ( 1 3 )
  • p : period  ( 1 30 )
  • a : stand age
  • h : harvest type  ( 1 2 )
  • c : cohort number  ( 1 3 )
T C : Timber production area belonging to cohort c ,  c ,  following the targeted forest structure
Variables
  • X o p = {   1 ,   if   operating   area   is   open   to   harvest 0 ,   otherwise   o , p
  • A a s h o p   : Area harvested  ( ha ) ,     a , s , h , o , p
  • e a s h o p : Area eligible for harvest  ( ha ) ,     a , s , h , o , p
  • C c p : Area belonging to cohort c  ( ha ) ,     c , p
Parameters
V a s h o p : Volume yield  ( m 3  ha 1 ) ,     a , s , h , o , p
Objective function
Z = a = 1 30 s = 1 3 o = 1 107 h = 1 2 p = 1 30 V a s o h p A a s o h p ,
Subject to
a = 1 30 s = 1 3 o = 1 107 h = 1 2 V a s o h ( p 1 ) A a s o h ( p 1 )   a = 1 30 s = 1 3 o = 1 107 h = 1 2 V a s o h p A a s o h p = 0   ,
A a s o h p e a s o h p X o p     a , s , o , h , p ,
A h p < = 7500 ,   h  being a clear cut followed by a jack pine plantation ,     p ,
C c p T c ,    c ;  p  [ 11 ;   30 ]   ,
A a s o p 0   .
To develop the timber supply model (Model II formulation—([50], pp. 608–611)), we used the Remsoft Spatial Planning System (version 2013.12, Remsoft, Fredericton, NB, Canada) and solved it with Mosek 5.0. (Mosek ApS, Copenhagen, Denmark).

2.3. Interaction between Harvest Scheduling and Stochastic Processes

We simulated the interaction existing between harvest, fire and forest succession by adapting pre-existing modules of harvest, fire and succession already developed in the Spatially Explicit Landscape Event Simulator (SELES) [51]. Inputs are spatial rasters (forest type, stand age, operating areas), data tables (e.g., yield curves, harvested area planned by harvesting systems per operating area and per period, matrix of succession probabilities, other parameters such as a mean burn rate and a mean fire size). Fire was modeled as a percolation process [52] parameterized from historical fire occurrence data [41] to reproduce basic characteristics of a fire regime [53]. The model uses a negative exponential distribution to determine the number of fires and a Weibull distribution to determine fire sizes [54]. Simulated fires burn independently of terrain, and there is equal forest flammability regardless of stand age [21,55]. The harvest module prioritized the harvest of salvageable volume (30% of pre-fire standing volume) and subsequently the harvest scheduled by the timber supply model. If the harvest module was not able to find the harvest volume planned in designed operating areas, then it selected productive stands (with a volume greater than 50 m3·ha−1) not prescribed in the harvest plan until it reached the targeted timber supply level. Disturbance-specific changes in forest composition and age structure drive the interactions between fire, succession and harvest. Natural succession was modelled as a semi-Markov process [53] with probabilities of transition estimated from the proportions of each stratum by stand age class (20-year interval) observed in the forest map. The spatial resolution of the model was 10 ha per pixel and the temporal resolution five years. We performed 100 replications of each scenario, which provided stable estimates of indicators, especially VaR [56]. We used the technique of common random numbers [57] to reduce the variability generated by random effects between the scenarios [58]. Simulation outputs allowed us to quantify loss likelihood distributions and estimate insurance premiums as detailed below.

2.4. Risk Management

Simulation results with the landscape dynamics model served to estimate loss distributions (frequency distributions of differences between planned and harvested volumes per period). Value at Risk served to assess risk was estimated with the 5th percentile (α) of the loss (L) distribution for a given period p (Equation (7)):
Prob  ( L p VaR p   ) = α .
VaR computation was performed using the R statistical software environment [59].

2.4.1. Risk Characterization

If fire risk is indeed part of the risk of timber supply disruptions, another part results from the inadequate consideration of fire risk in the timber supply planning process [15,60]. We have assumed with the timber supply model used in the present study (Section 2.2) that fire suppression is totally effective (i.e., no fire risk), which is not true [12] and, consequently, overly optimistic. Risk can therefore be subdivided into two different risk types, effective risk, when effectively implementing planned forest management strategies despite fire risk, and planning risk caused by the optimism of the planning procedure. To distinguish both sources of risk, we fixed a planned timber harvest (PTH) threshold below which PTH is equal to the median realized harvest level that has been simulated with the landscape dynamics model [60] and above which PTH cannot fully be implemented anymore because of fire disturbances. Below this threshold, risk of losses (difference between median and 5th percentile) is caused by fire risk only. Above this threshold, risk of losses is a compound of risks caused by fire and planning optimism.
To characterize risk, we therefore looked for three PTH values, one for which no risk exists (i.e., disruptions not occurring anymore, such that VaRp = 0, p), one for which risk is the highest while respecting all the constraints of the timber supply model and one for which PTH is equal to the median realized harvest level. We used the landscape simulation model for this purpose by decreasing the PTH originally estimated with the timber supply model by steps of 10% until no risk occurred anymore for three fire cycles. We then estimated the parameters of a piecewise linear model with one knot between realized harvest and planned timber supply values (Equation (8)):
h ˜ = P T H  if  P T H   P T H t h , h ˜ = P T H t h + β ( P T H P T H t h )  if  P T H > P T H t h ,
where h ˜ is the periodic median realized harvest implemented with the landscape simulation model, P T H is the timber harvest planned with the timber supply model and β and P T H t h are parameters estimated with the MODEL procedure (SAS Institute Inc., Cary, NC, USA).

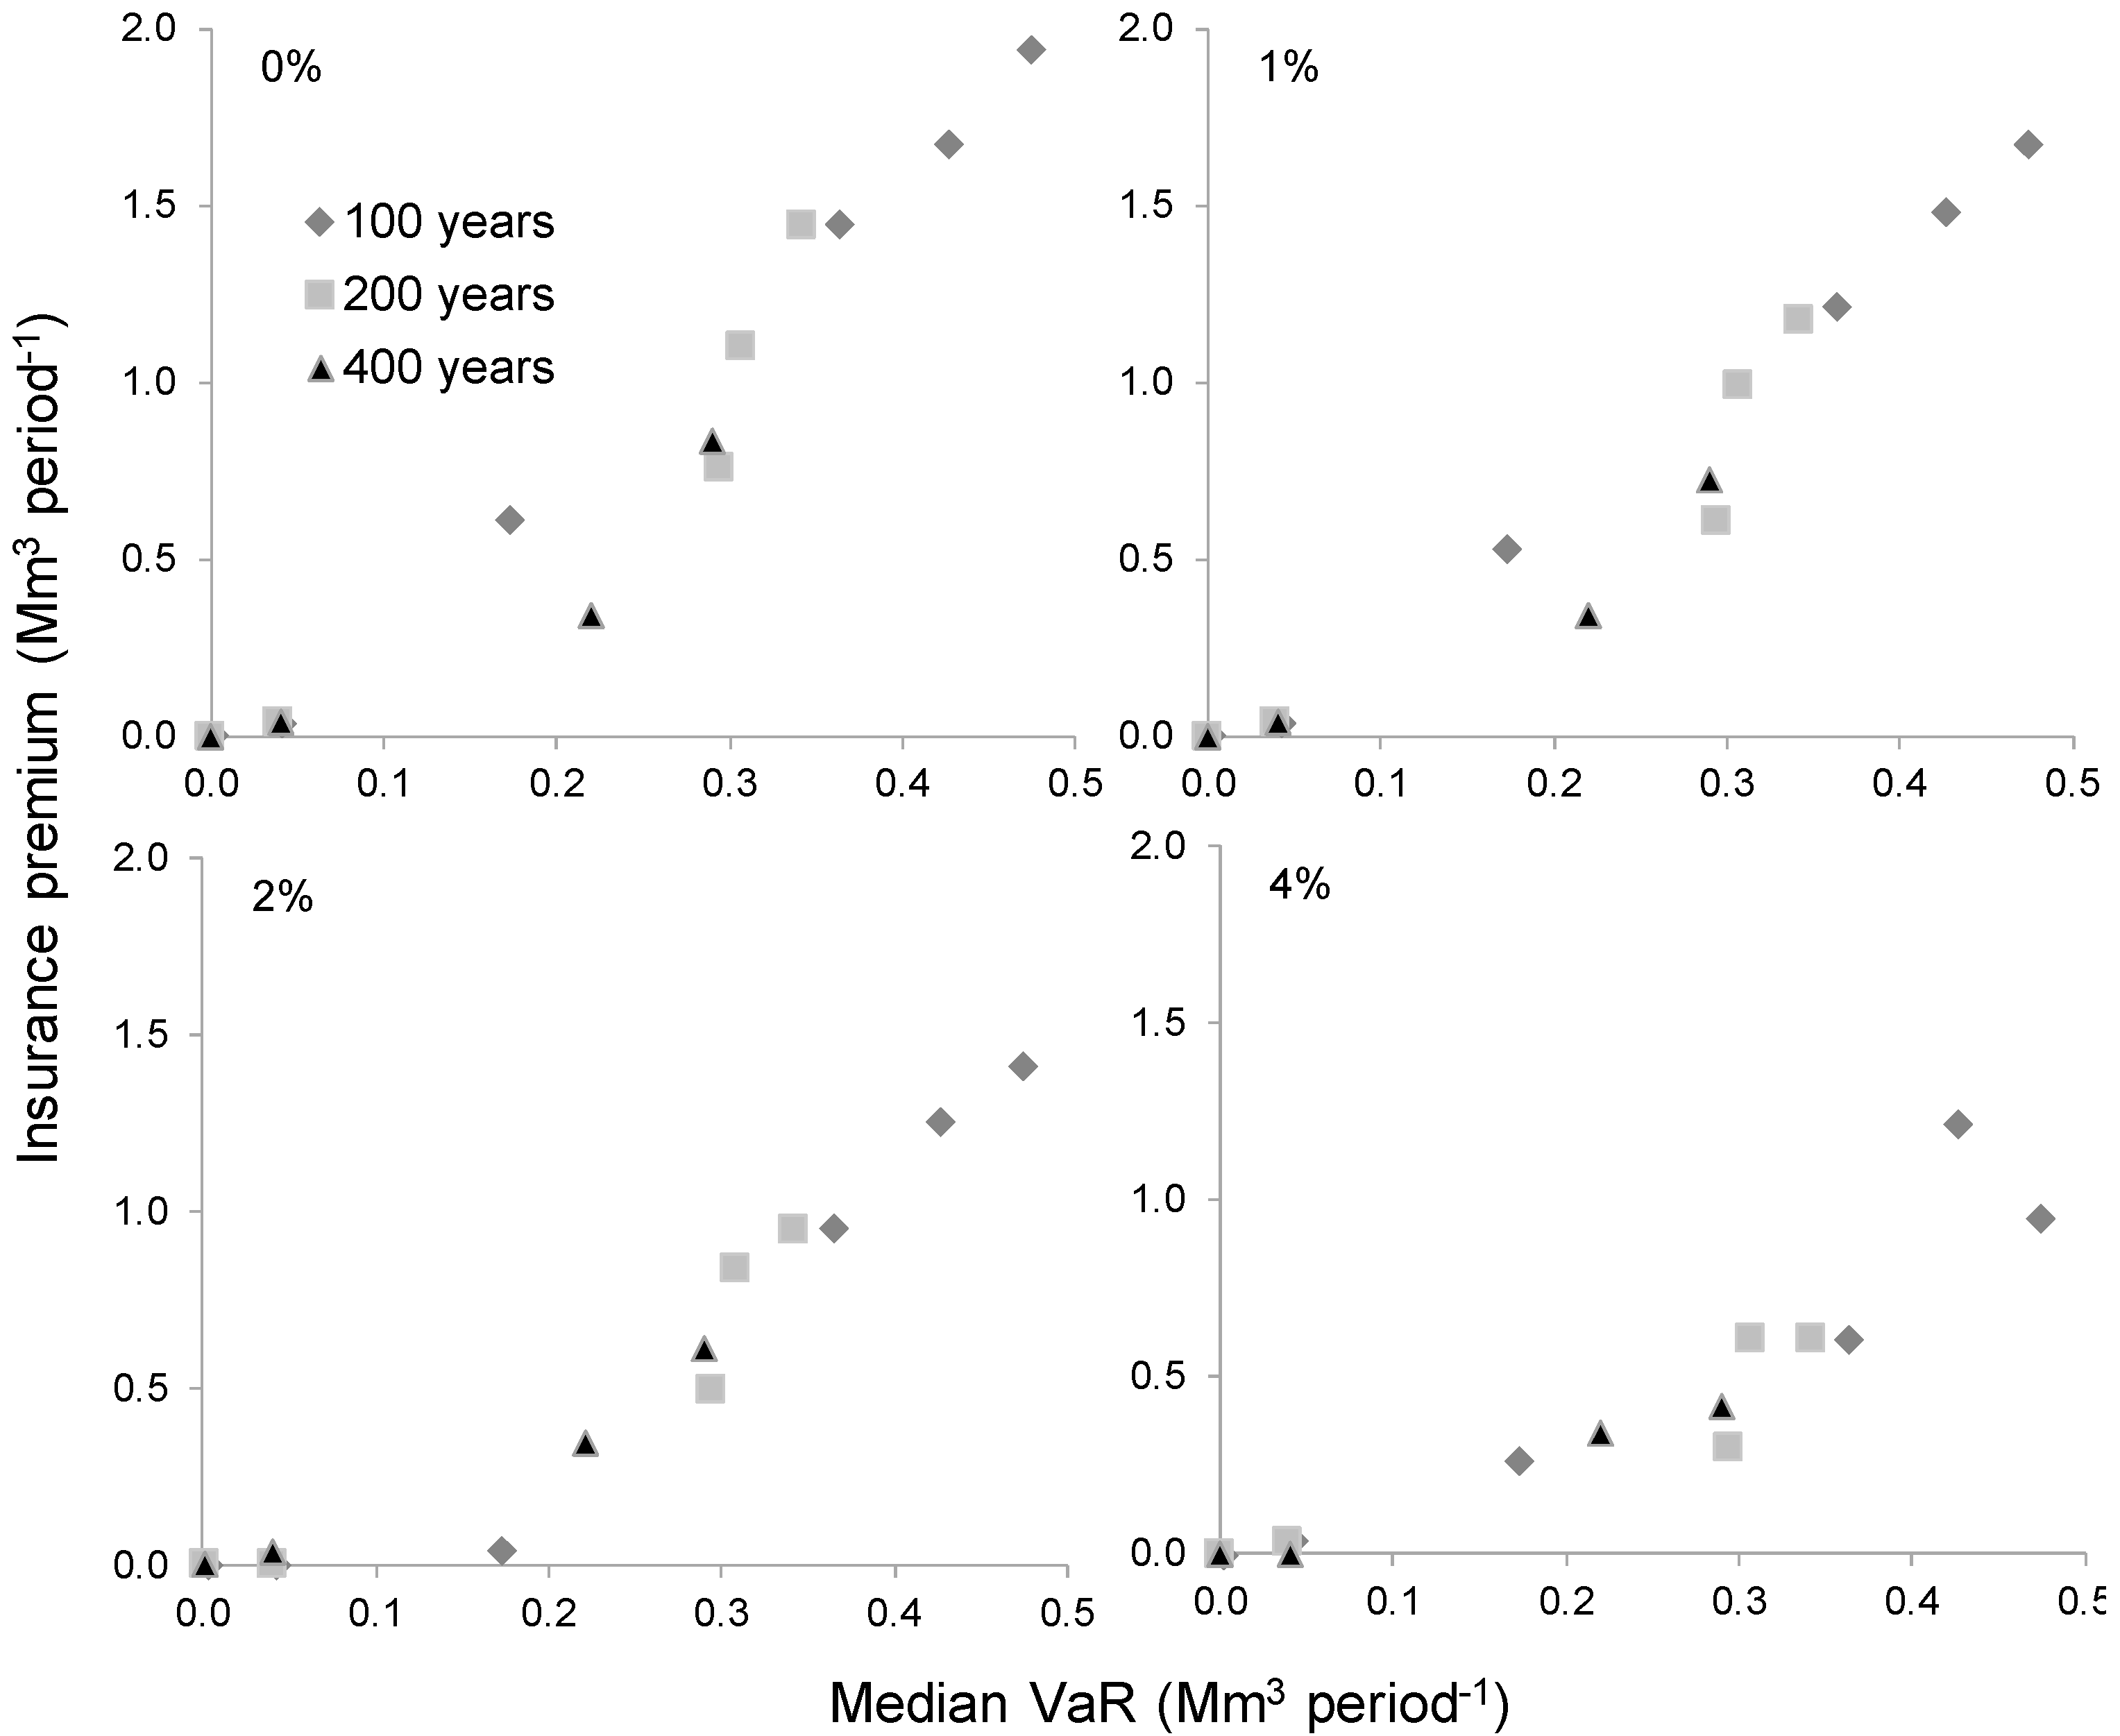
2.4.2. Insurance Premium

A loss function proportional to the forest value may serve to characterize wildfire risk in a forest. Forest managers may seek to be protected against wildfire damages to timber supply by taking out an insurance contract. We therefore calculated the insurance premium with probabilities of the potential losses provided with periodic VaRs. Putting this into a formula, one needs to find the value of a periodic premium (P) such that (Equation (9)):
p = 1 30 (   P V a R p ) 1 ( 1 + i ) 5 × p 2.5 = 0 ,
where p corresponds to a number of five-year periods, and i is an interest rate. Harvest is assumed to take place in the middle of the period (hence the term −2.5). We selected different interest rates (0%, 1%, 2%, and 4%) used for discount rates for public investment [61]. Statistical computations were performed using the R statistical software environment [59].

2.4.3. Timber Supply Reduction

To prevent operational disruptions, a reduction in periodic wood harvest can be used to build a buffer stock of timber [15] serving as a back-up plan in the event that a supply disruption occurs. A supply disruption occurred whenever realized timber harvest was below 90% of the planned timber harvest volume [62]. We were interested in estimating the harvest target reduction that helped deal with timber losses caused by only fire and therefore used the difference between the maximum PTH value equal to the median realized harvest level (PTHth in Equation (8)) and the one for which disruptions do not occur anymore (i.e., VaRp = 0, p).

2.5. Comparison of Risk Management Strategies

At first, we estimated harvest loss distributions by simulating the implementation of the timber supply solution with the landscape simulation model for three fire cycles (100, 200 and 400 years). Simulations were then redone with the landscape simulation model for the three fire cycles by reducing the PTH value by steps of 10% until we found a PTH value that could be implemented with no risks. Periodic VaRp and median VaR values were computed from these loss distributions. We also used these simulation results to estimate the parameters of piecewise linear models (Equation (8)) in order to find the PTH value equal to the median realized harvest level for each considered fire cycle. Premium insurance was then computed (Equation (9)) for a range of interest rates used for public investments (0%, 1%, 2% and 4% [61]) at the threshold PTH value equal to the median realized harvest level. Finally, we compared the timber supply reductions required to cancel risk to insurance premiums for each fire cycle.

3. Results

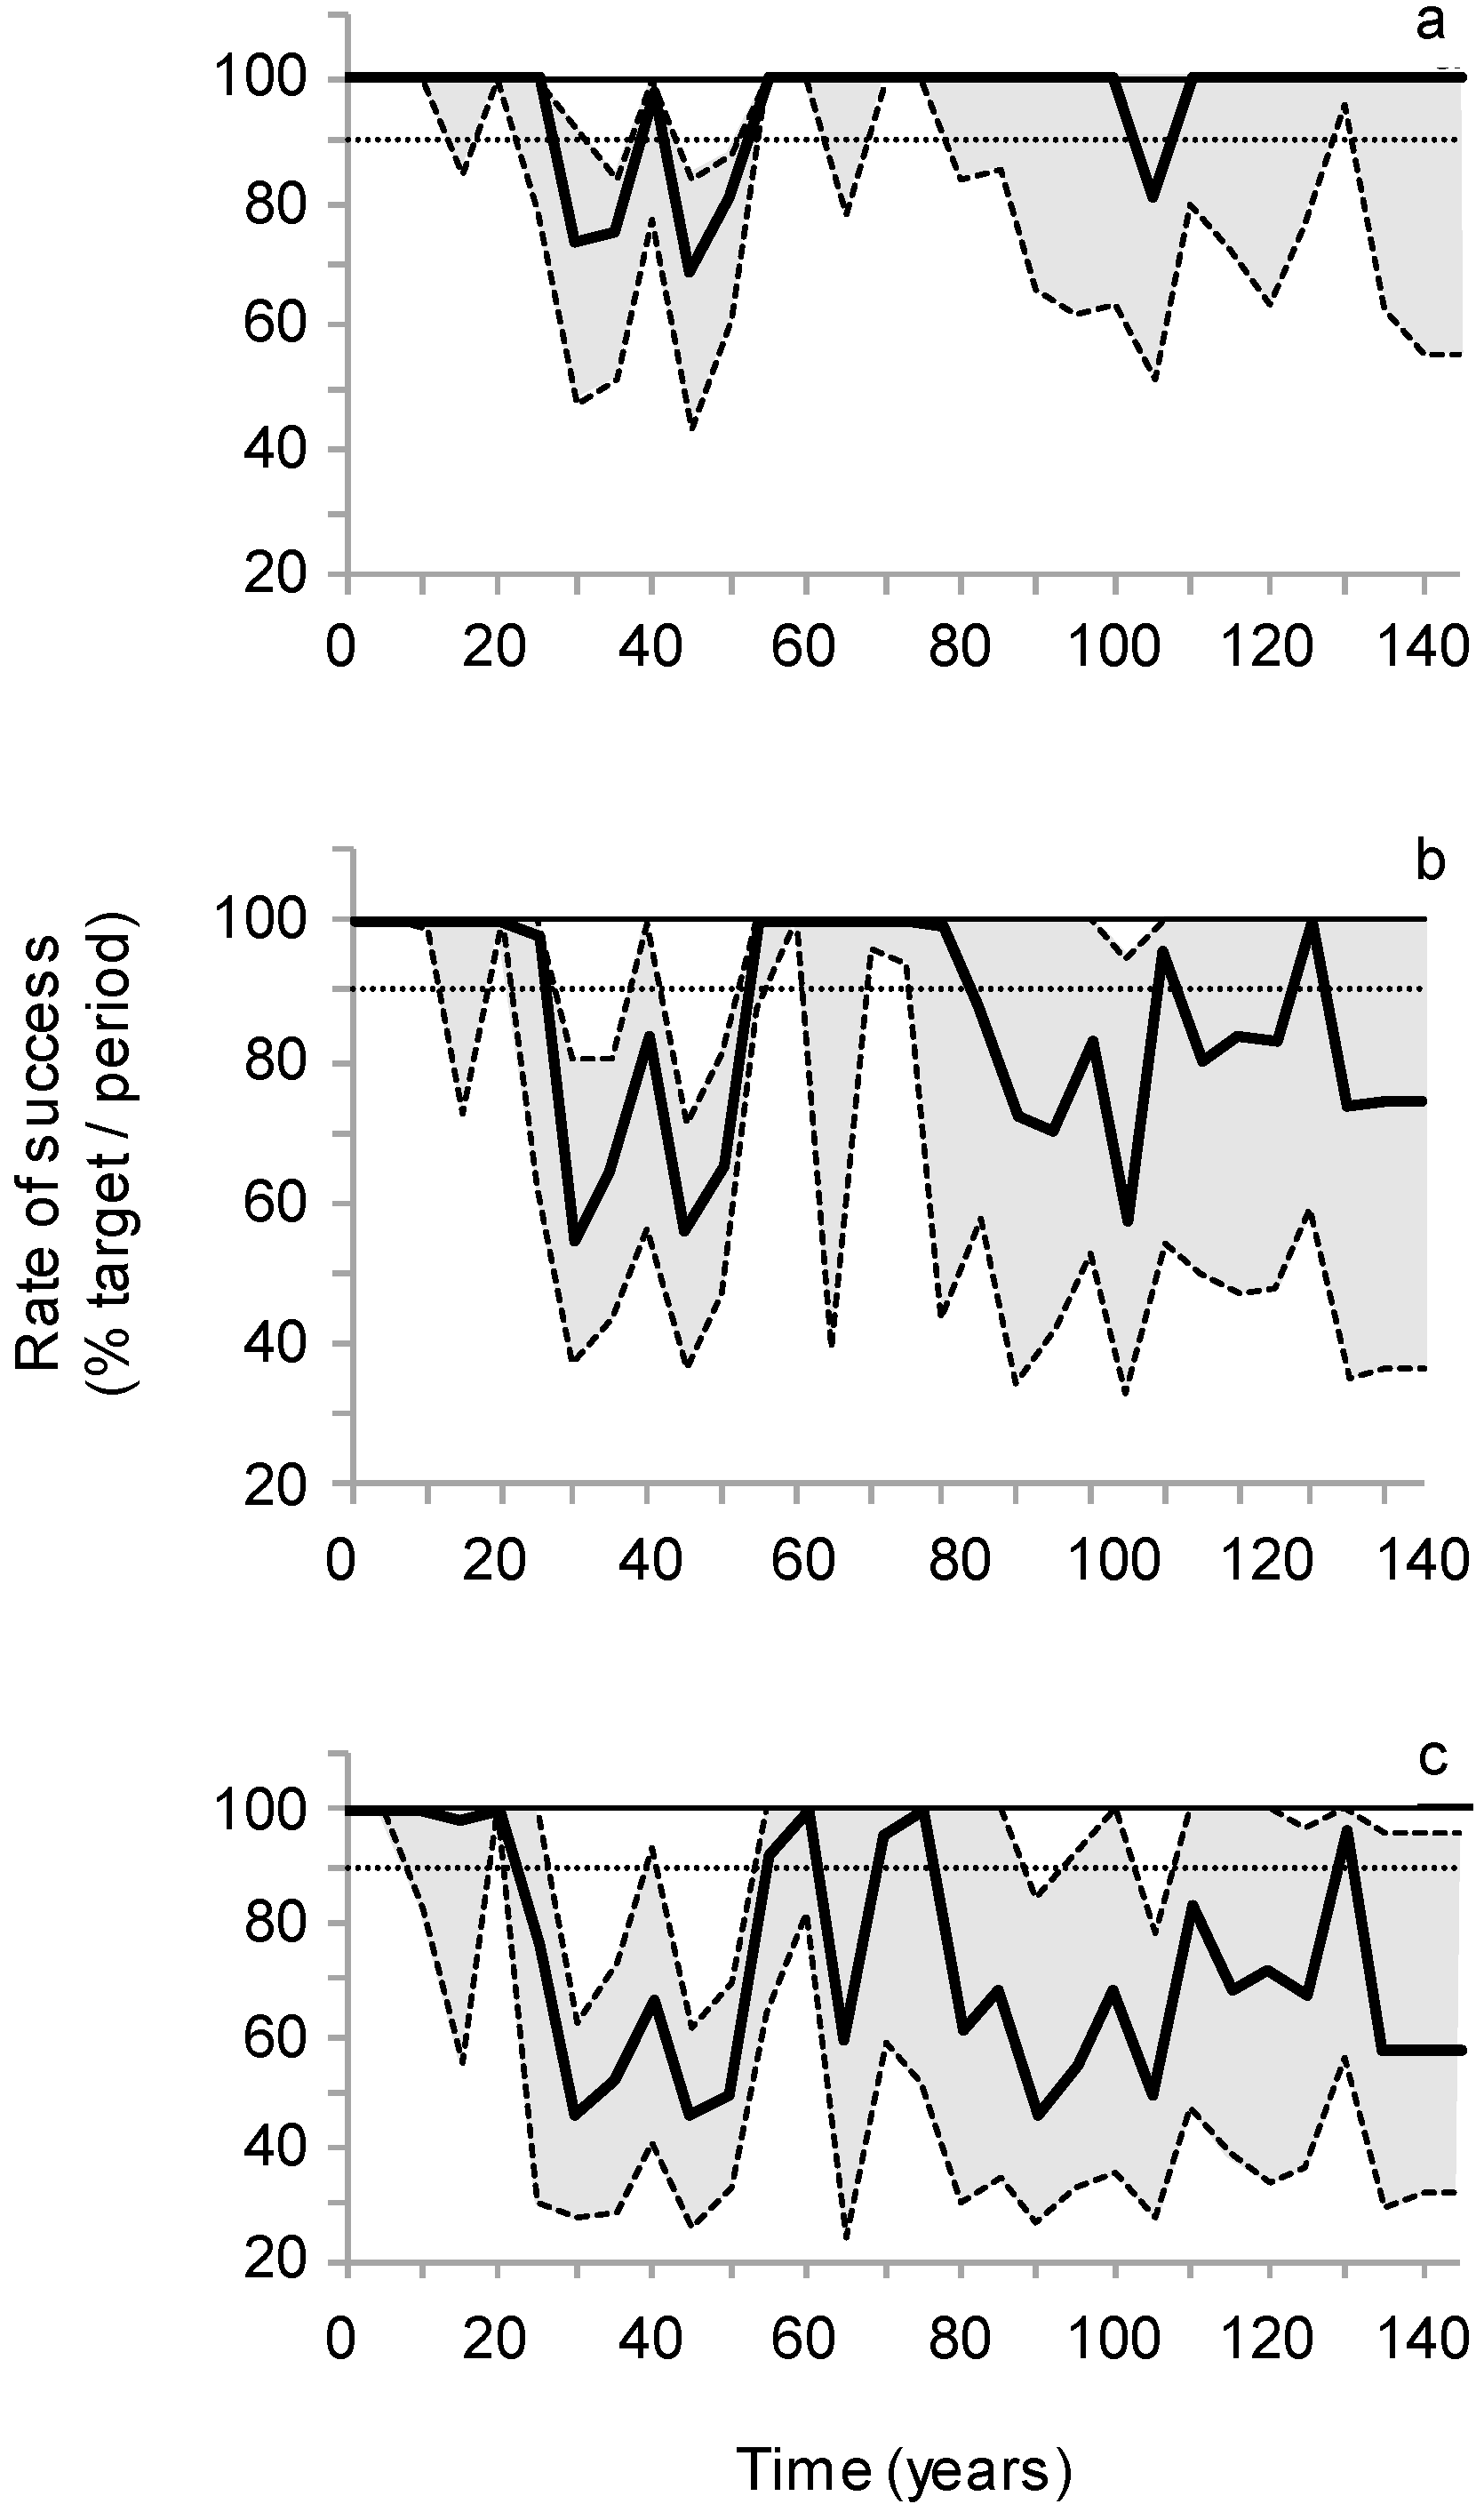
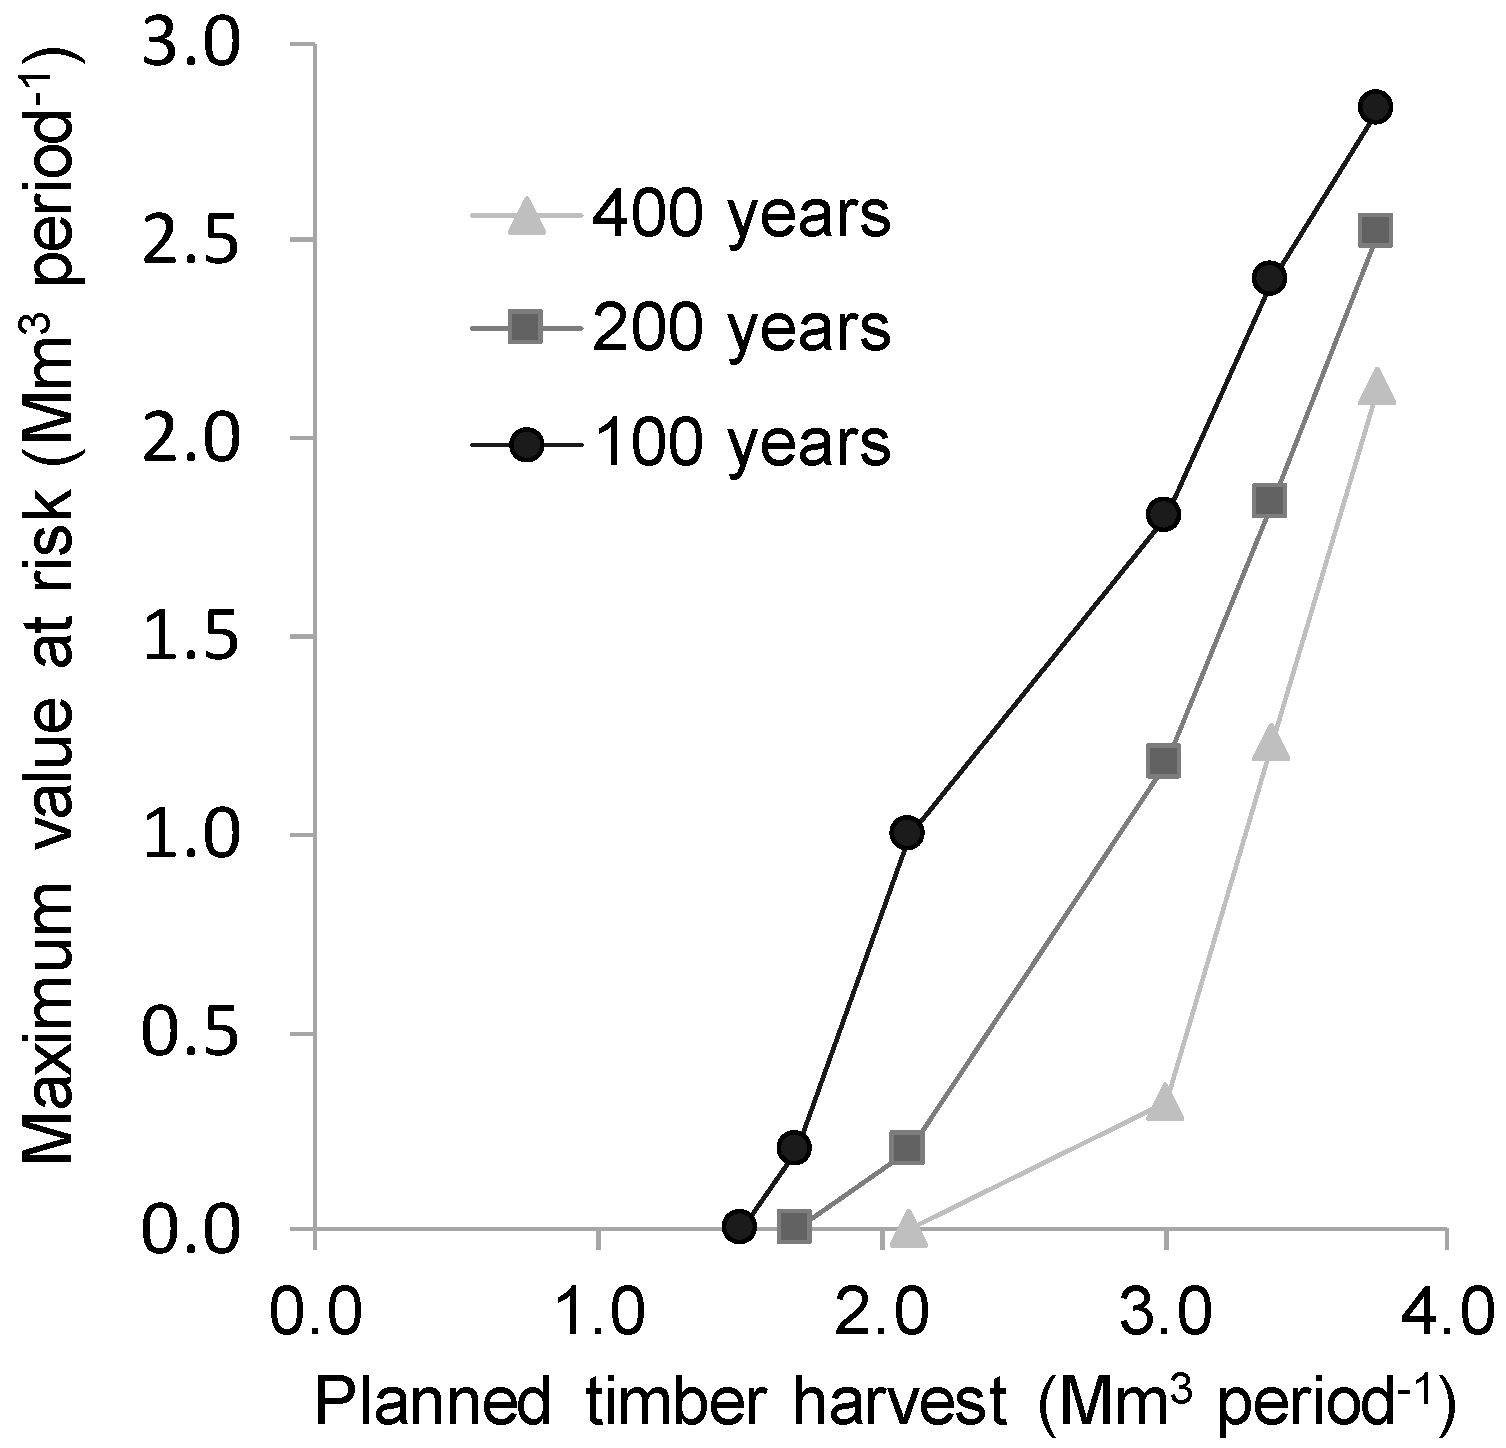
3.1. Risk Assessment

Periodic timber harvest with an ecosystem management strategy may reach values up to approximately 3.8 Mm3 period−1 when not considering fire risk (Equation (1)). However, a blind implementation of such a strategy will not enable the procurement of expected timber levels (Figure 2) and timber supply disruptions caused by fire are expected (Figure 3). Despite the likely occurrence of such disruptions, the median rate of planning success reaches 97% (3.7 Mm3 period−1) of the optimal solution provided by the timber supply model with a fire cycle of 400 years and decreases only up to 73% (2.8 Mm3 period−1) with a fire cycle of 100 years (Figure 2). The chances of obtaining such a rate of success are, however, threatened by infrequent but possibly very significant disruptions. Timber supply disruptions may start to occur as soon as the 6th planning period (30 years) and, depending on the considered fire cycle, either tend to disappear after 50 years (and occur again approximately after one mean stand rotation) or maintain themselves for the rest of the planning horizon (Figure 3).
Maximum periodic VaRs, which provide an indication of the expected vulnerability of timber supplies to wildfire, are substantial in our study area (2.1 to 2.8 Mm3 period−1) and represent 55% to 74% of the periodic timber harvest, depending on the fire regime that is considered. Median VaR across the planning horizon with the longest fire cycle (400) years is substantially lower than the maximum VaR (0.9 vs. 2.2 Mm3 period−1) when compared to that resulting from a fire cycle of 100 years (2.4 vs. 2.9 Mm3 period−1), indicating more frequent occurrences of important timber supply disruption throughout the planning horizon with a higher burn rate (Figure 3c).
Successive implementation of a portion (30% to 90%) of the optimized timber supply solution helped find a median realized harvest level equal to PTH values for timber harvest levels up of 2.8 to 3.3 Mm3 period−1, depending on the considered fire cycle (Figure 4, Table 1). At the threshold PTH value beyond which the implementation success decreases, median VaR values (0.02 to 1.12 Mm3 period−1 depending on the fire cycle) are much lower than those induced by the implementation of the entire optimized timber supply solution. They are in fact reduced by a factor varying between two and 20. Maximum VaR values are less reduced, by a factor between 1.6 (for a fire cycle of 100 years) and 1.9 (for a fire cycle of 400 years). This means that ignoring fire in the timber supply model and assuming that fire risk is totally controlled (planning optimism) increased the risk of supply disruptions by almost one order of magnitude, even with a fire cycle of 400 years. Such increased risk is, however, accompanied by an increase in realized harvest level, the rate of which varies between 0% and 60% (= slope of the second segment of the piecewise regression) (Figure 4, Table 1). This increase is only significant with a fire cycle of 400 years (Table 1).

3.2. Risk Management Strategies

Timber harvest reductions are required to deal with wildfire risk throughout the planning horizon: according to a timber harvest reduction strategy, a 35% of harvest reduction is necessary to avoid significant disruptions (i.e., VaRp = 0, p) with the current fire regime (400 years, Figure 3), and such reductions increase to 48% and 56% for fire cycles of 200 and 100 years, respectively. Harvest reductions therefore seem to increase non-linearly with an increase of the fire cycle (i.e., +6%/100 years between 200 and 400 years and +8%/100 years between 100 and 200 years). In fact, the sensitivity of maximum VaR to a timber harvest reduction decreases as maximum VaR tends to zero (Figure 5). Depending on the interest rate and the fire cycle, we looked at the changes in the amount of insurance premium an insurer should hold against unexpected losses as a function of fire risk (Figure 6). Insurance premiums represent between 5% and 7% of the level of supply for a fire cycle of 400 years (Figure 6), which are noticeably lower than for a timber harvest reduction strategy. With a change of fire cycle between 200 and 400 years, premium increases are also lower than those of a timber supply reduction strategy (between 5% and 11%/100 years depending on the interest rate), and increase less between 100 and 200 (between 2% and 7%/100 years). Such premium increases are more directly related to an increase in median VaR rather than to an increase in fire cycle (Figure 7).

4. Discussion

We have evaluated two strategies to protect timber supply against disruptions with the objective of achieving over the planning horizon at least 90% of the planned harvest level: an insurance policy based on probabilities of potential losses and a reduction of timber harvest. Both mitigation strategies help build a buffer stock of available timber as a back-up plan. Our results show, however, that a constant reduction of timber harvest is costlier than an insurance policy (Figure 6) and is therefore less efficient. This result is linked to the fact that the premium insurance is directly related to risk (Equation (9)), contrary to a timber harvest reduction strategy, which provides only an indirect way of managing a buffer stock [56]. The insurance premium also acts as an asset protected from fire. The consideration of fire impact and level of planned timber supply are the factors that most influence the planning success rate when implementing the optimized plan with a landscape dynamics model [56]. These two factors were varied in a systematic fashion in the present study. Both mitigation strategies were evaluated at the maximum PTH value that could be implemented in interaction with fire with the landscape simulation model, as proposed by [60]. We therefore succeeded in differentiating two types of risk, one due to fire only and another one due to the planning method used for the dimensioning of a sustainable timber supply.
Analysis of the risk related to the use of a specific planning method was discarded in the present study but deserves more consideration, especially in a real decision-making process: for the highest fire cycle that we have considered (400 years), the implementation of the timber supply optimal solution (3.8 Mm3 period−1) in interaction with fire had a success rate of 97%. The maximum PTH value that could be totally implemented with the landscape simulation model was 2.8 Mm3 period. This means that a timber harvest reduction of 36% would be required to increase the success rate up to 100%, which is clearly very expensive [15,63]. In fact, since absolute protection against losses cannot be guaranteed, some level of acceptable loss expressed as a risk tolerance must be established, which can widely vary based on knowledge of exposures and proposed risk management solutions [27]. This points to the importance of choosing a level of tolerance to risk when facing a relatively low fire cycle, as already noted by [60]. Increasing tolerance to risk requires the availability of other mitigation strategies, such as the diversification of procurement sources [64], when supply disruptions occur.
Manley and Watt [65] mentioned that the possible reasons why uncertainty might have been ignored in the design of optimal forest management strategies is that it has often been assumed that forest management is based upon purely risk-neutral preferences. Brumelle et al. [66] made a survey of the literature on optimal forest management that took into account the presence of risk and found that 70% assumed risk neutral preferences and only 10% openly used risk averse preferences. A risk neutral forest manager would prefer adopting a strategy of passive acceptance whereas a risk adverse manager might prefer to adopt a risk mitigation strategy and continually revise his strategy in a dynamic replanning process [67]. Clearly, adopting a risk neutral strategy in the present case is an unsustainable strategy since important timber supply disruptions are to be expected (Figure 3), even with the present fire cycle of 400 years (Figure 3a) and despite an expected success rate of 97% of the harvest plan implementation. Furthermore, Gauthier et al. [68] showed that the increase in burn rates expected in the future, especially for the 2071 to 2100 period will impact the vulnerability of the harvest in most of western Quebec where our study area is located.
Inclusion of fire risk into the timber supply planning process has already been the subject of numerous research studies and different techniques are available for this purpose [10,11]. However, the implementation of these techniques in a real decision-making situation still remains limited in North America. For instance, inclusion of fire impact on timber supply models with linear programming requires a model structure seldom available in software designed for timber supply modeling [19,69]. Other approaches [15,22,63] remain too complex to implement with the typical problem size required to solve optimization problems of real timber supply models [19,69]. Heuristic optimization methods may overcome these limitations but do not guarantee optimality, which restrains their use in practice [16,17]. To the opposite, landscape simulation models are designed and therefore suited to analyze the interaction between harvest, natural succession and disturbances [53,70,71]. Clearly, such an approach offered two main advantages. First, simulation of the implementation of the optimized solution of a timber supply problem with such a landscape dynamics model helped assess the feasibility of the optimal solution, which conducted us to reduce the planned harvest down to a level where it was feasible at least 50% of the time. Second, at that level, we were able to estimate the amount of risk caused by fire only (and not by fire and planning method combined) and to express the simulated risk into an insurance premium, which is a common standard used for risk assessment and protection. The central view of any insurance scheme is an understanding of risk probabilities to inform the decision-making process.

5. Conclusions

Wildfire events impact optimal forest management decisions because such stochastic events may disturb the planned solution. In this paper, we used VaR as a tool to measure risk to characterize expected losses caused by fire during the implementation of a timber supply model solution in a boreal forest. We did not aim to investigate all possible mitigation strategies but rather to focus on two simple strategies: the use of an insurance premium and of a reduction of timber harvest. These strategies assume that decision-makers do not have prior information on which to base their weighting of the opinions and decisions. At the moment, the prospects around climate change are hardly encouraging and it is probable that the forest economy will diminish but decision-makers should consider shifting their attention to other promising potential schemes of strategies that could be used to deal with risk, and, maybe, only then will the risk of fire lower significantly.

Acknowledgments

This research was financially supported by the Fonds québécois de la recherche sur la nature et les technologies. We thank the Bureau du Forestier en Chef (Ministère de la Forêt, Faune et Parc du Québec) for giving us access to their timber supply analysis for FMU 085-51 (2008–2013). We also sincerely thank Hakim Ouzennou for his statistical help.

Author Contributions

G.R. and F.R. conceived the experiments and analyzed the data. All authors discussed the results, and co-wrote the paper. All authors contributed to writing the paper.

Conflicts of Interest

The authors declare no conflict of interest.

References

  1. Kangas, J.; Kangas, A. Multiple criteria decision support in forest management—The approach, methods applied, and experiences gained. For. Ecol. Manag. 2005, 207, 133–143. [Google Scholar] [CrossRef]
  2. Wynne, B. Uncertainty and environmental learning: Reconceiving science and policy in the preventive paradigm. Glob. Environ. Change 1992, 2, 111–127. [Google Scholar] [CrossRef]
  3. Peterson, G.D.; Cumming, G.S.; Carpenter, S.R. Scenario planning: A tool for conservation in an uncertain world. Conserv. Biol. 2003, 17, 358–366. [Google Scholar] [CrossRef]
  4. Hoffman, F.O.; Hammonds, J.S. Propagation of uncertainty in risk assessments: The need to distinguish between uncertainty due to lack of knowledge and uncertainty due to variability. Risk Anal. 1994, 14, 707–712. [Google Scholar] [CrossRef] [PubMed]
  5. Bagajewicz, M.; Uribe, A. Financial Risk Management in Refinery Operations Planning Using Commercial Software; XIV Latin Ibero-American Congress on Operations Research: Cartagena de Indias, Colombia, 2008. [Google Scholar]
  6. Armstrong, G.W.; Cumming, S.G. Estimating the cost of land base changes due to wildfire using shadow prices. For. Sci. 2003, 49, 719–730. [Google Scholar]
  7. Bertsimas, D.; Lauprete, G.J.; Samarov, A. Shortfall as a risk measure: Properties, optimization and applications. J. Econ. Dyn. Control 2004, 28, 1353–1381. [Google Scholar] [CrossRef]
  8. Hildebrandt, P.; Knoke, T. Investment decisions under uncertainty—A methodological review on forest science studies. For. Policy Econ. 2011, 13, 1–15. [Google Scholar] [CrossRef]
  9. Von Gadow, K.; Hui, G. Modelling Forest Development; Kluwer Academic Publishers: Dordrecht, The Netherlands, 2001; pp. 1–23. [Google Scholar]
  10. Yousefpour, R.; Jacobsen, J.B.; Thorsen, B.J.; Meilby, H.; Hanewinkel, M.; Oehler, K. A review of decision-making approaches to handle uncertainty and risk in adaptive forest management under climate change. Ann. For. Sci. 2012, 69, 1–15. [Google Scholar] [CrossRef]
  11. Pasalodos-Tato, M.; Mäkinen, A.; Garcia-Gonzalo, J.; Borges, J.G.; Lämas, T.; Eriksson, L.O. Assessing uncertainty and risk in forest planning and decision support systems: Review of classical methods and introduction of innovative approaches. For. Syst. 2013, 22, 282–303. [Google Scholar] [CrossRef]
  12. Flannigan, M.D.; Krawchuk, M.A.; de Groot, W.J.; Wotton, M.; Gowman, L.M. Implications of changing climate for global wildland fire. Int. J. Wildl. Fire 2009, 18, 483–547. [Google Scholar] [CrossRef]
  13. Taylor, P.D.; Fahrig, L.; Kimberly, A. Landscape connectivity: A return to the basics. In Connectivity Conservation; Crooks, K.R., Sanjayan, M., Eds.; Cambridge University Press: Cambridge, UK; 2006; pp. 22–43. [Google Scholar]
  14. Martell, D.; Gunn, E.; Weintraub, A. Forest management challenges for operational researchers. Eur. J. Oper. Res. 1998, 104, 1–17. [Google Scholar] [CrossRef]
  15. Boychuk, D.; Martell, D.L. A multistage stochastic programming model for sustainable forest-level timber supply under risk of fire. For. Sci. 1996, 42, 10–26. [Google Scholar]
  16. Kaya, A.; Bettinger, P.; Boston, K.; Akbulut, R.; Ucar, Z.; Siry, J.; Merry, K.; Cieszewski, C. Optimisation in forest management. Curr. For. Rep. 2016, 2, 1–17. [Google Scholar] [CrossRef]
  17. Bettinger, P.; Chung, W. The key literature of, and trends in, forest-level management planning in North America, 1950–2001. Int. For. Rev. 2004, 6, 40–50. [Google Scholar] [CrossRef]
  18. Siry, J.P.; Bettinger, P.; Merry, K.; Grebner, D.L.; Boston, K.; Cieszewski, C. Forest Plans of North America; Academic Press: London, UK, 2015. [Google Scholar]
  19. Gunn, E.A. Models for strategic forest management. In Handbook of Operations Research in Natural Resources; Weintraub, A., Romero, C., Bjørndal, T., Epstein, R., Eds.; Springer: New York, 2007; pp. 317–341. [Google Scholar]
  20. Acuna, M.A.; Palma, C.D.; Cui, W.; Martell, D.L.; Weintraub, A. Integrated spatial fire and forest management planning. Can. J. For. Res. 2010, 40, 2370–2383. [Google Scholar] [CrossRef]
  21. Van Wagner, C.E. Simulating the effect of forest fire on long-term annual timber supply. Can. J. For. Res. 1983, 13, 451–457. [Google Scholar] [CrossRef]
  22. Reed, W.J.; Errico, D. Optimal harvest scheduling at the forest level in the presence of the risk of fire. Can. J. For. Res. 1986, 16, 266–278. [Google Scholar] [CrossRef]
  23. Armstrong, G.W. Sustainability of timber supply considering the risk of wildfire. For. Sci. 2004, 50, 626–639. [Google Scholar]
  24. Eid, T. Use of uncertain inventory data in forestry scenario models and consequential incorrect harvest decisions. Silva Fenn. 2000, 34, 89–100. [Google Scholar] [CrossRef]
  25. Borders, B.E.; Harrison, W.M.; Clutter, M.L.; Shiver, B.D.; Souter, R.A. The value of timber inventory information for management planning. Can. J. For. Res. 2008, 38, 2287–2294. [Google Scholar] [CrossRef]
  26. Duvemo, K.; Lämas, T.; Eriksson, L.O.; Wikström, P. Introducing cost-plus-loss analysis into a hierarchical forestry planning environment. Ann. Oper. Res. 2014, 219, 415–431. [Google Scholar] [CrossRef]
  27. Banks, E. Risk and Financial Catastrophe; Finance and Capital Markets Series; Palgrave Macmillan: Hampshire, Great Britain, 2009; p. 213. [Google Scholar]
  28. Baranoff, E.Z.; Baranoff, E.Z. Risk Management and Insurance; John Wiley and sons: Hoboken, NJ, USA, 2004; pp. 48–52. [Google Scholar]
  29. Jorion, P. How informative are value-at-risk disclosures? Account. Rev. 2002, 77, 911–931. [Google Scholar] [CrossRef]
  30. Ardia, D. Financial Risk Management with Bayesian Estimation of GARCH Models; Springer: Heidelberg, Germany, 2008; p. 161. [Google Scholar]
  31. Hoogerheide, L.; Van Dijk, H.K. Bayesian forecasting of value at risk and expected shortfall using adaptive importance sampling. Int. J. Forecast. 2010, 26, 231–247. [Google Scholar] [CrossRef]
  32. Bagajewicz, M.J.; Barbaro, A.F. Financial risk management in the planning of energy recovery in the total site. Ind. Eng. Chem. Res. 2003, 42, 5239–5248. [Google Scholar] [CrossRef]
  33. Holecy, J.; Hanewinkel, M. A forest management risk insurance model and its application to coniferous stands in southwest Germany. For. Policy Econ. 2006, 8, 161–174. [Google Scholar] [CrossRef]
  34. Shepard, H.B. Forest fire insurance in the Pacific Coast states. J. For. 1935, 33, 111–116. [Google Scholar]
  35. Shepard, H.B. Fire insurance for forests. J. Land Pub. Util. Econ. 1937, 13, 111–115. [Google Scholar] [CrossRef]
  36. Lankoande, M.; Yoder, J.; Wandschneider, P. Optimal wildfire insurance in the wildland-urban interface in the presence of a government subsidy for fire risk mitigation. Available online: http://faculty.ses.wsu.edu/WorkingPapers/Yoder/LankoandeEtAl_InsuranceSubsidiesWildfire_2005.pdf (accessed on 11 May 2016).
  37. Chen, H.; Cummins, J.D.; Viswanathan, K.S.; Weiss, M.A. Systemic risk and the interconnectedness between banks and insurers: An econometric analysis. J. Risk Insur. 2014, 81, 623–652. [Google Scholar] [CrossRef]
  38. Robitaille, A.; Saucier, J.P. Paysages Régionaux du Québec Méridional; Les publications du Québec: Ste-Foy, QC, Canada, 1998; p. 213. [Google Scholar]
  39. Nguyen-Xuan, T. Développement d’une stratégie d’aménagement forestier s’inspirant de la dynamique des perturbations naturelles pour la région nord de l’Abitibi. Available online: http://chaireafd.uqat.ca/pdf/nguyen1.pdf (accessed on 11 May 2016).
  40. Bergeron, Y.; Leduc, A.; Harvey, B.D.; Gauthier, S. Natural Fire Regime: A Guide for Sustainable Management of the Canadian boreal forest. Silva Fenn. 2002, 36, 81–95. [Google Scholar] [CrossRef]
  41. Gauthier, S.; Nguyen, T.; Bergeron, Y.; Leduc, A.; Drapeau, P.; Grondin, P. Developing forest management strategies based on fire regimes in northwestern Quebec. In Emulating Natural Forest Landscape Disturbances: Concepts and Applications; Perera, A., Buse, L.J., Weber, M.G., Eds.; Columbia University Press: New York, NY, USA, 2004; pp. 219–229. [Google Scholar]
  42. Bergeron, Y.; Cyr, D.; Drever, C.R.; Flannigan, M.; Gauthier, S.; Kneeshaw, D.; Logan, K. Past, current, and future fire frequencies in Quebec’s commercial forests: Implications for the cumulative effects of harvesting and fire on age-class structure and natural disturbance-based management. Can J. For. Res. 2006, 36, 2737–2744. [Google Scholar] [CrossRef]
  43. Bergeron, Y.; Cyr, D.; Girardin, M.P.; Carcaillet, C. Will climate change drive 21st century burn rates in Canadian boreal forest outside of its natural variability: Collating global climate model experiments with sedimentary charcoal data. Int. J. Wildl. Fire 2010, 19, 1127–1139. [Google Scholar] [CrossRef]
  44. Cyr, D.; Gauthier, S.; Bergeron, Y.; Carcaillet, C. Forest management is driving the eastern North American boreal forest outside its natural range of variability. Front. Ecol. Environ. 2009, 7, 519–524. [Google Scholar] [CrossRef]
  45. Belleau, A.; Légaré, S. Project Tembec: Towards the implementation of a forest management strategy based on the natural disturbance dynamics of the northern Abitibi region. In Ecosystem Management in the Boreal Forest; Gauthier, S., Vaillancourt, M.-A., Leduc, A., de Grandpré, L., Kneeshaw, D., Morin, H., Drapeau, P., Bergeron, Y., Eds.; Presses de l’Université du Québec: Québec, Canada, 2009; pp. 479–499. [Google Scholar]
  46. Bergeron, Y.; Gauthier, S.; Flannigan, M.; Kafka, V. Fire regimes at the transition between mixedwood and coniferous boreal forest in northwestern Quebec. Ecology 2004, 85, 1916–1932. [Google Scholar] [CrossRef]
  47. Dhital, N.; Raulier, F.; Asselin, H.; Imbeau, L.; Valeria, O.; Bergeron, Y. Emulating boreal forest disturbance dynamics: Can we maintain timber supply, aboriginal land use, and woodland caribou habitat? For. Chron. 2013, 89, 54–65. [Google Scholar] [CrossRef]
  48. Groot, A.; Lussier, J.-M.; Mitchell, A.K.; MacIsaac, D.A. A silvicultural systems perspective on changing Canadian forestry practices. For. Chron. 2005, 81, 50–55. [Google Scholar] [CrossRef]
  49. Raymond, P.; Bédard, S.; Roy, V.; Larouche, C.; Tremblay, S. The irregular shelterwood system: Review, classification, and potential application to forests affected by partial disturbances. J. For. 2009, 107, 405–413. [Google Scholar]
  50. Davis, L.S.; Johnson, K.N.; Bettinger, P.S.; Howard, T.E. Forest Management to Sustain Ecological, Economic, and Social Values; McGraw Hill: New York, NY, USA, 2001; p. 804. [Google Scholar]
  51. Fall, A.; Fall, J. A domain-specific language for models of landscape dynamics. Ecol. Modell. 2001, 141, 1–18. [Google Scholar] [CrossRef]
  52. Cumming, S.G. A parametric model of the fire-size distribution. Can. J. For. Res. 2001, 31, 1297–1303. [Google Scholar] [CrossRef]
  53. Fall, A.; Fortin, M.-J.; Kneeshaw, D.D.; Yamasaki, S.H.; Messier, C.; Bouthillier, L.; Smith, C. Consequences of various landscape scale ecosysteme management strategies and fire cycles on age-class structure and harvest in boreal forest. Can. J. For. Res. 2004, 34, 310–322. [Google Scholar] [CrossRef] [Green Version]
  54. Bouchard, M.; Pothier, D. Long-term influence of fire and harvesting on boreal forest age structure and forest composition in eastern Québec. For. Ecol. Manag. 2011, 261, 811–820. [Google Scholar] [CrossRef]
  55. Gauthier, S.; Raulier, F.; Ouzennou, H.; Saucier, J.P. Strategic analysis of forest vulnerability to risk related to fire: An example from the coniferous boreal forest of Quebec. Can. J. For. Res. 2015, 45, 553–565. [Google Scholar] [CrossRef]
  56. Raulier, F.; Dhital, N.; Racine, P.; Tittler, R.; Fall, A. Increasing resilience of timber supply: How a variable buffer stock of timber can efficiently reduce exposure to shortfalls caused by wildfires. For. Policy Econ. 2014, 46, 47–55. [Google Scholar] [CrossRef]
  57. Schruben, L.W. Designing Correlation Induction Strategies for Simulation. Current Issues in Computer Simulation. J. Am. Stat. Assoc. 1979, 73, 504–525. [Google Scholar] [CrossRef]
  58. Law, A.M.; Kelton, W.D. Simulation Modelling and Analysis; McGraw-Hill, Inc.: Boston, MA, USA, 1982. [Google Scholar]
  59. R Foundation for Statistical Computing. R: A Language and Environment for Statistical Computing; R Foundation for Statistical Computing: Vienna, Austria, 2014. [Google Scholar]
  60. Leduc, A.; Bernier, P.Y.; Mansuy, N.; Raulier, F.; Gauthier, S.; Bergeron, Y. Using salvage logging and tolerance to risk to reduce the impact of forest fires on timber supply calculations. Can. J. For. Res. 2015, 45, 480–486. [Google Scholar] [CrossRef]
  61. Moore, M.A.; Boardman, A.E.; Vining, A.R.; Weimer, D.L.; Greenberg, D.H. “Just give me a number!” Practical values for the social discount rate. J. Policy Anal. Manag. 2004, 23, 789–812. [Google Scholar] [CrossRef]
  62. Peter, B.; Nelson, J. Estimating harvest schedules and profitability under the risk of fire disturbance. Can. J. For. Res. 2005, 35, 1378–1388. [Google Scholar] [CrossRef]
  63. Gassmann, H.I. Optimal harvest of a forest in the presence of uncertainty. Can. J. For. Res. 1989, 19, 1267–274. [Google Scholar] [CrossRef]
  64. Tomlin, B. On the value of mitigation and contingency strategies for managing supply chain disruption risks. Manag. Sci. 2006, 52, 639–657. [Google Scholar] [CrossRef]
  65. Manley, B.; Watt, R. Forestry Insurance, Risk Pooling and Risk Minimization Options; Ministry of Agriculture and Forestry: Wellington, New Zealand, 2009. Available online: http://maxa.maf.govt.nz/climatechange/reports/forestry-insurance-risk-pooling-and-minimisation.pdf (accessed on 11 May 2016).
  66. Brumelle, S.L.; Stanbury, W.T.; Thompson, W.A.; Vertinsky, I.B.; Wehrund, D.A. A framework for the analysis of risks in forest management and silvicultural investments. For. Ecol. Manag. 1990, 35, 279–299. [Google Scholar] [CrossRef]
  67. Savage, D.W.; Martell, D.L.; Wotton, B.M. Evaluation of two risk mitigation strategies for dealing with fire-related uncertainty in timber supply modelling. Can. J. For. Res. 2010, 40, 1136–1154. [Google Scholar] [CrossRef]
  68. Gauthier, S.; Bernier, P.Y.; Boulanger, Y.; Guo, J.; Beaudoin, A.; Boucher, D. Vulnerability of timber supply to projected changes in fire regime in Canada’s managed forests. Can. J. For. Res. 2015, 45, 1439–1447. [Google Scholar] [CrossRef]
  69. Bettinger, P.; Boston, K.; Siry, J.P.; Grebner, D.L. Forest Management and Planning; Academic Press: Burlington, MA, USA, 2009; p. 331. [Google Scholar]
  70. Sturtevant, B.R.; Miranda, B.R.; Yang, J.; He, H.S.; Gustafson, E.J. Studying fire mitigation strategies in multi-ownership landscapes: Balancing the management of fire-dependent ecosystems and fire risk. Ecosystems 2009, 12, 445–461. [Google Scholar] [CrossRef]
  71. James, P.M.A.; Fortin, M.J.; Fall, A.; Kneeshaw, D.; Messier, C. The Effects of Spatial Legacies following Shifting Management Practices and Fire on Boreal Forest Age Structure. Ecosystems 2007, 10, 1261–1277. [Google Scholar] [CrossRef]
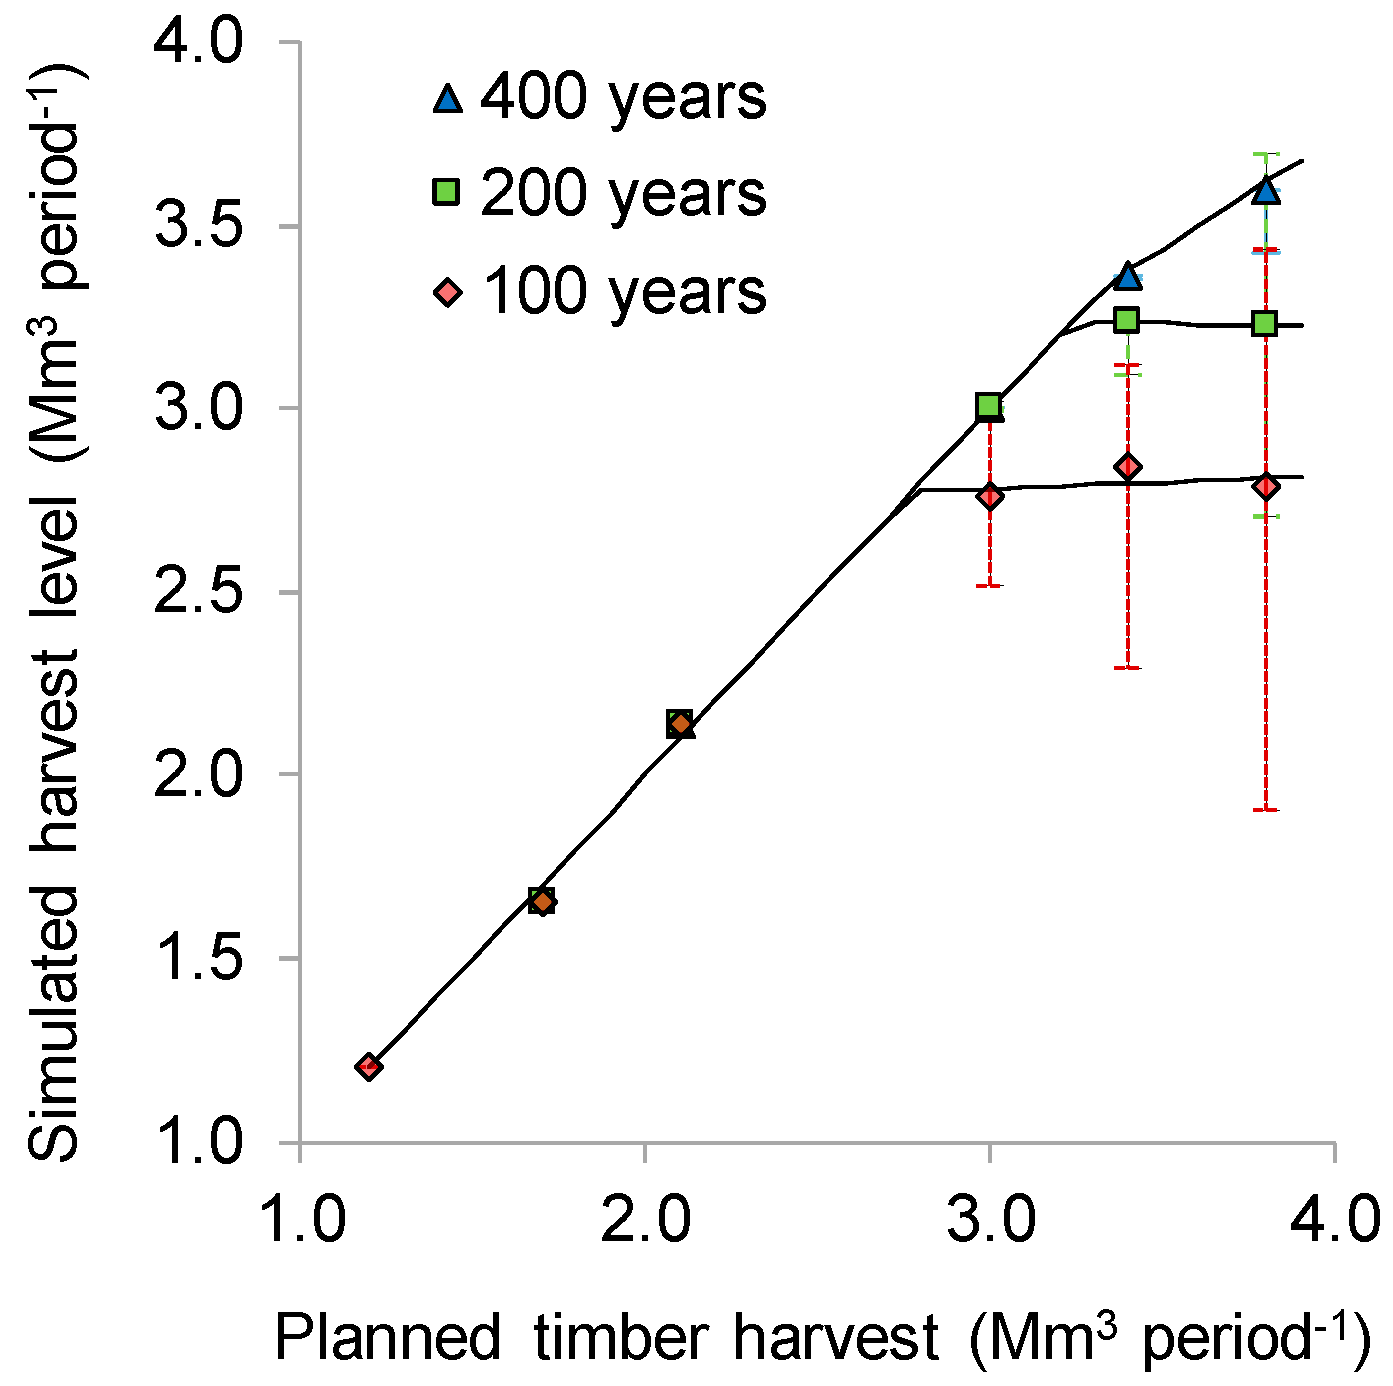
 [Green Version]
Figure 1. Location of study area Forest Management Unit 085-51. Grey polygons correspond to operating areas [45].
Forests 07 00107 g001
Figure 2. Box and whiskers plots representing the probability distributions of the simulated implementation of the optimal solution (3.8 Mm3 period−1) provided by the timber supply model (Equations (1)–(6)) under current (400 years) and probable interval for future fire regimes (100 and 200 years).
Forests 07 00107 g002
Figure 3. Probability distributions of the success rate of the simulated harvest schedule implementation under current ((a) 400 years) and probable future fire regimes ((b) 200 years; (c) 100 years). From bottom up, broken and bold lines represent the 5th, median and 95th percentiles. One hundred percent represents the target (continuous line) and ninety percent correspond to a cutoff value below which a timber supply disruption was considered to occur [57].
Forests 07 00107 g003
Figure 4. Relationship between planned timber harvest and its simulated implementation (median value) when considering the risk of fire for three fire cycles (100, 200 and 400 years). Parameters of the segmented linear models are provided in Table 1. Error bars represent the 5th and 95th percentiles of the probability distribution of simulated harvest levels.
Forests 07 00107 g004
Figure 5. Relationship between planned timber harvest and maximum value at risk for three fire cycles.
Forests 07 00107 g005
Figure 6. Distribution of the planned timber harvest into: a part that is not entirely feasible (planning optimism, in white, see Figure 4), a part that should be used to build a buffer stock of timber (dark gray) (with a timber harvest reduction—THR, which should not be harvested, or with an insurance premium, which should be harvested and set apart, with an interest rate between 0% and 4%) (protection strategy), and a part available for harvest (light grey), considering three possible fire cycles.
Forests 07 00107 g006
Figure 7. Relationship between median value-at-risk (VaR) and insurance premium as a function of interest rates (0% to 4%) and present (400 years) or probable fire cycles (100 and 200 years).
Forests 07 00107 g007
Table 1. Parameter values of piecewise linear models with one knot (threshold planned timber harvest (PTH)) (Equation (8)) relating PTH and periodic median realized harvest levels implemented with the landscape simulation model under current (400 years) and probable interval for future fire regimes (100 and 200 years).
Fire CycleThreshold PTH (Mm3 Period−1)β
1002.77 (0.18)0.04 (0.26) a
2003.23 (0.15)−0.01 (0.39) a
4003.34 (0.18)0.60 (0.25)
a Not significantly different from 0 at α = 0.05 (p = 0.78 and p = 0.96, respectively). Numbers in parentheses represent a half-confidence interval.

