Article

Adaptation of Leaf Water Relations to Climatic and Habitat Water Availability

CSIRO Land and Water Flagship, Sandy Bay, Tasmania 7005, Australia
*
Author to whom correspondence should be addressed.
Forests 2015, 6(7), 2281-2295; https://doi.org/10.3390/f6072281
Submission received: 8 April 2015 / Revised: 4 June 2015 / Accepted: 17 June 2015 / Published: 30 June 2015
(This article belongs to the Special Issue Responses of Forest Trees to Drought)

Abstract

:
Successful management of forest systems requires a deeper understanding of the role of ecophysiological traits in enabling adaptation to high temperature and water deficit under current and anticipated changes in climate. A key attribute of leaf water relations is the water potential at zero turgor (πtlp), because it defines the operating water potentials over which plants actively control growth and gas exchange. This study examines the drivers of variation in πtlp with respect to species climate of origin and habitat water availability. We compiled a water relations database for 174 woody species occupying clearly delineated gradients in temperature and precipitation across the Australian continent. A significant proportion of the variability in πtlp (~35%) could be explained by climatic water deficit and its interaction with summertime maximum temperature, demonstrating the strong selective pressure of aridity and high temperature in shaping leaf water relations among Australian species. Habitat water availability (midday leaf water potential), was also a significant predictor of πtlp (R2 = 0.43), highlighting the importance of species ecohydrologic niche under a set of climatic conditions. Shifts in πtlp in response to both climatic and site-based drivers of water availability emphasises its adaptive significance and its suitability as a predictor of plant performance under future climatic change.

1. Introduction

Predicted increases in extremes such as drought events and heat waves, in conjunction with long-term changes in water availability (increasing or decreasing) and temperature regimes (increasing) will potentially drive significant changes in forest productivity. Successful management of existing or new forests to deliver a range of commodities and environmental services under these conditions must include careful consideration of species capacity to absorb future climatic disturbances and adapt to future climate regimes. This requires a deeper understanding of the role of ecophysiological traits in enabling adaptation of species and genotypes to high temperature and water deficit.
Adaptation to water deficit can be defined in relation to mechanisms that control leaf water status and cell turgor [1]. Maintenance of leaf turgor is critical to the continuance of growth and gas exchange in the face of declining water availability [2,3,4]. The water potential at zero turgor or turgor loss point (πtlp) and the corresponding relative water content helps to define the operating water potentials over which plants actively regulate water status and is often lower in species with greater dehydration tolerance [1,5]. Plants actively accumulate solutes in order to lower their osmotic potential during water deficit, thereby sustaining turgor and prolonging water uptake [6]. Similarly, leaves with highly elastic tissues reduce steep declines in cell turgor because their cells contain more water at full turgor and can sustain larger declines in volume [1]. Pressure-volume relationships are routinely used to estimate these key parameters of leaf physiology [7] and are often interpreted as indicators of species drought tolerance i.e., the ability to maintain physiological function at low water status [8,9].
A large body of work has documented the significance of leaf turgor maintenance traits that enable survival and growth under a range of habitats and climates (see [10] and references therein). The water potential corresponding to zero turgor has been shown to be similar to the point at which stomata close as evidenced by studies involving four tropical [11] and three temperate species [12] and represents an important trait in defining plant hydraulic strategies [13]. Global analyses show that πtlp can vary 3-fold between crop and native arid-land species and lower πtlp appears to be associated with drier environments [10]. These leaf water relations traits have also been shown to correlate with leaf structural attributes in dry [14] and wet habitats [15], indicating either a direct functional link between leaf water management and leaf construction or co-selection for structural and physiological leaf traits. Differences in the ability of species to access and manage water within a particular habitat, i.e., their ecohydrologic niche, also drives a significant amount of variation in species responses to water deficit and associated traits such as πtlp. While meta-analyses by Bartlett et al. [10] demonstrated a decline in πtlp with increasing aridity across different biomes, it is unclear how the relative contribution of climatic water availability (across a species climatic envelope) as opposed to local habitat factors and species water management strategies influence patterns in leaf water relations, specifically πtlp. Assessing the significance of both climatic and habitat water availability in driving variation in πtlp may help to clarify role of turgor maintenance in defining species distributions at both the landscape and regional scales.
Until recently, the influence of functional traits such as πtlp on species distributional limits has been unclear and species distribution modelling has relied predominately on the known presence and/or absence of species based observations of their occurrence [16]. The inclusion of definitive functional attributes that can link a species climatic niche back to relevant physiological or ecological thresholds offers much promise in better utilising the rapidly improving species databases and high resolution climate data. This may be achieved by gaining a better understanding of how particular traits or clusters of traits control plant performance and survival under stressful (or non-stressful) conditions and how these traits vary within and between species with respect to their observed climatic envelope and their ability to access and regulate water within the landscape. In the context of water deficit and heat stress, such analyses would help clarify the extent to which a trait plays an adaptive role in defining species distribution and vegetation function. This information will assist in characterising species sensitivity within existing and new environments, making it possible to quantify the likely impact associated with exposure from future climates.
Australia is a predominately water-limited environment and its vegetation has been shaped by water availability [17,18]. The long history of water relations research in Australia provides a unique data resource and opportunity to test the adaptive significance of leaf water relations traits across well delineated aridity and temperature gradients. This study tests the hypothesis that πtlp is a key adaptation to water stress and lower values of πtlp enable survival in drier and warmer environments. Specifically, we addressed the following questions: (1) Which climatic indices, derived from a species observed climatic niche (including the middle and tail regions of this distribution), are more closely associated with variation in πtlp among Australian species? (2) What is the significance of species habitat water availability or ecohydrologic niche and associated leaf water relations traits in modulating adaptation to drier and warmer climates?

2. Experimental Section

2.1. Leaf Water Relations Database

A traits database was compiled using published literature from Australian studies (n = 45) or studies involving Australian species conducted elsewhere (n = 2). A literature search, using Web of Science and Google Scholar, as well as locally available library databases (CSIRO Library) was conducted to find studies that had measured key plant water relations traits, in particular, studies that had conducted pressure-volume analyses and collected leaf water potential on Australian species. All studies included in the meta-analysis used the bench-drying technique to derive leaf water relations parameters [7]. Thus, all entries included, at a minimum, osmotic potential at zero turgor (πtlp) as well as osmotic potential at full turgor (π0) and bulk tissue elasticity (ε). The database also included details on species name (updated where necessary), experiment type and treatment, vegetation type, tree size/age, site location and study timing.
The extent to which plants were subjected to water deficit, whether it was imposed experimentally or was experienced as part of a seasonal pattern, was classified into three levels: Well-watered—no evidence of water deficit relative to seasonal patterns; moderate—Usually the initial or intermediate level of water stress imposed inducing partial stomatal closure or coinciding with a marked dry season; severe—Water deficit invoking full stomatal closure and/or significant drought damage or mortality. An assessment of the levels of water deficit experienced during a study allowed us to compare species at relatively similar levels of water stress and investigate the significance of osmotic and elastic adjustment among different studies. Where studies involved intra-specific comparisons of populations and/or provenances, a species mean for all corresponding leaf water relations data across different populations/provenances was used in the analysis.

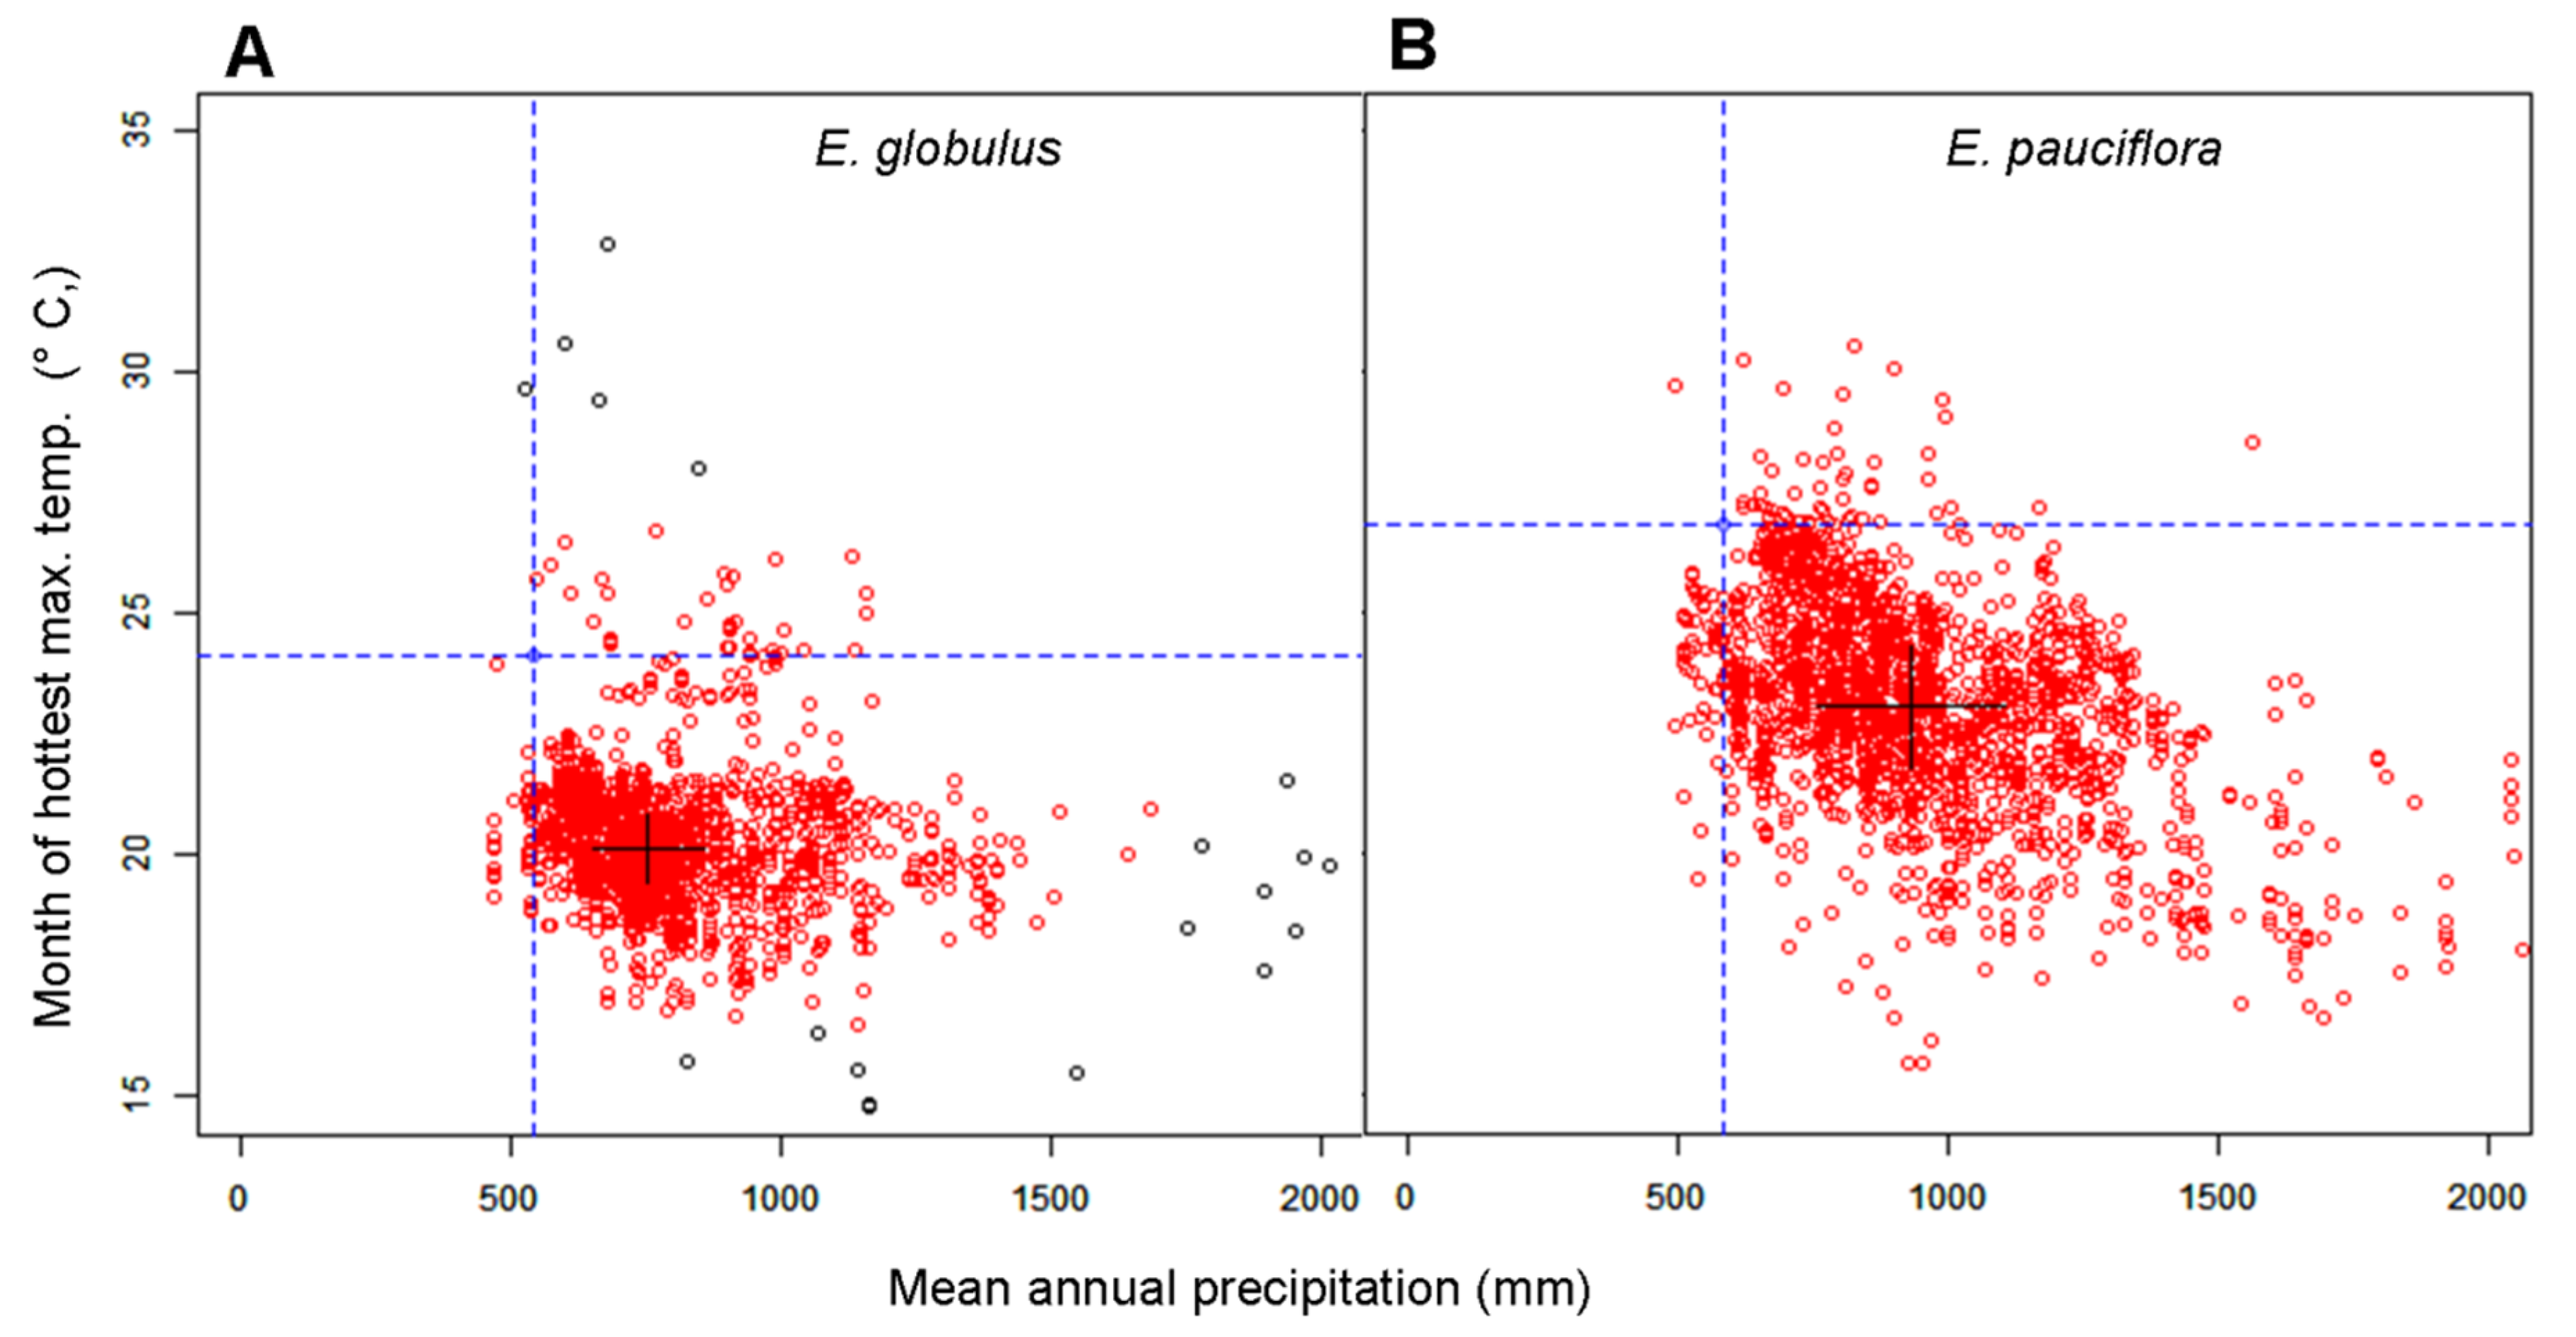
2.2. Species Climatic Envelope Analysis

The approach in this study was to use observed values of πtlp obtained at a particular site as being representative of the species more broadly and relate these data to different portions of the species climate niche across its observed range. The climatic conditions of observed species distributions were assessed using the Atlas of Living Australia (ALA). The ALA is one of the most sophisticated national biodiversity databases offering access to high quality data on individual observations of species occurrence and high resolution climate surfaces [19]. The ALA now includes more than 40 million records of plant and animal species distributions and more than 300 layers of information on environmental, social and economic factors across Australia [19]. The species occurrence records include natural and introduced locations collected from a range of sources that are either specimens (records managed as part of a scientific collection) or observations (records of the sighting by an individual or member of an organisation). These data are supplemented by a range of other data such as images, molecular DNA data, identification keys or relevant literature describing the species. Species occurrences (using only validated records) were downloaded from the ALA using the “mapping and analysis” portal.
The climate layers used in the analysis were based on a gridded dataset (~ 1 km × 1 km) extracted from the environmental layer portal on the ALA. These climate layers were derived using version 3 of the national, 9 second DEM, re-sampled to 0.01 degrees, with the ESOCLIM module of ANUCLIM version 6.0 (beta) with the Australian Climate Surfaces version 2.1 [20]. The derived climate variables are 12-monthly mean values for minimum temperature, maximum temperature, precipitation, solar radiation, evaporation, wind and others. Three statistics were derived from the 12 monthly layers—Annual minimum, annual maximum and annual mean. The key climate variables used in the analysis were mean annual precipitation (MAP), mean annual aridity index (mean annual evaporation divided by mean annual precipitation), mean annual precipitation deficit (MAPD; mean annual precipitation minus mean annual evaporation), mean annual temperature (MAT) and maximum temperature of hottest month (MTHM). These climate variables were chosen based on their relevance to the characterisation of water deficit and high temperature stress for a given species distribution.
From the extracted climate data we computed indices based on the middle (median) and the driest and warmest tails of the observed species climatic envelope to provide an indication of the climate at the middle region and the margins of the species climatic niche (see Figure 1 for an example). A 0.02 percentile value was used to represent the dry tails of the MAP, aridity index and MAPD data and a 0.98 percentile value was used to represent the warm tails of the MAT and MTHM data. These percentile values were used to represent relatively “extreme” edges of the species climatic niche based on previous work that identifies these values as important thresholds for plant survival under drought across Australian vegetation types [21]. The presence of outliers in the species occurrence data was identified as either any value less than 0.05 percentile and less than one and a half times the inter-quantile range (IQR) or greater than 0.95 percentile and greater than one and a half times the IQR. Unless otherwise stated, reference to the five climatic variables derived from the species distribution refer to their median value.
Figure 1. Scatter plot of mean annual precipitation (MAP) versus maximum temperature of hottest month (MTHM) for all recorded species locations for (A) Eucalyptus globulus and (B) E. pauciflora. The solid vertical and horizontal lines denote the interquartile range and the dashed blue lines denote the 0.02 and 0.98 percentile for MAP and MTHM respectively. Black symbols denote outliers, that weren’t included in calculations of climatic indices, whereas red symbols were included in the analysis.
Forests 06 02281 g001

2.3. Statistical Analysis

Single and multiple regression analyses were done on non-transformed data at p < 0.05 significance level. Model comparisons of two-way relationships between climate indices versus πtlp were undertaken using the model selection function in MuMIn package [22]. The Alkalike information criterion (AIC) was used to select candidate models. Correlation tests were performed between trait data using Pearson’s moment correlation tests. All statistical analyses were performed in R (v2.15.0, R Foundation for Statistical Computing).

3. Results

The Australian water relations traits database included 174 species and 74 genera for which there were data for πtlp, π0 and/or ε. About half of these studies also measured predawn leaf water potential (Ψpd) and/or midday leaf water potential (Ψmd). The vast majority of studies were conducted on plants that were either sampled during periods of high water availability or under well-watered conditions (in the case of experimental studies). Values of πtlp obtained under non-stressed conditions have shown to be good predictors of any subsequent changes in πtlp in response to water deficit [23].
According to Whitakers global biome classification [24], the majority of species in the database belong to the savanna, grassland, Mediterranean and desert biomes (Figure S1). The bulk of the species within the database were derived from climates with MAP < 1000 mm and MAT > 10 °C, reflecting the relatively dry and warm climates experienced across much of the Australian landscape. The number of records obtained from the ALA for describing the climatic niche of the 174 species in the traits database ranged from 4 to 30,560 (mean = 2376).

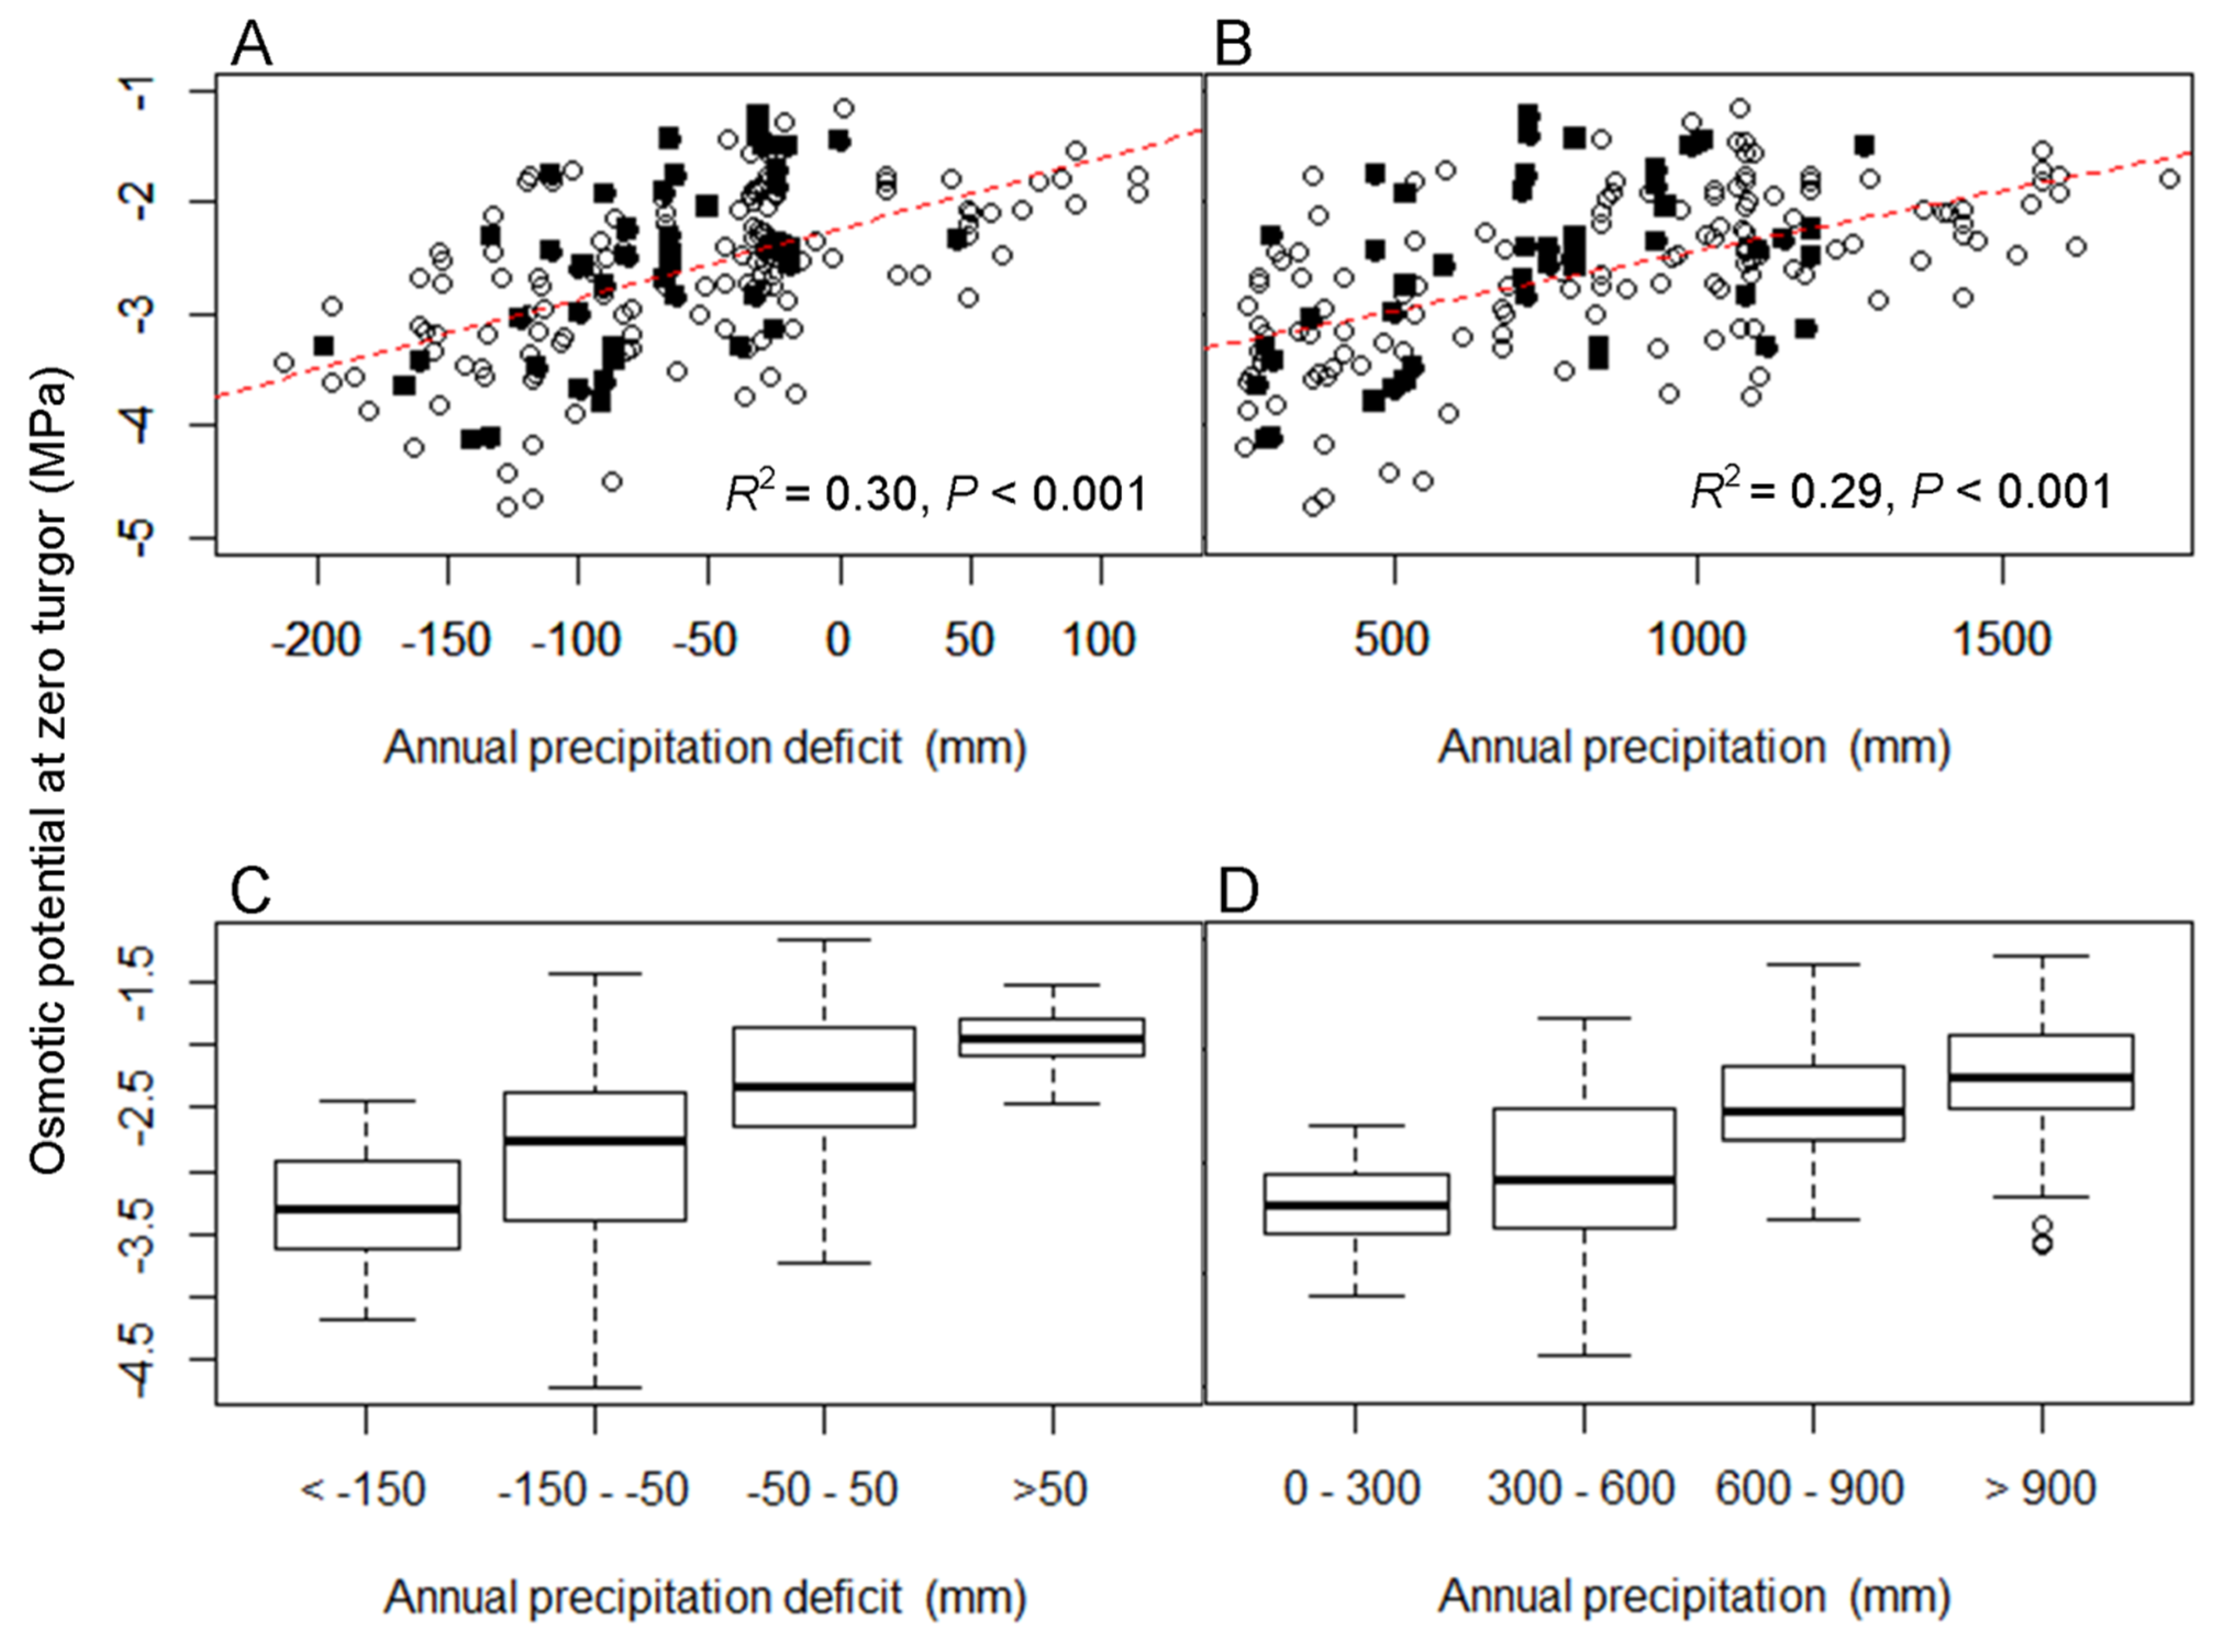
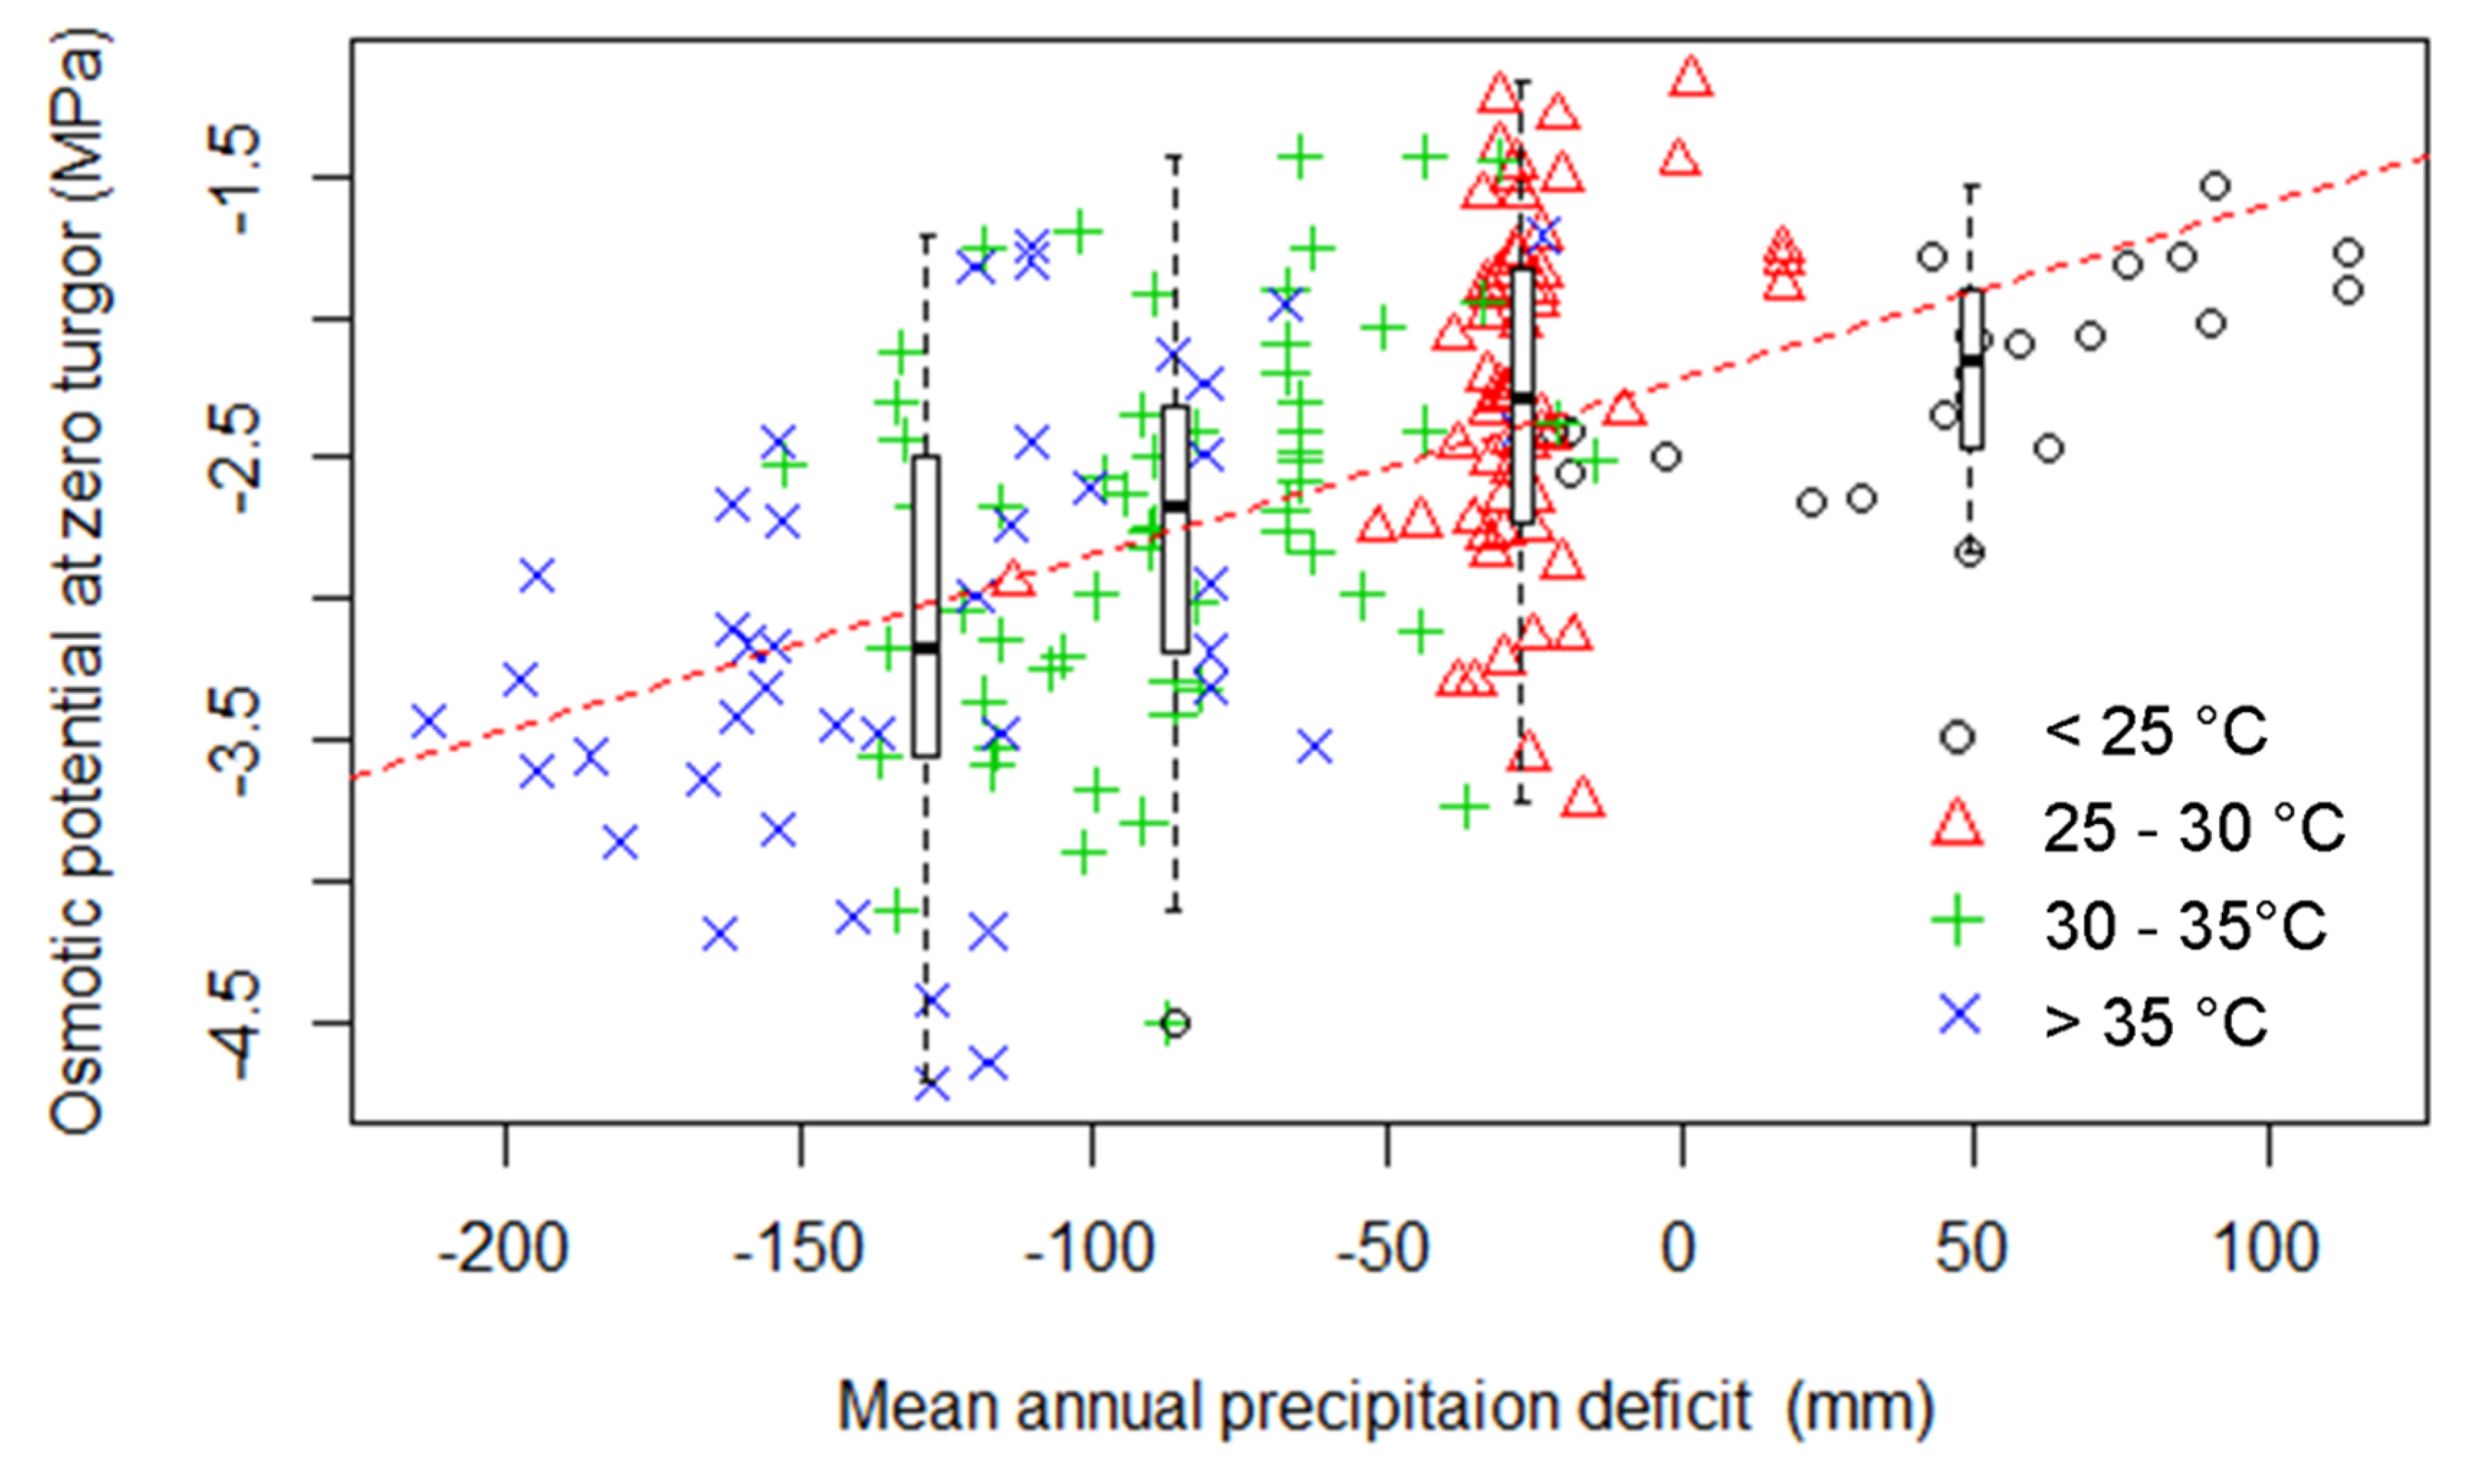
3.1. The Relationship between Turgor Loss and Climate

Of the five climatic indices examined, the median value of MAP and the MAPD were the best single predictors of πtlp (Table 1, R2 = 0.29–0.30). πtlp was positively correlated with MAPD and MAP and showed a consistent decline across all four bins in response to decreasing MAPD (y = 0.006x − 2.23, Figure 2). Overall, πtlp varied from −1.16 to −4.72 MPa and showed largest statistical dispersion (based on interquartile range and standard deviation) at values of MAPD between −150 and −50 mm (−1.43 to −4.72 MPa). Mean annual precipitation deficit was also a strong predictor of the πtlp for the eucalypt species within the database (Figure 2; R2 = 0.32, n = 47). In contrast to MAPD and MAP, there were negative correlations between mean annual temperature and πtlp, and while the relationship was statistically significant, this relationship was weak (Table 1, R2 = 0.06). However, maximum temperature of the hottest month (MTHM) performed reasonably well (Table 1, R2 = 0.21). We also tested how well the values of these climate variables at the warm and dry edges of the species’ climatic distributions could predict πtlp. The results show that values that represent either warm or dry tails of the distribution (0.98 and 0.02 percentiles respectively) consistently explained slightly less of the variation in πtlp but were still significant (Table 1; R2 = 0.06–0.27). The climate variables evaluated here were only weakly positively correlated with π0 (e.g., MAP, R2 = 0.17, p < 0.05) and there were no relationships between any of the climate indices analysed and bulk tissue elasticity (data not shown).
Table 1. Results from regression analysis between osmotic potential at zero turgor versus five different climate indices (aridity index, mean annual precipitation, precipitation deficit, mean annual temperature and mean maximum temperature of hottest month) extracted from observed species occurrences (n = 174). The 0.50 and 0.98/0.02 percentile values from the species climatic distribution.
Percentile of DistributionVariableParameter EstimateSEp ValueAdjusted R2
0.50Aridity index0.330.05<0.0010.16
Mean annual precipitation0.0010.0001<0.0010.29
Precipitation deficit0.0060.0007<0.0010.30
Mean annual temperature−0.050.01<0.0010.06
Max. temperature of hottest month−0.070.01<0.0010.21
0.02Aridity index0.780.11<0.0010.21
Mean annual precipitation0.0010.0001<0.0010.25
Precipitation deficit0.0050.0006<0.0010.27
0.98Mean annual temperature−0.040.01<0.0010.05
Max. temperature of hottest month−0.060.01<0.0010.20
Figure 2. Relationship between species climatic water availability and osmotic potential at zero turgor for all species in the database (n = 174). Scatter plot of (A) mean annual precipitation deficit (R2 = 0.30, p < 0.001) and (B) mean annual precipitation versus osmotic potential at zero turgor (R2 = 0.29, p < 0.001) and box (spanning the 25th to 75th percentiles and bold line at the median) and whiskers (spanning the 5th to 95th percentiles) of binned data for (C) mean annual precipitation deficit and (D) mean annual precipitation. (A) and (B) are fitted with linear regression (red dashed line) see Table 1 for details. The solid square symbols in (A) and (B) represent values for Eucalyptus spp. (n = 47).
Forests 06 02281 g002
While MAP and MAPD were the best single predictors of πtlp, using an interaction term between MAPD and MHMT (at 0.98 percentile) improved the fit to the data (Figure 3; R2 = 0.35, p < 0.001). Species climate envelopes that included extremely high summer temperatures (MHMT > 35 °C) tended to have more negative πtlp than those species with cooler summer maximum temperatures (Figure 3).
Figure 3. Relationship between mean annual precipitation deficit versus the osmotic potential at zero turgor (R2 = 0.30, p < 0.001). Data are binned by maximum temperature in hottest month (0.98 percentile) and box and whisker plots are drawn based on this binned data. Data are fitted with linear regression (red dashed line), see Table 1 for details.
Forests 06 02281 g003

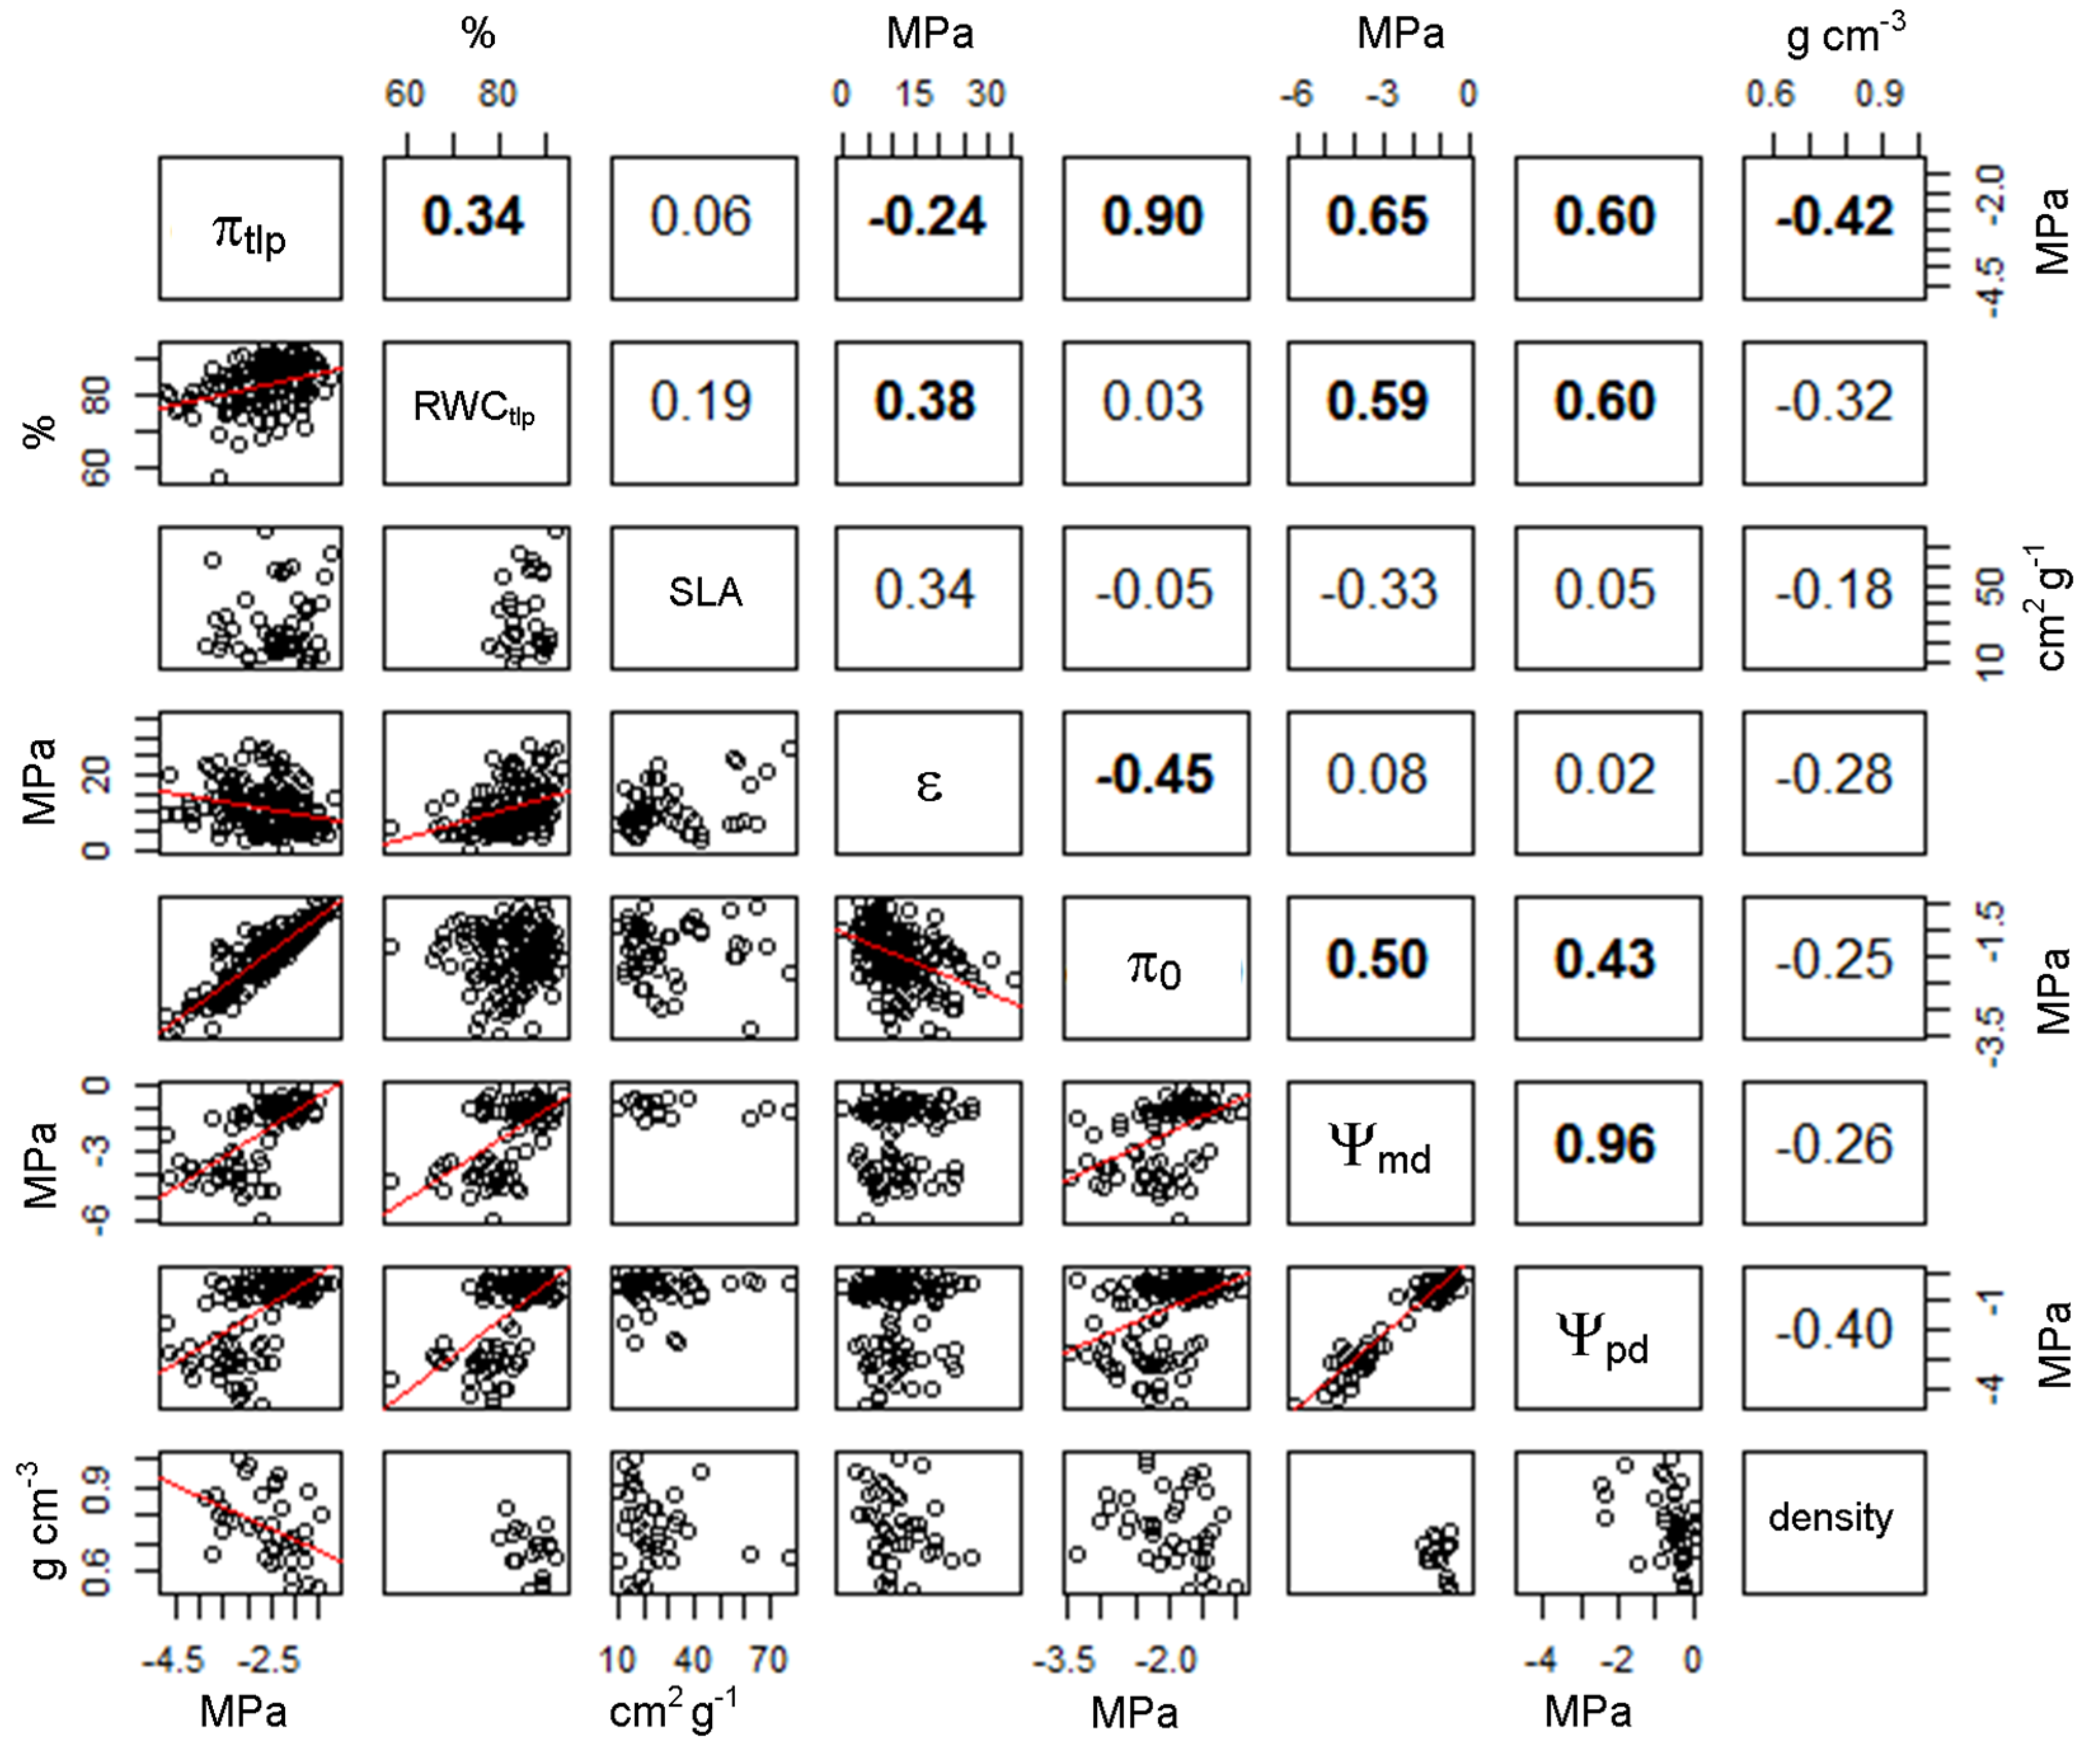
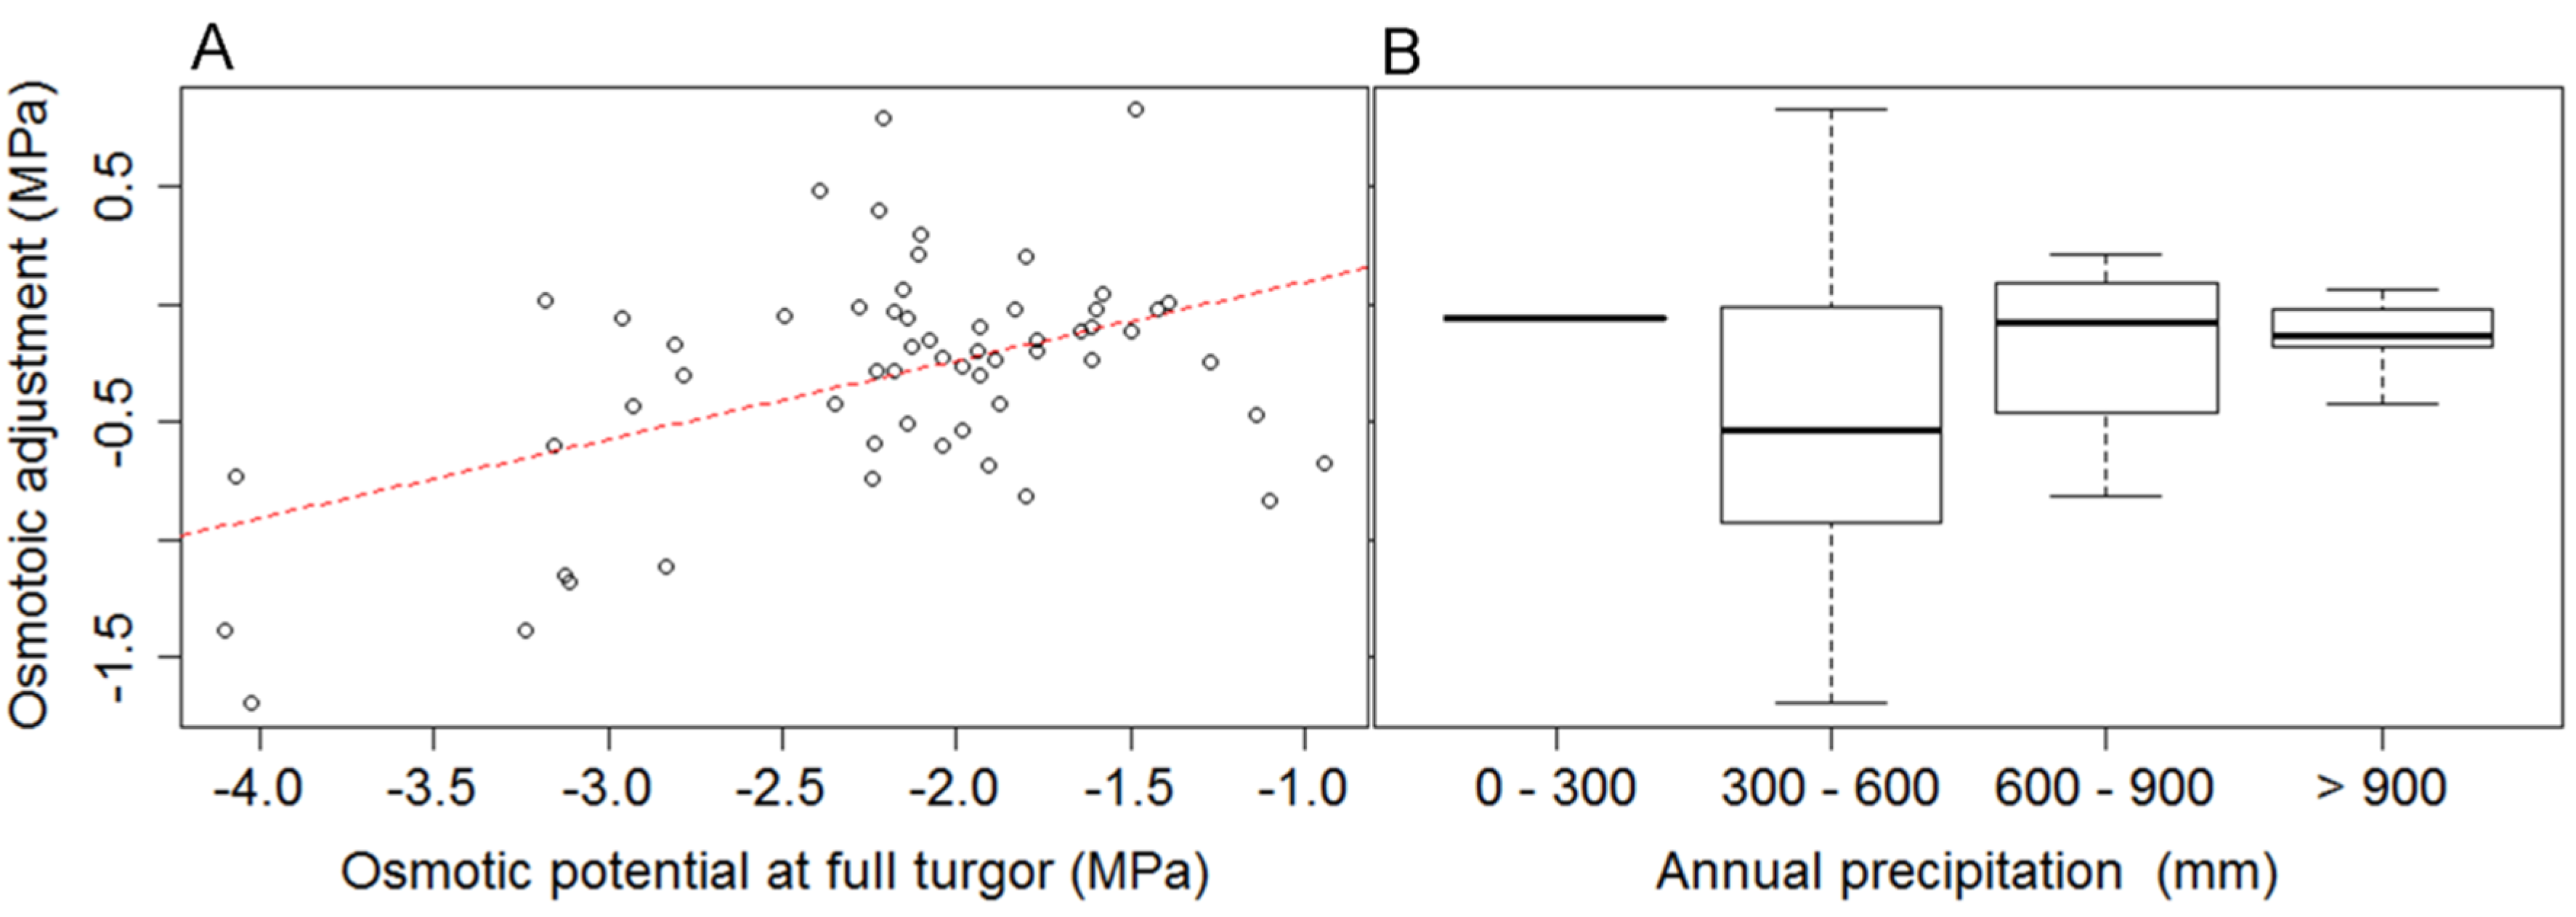
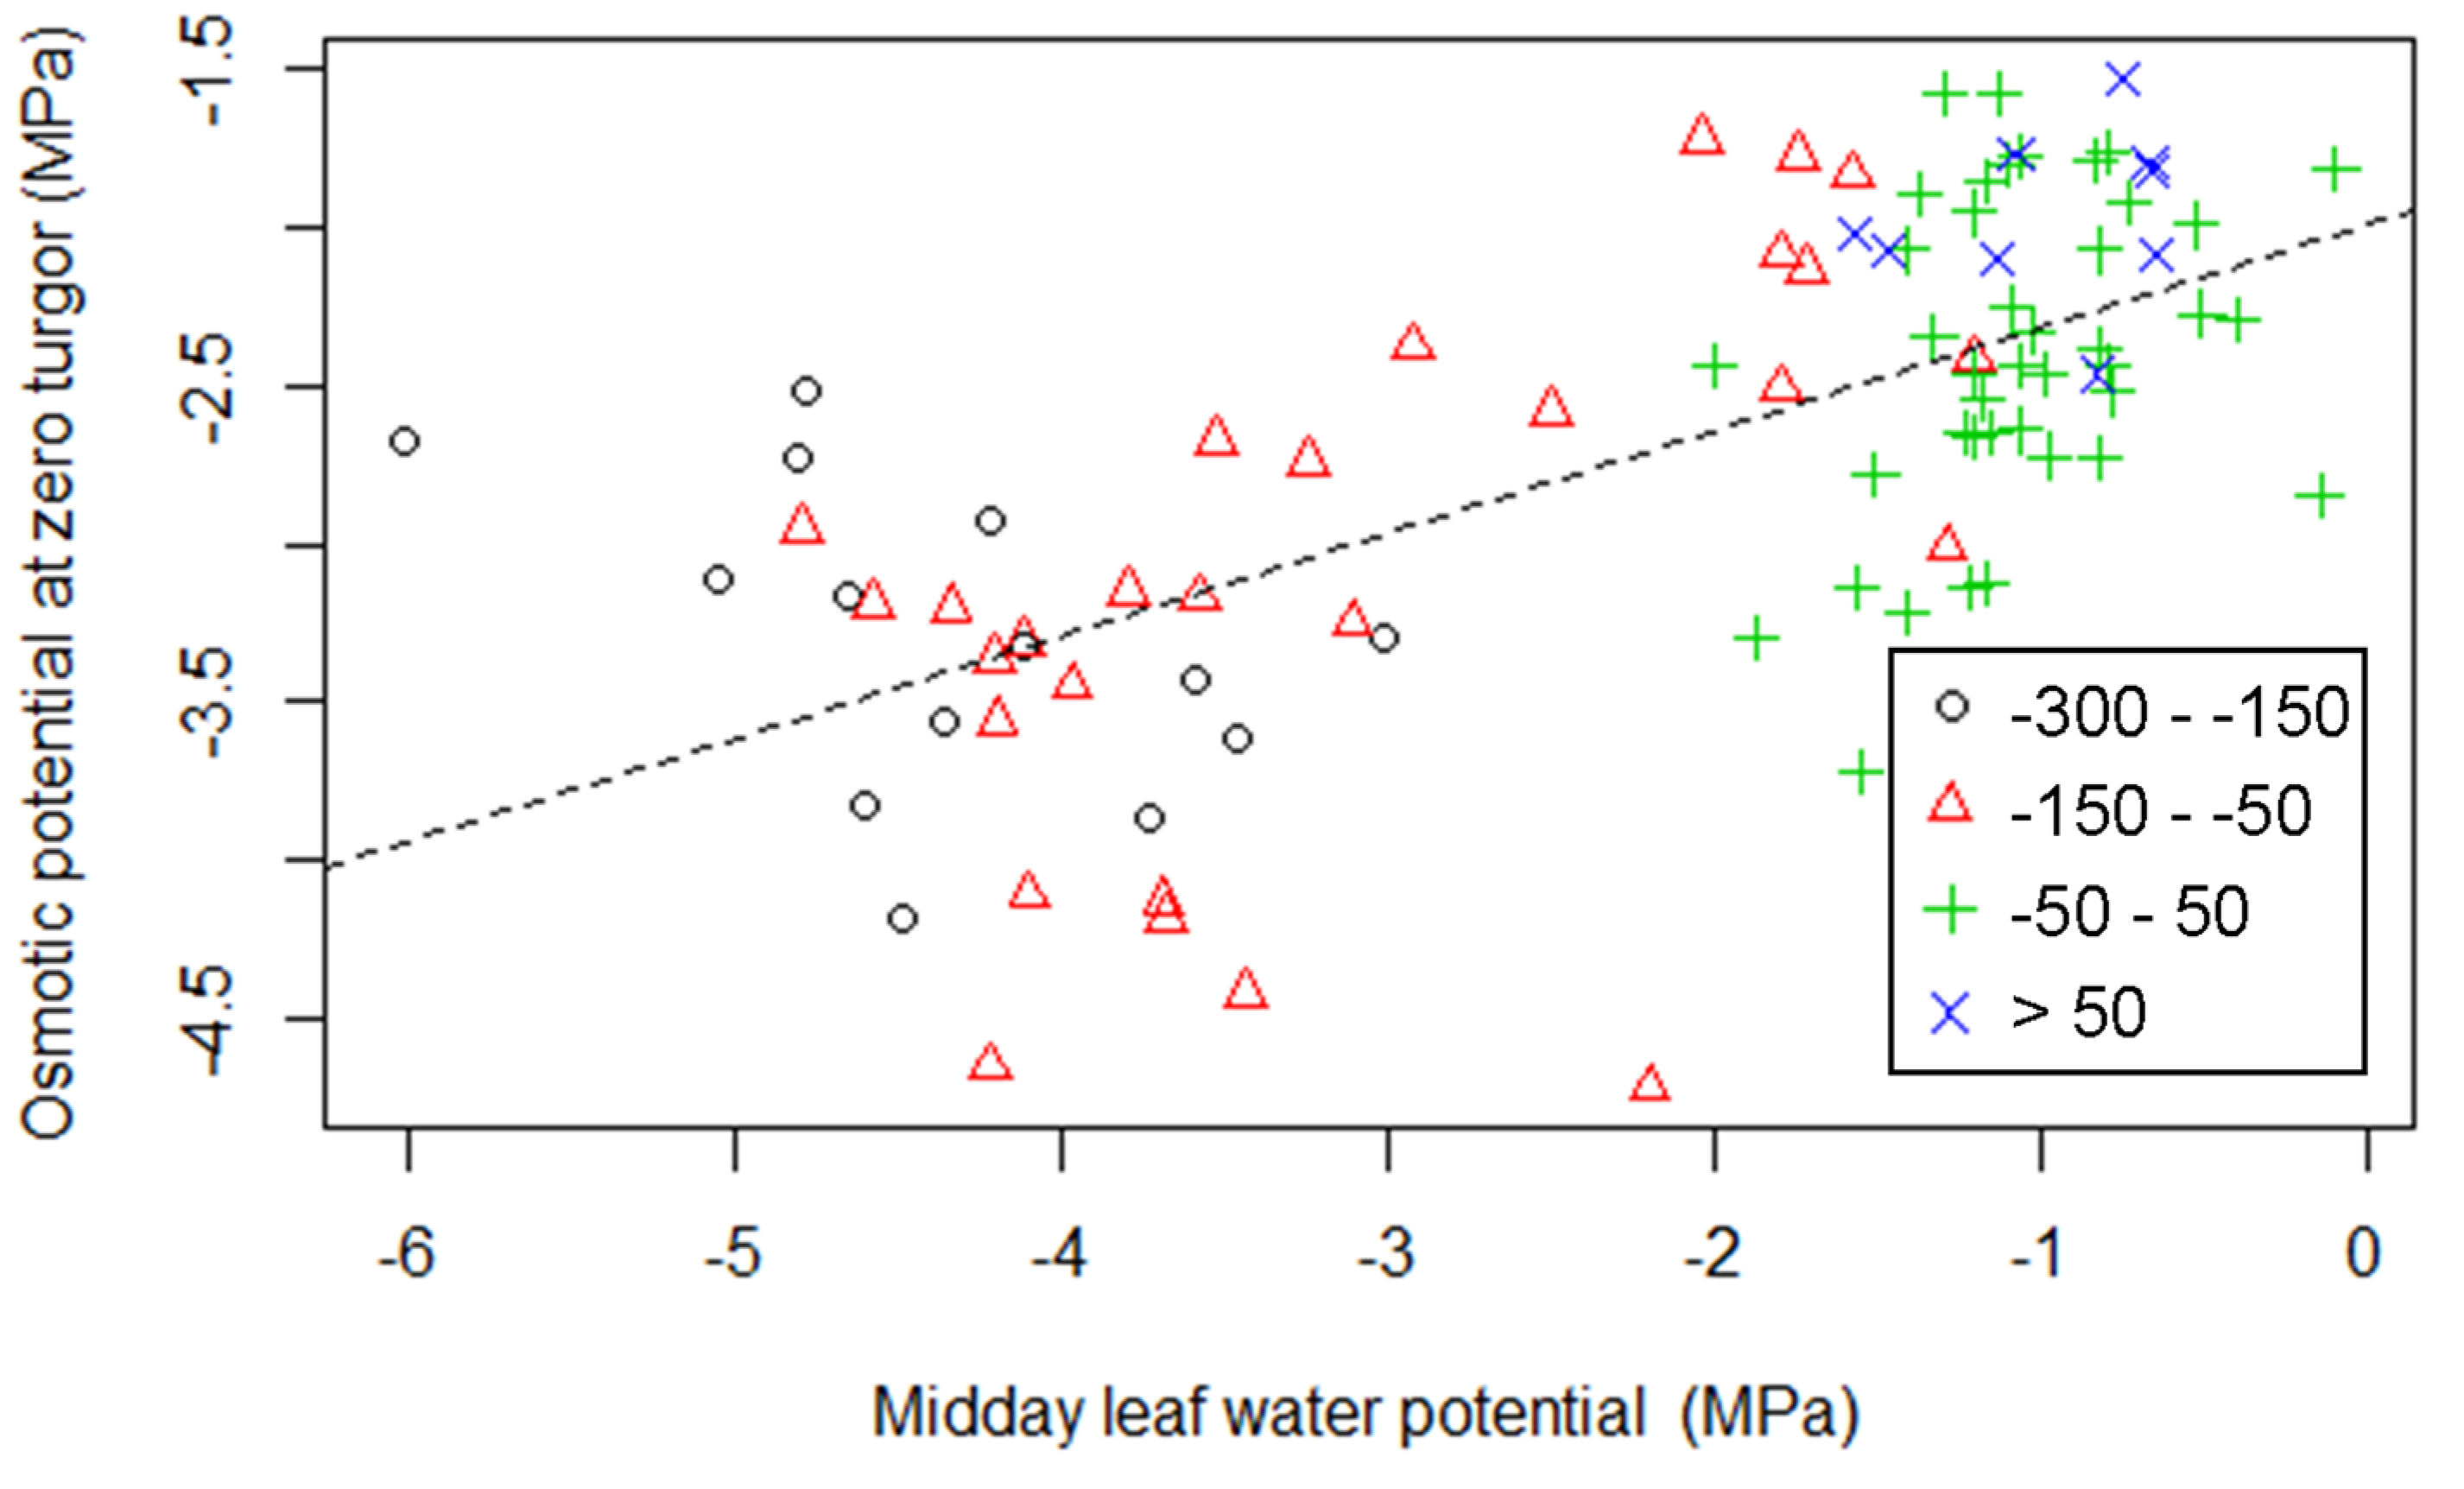
3.2. Relationship between Turgor Loss and other Leaf Traits

We observed a positive relationship between πtlp and Ψmd (Figure 4, R2 =0.43, P < 0.001) and for Ψpd (Figure 4, R2 = 0.42, p < 0.001). For some of the species in the database the πtlp was less than Ψmd indicating periods of zero turgor during the study period (Figure 4). A similar relationship was observed between Ψmd and the relative water content at zero turgor (Figure 5). We observed a strong positive relationship between π0 and πtlp (Pearson’s r = 0.90, Figure 5). There was a negative relationship between π0 and ε (Pearson’s r = 0.44, Figure 5). There were fewer species data for many of the additional traits included in the database including; specific leaf area and wood density and these showed weak correlations to the plant water relations traits (Figure 5).
For 57 species in the database, there were data for changes in π0 between well-watered conditions and either seasonal water deficit under natural conditions (for saplings and adults, n = 42) or water deficit imposed through an experimental treatment (for seedlings, n = 23) (Supplementary Figures S2 and S3). Several studies involved comparisons among different clones or provenances for species ability to adjust π0 in response to water deficit. The majority of species showed osmotic adjustment within 1.0 MPa, while some species adjusted π0 by up to 1.7 MPa (Figure 6) and π0 (under well-watered conditions) was a good predictor of the extent to which species adjusted πtlp during periods of water deficit. The largest adjustments (negative) in π0 was observed in species from drier environments (MAP < 600 mm), however these species also showed greatest variation in osmotic adjustment (R2 = 0.06, not significant, Figure 6) and this relationship (change in π0 versus MAP) was particularly weak for the data that included seedlings only (data not shown).
Figure 4. Relationship between the midday water potential and osmotic potential at full turgor (n = 92). The data are grouped by four different levels of mean annual precipitation deficit (mm). The data are fitted with linear regression (red dashed line; r2 = 0.43, p < 0.001).
Forests 06 02281 g004
Figure 5. Correlation matrix of all plant traits included in the database. Scatter plots in lower, left quadrant are fitted with a linear function for significant correlations (p < 0.01). Values in the upper right quadrant are Pearson’s correlation coefficients with bold text denoting significant correlation (p < 0.01).
Forests 06 02281 g005
Figure 6. Relationship between osmotic adjustment and (A) osmotic potential at full turgor (under high water availability) and (B) mean annual precipitation. Data in (A) are fitted with linear regression (red dashed line; r2 = 0.22, p < 0.001).
Forests 06 02281 g006

4. Discussion

We compiled a database of species leaf water relations that spanned almost 50 years of plant water relations research in Australia and covered a considerable range of vegetation and plant functional types across the Australian continent. In this study, key climatic indices were extracted from different middle and tail regions of species climatic envelopes in order to assess the role of aridity and high temperature as selection pressures on leaf water relations among a large group of species (n = 174). By also evaluating the influence of habitat water availability across these climatic gradients, our study builds on a growing body of work that links key functional traits to a species habitat and climatic range and strengthens efforts to predict shifts in forest distribution and function under a changing climate.
A significant proportion of the variability in πtlp was explained by climatic indices based on precipitation (MAP) or climatic water deficit (MAPD). This observation supports the finding of Bartlett et al. [10,23] and others [25] that πtlp is an adaptive trait whereby a lower πtlp allows species to tolerate increased aridity in terms of lower precipitation and/or increased evaporative demand. Furthermore, the relationship between πtlp and MAPD was also maintained among the eucalypt spp. (n = 47) in the database, supporting the suggestion that turgor maintenance traits explain much of the distribution of the dominant genus in forests across Australia [26]. However, our study furthers our understanding of leaf physiological adaptations to climate by showing a significant interaction between maximum temperature (MHMT) and MAP in influencing variation in leaf turgor maintenance (R2 = 0.35). This result indicates an important role for high temperature in modulating πtlp among species. There is likely to be strong selection for low πtlp in dry climates with high summer temperatures given the potential for additional heat stress if turgor loss triggers stomatal closure. High temperature stress is amplified under water stress when leaf cooling via transpiration ceases after stomatal closure [27]. This could trigger leaf or whole-tree mortality if leaf temperatures exceed ambient air temperatures and reach critical temperatures for maintaining cell function [28,29]. It remains to be tested whether πtlp also co-varies with those leaf traits associated with resistance to high temperature stress. These data support recent studies that highlight the strong interaction of drought and high temperature stress in affecting tree functioning and survival in Australia [21] and globally [30]. Our findings demonstrate a role of both aridity and high temperature in controlling leaf water relations and πtlp presumably because conditions of high evaporative demand and high temperature exert strong selection pressure on species to adequately regulate their physiology over a given range of leaf water potentials and temperatures.
In general, the inclusion of climate indices based on the dry tails of the species distribution (e.g., MAP and MAPD) did not strengthen the relationship between climatic indices and πtlp, compared to climate indices derived from the median (Table 1). It is likely that these climate-trait relationships are maintained at both parts of the distribution because values derived from the median scale linearly with those at the dry or warm tail of the distribution.
This study also elucidates the role of species habitat water availability and water management strategy, in addition to species climatic envelope in driving species leaf water relations. Species that experience lower Ψmd (and lower Ψpd) tended to have lower πtlp, particularly for those species from more arid environments. Variation in habitat water availability is also reflected in the larger dispersion in πtlp at observed in MAPD between −50 to −150 mm (Figure 2). This suggests that increasing aridity drives greater selection pressure for different strategies to exploit a wider range of potential water sources and ecohydrologic niches [31]. Regulation of water use must also closely align with spatial and temporal patterns in water availability thereby promoting strong divergence in water status, particularly during dry periods [32]. The tendency for larger trait variation in drier climates is consistent with other drought trait databases such as the global analysis of stem embolism resistance (defined using the water potential at 50 percent loss of hydraulic conductivity), that shows increasing trait variation with climatic water availability [33]. In this study, climatic water deficit explained only ~ 30% of the variation in πTLP. These patterns among drought resistance traits indicate the significance of contrasting water management strategies that may diminish the importance of a single trait πtlp in enabling survival under water deficit. Hence, at the whole plant level, species responses to increasing aridity involves the coordination of multiple traits and provide differential responses to drought and rates of recovery following drought.
Shifts in turgor maintenance are a good example of how alternative strategies may bring about similar outcomes for tolerating low water availability. Osmotic adjustment is widely evaluated in order to compare drought tolerance among differing species and genotypes [23], however elastic adjustment or increased elasticity (lower ε) can potentially buffer against steep declines in water status [5,34]. The relatively weak relationship we observed between differential modes of turgor maintenance; osmotic adjustment and bulk tissue elasticity versus aridity suggests no consistent shift in determinants of leaf turgor. The negative relationship between π0 and ε is consistent with the trade-off observed among many species exhibiting either lower elasticity or osmotic potential (less negative) or higher elasticity and osmotic potential [10,25,35]. This trade-off probably originates from a biophysical requirement of tissues and cells to either accumulate solutes accompanied by a decrease in elasticity to avoid cell rupture or increased elasticity without having to incur the cost of producing compatible solutes [35]. Several studies in dry climates show strong divergence in turgor maintenance patterns among sympatric or closely related species that confer resistance to water deficit [13,35,36].
Intra-specific variation in πtlp may also drive adaptation across the species distribution. Evidence for systematic variation in πtlp under well-watered conditions is limited in woody species and most studies included in the database showed non-significant differences in πtlp among genotypes [37,38,39], whereas variation among genotypes tends to occur in response to seasonal or short-term water deficit suggesting plasticity in ability to adjust πtlp among genotypes [39,40]. Nevertheless patterns in πtlp presented here would suggest that single parameters of species climatic envelope and corresponding mean trait value provide a fairly robust indication of inter-specific patterns in adaptation to aridity.

5. Conclusions

We showed that among the 174 woody species for which there were data for πtlp, a large proportion of the variability in πtlp could be explained by mean annual precipitation or climatic water deficit (precipitation deficit). While similar biome and species-level patterns in πtlp has been demonstrated in global meta-analyses that considered species aridity values from the study site [10,23], our study also confirmed the significance of an interaction between hottest monthly maximum temperature with climatic water availability. This provides evidence for strong selective pressure from both water deficit and high temperature in defining physiological strategies among Australian species. Furthermore, habitat water availability and plant water management patterns as reflected by differences in midday leaf water potential was a slightly better predictor of πtlp across these gradients in aridity, highlighting the fundamental importance of these factors, in addition to the prevailing climatic conditions, in modulating the operating range over which plants may actively sustain turgor. Further research is required to examine the relationship between turgor maintenance parameters and other traits known to exert strong controls on plant performance under water deficit across a broad range of species, e.g., leaf hydraulic conductance. This study suggests that πtlp plays a central role in defining plant performance and could be incorporated in species distribution modelling given its responsiveness to climatic and site-based drivers in water availability.

Supplementary Files

Supplementary File 1

Acknowledgments

We are grateful to Maria Ottenschlaeger for helping to retrieve data and assemble the database. Margaret Cawsey also provided significant advice on use of the Atlas of Living Australia. This project was funded by the Co-operative Research Centre for Forestry. The authors also acknowledge the useful insights and discussions of all of their colleagues during recent workshops on forest mortality hosted by the Australian Centre for Ecological Analysis and Synthesis (www.aceas.org.au), a facility of the Australian Government’s Terrestrial Ecosystems Research Network, a research infrastructure facility established under the National Collaborative Research Infrastructure Strategy and Education Infrastructure Fund—Super Science Initiative—Through the Department of Industry, Innovation, Science, Research and Tertiary Education.

Author Contributions

Patrick J. Mitchell and Anthony P. O’Grady compiled the database, Patrick J. Mitchell analysed the data and wrote the paper with significant input from Anthony P. O’Grady.

Conflicts of Interest

The authors declare no conflict of interest.

References

  1. Lambers, H.; Chapin, F.S.; Pons, T.L. Plant water relations. In Plant Physiological Ecology; Springer: New York, NY, USA, 2008; pp. 154–204. [Google Scholar]
  2. Cleland, R.E. Cell wall extension. Annu. Rev. Plant Physiol. 1971, 22, 197–222. [Google Scholar] [CrossRef]
  3. Franks, P.J.; Cowan, I.R.; Tyerman, S.D.; Cleary, A.I.; Lloyd, J.; Farquhar, G.D. Guard-cell pressure aperture characteristics measured with the pressure probe. Plant Cell Environ. 1995, 18, 795–800. [Google Scholar] [CrossRef]
  4. Frensch, J.; Hsiao, T.C. Transient responses of cell turgor and growth of maize roots as affected by changes in water potential. Plant Physiol. 1994, 104, 247–254. [Google Scholar] [PubMed]
  5. Fan, S.H.; Blake, T.J.; Blumwald, E. The relative contribution of elastic and osmotic adjustments to turgor maintenance of woody species. Physiol. Plant 1994, 90, 408–413. [Google Scholar] [CrossRef]
  6. Sanders, G.; Arndt, S. Osmotic Adjustment Under Drought Conditions. In Plant Responses to Drought Stress; Aroca, R., Ed.; Springer: Berlin, Germany, 2012; pp. 199–229. [Google Scholar]
  7. Tyree, M.; Hammel, H. The measurement of the turgor pressure and the water relations of plants by the pressure-bomb technique. J. Exp. Bot. 1972, 23, 267–282. [Google Scholar] [CrossRef]
  8. Merchant, A.; Callister, A.; Arndt, S.K.; Tausz, M.; Adams, M.A. Contrasting physiological responses of six Eucalyptus species to water deficit. Ann. Bot. 2007, 100, 1507–1515. [Google Scholar] [CrossRef] [PubMed]
  9. Davidson, N.J.; Reid, J.B. Response of eucalypt species to drought. Aust. J. Ecol. 1989, 14, 139–156. [Google Scholar] [CrossRef]
  10. Bartlett, M.K.; Scoffoni, C.; Sack, L. The determinants of leaf turgor loss point and prediction of drought tolerance of species and biomes: A global meta-analysis. Ecol. Lett. 2012, 15, 393–405. [Google Scholar] [CrossRef] [PubMed]
  11. Brodribb, T.J.; Holbrook, N.M. Stomatal Closure during Leaf Dehydration, Correlation with Other Leaf Physiological Traits. Plant Physiol. 2003, 132, 2166–2173. [Google Scholar] [CrossRef] [PubMed]
  12. Mitchell, P.J.; O’Grady, A.P.; Tissue, D.T.; White, D.A.; Ottenschlaeger, M.L.; Pinkard, E.A. Drought response strategies define the relative contributions of hydraulic dysfunction and carbohydrate depletion during tree mortality. New Phytol. 2013, 197, 862–872. [Google Scholar] [CrossRef] [PubMed]
  13. Mitchell, P.J.; Veneklaas, E.J.; Lambers, H.; Burgess, S.S.O. Using multiple trait associations to define hydraulic functional types in plant communities of south-western Australia. Oecologia 2008, 158, 385–397. [Google Scholar] [CrossRef] [PubMed]
  14. Mitchell, P.J.; Veneklaas, E.J.; Lambers, H.; Burgess, S.S.O. Leaf water relations during summer water deficit: Differential responses in turgor maintenance and variation in leaf structure among different plant communities in south-western Australia. Plant Cell Environ. 2008, 31, 1791–1802. [Google Scholar] [CrossRef] [PubMed]
  15. Niinemets, U. Global-scale climatic controls of leaf dry mass per area, density and thickness in trees and shrubs. Ecology 2001, 82, 453–469. [Google Scholar] [CrossRef]
  16. Pearce, J.L.; Boyce, M.S. Modelling distribution and abundance with presence-only data. J. Appl. Ecol. 2006, 43, 405–412. [Google Scholar] [CrossRef]
  17. Adams, M.A. Distribution of eucalypts in Australian landscapes: Landforms, soils, fire and nutrition. In Nutrition of the Eucalypts; Attiwill, P.M., Ed.; CSIRO: Melbourne, Australia, 1995; pp. 61–76. [Google Scholar]
  18. Specht, R.L.; Specht, A. Canopy structure in Eucalyptus-dominated communities in Australia along climatic gradients. Acta Ecol. 1989, 10, 191–213. [Google Scholar]
  19. Booth, T.H.; Williams, K.J.; Belbin, L. Developing biodiverse plantings suitable for changing climatic conditions 2: Using the Atlas of Living Australia. Ecol. Manag. Restor. 2012, 13, 274–281. [Google Scholar] [CrossRef]
  20. Hutchinson, M.F.; Kesteven, J.L. Monthly Mean Climate Surfaces for Australia; Centre for Resource and Environmental Studies, Australian National University: Canberra, Australia, 1998. [Google Scholar]
  21. Mitchell, P.J.; O’Grady, A.P.; Hayes, K.R.; Pinkard, E.A. Exposure of trees to drought-induced die-off is defined by a common climatic threshold across different vegetation types. Ecol. Evol. 2014, 4, 1088–1101. [Google Scholar] [CrossRef] [PubMed]
  22. Barton, K. Multi-model inference. In R Package Version 1.7.2.; R Foundation for Statistical Computing: Vienna, Austria, 2012. [Google Scholar]
  23. Bartlett, M.K.; Zhang, Y.; Kreidler, N.; Sun, S.; Ardy, R.; Cao, K.; Sack, L. Global analysis of plasticity in turgor loss point, a key drought tolerance trait. Ecol. Lett. 2014, 17, 1580–1590. [Google Scholar] [CrossRef] [PubMed]
  24. Forseth, I. Terrestrial Biomes. Nat. Educ. Knowl. 2012, 10, 11. [Google Scholar]
  25. Lenz, T.I.; Wright, I.J.; Westoby, M. Interrelations among pressure-volume curve traits across species and water availability gradients. Physiol. Plant 2006, 127, 423–433. [Google Scholar] [CrossRef]
  26. White, D.A.; Battaglia, M.; Macfarlane, C.; Mummery, D.; McGrath, J.F.; Beadle, C.L. Selecting species for recharge management in Mediterranean south Western Australia—Some ecophysiological considerations. Plant Soil 2003, 257, 283–293. [Google Scholar] [CrossRef]
  27. Valladares, F.; Pearcy, R.W. Interactions between water stress, sun-shade acclimation, heat tolerance and photoinhibition in the sclerophyll Heteromeles arbutifolia. Plant Cell Environ. 1997, 20, 25–36. [Google Scholar] [CrossRef]
  28. Niu, S.; Li, Z.; Xia, J.; Han, Y.; Wu, M.; Wan, S. Climatic warming changes plant photosynthesis and its temperature dependence in a temperate steppe of northern China. Environ. Exp. Bot. 2008, 63, 91–101. [Google Scholar] [CrossRef]
  29. Groom, P.K.; Lamont, B.A.; Leighton, S.; Leighton, P.; Burrows, C. Heat damage in sclerophylls is influenced by their leaf properties and plant environment. Ecoscience 2004, 11, 94–101. [Google Scholar]
  30. Allen, C.D.; Macalady, A.K.; Chenchouni, H.; Bachelet, D.; McDowell, N.; Vennetier, M.; Kitzberger, T.; Rigling, A.; Breshears, D.D.; Hogg, E.H.; et al. A global overview of drought and heat-induced tree mortality reveals emerging climate change risks for forests. For. Ecol. Manag. 2010, 259, 660–684. [Google Scholar] [CrossRef]
  31. Araya, Y.N.; Silvertown, J.; Gowing, D.J.; McConway, K.J.; Peter Linder, H.; Midgley, G. A fundamental, eco-hydrological basis for niche segregation in plant communities. New Phytol. 2011, 189, 253–258. [Google Scholar] [CrossRef] [PubMed]
  32. Burgess, S.S.O. Measuring transpiration responses to summer precipitation in a Mediterranean climate: A simple screening tool for identifying plant water-use strategies. Physiol. Plant 2006, 127, 404–412. [Google Scholar] [CrossRef]
  33. Choat, B.; Jansen, S.; Brodribb, T.J.; Cochard, H.; Delzon, S.; Bhaskar, R.; Bucci, S.J.; Feild, T.S.; Gleason, S.M.; Hacke, U.G.; et al. Global convergence in the vulnerability of forests to drought. Nature 2012, 491, 752–755. [Google Scholar] [CrossRef] [PubMed]
  34. Joly, J.J.; Zaerr, J.B. Alteration of cell-wall water content and elasticity in Douglas-Fir during periods of Water Deficit. Plant Physiol. 1987, 83, 418–422. [Google Scholar] [CrossRef] [PubMed]
  35. Clifford, S.C.; Arndt, S.K.; Corlett, J.E.; Joshi, S.; Sankhla, M.; Jones, H.G. The role of solute accumulation, osmotic adjustment and changes in cell wall elasticity in drought tolerance Ziziphus mauritiana (Lamk). J. Exp. Bot. 1998, 49, 967–977. [Google Scholar] [CrossRef]
  36. White, D.A.; Turner, N.C.; Galbraith, J.H. Leaf water realtions and stomatal behaviour of four allopatric Eucalyptus species planted in Mediterranean southwestern Australia. Tree Physiol. 2000, 20, 1157–1165. [Google Scholar] [CrossRef] [PubMed]
  37. Dalmaris, E. Eucalyptus Wandoo: Tolerance to Drought and Salinity in Relation to Provenance and Evolutionary History in Southwestern Australia. Ph.D. Thesis, the University of Western Australia, Perth, Australia, July 2012. [Google Scholar]
  38. Pita, P.; Pardos, J. Growth, leaf morphology, water use and tissue water relations of Eucalyptus globulus clones in response to water deficit. Tree Physiol. 2001, 21, 599–607. [Google Scholar] [CrossRef] [PubMed]
  39. Tuomela, K. Leaf water relations in six provenances of Eucalyptus microtheca: A greenhouse experiment. For. Ecol. Manag. 1997, 92, 1–10. [Google Scholar] [CrossRef]
  40. Blake, J.; Hill, R. An Examination of the Drought and Frost Tolerance of Banksia marginata (Proteaceae) as an Explanation of Its Current Widespread Occurrence in Tasmania. Aust. J. Bot. 1996, 44, 265–281. [Google Scholar] [CrossRef]

