Article

Regulation of Water Use in the Southernmost European Fir (Abies pinsapo Boiss.): Drought Avoidance Matters

1
Departamento de Sistemas Físicos, Químicos y Naturales, Universidad Pablo de Olavide. Ctra. Utrera km. 1, 41013 Sevilla, Spain
2
Biodiversidad y Conservación, Universidad Rey Juan Carlos, c/Tulipán s/n, 28933 Móstoles (Madrid), Spain
3
Departamento de Biología Animal, Biología Vegetal y Ecología, Universidad de Jaén, Ed. B3, Paraje las Lagunillas s/n, 23071 Jaén, Spain
*
Author to whom correspondence should be addressed.
Forests 2015, 6(6), 2241-2260; https://doi.org/10.3390/f6062241
Submission received: 15 April 2015 / Revised: 9 June 2015 / Accepted: 16 June 2015 / Published: 19 June 2015
(This article belongs to the Special Issue Responses of Forest Trees to Drought)

Abstract

:
The current scenario of global warming has resulted in considerable uncertainty regarding the capacity of forest trees to adapt to increasing drought. Detailed ecophysiological knowledge would provide a basis to forecast expected species dynamics in response to climate change. Here, we compare the water balance (stomatal conductance, xylem water potential, needle osmotic adjustment) of Abies pinsapo, a relict drought-sensitive Mediterranean fir, along an altitudinal gradient. We related these variables to soil water and nutrient availability, air temperature, atmospheric water potential, and vapour pressure deficit during two consecutive years. Our results indicate that A. pinsapo closed stomata rapidly over a very narrow range of soil water availability and atmospheric dryness. This isohydric response during water stress suggests that this relict conifer relied on the plant hormone abscisic acid to maintain closed stomata during sustained drought, instead of needle desiccation to passively drive stomatal closure, needle osmotic adjustment or a plastic response of the xylem to different levels of water availability. Both the soil and foliar nutrient contents suggest that the studied populations are not limited by nutrient deficiencies, and drought was stronger in the warmer low-elevation areas.

1. Introduction

Water stress is a major determinant of plant species distribution. Considerable literature on recent forest decline draws attention to a direct link between climate change and the water relations of trees. Extreme climatic events, such as drought, are among the main drivers of forest dynamics and are usually related to forest decline of drought-sensitive tree species [1,2,3,4]. Understanding contrasting drought sensitivity among tree species and how these differences will affect their water and carbon balances is therefore an important topic to forecast likely responses to global warming and increasing drought stress in forests [5]. The physiological responses of trees to drought range from declining leaf water potential as soil water availability decreases (anisohydric response) to the maintenance of leaf water potential above a threshold (isohydric response) [6]. Drought-induced tree decline has been reported for several ecosystems and is usually focused on isohydric tree species, such as relict Mediterranean mountain conifers [4]. This tree die-off is mainly characterized by declining growth patterns, increases in defoliation and extensive death [1,2,3].
Physiological processes respond at different tree water potentials [7,8]. For instance, growth is reduced through the impairment of cell division and cell expansion [7] at a lower water stress threshold than photosynthetic inhibition [9]. Thus, the severity of the drought will influence the involved physiological process and the extent to which a given tree species would be affected by drought [10]. Relict Mediterranean mountain conifers are typically endangered tree species that are vulnerable to climate change, mainly due to high sensitivity to current drought increases and reduced adaptive capacity, which are likely related to inherent traits such as genetic drift and declining population sizes [11]. These drought-sensitive tree species may thus serve as a case model to assess general mechanisms and patterns driving tree response to temperature increases and changing regional rainfall patterns [12]. Furthermore, Mediterranean mountain forests are characterized by shallow soils, where warmer temperatures result inrapid water shortage and longer summer drought periods; regional climate models predict an increase in the average temperature and rainfall concentration in a greater number of extreme events [13,14,15]. Higher temperatures will also increase the vapour pressure deficit [16], and an increase in the variability in precipitation is also expected for Mediterranean-type ecosystems [17,18].
Here, we focused on the southernmost European fir forests, dominated by the drought-sensitive Abies pinsapo Boiss. [19]. This relict tree is perhaps among the most vulnerable to climate change within the Mediterranean mountain forests. Indeed, several recent studies focusing on tree growth and stand dynamics have reported extensive A. pinsapo forest decline related to temperature rises and increasing drought [11,12,19].
Population-level differences in the regulation of the water balance can determine the long-term persistence of species, the decline in populations and shifts in species dominance [1,2] or even local extinction processes [5]. We hypothesized that A. pinsapo close their stomata and maintain homeostasis in the leaf water content during drought. Our specific aims were (i) to investigate the intra- and inter-annual dynamics of stomatal control, xylem water potential and needle osmotic adjustment of A. pinsapo under fluctuating soil water status and evaporative demand; and (ii) to quantify the variations within and between elevations in the functional strategies of A. pinsapo in relation to seasonal water deficit.

2. Materials and Methods

2.1. Study Site and Field Sampling

Two natural populations of A. pinsapo were studied under elevation-related contrasting environmental conditions [11] in the Sierra de las Nieves Natural Park (South Spain). The soil physicochemical properties were analyzed at both elevations following standard procedures [20,21,22]. The population located at low elevation (36°43′18″ N, 4°57′53″ W, 1226 m a.s.l.) was dominated by A. pinsapo trees, about 15–20 cm in diameter, and some isolated Pinus halepensis individuals. The stand basal area was approximately 40 m2·ha−1. The second population was located at high elevation in the same river basin (36°42′37″ N, 4°59′04″ W, 1557 m a.s.l.) and displayed similar tree sizes and stand basal area as the former, although in this case, A. pinsapo was the only dominant tree species [11].

2.2. Microclimatic Variables

During two consecutive years (moist and dry), air temperature (T) and relative humidity (RH) were recorded hourly using a Hobo H8 data logger (HOBO Pro RH/Temp; Onset Computer Corporation, Bourne, MA, USA). Four data loggers were used for each study site, and were placed inside open-bottom PVC cylinders located 1.5m from the ground and covered by sealing foam to prevent direct heating by the sun. Monthly total precipitation data were measured in each study site using hand-made rain gauges. We calculated the daily values of atmospheric water potential (ψa) from the T and RH data, according to the following equation [23,24].
ψ a = 1.06 · T · log 10 ( 100 / H R )
where ψa represents the atmospheric water potential (MPa), T is the air temperature (°C) and RH is the relative air humidity (%). Similarly, the vapour pressure deficit (VPD) was determined from the saturated vapour pressure (SVP):
S V P = 0.66 · e ( 0.06 · T )
where SVP is the saturated vapour pressure (kPa) and T is the air temperature (°C). From SVP, the VPD was obtained as follows:
V P D = ( 100 H R ) 100 · S V P
where VPD represents the vapour pressure deficit (kPa) and RH is the air relative humidity (%) [25].
According to the field sampling of the ecophysiological variables (see below), we randomly selected ten points within each study site to determine the volumetric soil water content (θ) using time domain reflectometry (TDR). Measurements were taken after removing the litterfall layer, and a 12-cm long TDR100 probe (Campbell Scientific Ltd, Loughborough, UK) was inserted, which was connected to a laptop.

2.3. Ecophysiological Variables

Field sampling was performed at approximately two-week intervals during the growing season (May–July) and approximately monthly for the rest of the year. During spring and autumn, and sometimes in summer, foggy and rainy days were frequent, which impeded the use of equipment in the field; otherwise, during winter, the temperatures were usually low and the study area was sometimes covered by snow [19]. In addition, the inaccessibility of the study sites necessitated the transport of the sampling devices by mules. Due to these constraints, both the sampling days and the number of measurements collected throughout the day were limited several times.
Stomatal conductance to water vapour (g) and xylem water potential (ψx) were measured every two or three hours from predawn to predusk, according to solar time. Daily measurements between predawn and predusk were performed during the first study year (moist), while during the second year (dry), these were limited to midday measurements due to the logistic limitations indicated above. Leaf conductance to water vapour was measured using a portable null-balance porometer (model 9810; Data Design Group, La Jolla, CA, USA). Xylem water potential measurements were collected using a Scholander pressure chamber (PMS 100, PMS Instrument Co., Corvallis, OR, USA). Sampling was carried out on five dominant trees per study site without defoliation or external symptoms of pathogens. Fully expanded (1–2-year-old) sunlight-exposed twigs were selected from each tree. The same procedure was used to measure the xylem water potential; the twigs were cut with a razor blade. Each measure was replicated three times per tree [26]. After each measurement, the twigs were placed in a plastic bag to obtain the surface area, dry weight and foliar nutrient content in the laboratory. The one-sided projected area of the needles was determined by scanning and their areas were quantified using image analysis (ImageJ software, v.1.36b). Then, the needles were dried at 70 °C until constant weight to determine individual dry masses. The total dry mass was divided by the total area of the needles to determine the leaf mass per area. Total C and N were determined using a FlashEA1112 CHNS-O analyzer (Thermo Finnigan, Ithaca, NY, USA). Total P, K, Ca, Mg, Mn, and Zn contents were determined using ICP emission spectrometry (ICP-MS 7500 Series, Agilent Technologies, Santa Clara, CA, USA) following nitric-perchloric acid digestion of the samples [27].
During each field sampling, 12 trees per site were randomly selected and 2 fully expanded, sunlight-exposed twigs were cut using a razor blade. The needles were placed in a plastic bag, sealed with insulating tape, and immediately inserted in a portable liquid nitrogen container (Voyage, AIR LIQUIDE TM., Marne La Vallée Cedex 3, France). These samples were transported to the laboratory to measure needle osmotic potential (ψπ) using a WP4 psychrometer (Decagon Devices Inc., Pulman, WA, USA).

2.4. Statistical Analysis

Stomatal conductance and xylem water potential data sets were tested for homogeneity of variance and the assumption of compound symmetry of the variance-covariance matrix using the Bartlett-Box F-test and the Mauchly criterion, respectively. A repeated-measures MANOVA was used to compare the daily measurements of stomatal conductance and xylem water potential [28]. Since our main goal was to test the effects of elevation, the between-subjects factor was the study site (low elevation and high elevation). The sampling date was regarded as a within-subjects factor. We used the Greenhouse-Geisser statistic to adjust the F-tests. Paired comparisons were corrected using the Bonferroni adjustment. Analyses were performed separately for each sampling year (moist versus dry). Significant differences for mean values of temperature, VPD, soil water content, foliar nutrient content and needle osmotic potential were tested by ANOVA or correlated by least squares linear regression. The analyses were conducted using SPSS ver. 17.0 (SPSS Inc., Chicago, IL,USA).

3. Results

3.1. Soil Physicochemical Properties

The soil profiles were similar at low and high elevation and were classified as Typic Haploxerepts that developed on steep slopes with frequent rocky outcrops. At lower elevation, the soil had a higher clay percentage, while at higher elevation, the sand and gravel percentages increased. As a result, the water content at the permanent wilting point was higher at the lower elevation, although the estimation of available water content was similar for both study sites (Table 1). Root biomass was higher at lower elevation, mainly in the most superficial soil horizon (0–12 cm; Table 1). Soil organic carbon and nitrogen were slightly higher at lower elevation, as well as available ammonia and nitrate; however, the phosphorous content was higher at higher elevation, and the base saturation was near 100% in all cases, based on the calcareous bedrock.

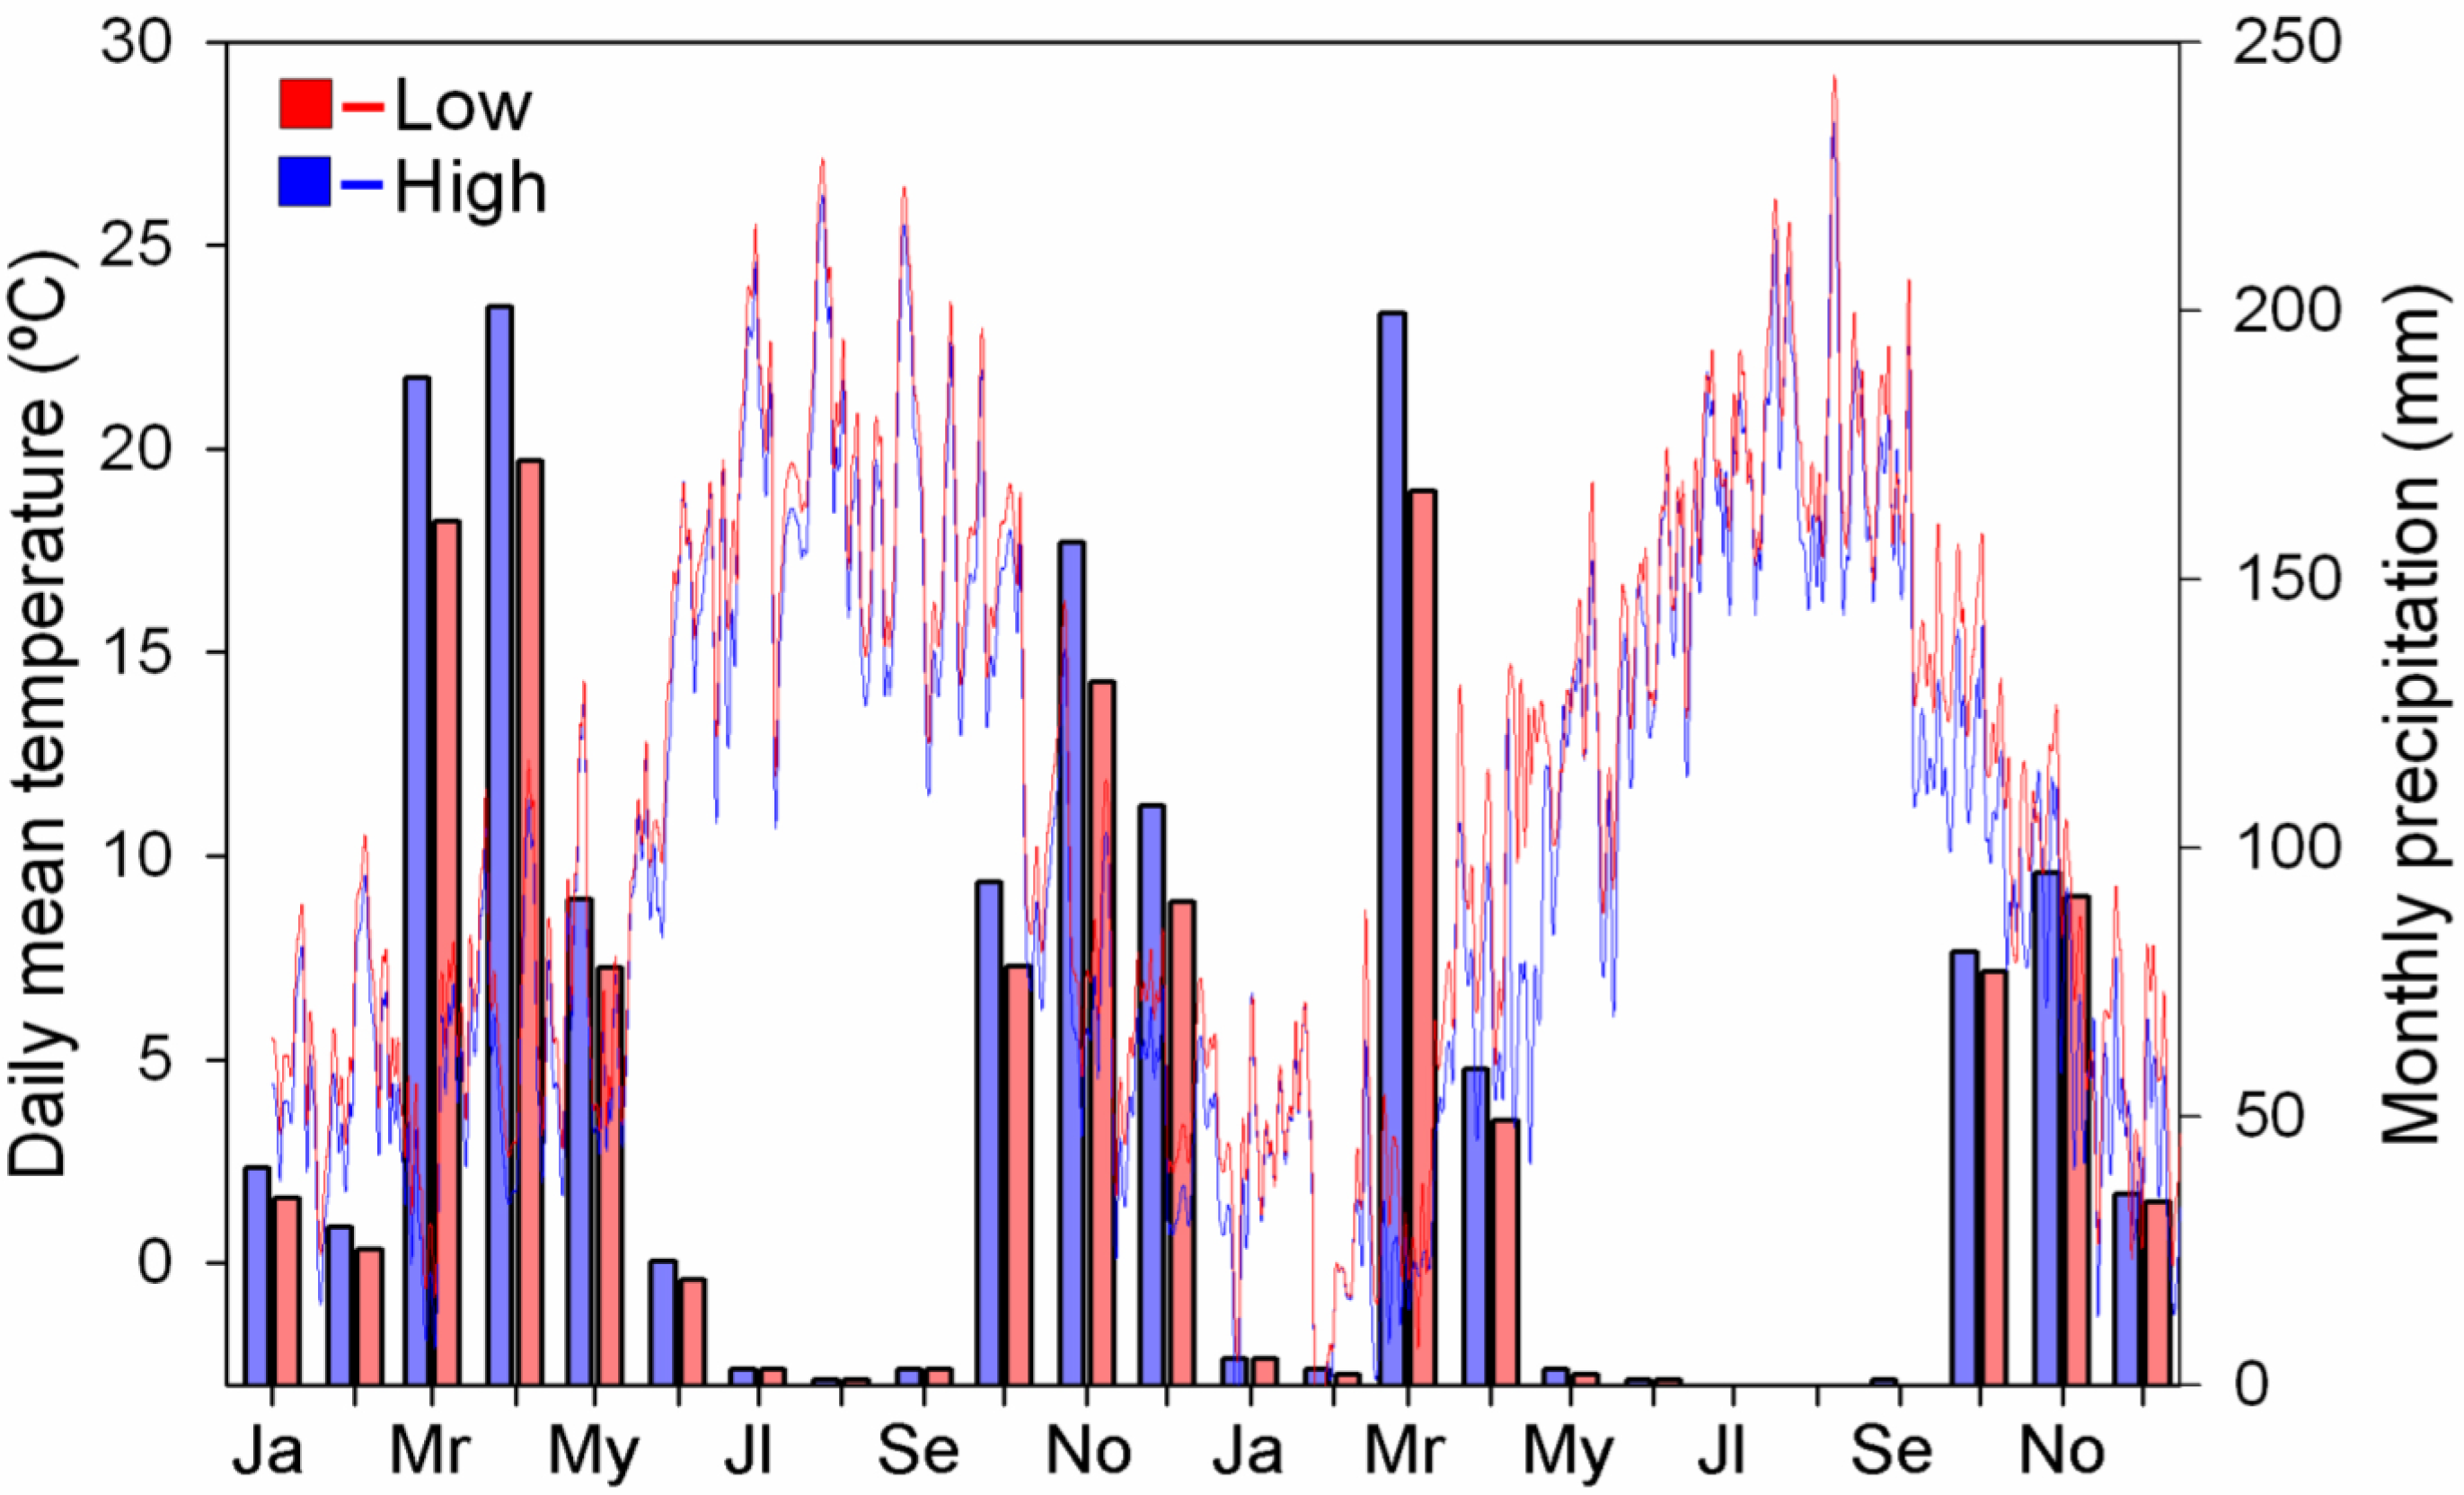
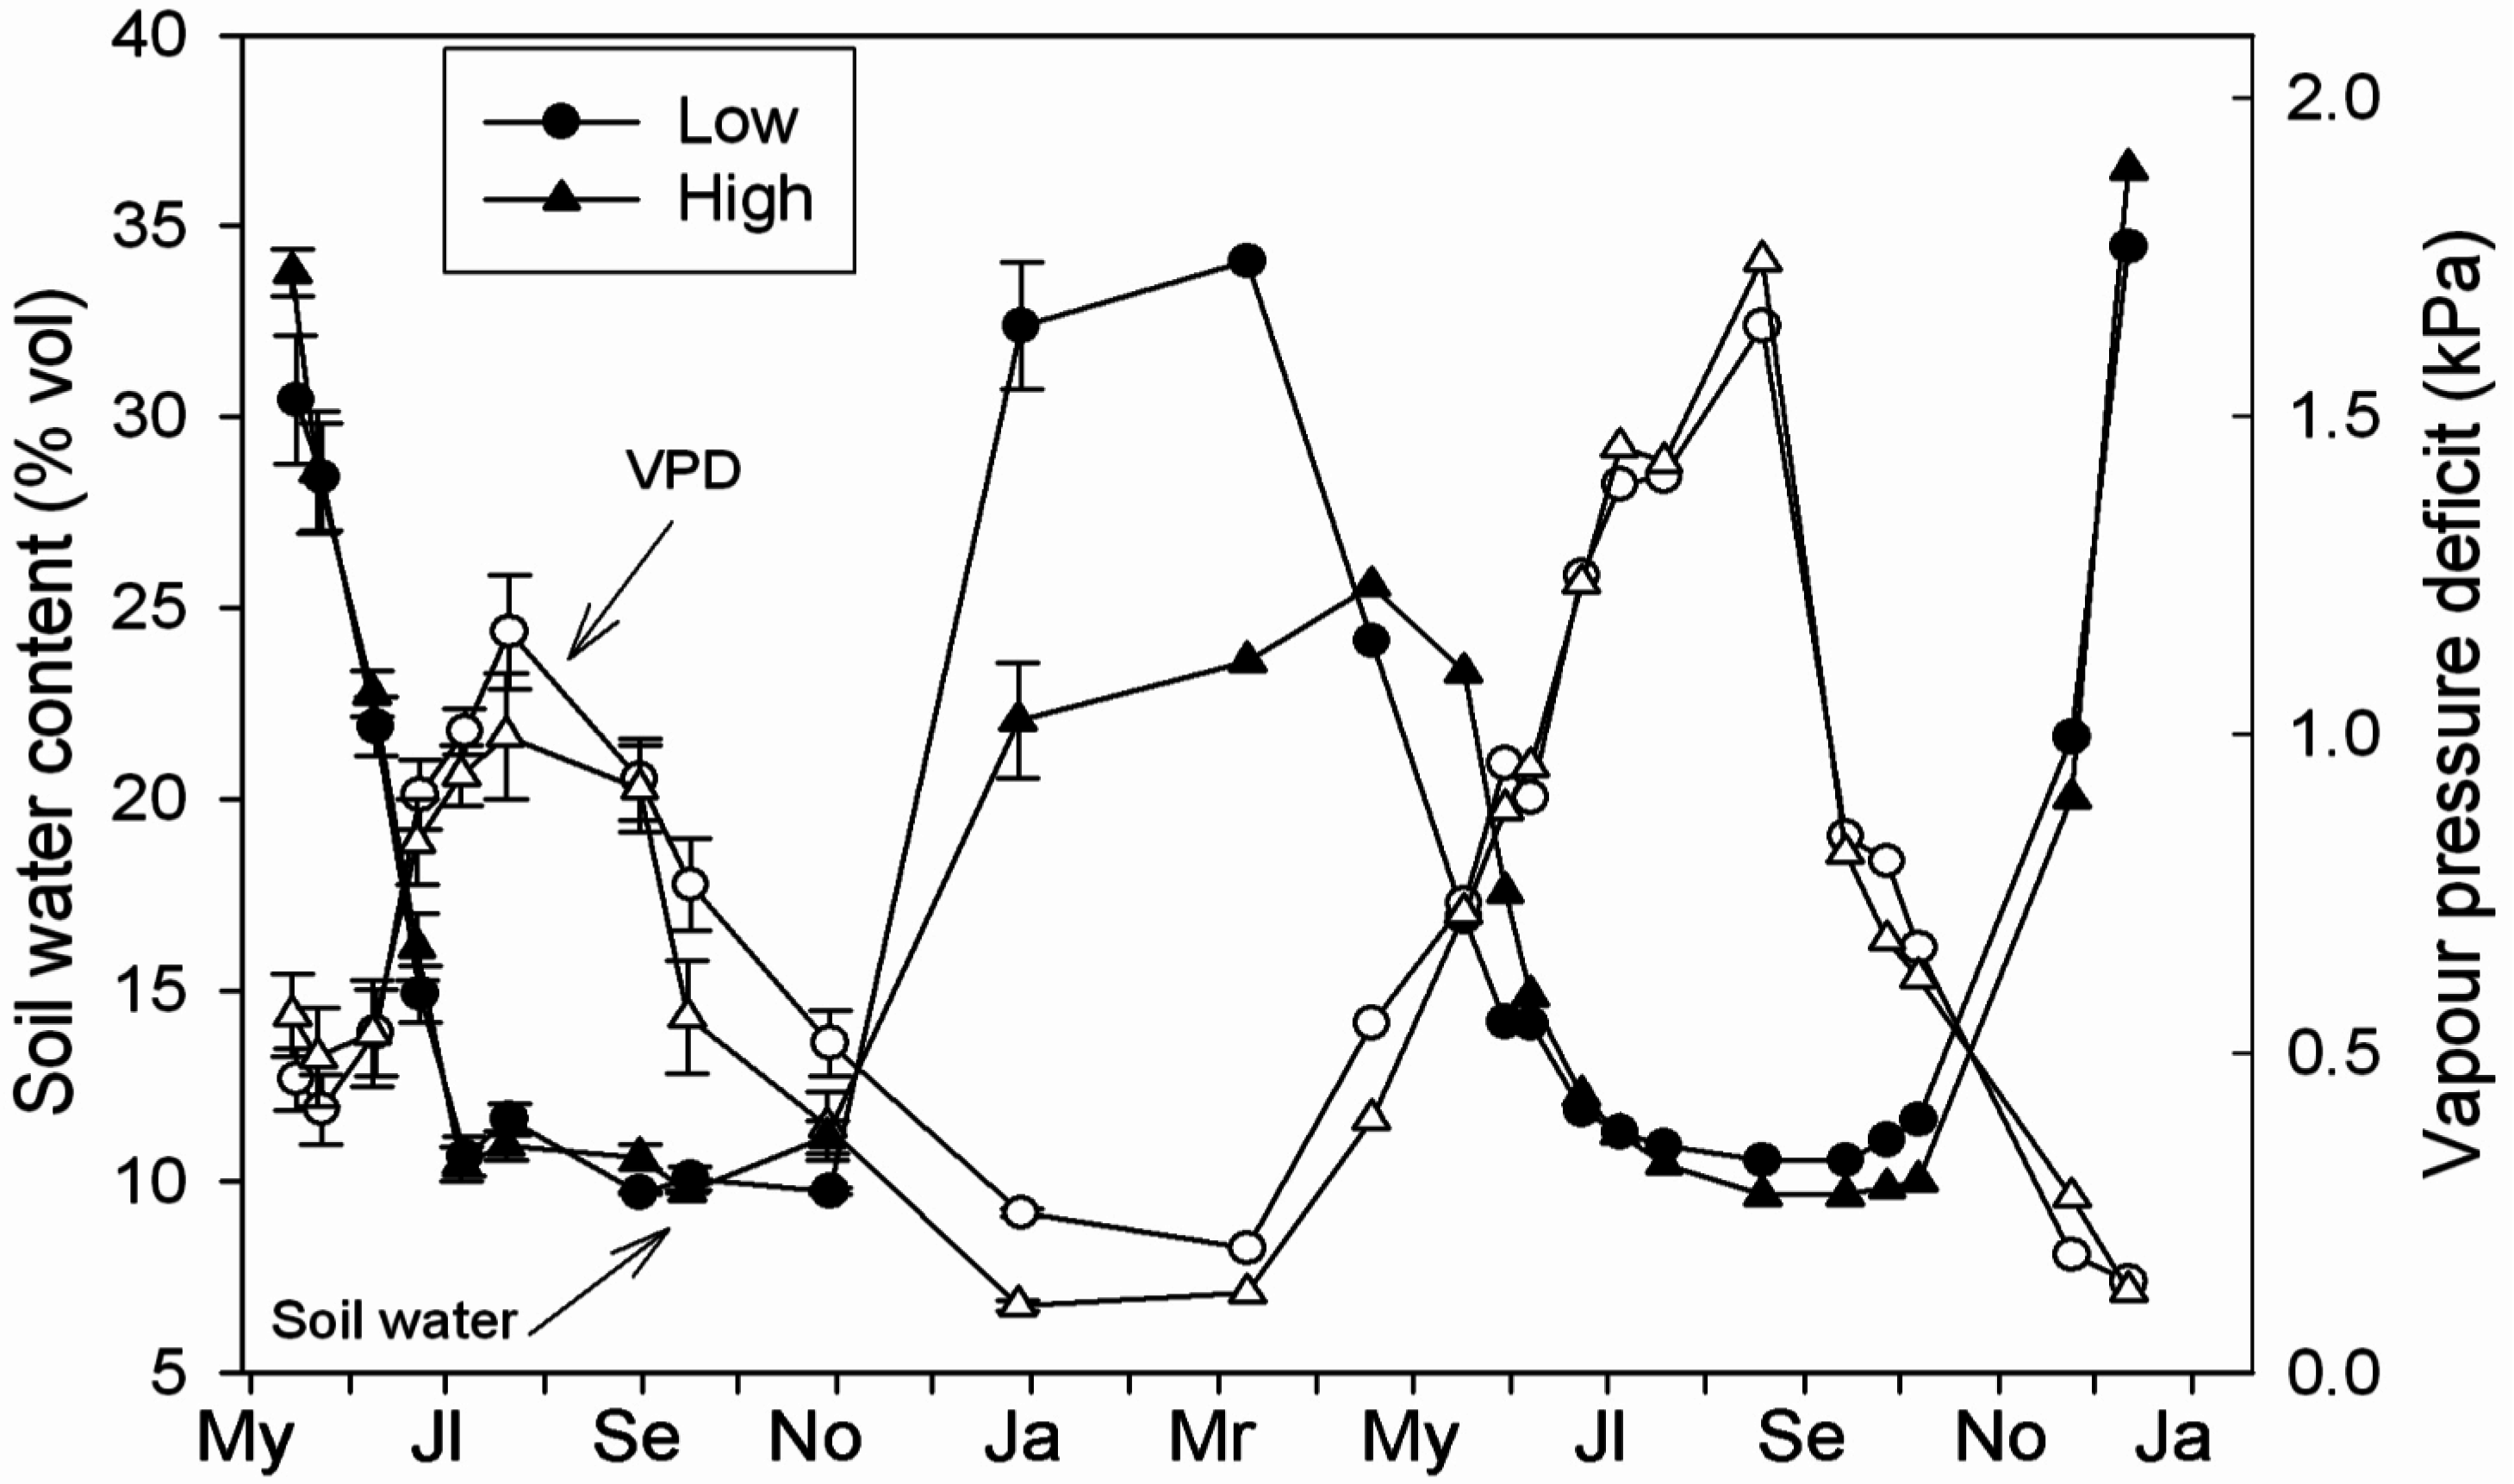
3.2. Microclimatology

The annual precipitation during the first growing season (moist) was 789 mm and 930 mm at the low and high elevation, respectively, while during the second growing season (dry), it was 418 mm and 447 mm at the low and high elevation, respectively, accounting for one of the driest years in the last century. Furthermore, during the first growing season, late spring was cool and moist, delaying the onset of the drought period. The mean and minimum temperatures were especially low during the winter of the second year, resulting in a cold and dry winter, for instance, the minimum daily temperature reached −15 °C and mean daily temperatures were less than 0 °C on several consecutive days (Figure 1) during February of the second year. However, from April to the end of the second year, the average monthly temperature was higher than the average of the last century. The soil water content, as well as atmospheric vapour pressure deficit (VPD), showed typical Mediterranean seasonality (Figure 2), with soil saturation and low VPD during winter to spring, and drought conditions from early July to mid-November (Figure 1 and Figure 2). During the first year, VPD reached maximum values around 1.2 kPa while during the second year and VPD values were significantly higher than in the previous summer, reaching 1.7 kPa (paired comparison ANOVA, p <0.01).
Table 1. Morphological, physical and chemical properties of the studied soil profiles. 1 [21]; 2 [22]; 3 Richards’ pressure membrane; 4 [21]. Available water content = water content at field capacity - water content at permanent wilting point.
Soil ProfileLowElevation (1200 m)High Elevation (1550 m)
Soil Type 1TypicHaploxereptTypicHaploxerept
Slope (%)3642
Elevation (m a.s.l.)12001550
AspectNWNW
Soil HorizonAhBwBw/RAhAh/CC
Prof. (cm)0–1212–2525–500–1212–2525–50
Texture (%)Clay21.637.727.914.216.517.2
Silt494652.847.839.428.6
Sand29.416.319.33844.154.2
Gravel(%)13.1819.826.337.742.2
Bulk density 21.291.411.311.441.511.49
Textural class 1LoamSilty-clay-loamSilty-clay-loamLoamLoamSandy-loam
pF 33 kPa (empirical) 344.346.546.342.437.835.2
pF 1500 kPa (empirical) 324.731.030.321.420.319.3
pF 33 kPa (estimated) 433.136.535.128.927.025.6
pF 1500 kPa (estimated) 4 15.422.317.811.412.012.2
Available water content (l·m−2·0.5m −1)82.181.7
Roots (mg·g soil−1)4.413.814.070.291.571.35
O. C. (%)3.251.933.061.580.91.09
O. N. (%)0.170.120.190.10.040.05
N-NO3 (ppm)6.1<11.985.3<1<1
N-NH4+ (ppm)17.515.517.08.653.23.51
P Olsen (ppm)2.92.42.94.48.113.7
Ca2+17.414.619.19.096.778.48
Exchangeable basesMg2+1.448.454.070.611.360.33
(cmolc·kg−1)Na+0.260.280.240.240.240.26
K+0.590.30.270.50.190.18
CEC (meq/100g)22.421.623.711.010.911.4
% Base saturation88.210010095.378.881.2
Figure 1. Daily temperature (lines) and monthly precipitation (bars) values for two consecutive growing seasons in two Abies pinsapo populations located along an altitudinal gradient (low elevation, 1200m; high elevation, 1550 m).
Forests 06 02241 g001
Figure 2. Vapour pressure deficit (VPD) and soil water content measured in two Abies pinsapo populations along an altitudinal gradient (low elevation, 1200 m; high elevation, 1550 m). Measurements were taken during two consecutive growing periods. Errors bars represent the standard error; significant differences between stands were tested using repeated measures MANOVA (VPD n = 4 data loggers per elevation; soil water content n = 10 sampling points per elevation).
Forests 06 02241 g002

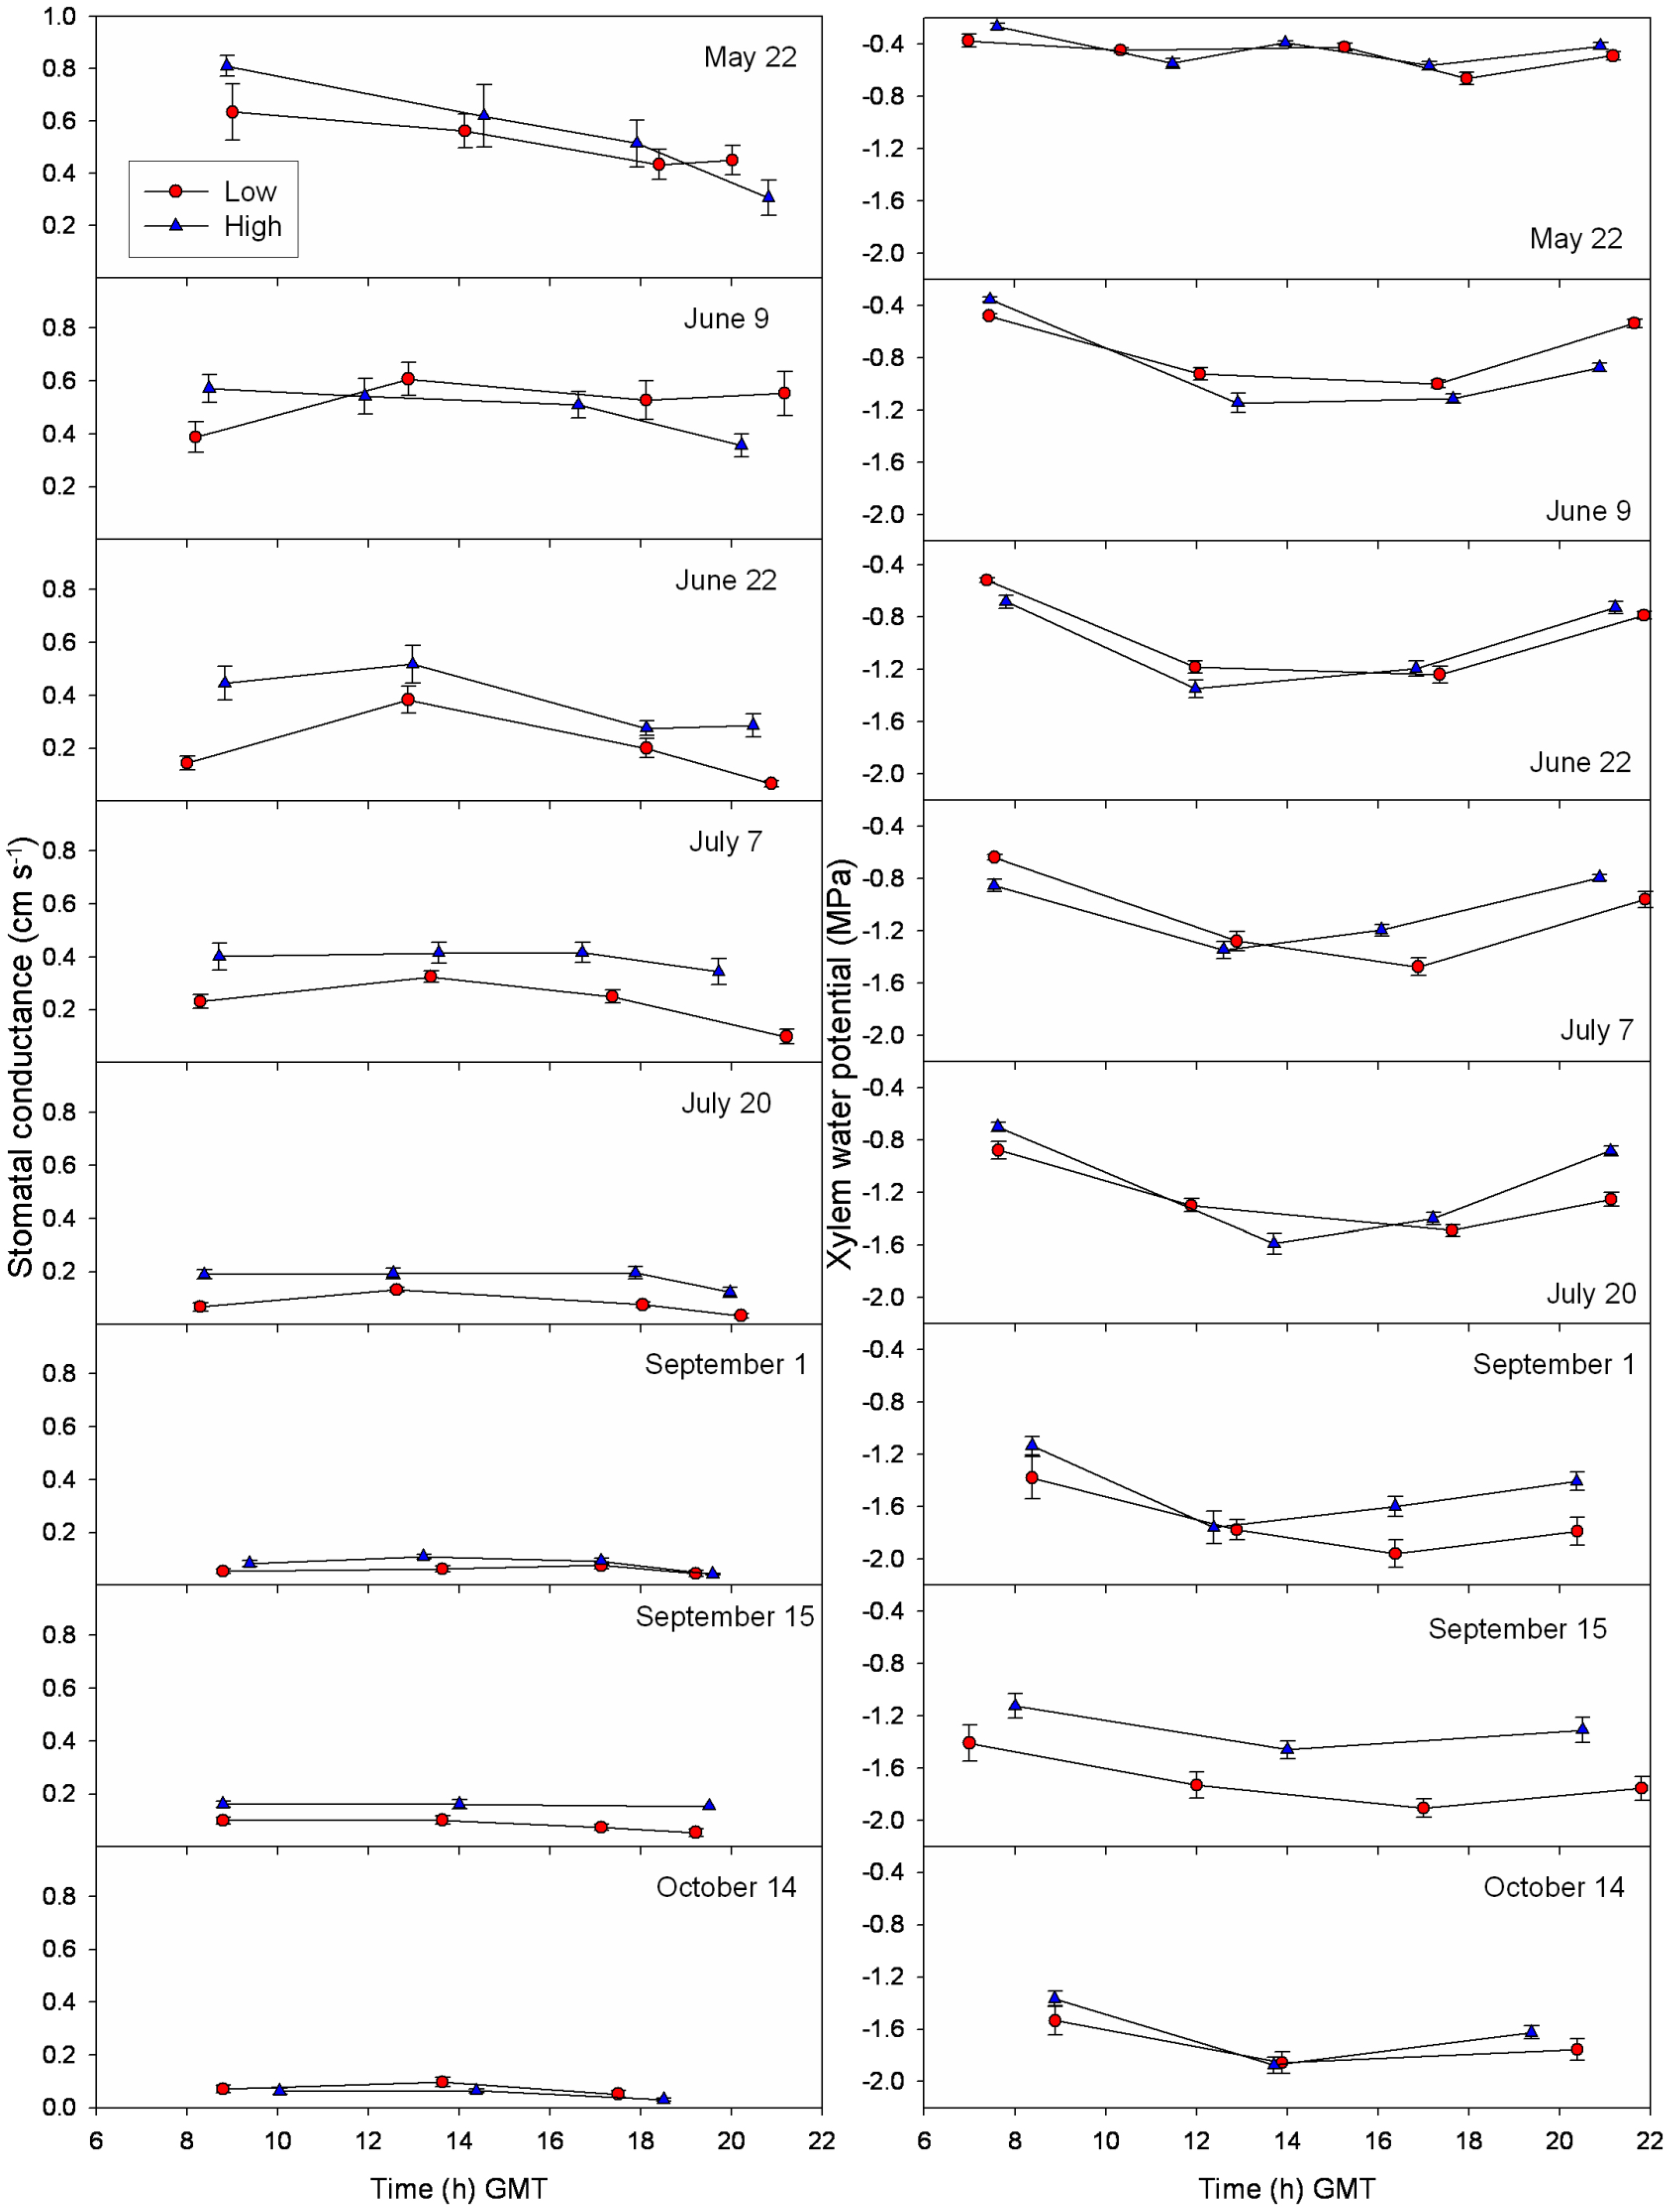
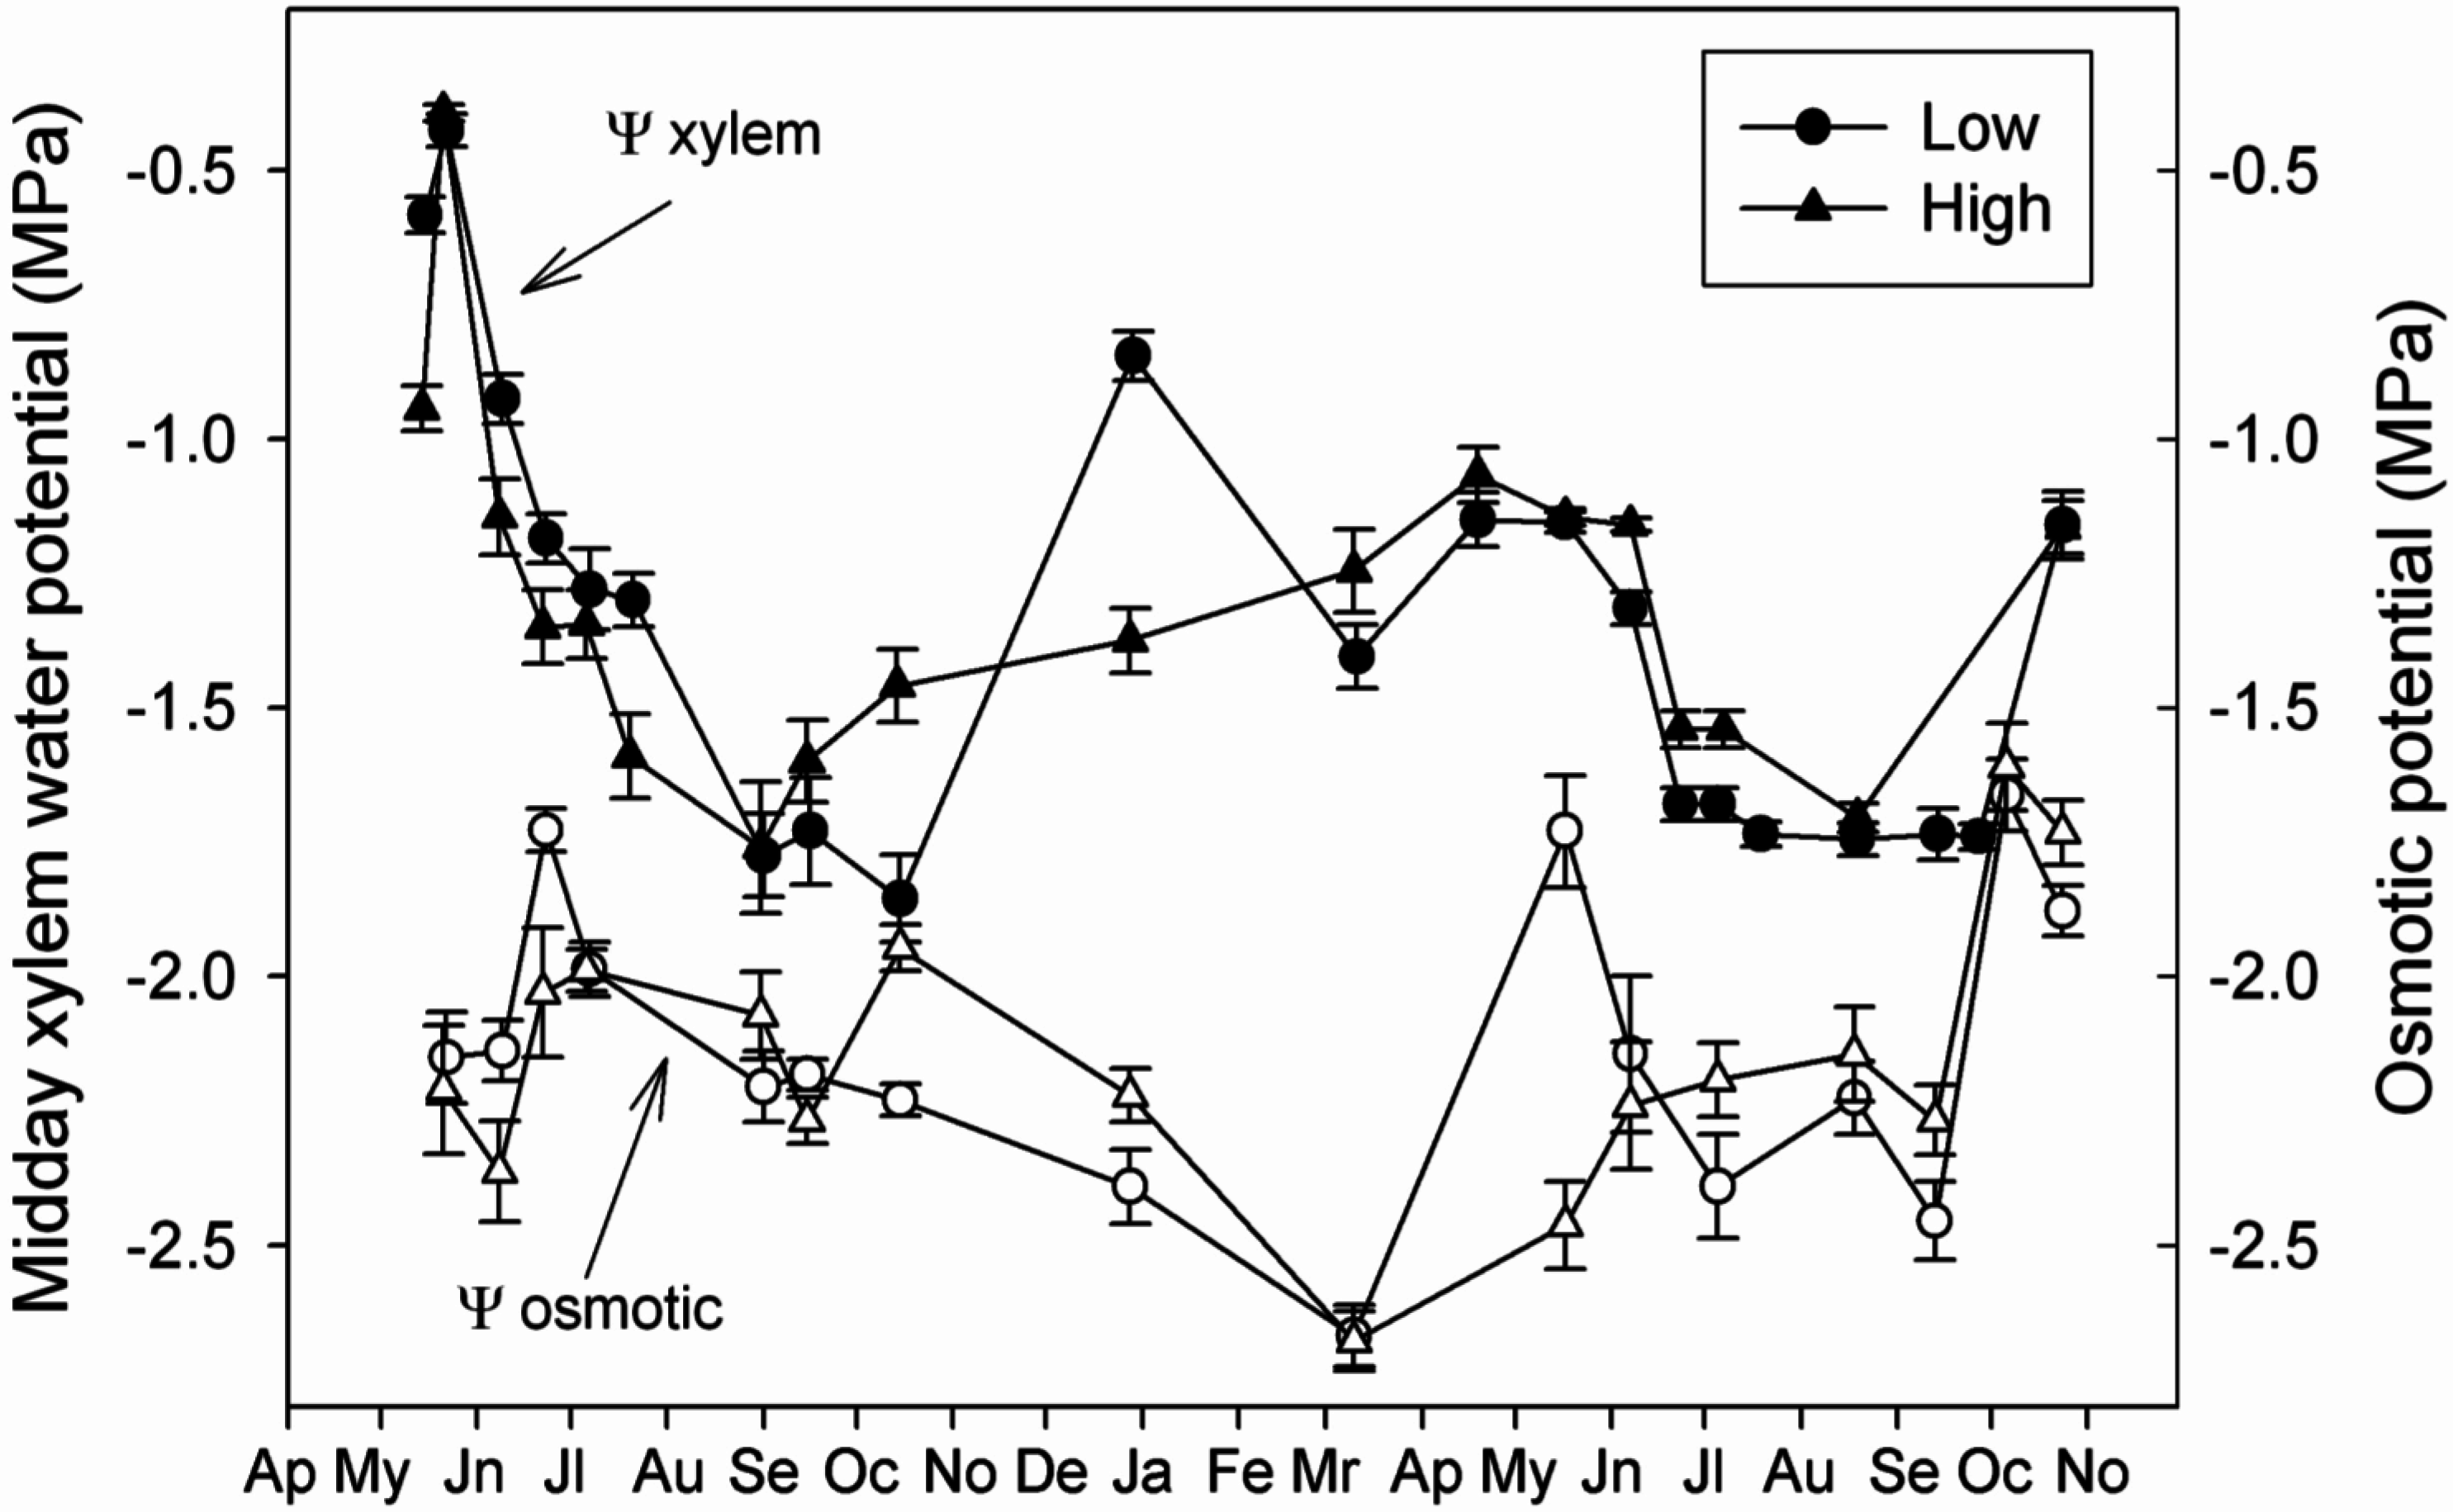
3.3. Daily Curves of Stomatal Conductance and Xylem Water Potential

At the beginning of the growing period (late May), there were no significant differences in the daily pattern of g and ψx at the low and high elevation (Figure 3). Maximum values of g were recorded during late spring of the first studied year, with average values of 0.6–0.8 cm s−1. At the same time, ψx values were the least negative, with predawn values around −0.3 MPa. The daily curves of g did not show a defined shape, although maximum values were usually registered at midday. As the growing period progressed and the soil water content decreased and the vapour pressure deficit increased, g values were strongly reduced. However, this timing pattern differed between the high- and low elevation trees. The ψx curves showed a more defined daily pattern compared with the g curves, with least negative values at predawn and minimum values at midday (Figure 3).
Figure 3. Diurnal gas exchange (left column) and xylem water potential (right column) of Abies pinsapo trees located at low (1200m, circles) and high elevation (1550 m, triangles). Error bars indicate the standard error (n = 5 trees (3 twigs per tree) per elevation).
Forests 06 02241 g003
During late July, average g values were reduced by more than 75% at low elevation, while ψx values were not significantly different from those recorded in early July and were only 0.3 MPa more negative than in June. At high elevation, the decrease in g with respect to ψx was smaller, and g values of c.a. 0.4 cm s−1 were maintained without significant variations in ψx. Toward the end of the drought period,the average g values were drastically reduced, while ψx reached minimum values (about −1.8 MPa). On a daily scale, the observed stomatal closure at the end of the day in spring was almost enough to recover the ψx to the values registered at predawn. However, during summer when the soil water content was lower and the vapour pressure deficit was higher, the circadian curves were more asymmetrical, showing a stepped decline in ψx, leading to more negative values at the end of the day compared with the predawn values. This pattern of progressive stomatal closure and stepped decline in ψx was registered earlier at the lower elevation (Figure 3), indicating a stronger water limitation on this population.
During the first studied year (moist), midday ψx values were relatively high from spring until the end of July, indicating a moderate water deficit (Figure 4). Average midday ψx values were lower at higher elevation until late August in both studied years. From September onward, the midday ψx values were always below −1.5 MPa (minimum values of about −1.8 MPa) until mid-October, when the dry period finishes. During the second studied year (dry), midday ψx values were significantly more negative at lower elevation compared with the higher elevation study site, from mid-June to mid-August, with near steady values about−1.8 MPa (Figure 4).
Figure 4. Needle osmotic potential and midday xylem water potential measured in Abies pinsapo trees along an altitudinal gradient (low elevation, 1200m; high elevation, 1550 m) during two consecutive growing periods. Errors bars represent the standard error; significant differences between stands were tested by repeated measured MANOVA.ψxn = 5 trees (3 twigs per tree) per elevation; ψπ n =12 trees (2 twigs per tree) per elevation.
Forests 06 02241 g004
The needle osmotic potential (Ψπ) did not show a seasonal pattern associated with the drought period in any of the two studied years (Figure 4). Furthermore, Ψπ was not correlated with either soil water content, vapour pressure deficit, xylem water potential, or stomatal conductance. Minimum values (i.e., higher Ψπ) of about −2.5 MPa were registered in spring, while maximum values (i.e., lower Ψπ) of about −1.7 MPa were registered in early summer and October. Regardless, Ψπ remained more negative than ψx during the whole study period, ensuring a water potential gradient from roots to needles. The seasonal variations in ψπ were small compared with those observed in ψx.

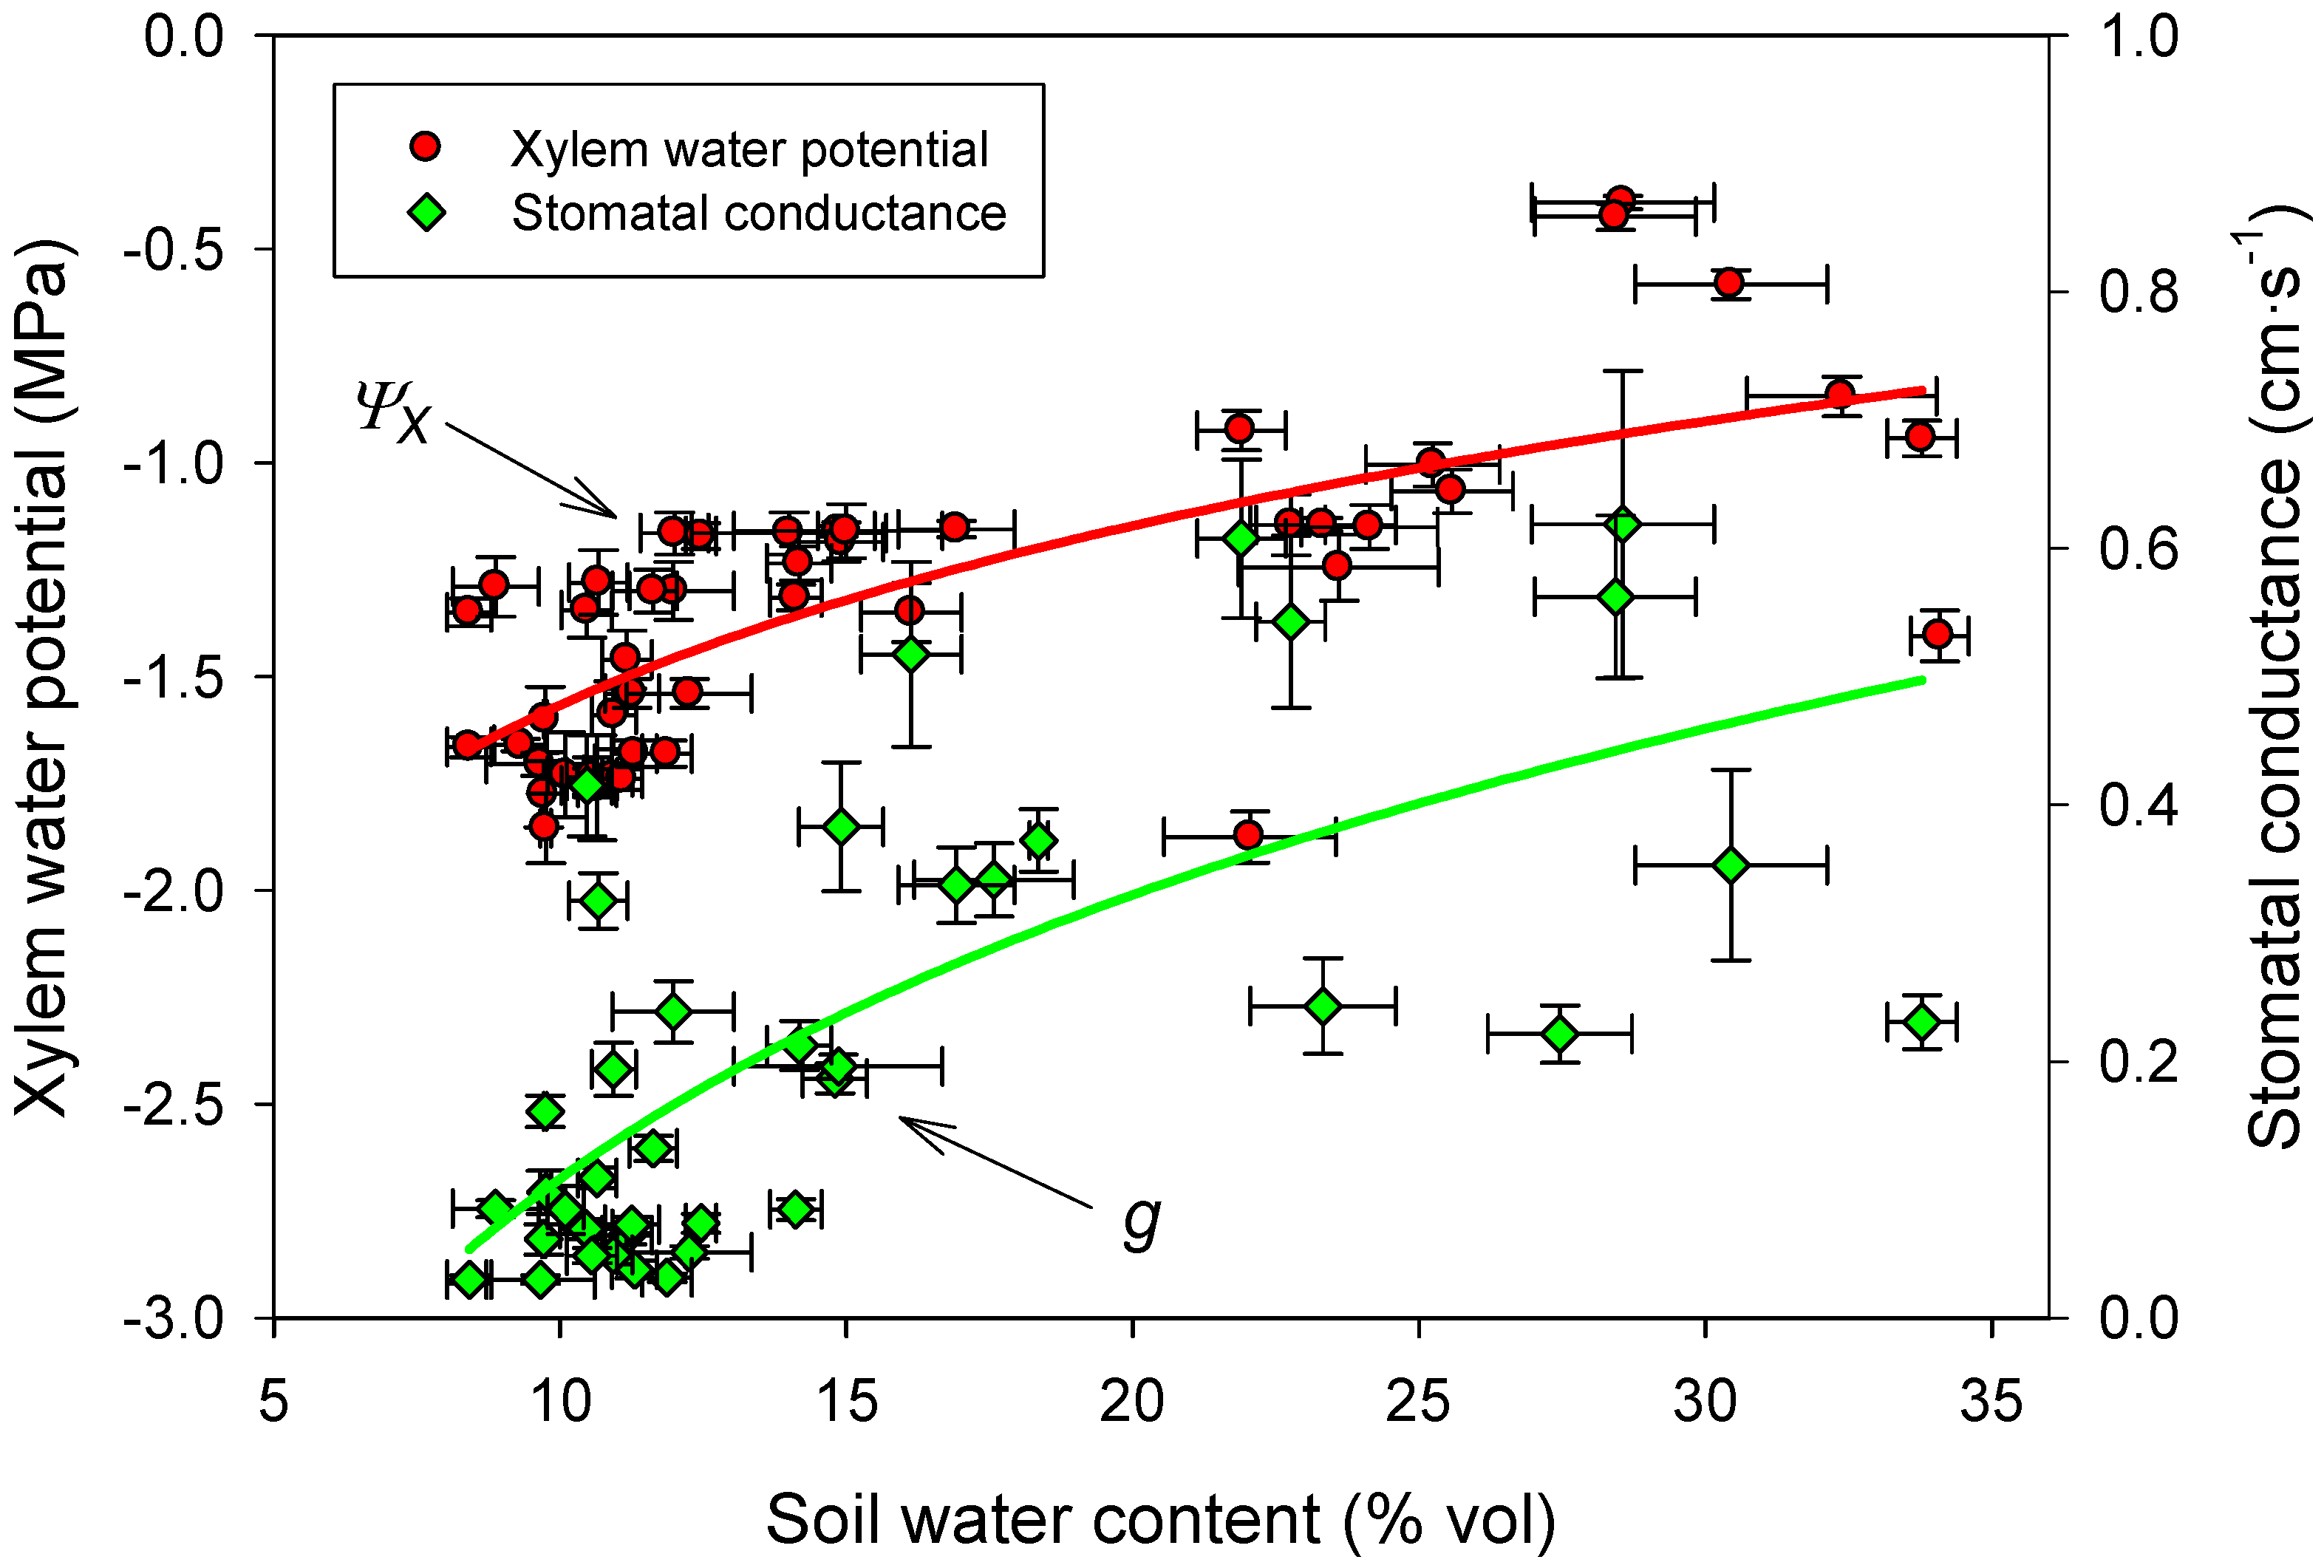
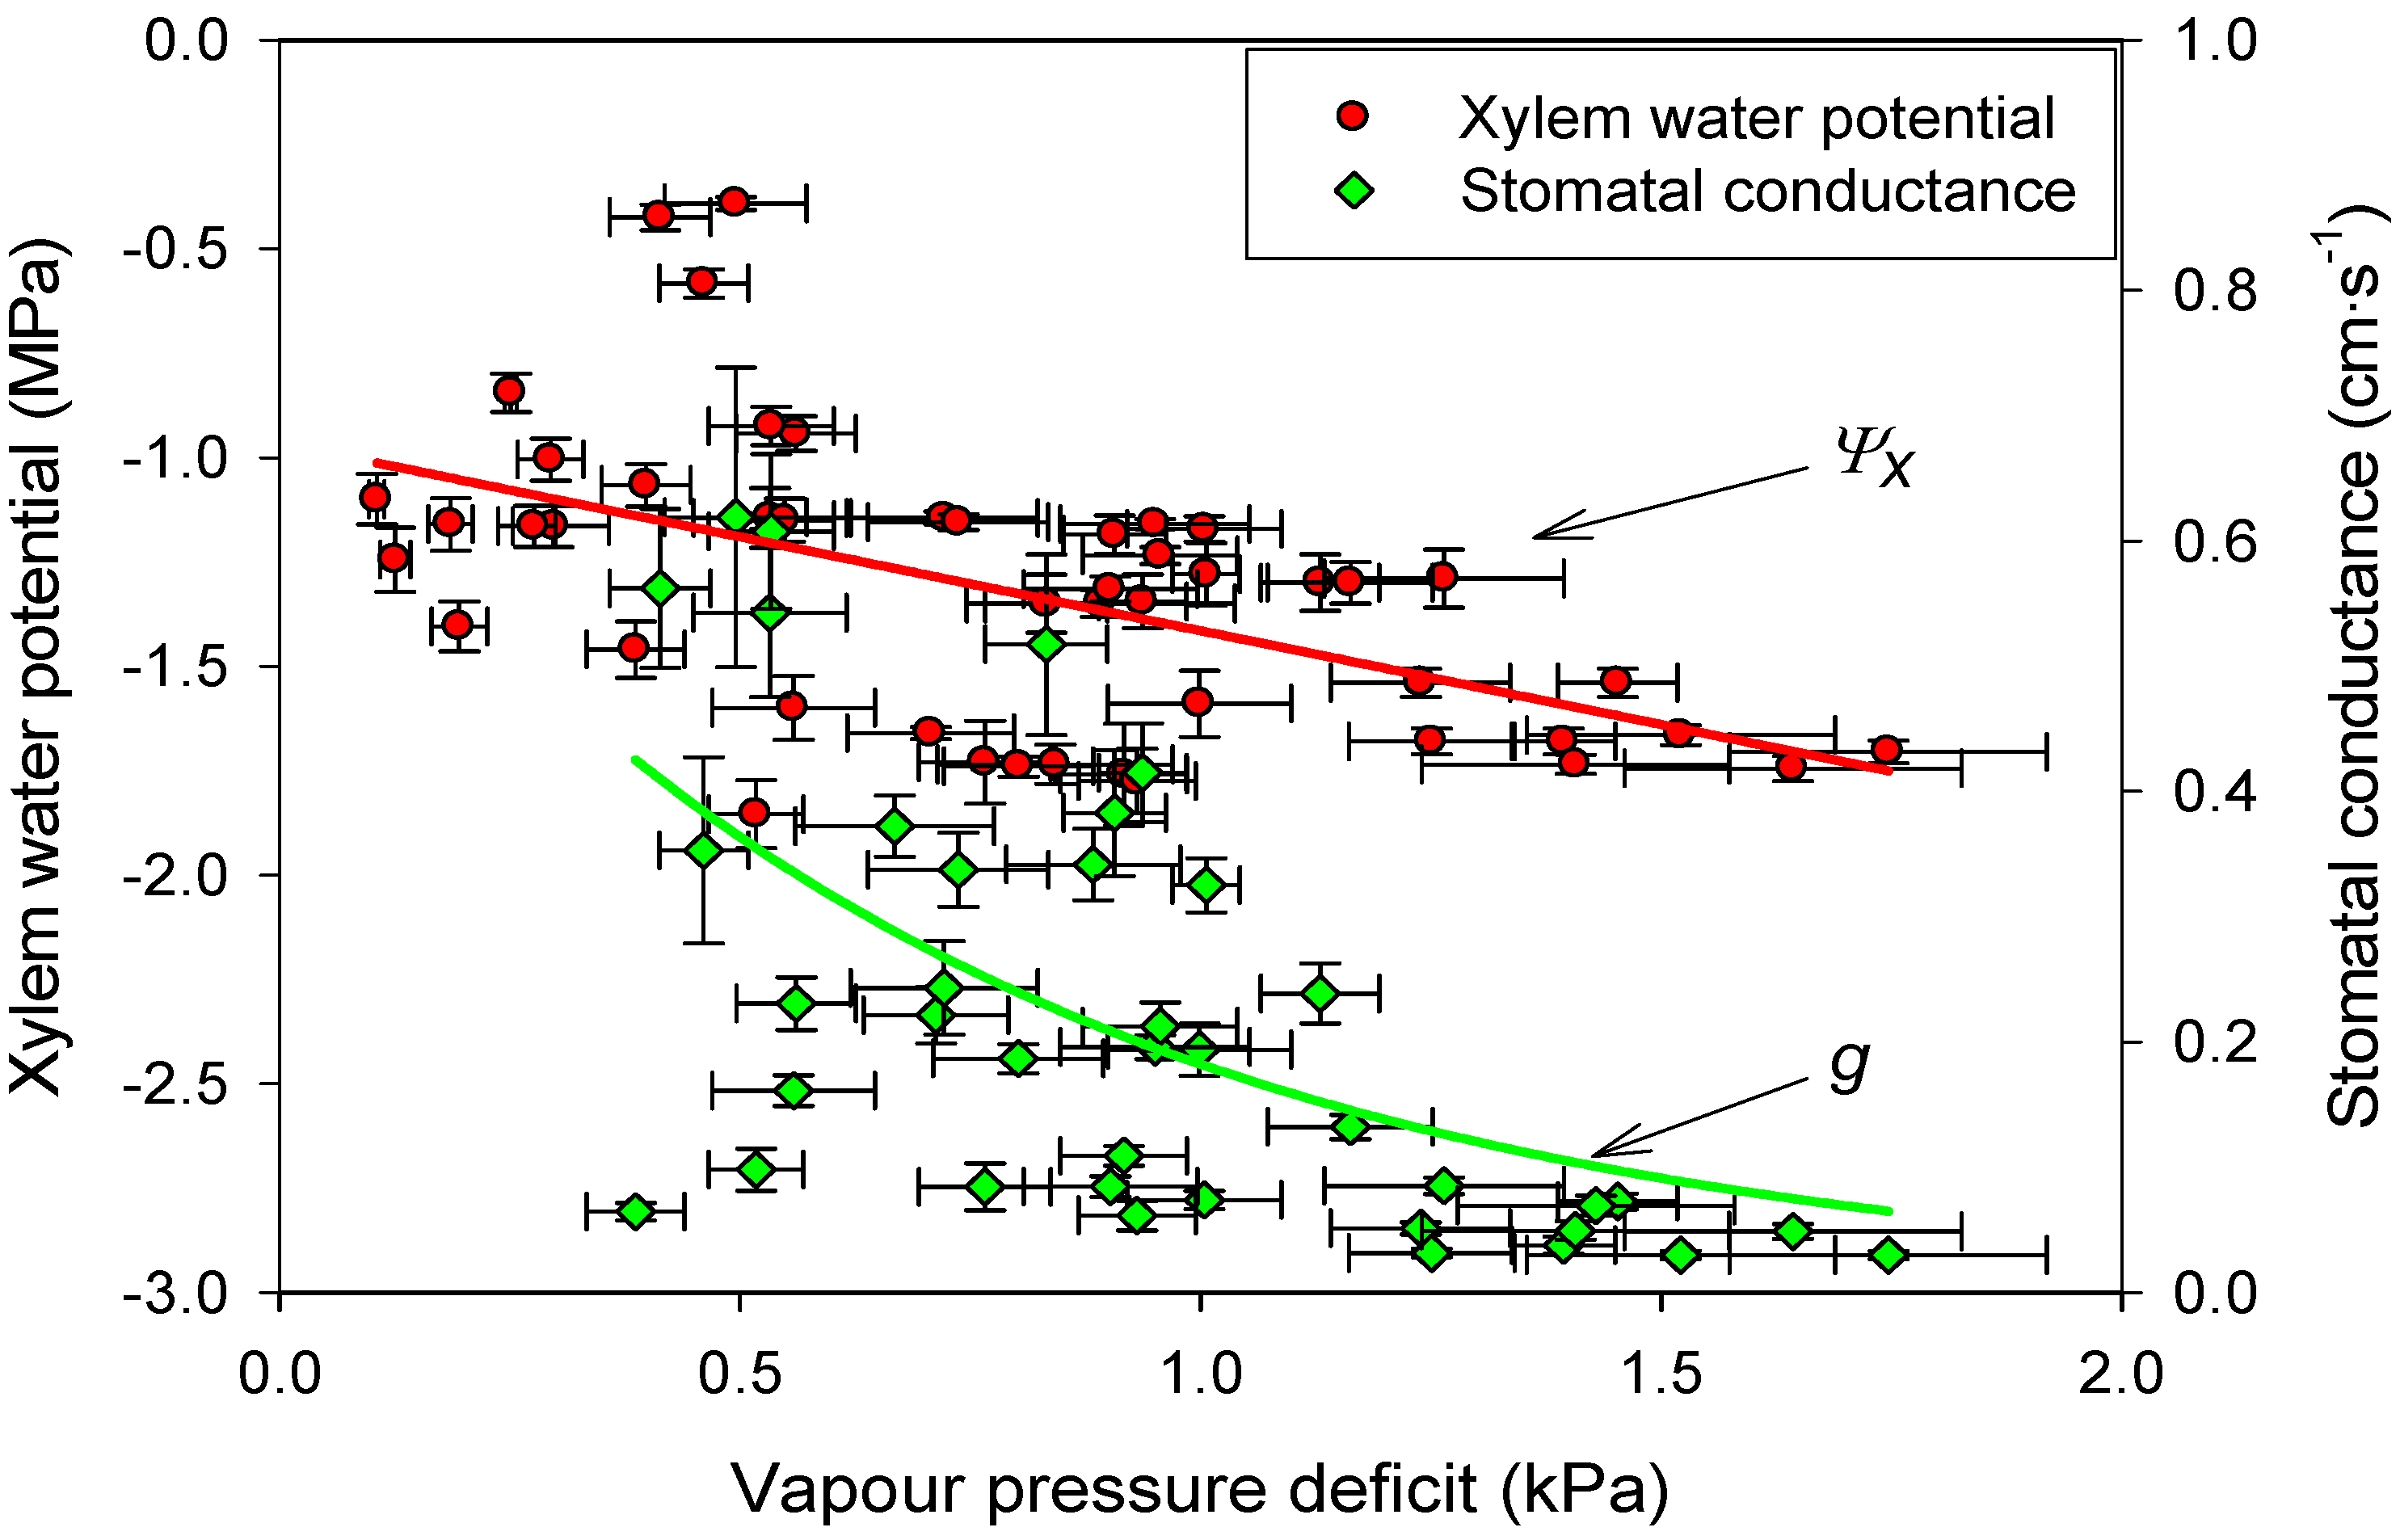
3.4. Linking Physiological and Environmental Variables Related to Water Balance

Midday xylem water potential decreased linearly (R2=0.29, p <0.001; Figure 5) as atmospheric vapour pressure deficit increased, while midday stomatal conductance yielded an exponential response (R2=0.36, p <0.001; Figure 5). These relationships were similar for both populations and during the two studied years (based on tests for regression parameters performed independently for both populations and years). On the other hand, both the midday xylem water potential and the midday stomatal conductance yielded a logarithmic relationship with soil water content (R2=0.51, p <0.001; and R2 = 0.48, p <0.001; for midday xylem water potential and midday stomatal conductance, respectively; Figure 6), indicating weak relationships for volumetric soil water contents above c.a. 15%–20%, followed by a sudden decrease in both variable as the soil water availability decreased below this threshold (Figure 6). In addition, we noted that for VPD, these relationships (the regression parameters of each model adjusted independently) were similar for both populations and during the two studied years, supporting a similar physiological response among trees located at different elevations and between years with contrasting water availability.
Figure 5. Relationships between midday xylem water potential and midday stomatal conductance as a function of vapour pressure deficit (VPD) in Abies pinsapo trees along an altitudinal gradient (low elevation, 1200 m; high elevation, 1550 m) measured during two consecutive growing periods. Errors bars represent the standard error. Midday xylem water potential showed a linear relationship (R2 = 0.29, p <0.001), while midday stomatal conductance showed an exponential relationship (R2 = 0.36, p <0.001)with VPD.
Forests 06 02241 g005
Figure 6. Relationships between midday xylem water potential and midday stomatal conductance as a function of soil water content in Abies pinsapo trees along an altitudinal gradient (low elevation, 1200 m; high elevation, 1550 m) measured during two consecutive growing periods. Errors bars represent the standard error. Both midday xylem water potential (R2 = 0.48, p <0.001) and midday stomatal conductance (R2 = 0.51, p <0.001) showed a logarithmic relationship with soil water content.
Forests 06 02241 g006
As we noted above, no environmental variables showed significant correlations with the needle osmotic potential; furthermore, during the first studied year (moister and milder), we observed a marginally significant correlation between the needle osmotic potential and the vapour pressure deficit that indicated a positive relationship, that is, as the atmospheric water deficit increased, the needle osmotic potential became more positive, supporting a lack of response of Ψπ to water stress (see also Figure 4).

3.5. Foliar Nutrient Content

Based on repeated measures ANOVA analyses performed on the temporal trend of foliar nutrient content, we identified a common decrease as the growing season progressed (Table 2; Supplementary Material Figure S1). Thus, data were averaged to compare the early (May–June) and late growing period (July–September). The carbon percentage increased slightly during the growing period, with higher mean values at the lower elevation, while the N and P contents showed the opposite trend: a decrease during the growing period with lower values at low elevation. As a result, the needle C:N and N:P ratios were significantly higher at low elevation (Table 2). Foliar potassium (K) also showed decreasing trends toward the end of the growing season, although the dilution rate was less acute than that for N and P (Supplementary material, Figure S1) and significance was only achieved at low elevation (Table 2). Consequently, the K/P ratios were low (between 6–8) from late May to early July, and increased to maximum values in the drought period (end July to September), especially at low elevation. At the onset of water stress at low elevation (late July; see Figure 3), maximum K/P values coincided with minimum N/K and C/K ratios in the needles. Foliar K and Mg were similar for both populations, while foliar Ca and Mn were significantly lower at low elevation; however, the Fe and Zn contents were slightly higher at low elevation (Supplementary material, Figure S1).
Table 2. Foliar nutrient content measured in two-year-old needles of Abies pinsapo trees along an altitudinal gradient (low elevation, 1200 m; high elevation, 1550 m). Mean values were averaged comparing the early (May-June) and late growing period (July-September); different letters indicate significant differences for repeated measures ANOVA.
Low elevation (1200 m)High elevation (1550 m)
Time spamGrowing period (May–June)Summer–Autumn (July–September)Growing period (May–June)Summer–Autumn (July–September)
Carbon (%)47.1 ± 0.16b47.8 ± 0.10c46.7 ± 0.13a47.2 ± 0.08b
Nitrogen (%)1.11 ± 0.06c0.82 ± 0.03a1.08 ± 0.08c0.94 ± 0.03b
C/N43.5 ± 2.00a59.7 ± 2.17c47.2 ± 3.19b50.9 ± 1.60b
P (mg/g)1.11 ± 0.12b0.74 ± 0.05a1.52 ± 0.10c1.14 ± 0.04b
N/P11 .0 ± 0.95b11.9 ± 0.88b7.47 ± 0.81a8.38 ± 0.31a
K (mg/g)9.49 ± 0.63b7.22 ± 0.63a8.68 ± 0.41ab7.54 ± 0.42ab
Ca (mg/g)3.42 ± 0.23a2.91 ± 0.38a4.33 ± 0.28b3.72 ± 0.31b
Mg (mg/g)2.01 ± 0.072.16 ± 0.131.93 ± 0.102.03 ± 0.10
Fe (μg/g)190.1 ± 17.4c141.3 ± 4.56b184.2 ± 32.3c88.7 ± 7.41a
Mn (μg/g)71.1 ± 15.6b35.5 ± 3.95a141.8 ± 10.8c136.6 ± 13.7c
Zn (μg/g)22.1 ± 1.52b20.5 ± 1.50b19.2 ± 1.07ab18.2 ± 0.96a

4. Discussion

4.1. Drought-Avoidance Matters in A. pinsapo

Our results illustrate that A. pinsapo trees close their stomata and maintain homeostasis in leaf water content under limiting soil water and evaporative demand. Furthermore, the intra- and inter-annual dynamics in water balances support an earlier and more intense water stress during the summer at lower elevations. These results suggest that efficient stomatal closure might be a requirement among relict A. pinsapo populations to ensure survival [11]. Indeed, for both the populations, vapour pressure deficit values close to 1.5 kPa were related to near-complete stomatal closure; this threshold was reached at soil water contents of about 10%. Given that soil water content persist for longer at this range of drought values compared with the time span where VPD was as high as 1.5 kPa, we can conclude that soil water availability is more limiting than atmospheric evaporative demand for the water balance of A. pinsapo treesunder dry Mediterranean mountain environments (see also [29]). Nonetheless, trees located at the lower elevation (1200 m) exhibited earlier symptoms of water stress, while trees located at 1550 m showed systematically higher values of stomatal conductance, as well as improved daily-scale recovery of xylem water potential and growth [11]. Regardless, both populations showed a seasonal response to increasing drought, similar to that of typical Mediterranean species, with spring maximums and low summer stomatal conductance values [19,30,31,32].
The A. pinsapo stomatal conductance values measured before summer under conditions of mild temperature and non-limiting soil water contentwere relatively high compared with some Mediterranean species such as Pinus halepensis, Juniperus phoenicea or Quercus ilex [33]. In terms of circadian patterns, during the drought period, the morning values for A. pinsapo were somehow lower than those of Q. ilex, but similar to those of P. halepensis and J. phoenicea. However the midday stomatal conductance values of A. pinsapo were close to those of Q. ilex and surpassed those of P. halepensis and J. phoenicea [33,34]. These results indicate that on a daily scale, the stomatal dynamics of A. pinsapo are different to those typically found in Mediterranean trees. Thus, stomatal conductance of A. pinsapo generally indicates midday maximums, except in late summer, where values are permanently low [35], while the daily dynamics of Mediterranean trees are characterized by early morning maximums, a sharp decline at midday, and a relative recovery of stomatal conductance values during the afternoon [17].
Many studies have demonstrated that populations from xeric sites show higher photosynthetic rates and stomatal conductance than those from mesic areas under similar drought conditions [36,37,38]. A higher resistance to embolism might explain this enhanced drought tolerance, through a plastic response of the xylem physiology to different levels of water stress [39]. However, our field data suggest that the risk of embolism was small because xylem water potentials were quite different from the A. pinsapo published values of xylem water potential at which embolism begins [35]. Therefore, both the high and low elevation populations showed a similar and high safety margin, suggesting that A. pinsapo responds to low soil water availability and high evaporative atmospheric pressure by maintaining xylem water potential within a safety range, rather than being able to resist a higher tension in the xylem [29,35].
At a steady state, water uptake must be balanced by water losses to the atmosphere by transpiration [40]. In conifers, water uptake may be expressed as the product of leaf-specific conductivity (LSC) and the water potential gradient (ΔΨ; that is, the difference between xylem water potential at midday and at predawn). On the other hand, water losses may be approximated by the product of stomatal conductance (gs) and atmospheric vapour pressure deficit (VPD) [41]:
LSC* ΔΨ =gs* VPD
In this study, VPD and ΔΨ values were not very different between the low and high elevations, whereas gs was significantly lower at low elevation. Thus, according to Equation (4), a similar value in ΔΨ between the two populations suggests a reduction in the whole-plant hydraulic conductance at low elevation, likely due to decreased leaf-specific conductivity [42,43]. Such a reduction in LSC could be an adaptive response to achieve a balance between the water flow to the leaves and the water flow from the leaves to the atmosphere, reducing the risk of drought-induced cavitation due to excessive water tension in the xylem [40]. This hypothetical difference in LSC, based on the contrasting gs in the two populations may be explained by the existence of anatomical differences, for instance, by means of a reduction in the stomatal density [35]. However, a most logical explanation for the difference in behavior between the two populations in this study likely relies on the synthesis of the plant hormone abscisic acid (ABA) to maintain stomatal closure during sustained drought[44].
Our results indicate that A. pinsapo rapidly closed their stomata over a very narrow range of water potentials. This isohydric response of photosynthesis and transpiration during water stress is thought to represent the evolutionary conservation of water and carbon maintenance under long-term water stress [45]. The data presented here, as well as in recent studies, suggest a probable explanation of this stomatal behaviour mediated by ABA metabolism in concert with xylem vulnerability to water stress-induced failure [46,47]. A. pinsapo likely uses high levels of ABA to close their stomata and to maintain homeostasis in the leaf water content during drought [44]. Additionally, since potassium (K) is involved in plant-water relationships (stomatal function and osmotic control [48,49], the fact that both populations had similar foliar K concentrations and seasonal patterns for its stoichiometric relationships (K/P, N/K and C/K) further support the idea of ABA synthesis-mediated responses to maintain stomatal closure during drought[44].
The mean net photosynthetic rate reported for A. pinsapo (~3.2 μmol·m−2s−1; [29]) was slightly higher than that published for P. halepensis (~2.5 μmol m−2s−1) and J. phoenicea (2.2 μmol m−2s−1), but lower than that obtained for Q. ilex (4.2 μmol m−2s−1; [33]). Low elevation individuals showed a marked decline in photosynthesis during midday in summer, with values of about ~1.5 μmol m−2s−1 (unpublished data). Drought causes a decrease in the xylem water potential, which, among other physiological mechanisms, reduces tree photosynthetic carbon uptake as a result of stomatal closure to prevent hydraulic failure. Consequently, under the expected climate scenario of increasing temperature and declining water availability [15], the growth of drought-sensitive species such as A. pinsapo will likely be reduced [11,35], while carbohydrate reserves are consumed to maintain metabolism, which can ultimately cause the death of the tree by carbon starvation or hydraulic failure [10,50,51].
Tree species showing drought-avoidance mechanisms prevent xylem damage by early stomatal closure, before exhibiting significant changes in xylem or needle water status. Drought-tolerant species, however, display simultaneous stomatal conductance and water potential decreases [52,53]. Stomatal closure induced by low water availability in drought-tolerant species (for instance, Quercus or Juniperus) limits carbon uptake to a lesser extent compared with drought-avoiding tree species, such as Abies or Pinus [52,53,54]. Mediterranean oaks (Quercus) are able to maintain significant carbon uptake even at low water potentials (below −2.0 MPa; [55]), while drought-sensitive species, such as A. pinsapo, show strong decreases in net photosynthesis, even at moderate water deficits, due to stomatal closure (see also [29]).
However, it should be taken into account that during winter, the net photosynthetic rate of A. pinsapo was higher than the values measured in summer and autumn, i.e., greater than 3.5 μmol·m−2s−1 (unpublished data). This result seems to indicate that an important fraction of carbon can be taken up during winter. Indeed, research performed across broad environmental conditions in north-western USA has shown that coniferous forests take up a large amount of carbon during winter [56]. For instance, results obtained for Pseudotsuga menziesii, a conifer displaying a drought sensitivity similar to A. pinsapo, show that most annual net photosynthesis is not produced during the growing period [56,57]. Thus, a significant fraction of carbon that is not taken up under drought conditions could be compensated by higher photosynthesis under climate change-induced milder winter conditions.

4.2. Capacity of Osmotic Adjustment

A. pinsapo needle osmotic potential did not show a seasonal pattern associated with drought. A decline in osmotic potential has been interpreted as a response to water stress, mediated by an increase in osmotically active solutes at the cellular level. This may be achieved by a passive concentration of existing solutes due to dehydration and reduction in cell size (strictly speaking not an osmotic adjustment) or by active redistribution of solutes [58,59]. During the drought period, our data showed variations in A. pinsapo needle osmotic potential around −0.25 MPa, although the xylem water potential decreased by −1.0 MPa; furthermore, these variables were not correlated. The absence of osmotic adjustment in A. pinsapo in response to drought confirms its low tolerance to water stress [58]. Moreover, the obtained values could be related to limited soil nutrient uptake, restricting the synthesis of osmotically active substances when the stomata are closed. Indeed, growth during the drought period can be limited by a lack of osmotic adjustment capacity to reach the turgor pressure necessary for cell elongation [36]. However, in both populations,the foliar nutrient contents decreased in a similar way and the N/P ratios were at a minimum at the peak of the growing season. In accordance with the growth rate hypothesis [60], this is more closely related to the allocation of nutrients to renewal and subsequent dilution with carbon during active growth (that concomitantly requires increased allocation of P to RNA) than to a drought-induced soil nutrient uptake limitation (see Supplementary material, Figure S1).
Osmotic adjustment capacity has been documented for many tree species, for instance, Quercus, with more negative values under drought conditions [37,61]. However, there is no significant correlation between the predawn xylem water potential and leaf osmotic potential in this genus. Quercus species with more negative values of xylem water potential, or those showing a higher range of variation do not necessarily show the lowest values of leaf osmotic potential nor the highest osmotic adjustment capacity [61]. Several studies on temperate trees have shown seasonal changes in leaf osmotic potential that were not related to water availability, such as a decline in the osmotic potential after the end of the drought period or a decline during the drought period. In both studied years and in the two populations, a decline in ψπ was observed during the growing period, which may be related to solute dilution because of allocation to new shoots, as supported by the general increase in the C/element ratios toward the end of the growing season. This type of elemental stoichiometric change has been associated with shifts in the plant metabolome, indicating growth rather than drought resistance [62]. A similar pattern of osmotic potential decline (toward positive values) during shoot growth has been observed in species such as Picea abies [26]or Nothofagus menziesii [63]. According to these authors, this indicates higher sensitivity/susceptibility of the new shoots to drought.
Seasonal temperature variations may lead to changes in ψπ, particularly in conifers [61]. In fact, initial observations on solute accumulation were related to mechanisms of resistance against freezing or acclimatization to cold, for instance, in Tsuga canadensis, Abies amabilis or Pseudotsuga menziesii [61,62,63]. A more negative value of ψπ at the beginning of the growing season (May) was also observed in other species. Both observations concur with the minimums recorded for A. pinsapo (December and May). Several papers suggested that solute accumulation could be higher under low temperatures since photosynthesis does not seem to be significantly affected by cold, respiration costs are lower and there is no solute allocation to growth during this period. Our results seem to verify that environmental factors and phenological events not related to drought (for instance, seed production) may have a significant impact on ψπ, although the underlying mechanisms are not well known.
The absence of osmotic adjustment in this species makes it more sensitive to increases in drought, given that ψπ determines the maximum pressure that can be imposed on soil water through a soil-plant-atmosphere gradient. That is, the value of ψx cannot be more negative than the one of ψπ. A more arid climatic situation could limit the photosynthetic rate even more during the summer period and would indirectly reduce the solute concentration and ψπ when water stress is greatest.

5. Conclusions

A. pinsapo shows a water stress-avoidance strategy that is reflected in rapid stomatal closure with rather positive water potentials and relatively high values of soil water content. These ecophysiological features are similar to those of temperate and mountain conifer, although the seasonal pattern was typically Mediterranean. Under severe drought conditions, the xylem water potentials were not as negative as in other drought-adapted competitor species, while carbon uptake appeared to be significantly reduced under water limitation. A. pinsapo does not show needle osmotic adjustment in response to drought. The impact of expected dryness as a result of climate change on A. pinsapo growth and persistence will likely be more severe at lower elevations because no local adaptive capacity to drought was observed.

Acknowledgments

This study was supported by “Junta de Andalucía” projects CVI-302, P06RNM2183, RNM-296, RNM-313 and Egmasa-NET313926 and was co-financed by FEDER through Operative Program-Andalucía 2007–2013. We thank José B. López-Quintanilla and Fernando Ríos (Consejería de Medio Ambiente y Ordenación del Territorio, Junta de Andalucía). R. Sánchez-Salguero is grateful for the postdoctoral fellowship from Fondo Europeo de Desarrollo Regional (FEDER)-Programa de Fortalecimiento de las capacidades en I + D + i de las Universidades 2014–2015 de la Junta de Andalucía.

Conflicts of Interest

The authors declare no conflict of interest.

References

  1. Breshears, D.D.; Cobb, N.S.; Rich, P.M.; Price, K.P.; Allen, C.D.; Balice, R.G.; Romme, W.H.; Kastens, J.H.; Floyd, M.L.; Belnap, J.; et al. Regional vegetation die-off in response to global-change-type drought. Proc. Natl. Acad. Sci. USA 2005, 102, 15144–15148. [Google Scholar] [CrossRef] [PubMed]
  2. Allen, C.D.; Macalady, A.K.; Chenchouni, H.; Bachelet, D.; McDowell, N.; Vennetier, M.; Kitzberger, T.; Rigling, A.; Breshears, D.D.; Hogg, E.H.; et al. A global overview of drought and heat-induced tree mortality reveals emerging climate change risks for forests. For. Ecol. Manag. 2010, 259, 660–684. [Google Scholar] [CrossRef]
  3. Linares, J.C.; Camarero, J.J. From pattern to process: Linking intrinsic water-use efficiency to drought-induced forest decline. Glob. Ch. Biol. 2012, 18, 1000–1015. [Google Scholar] [CrossRef]
  4. Carnicer, J.; Barbeta, A.; Sperlich, D.; Coll, M.; Peñuelas, J. Contrasting trait syndromes in angiosperms and conifers are associated with different responses of tree growth to temperature on a large scale. Front. Plant Sci. 2013, 4, 409. [Google Scholar] [CrossRef] [PubMed]
  5. Aitken, S.N.; Yeaman, S.; Holliday, J.A.; Wang, T.; Curtis-McLane, S. Adaptation, migration or extirpation: Climate change outcomes for tree populations. Evol. Appl. 2008, 1, 95–111. [Google Scholar] [CrossRef] [PubMed]
  6. Tardieu, F.; Simonneau, T. Variability among species of stomatal control under fluctuating soil water status and evaporative demand: Modeling isohydric and anisohydric behaviours. J. Exp. Bot. 1998, 49, 419–432. [Google Scholar] [CrossRef]
  7. Hsiao, T.C. Plant responses to water stress. Annu. Rev. Plant Physiol. Plant. Mol. Biol. 1973, 24, 519–570. [Google Scholar] [CrossRef]
  8. Ditmarová, L.; Kurjak, D.; Palmroth, S.; Kmet, J.; Strelcová, K. Physiological responses of Norway spruce (Picea abies) seedlings to drought stress. Tree Physiol. 2010, 30, 205–213. [Google Scholar] [CrossRef] [PubMed]
  9. Hsiao, T.C.; Acevedo, E.; Fereres, E.; Henderson, D.W. Stress metabolism—Water stress, growth, and osmotic adjustment. Philos. Trans. R. Soc. Lond. B Biol. Sci. 1976, 273, 479–500. [Google Scholar] [CrossRef]
  10. McDowell, N.G. Mechanisms linking drought, hydraulics, carbon metabolism, and vegetation mortality. Plant Physiol. 2011, 155, 1051–1059. [Google Scholar] [CrossRef] [PubMed]
  11. Linares, J.C.; Covelo, F.; Carreira, J.A.; Merino, J. Phenological and water-use patterns underlying maximum growing season length at the highest elevations: Implications under climate change. Tree Physiol. 2012, 32, 161–170. [Google Scholar] [CrossRef] [PubMed]
  12. Linares, J.C.; Tíscar, P.A.; Camarero, J.J.; Taïqui, L.; Viñegla, B.; Seco, J.I.; Merino, J.; Carreira, J.A. Tree growth decline on relict western-Mediterranean mountain forests: Causes and impacts. In Forest Decline: Causes and Impacts; Jenkins, J.A., Ed.; Nova Science Publishers, Inc.: New York, NY, USA, 2012; pp. 91–110. [Google Scholar]
  13. Trigo, R.M.; Palutikof, J.P. Precipitation scenarios over Iberia: A comparison between direct GCM output and different downscaling techniques. J. Clim. 2001, 14, 4422–4446. [Google Scholar] [CrossRef]
  14. Räisänen, J.; Hansson, U.; Ullerstig, A.; Döscher, R.; Graham, L.P.; Jones, C.; Meier, H.E.M.; Samuelsson, P.; Willén, U. European climate in the late twenty-first century: Regional simulations with two driving global models and two forcing scenarios. Clim. Dyn. 2004, 22, 13–31. [Google Scholar] [CrossRef]
  15. IPCC. IPCC Fifth Assessment Report (AR5). In Climate Change 2013: The Physical Science Basis; Cambridge University Press: Cambridge, UK, 2014. [Google Scholar]
  16. Breshears, D.D.; Adams, H.D.; Eamus, D.; McDowell, N.G.; Law, D.J.; Will, R.E.; Williams, A.P.; Zou, C.B. The critical amplifying role of increasing atmospheric moisture demand on tree mortality and associated regional die-off. Front. Plant Sci. 2013, 4, 266. [Google Scholar] [CrossRef] [PubMed]
  17. Joffre Infante, J.M.; Mauchamp, A.; Fernández-Alés, R.; Joffre, R.; Rambal, S. Within-tree variation in transpiration in isolated evergreen oak trees: Evidence in support of the pipe model theory. Tree Physiol. 2001, 21, 409–414. [Google Scholar] [CrossRef]
  18. Rambal, S.; Ourcival, J.M.; Joffre, R.; Mouillot, F.; Nouvellon, Y.; Reichstein, M.; Rocheteau, A. Drought controls over conductance and assimilation of a Mediterranean evergreen ecosystem: Scaling from leaf to canopy. Glob. Chang. Biol. 2003, 9, 1813–1824. [Google Scholar] [CrossRef]
  19. Linares, J.C.; Camarero, J.J.; Carreira, J.A. Plastic responses of Abies pinsapo xylogenesis to drought and competition. Tree Physiol. 2009, 29, 1525–1536. [Google Scholar] [CrossRef] [PubMed]
  20. Soil Survey Staff. Keys to Soil Taxonomy, 8th ed.; USDA-Natural Resources Conservation Service: Washington, DC, USA, 1999. [Google Scholar]
  21. Rawls, W.J.; Pachepsky, Y.A.; Ritchie, J.C.; Sobecki, T.M.; Bloodworth, H. Effect of soil organic carbon on soil water retention. Geoderma 2003, 116, 61–76. [Google Scholar] [CrossRef]
  22. De Vos, B.; van Meirvenne, M.; Quataert, P.; Deckers, J.; Muys, B. Predictive Quality of Pedotransfer Functions for Estimating Bulk Density of Forest Soils. Soil Sci. Soc. Am. J. 2005, 69, 500–510. [Google Scholar] [CrossRef]
  23. Lambers, H.; Chapin, F.S.; Pons, T.L. Plant Physiological Ecology; Springer: New York, NY, USA, 1998. [Google Scholar]
  24. Schulze, E.-D.; Beck, E.; Müller-Hohenstein, K. Plant Ecology; Springer-Verlag: Heidelberg, Germany, 2002. [Google Scholar]
  25. Castellvi, F.; Perez, P.J.; Stockle, C.O.; Ibanez, M. Methods for estimating vapour pressure deficit at a regional scale depending on data availability. Agric. For. Meteorol. 1997, 87, 243–252. [Google Scholar] [CrossRef]
  26. Maier-Maercker, U. Dynamics of change in stomatal response and water status of Picea abies during a persistent drought period: A contribution to the traditional view of plant water relations. Tree Physiol. 1998, 18, 211–222. [Google Scholar] [CrossRef] [PubMed]
  27. Sommers, L.E.; Nelson, D.W. Determination of total phosphorus in soils: A rapid perchloric acid digestion procedure. Soil Sci. Soc. Am. J. 1972, 36, 902–904. [Google Scholar] [CrossRef]
  28. Von Ende, C.N. Repeated-Measures Analysis: Growth and Other Time-Dependent Measures. Design and Analysis of Ecological Experiments; Scheiner, S.M., Gurevitch, J., Eds.; Oxford University Press: Oxford, UK, 2001; pp. 134–157. [Google Scholar]
  29. Peguero-Pina, J.J.; Sancho-Knapik, D.; Cochard, H.; Barredo, G.; Villarroya, D.; Gil-Pelegrín, E. Hydraulic traits are associated with the distribution range of two closely related Mediterranean firs, Abies alba Mill. And Abies pinsapo Boiss. Tree Physiol. 2001, 31, 1–9. [Google Scholar] [CrossRef] [PubMed]
  30. Mooney, H.A. Habitat, plant form, and plant water relations in Mediterranean-climate regions. Ecol. Medit. 1982, 8, 481–488. [Google Scholar]
  31. Flexas, J.; Medrano, H. Drought-inhibition of photosynthesis in C3 plants: Stomatal and non-stomatal limitations revisited. Ann. Bot. 2002, 89, 183–189. [Google Scholar] [CrossRef] [PubMed]
  32. Klein, T.; Shpringer, I.; Fikler, B.; Elbaz, G.; Cohen, S.; Yakir, D. Relationships between stomatal regulation, water-use, and water-use efficiency of two coexisting key Mediterranean tree species. For. Ecol. Manag. 2013, 302, 34–42. [Google Scholar] [CrossRef]
  33. Baquedano, F.J.; Castillo, F.J. Drought tolerance in the Mediterranean species Quercus coccifera, Quercus ilex, Pinus halepensis, and Juniperus phoenicea. Photosynthetica 2007, 45, 229–238. [Google Scholar] [CrossRef]
  34. Martinez-Vilalta, J.; Mangirón, M.; Ogaya, R.; Sauret, M.; Serrano, L.; Peñuelas, J.; Piñol, J. Sap flow of three co-occurring Mediterranean woody species under varying atmospheric and soil water conditions. Tree Physiol. 2003, 23, 747–758. [Google Scholar] [CrossRef] [PubMed]
  35. Sancho-Knapik, D.; Peguero-Pina, J.J.; Flexas, J.; Herbette, S.; Cochard, H.; Niinemets, U.; Gil-Pelegrín, E. Coping with low light under high atmospheric dryness: Shade acclimation in a Mediterranean conifer (Abies pinsapo Boiss.). Tree Phys. 2015. [Google Scholar] [CrossRef] [PubMed]
  36. Abrams, M.D.; Kubiske, M.E. Photosynthesis and water relations during drought in Acer rubrum L. genotypes from contrasting sites in Central Pennsylvania. Funct. Ecol. 1990, 4, 727–733. [Google Scholar] [CrossRef]
  37. Abrams, M.D. Adaptations and responses to drought in Quercus species of North America. Tree Physiol. 1990, 7, 227–238. [Google Scholar] [CrossRef] [PubMed]
  38. Abrams, M.D.; Schultz, J.C.; Kleiner, K.W. Ecophysiological responses in mesic versus xeric hardwood species to an early-season drought in central Pennsylvania. For. Sci. 1990, 36, 970–981. [Google Scholar]
  39. Maherali, H.; DeLucia, E.H. Xylem conductivity and vulnerability to cavitation of ponderosa pine growing in contrasting climates. Tree Physiol. 2000, 20, 859–867. [Google Scholar] [CrossRef] [PubMed]
  40. Martínez-Vilalta, J.; Cochard, H.; Mencuccini, M.; Sterck, F. Hydraulic adjustment of Scots pine across Europe. New Phytol. 2009, 184, 353–364. [Google Scholar] [CrossRef] [PubMed]
  41. Martin, T.A.; Hinckley, T.M.; Meinzer, F.C.; Sprugel, D.G. Boundary layer conductance, leaf temperature and transpiration of Abies amabilis branches. Tree Physiol. 1999, 19, 435–443. [Google Scholar] [CrossRef] [PubMed]
  42. Schoonmaker, A.L.; Hacke, U.G.; Landhäusser, S.M.; Lieffers, V.J.; Tyree, M.T. Hydraulic acclimation to shading in boreal conifers of varying shade tolerance. Plant. Cell. Environ. 2010, 33, 382–393. [Google Scholar] [CrossRef] [PubMed]
  43. Peltoniemi, M.; Duursma, R.; Medlyn, B. Co-optimal distribution of leaf nitrogen and hydraulic conductance in plant canopies. Tree Physiol. 2012, 32, 510–519. [Google Scholar] [CrossRef] [PubMed]
  44. Brodribb, T.J.; McAdam, S.A.M.; Jordan, G.J.; Martins, S.C.V. Conifer species adapt to low-rainfall climates by following one of two divergent pathways. Proc. Natl. Acad. Sci. USA 2014, 111, 14489–14493. [Google Scholar] [CrossRef] [PubMed]
  45. Kollist, H.; Nuhkat, M.; Roelfsema, M.R.G. Closing gaps: Linking elements that control stomatal movement. New Phytol. 2014, 203, 44–62. [Google Scholar] [CrossRef] [PubMed]
  46. Brodribb, T.J.; McAdam, S.A.M. Abscisic acid mediates a divergence in the drought response of two conifers. Plant Physiol. 2013, 162, 1370–1377. [Google Scholar] [CrossRef] [PubMed]
  47. McDowell, N.; Pockman, W.T.; Allen, C.D.; Breshears, D.D.; Cobb, N.; Kolb, T.; Plaut, J.; Sperry, J.; West, A.; Williams, D.G.; et al. Mechanisms of plant survival and mortality during drought: Why do some plants survive while others succumb to drought? New Phytol. 2008, 178, 719–739. [Google Scholar] [CrossRef] [PubMed]
  48. Babita, M.; Maheswari, M.; Rao, L.M.; Shanker, A.K.; Rao, D.G. Osmotic adjustment, drought tolerance and yield in castor (Ricinus communis) L.) hybrids. Environ. Exp. Bot. 2010, 69, 243–249. [Google Scholar] [CrossRef]
  49. Khosravifar, S.; Yarnia, M.; Benam, M.B.K.; Moghbeli, A.H.H. Effect of potassium on drought tolerance in potato cv. Agria. J. Food Agric. Environ. 2008, 6, 236–241. [Google Scholar]
  50. Breda, N.; Huc, R.; Granier, A.; Dreyer, E. Temperate forest trees and stands under severe drought: A review of ecophysiological responses, adaptation processes and long-term consequences. Ann. For. Sci. 2006, 63, 625–644. [Google Scholar] [CrossRef]
  51. Breshears, D.D.; Myers, O.B.; Meyer, C.W.; Barnes, F.J.; Zou, C.B.; Allen, C.D.; McDowell, N.G.; Pockman, W.T. Tree die-off in response to global-change-type drought: Mortality insights from a decade of plant water potential measurements. Front. Ecol. Environ. 2009, 7, 185–189. [Google Scholar] [CrossRef]
  52. Guehl, J.M.; Aussenac, G.; Boucachrine, J.; Zimmermann, R.; Pennees, A.; Ferhi, A.; Grieu, P. Sensitivity of leaf gas exchange to atmospheric drought, soil drought, and water-use efficiency in some Mediterranean Abies species. Can. J. For. Res. 1991, 21, 1507–1515. [Google Scholar] [CrossRef]
  53. Aussenac, G. Ecology and ecophysiology of circum-Mediterranean firs in the context of climate change. Ann. For. Sci. 2002, 59, 823–832. [Google Scholar] [CrossRef]
  54. Picon, C.; Ferhi, A.; Guehl, J.M. Concentration and d13C of leaf carbohydrates in relation to gas exchange in Quercus robur under elevated CO2 and drought. J. Exp. Bot. 1997, 48, 1547–1556. [Google Scholar]
  55. Martínez-Ferri, E.; Balaguer, L.; Valladares, F.; Chico, J.M.; Manrique, E. Energy dissipation in drought-avoiding and drought-tolerant tree species at midday during the Mediterranean summer. Tree Physiol. 2000, 20, 131–138. [Google Scholar] [CrossRef] [PubMed]
  56. Waring, R.H.; Schlesinger, W.H. Forest Ecosystems. Concepts and Management; Academic Press, INC: San Diego, CA, USA, 1985. [Google Scholar]
  57. Emmingham, W.H.; Waring, R.H. An index of photosynthesis for comparing forest sites in western Oregon. Can. J. For. Res. 1977, 7, 165–174. [Google Scholar] [CrossRef]
  58. Peguero-Pina, J.; Camarero, J.J.; Abadía, A.; Martín, E.R.; González-Cascón, A.; Morales, F.; Gil-Pelegrín, E. Physiological performance of silver-fir (Abies alba Mill.) populations under contrasting climates near the south-western distribution limit of the species. Flora 2007, 202, 226–236. [Google Scholar] [CrossRef]
  59. Nguyen, A.; Lamant, A. Variation in growth and osmotic regulation of roots of water-stressed maritime pine (Pinus pinaster Ait.) provenances. Tree Physiol. 1989, 5, 123–133. [Google Scholar] [CrossRef] [PubMed]
  60. Elser, J.J.; Dobberfuhl, D.R.; MacKay, N.A.; Schampel, J.H. Organism size, life history, and N: P stoichiometry. Bioscience 1996, 46, 674–684. [Google Scholar] [CrossRef]
  61. Abrams, M.D. Sources of variation in osmotic potentials with special reference to North American tree species. For. Sci. 1988, 34, 1030–1046. [Google Scholar]
  62. Rivas-Ubach, A.; Sardans, J.; Pérez-trujillo, M.; Estiarte, M.; Peñuelas, J. Strong relationship between elemental stoichiometry and metabolome in plants. Proc. Natl. Acad. Sci. USA 2012, 109, 4181–4186. [Google Scholar] [CrossRef] [PubMed]
  63. Green, T.G.A.; Jane, G.T. Changes in osmotic potential during bud break and leaf development of Nothofagu smenziesii, Weinmannia racemosa,Quintinia acutifolia, and Ixerba brexioides. NZ. J. Bot. 1983, 21, 391–395. [Google Scholar] [CrossRef]

