Article

Species Distribution Model for Management of an Invasive Vine in Forestlands of Eastern Texas

1
Department of Wildlife and Fisheries Sciences, Texas A&M University, College Station, TX 77843, USA
2
Department of Ecosystem Science and Management, Texas A&M University, College Station, TX 77843, USA
3
Texas A&M Forest Service, College Station, TX 77843, USA
*
Author to whom correspondence should be addressed.
Forests 2015, 6(12), 4374-4390; https://doi.org/10.3390/f6124374
Submission received: 14 September 2015 / Revised: 11 November 2015 / Accepted: 18 November 2015 / Published: 27 November 2015
(This article belongs to the Special Issue Biodiversity and Conservation in Forests)

Abstract

:
Invasive plants decrease biodiversity, modify vegetation structure, and inhibit growth and reproduction of native species. Japanese honeysuckle (Lonicera japonica Thunb.) is the most prevalent invasive vine in the forestlands of eastern Texas. Hence, we aimed to identify potential factors influencing the distribution of the species, quantify the relative importance of each factor, and test possible management strategies. We analyzed an extensive dataset collected as part of the Forest Inventory and Analysis Program of the United States Department of Agriculture (USDA) Forest Service to quantify the range expansion of Japanese honeysuckle in the forestlands of eastern Texas from 2006 to 2011. We then identified potential factors influencing the likelihood of presence of Japanese honeysuckle using boosted regression trees. Our results indicated that the presence of Japanese honeysuckle on sampled plots almost doubled during this period (from 352 to 616 plots), spreading extensively, geographically. The probability of invasion was correlated with variables representing landscape conditions, climatic conditions, forest features, disturbance factors, and forest management activities. Habitats most at risk to invasion under current conditions occurred primarily in northeastern Texas, with a few invasion hotspots in the south. Estimated probabilities of invasion were reduced most by artificial site regeneration, with habitats most at risk again occurring primarily in northeastern Texas.

1. Introduction

Invasive species have caused dramatic economic damage and loss of biodiversity worldwide and non-native species continue to invade forest ecosystems in the United States at an accelerating rate [1]. Despite general consensus on the risks posed by alien species, the exact economic and ecological impact of invasions is an active area of debate and, in some cases, certain potential benefits are pointed out, depending on particular species, scenario, and perspective (reviewed in [2]). Nevertheless, there are an estimated 50,000 non-native species on U.S. soil [3]. According to Wilcove et al. [4], 57% of the 1055 imperiled plant species in the U.S., for which they managed to collect threat data, were negatively impacted by alien species. Based on the same data, Gurevitch and Padilla [5], estimated that out of 602 plant species in the U.S. imperiled by invaders, 410 (about 68%) could be linked to competition and indirect habitat effects caused by alien plants, but highlighted that invasive plants often act in parallel with other factors, such as habitat loss. Invasive plants reduce forest productivity [6] and degrade forest health [2], and pose a particularly severe threat to the economically and ecologically important forestlands in the southeastern U.S. Southeastern forests contain about 201 million acres of timberland, corresponding to about 58% of U.S. timber production and about 16% of timber production world-wide [7], and also support a high level of biodiversity, with over 3000 native plant species [8]. However, invasive plants threaten both the productivity of timber species essential to economic sustainability of the region [9] and the biodiversity equilibrium essential to the provision of ecosystem services, such as erosion control [10].
Japanese honeysuckle (Lonicera japonica Thunb.), which was introduced into the U.S. from China and Japan in the early 1800s [11], is one of the most aggressive invasive species in North America. It has become naturalized in 45 states of the U.S., and the Canadian province of Ontario [11,12]. Its attractive and fragrant flowers made it a valued cultivar, but its long flowering period and hardy growth characteristics allowed it to escape cultivation [11], probably during the 1890s, and spread to most of its present range within about 30 years [13]. Japanese honeysuckle prefers moist woodlands, often growing in tangled clumps along slopes, but is able to tolerate most forest conditions [14]. It grows rapidly, flowers early and for long durations [15], reproduces via animal-dispersed seeds or vegetatively [16], possesses phenotypic plasticity which reduces herbivore damage [17], and has no known predators or pathogens within its invaded range [11]. It negatively affects native vegetation [18], modifying vegetation structure [19], decreasing biodiversity [20,21], and inhibiting natural regeneration of native species, including loblolly pine [22], a predominant tree species in both artificially and naturally regenerated forests of the southeast. While natural pine forest range has been gradually declining, the acreage of pine plantations has been steadily expanding since 1950s, reaching 32 million acres in 1999 with further expected increase up to 54 million acres in 2040 [23]. The expanding plantations and increased timber yield additionally highlight economic potential of the southeastern forests. Approximately 84% of the seedlings planted annually throughout the South are loblolly pine [24]. In the forestlands of eastern Texas, largely corresponding to the western part of the Piney Woods ecoregion, where loblolly pine is of both commercial and ecological importance, Japanese honeysuckle is the most prevalent invasive vine [25].
A recent study identified areas vulnerable to invasion by Japanese honeysuckle throughout Mississippi, stretching northward across western Tennessee and western Kentucky, westward across southern Arkansas, eastward across north-central Alabama, and also in several counties scattered within Virginia [26]. These authors used logistic regression to correlate land characteristics and climatic conditions with presence/absence of Japanese honeysuckle based primarily on analysis of data collected prior to 2006.
In the present study, we calculated the recent range expansion of Japanese honeysuckle within the forestlands of eastern Texas based on analyses of an extensive set of field data collected by the U.S. Forest Service on fixed plots during the period from 2007 to 2011. We then used boosted regression trees to analyze an extensive data set collected as part of the Forest Inventory and Analysis (FIA) program of the United States Department of Agriculture (USDA) Forest Service to identify areas within the forestlands of eastern Texas that were invaded by Japanese honeysuckle during the FIA inventory period that extended from 2007 to 2011. We quantitatively assessed a suite of landscape features, climatic conditions, forest conditions, forest management activities, and disturbances as potential factors affecting the likelihood of invasion. Based on identification of the potentially most influential factors, we predicted likelihoods of future invasions by Japanese honeysuckle under a common management strategy (artificial regeneration of loblolly pine).

2. Methods

2.1. Study Area and Data Sources

We focused our investigation on eastern Texas, which is an area of vast timber resources [27] that has been invaded by Japanese honeysuckle [25]. The warm and humid climate in the area is conducive to invasion.
To document range expansion of Japanese honeysuckle in eastern Texas between the years of 2006 and 2011, we extracted data on the presence or absence of Japanese honeysuckle using the Southern Nonnative Invasive Plant data Extraction Tool [25] of the USDA Forest Service. In the early 2000s, as part of the Forest Inventory and Analysis (FIA) Program, the Forest Service’s Southern Research Station began an intensive regional monitoring of nonnative plant invasions [28]. The FIA Program is a forest inventory program in which each state inventory is reported every five years in most southeastern states [29]. The basic sampling design consists of a lattice of 4047-m2 hexagons, with one sample plot located randomly within each hexagon [29,30]. Each sample plot consists of four subplots of radius 7.32 m which form a cluster consisting of a central subplot and three peripheral subplots equidistant from each other arrayed in a circle of radius 36.58 m centered on the central plot. On each subplot, inventory crews estimate percent cover by target invasive species [28], and also record a suite of landscape conditions and forest features, as well as past disturbances and forest management activities [30].

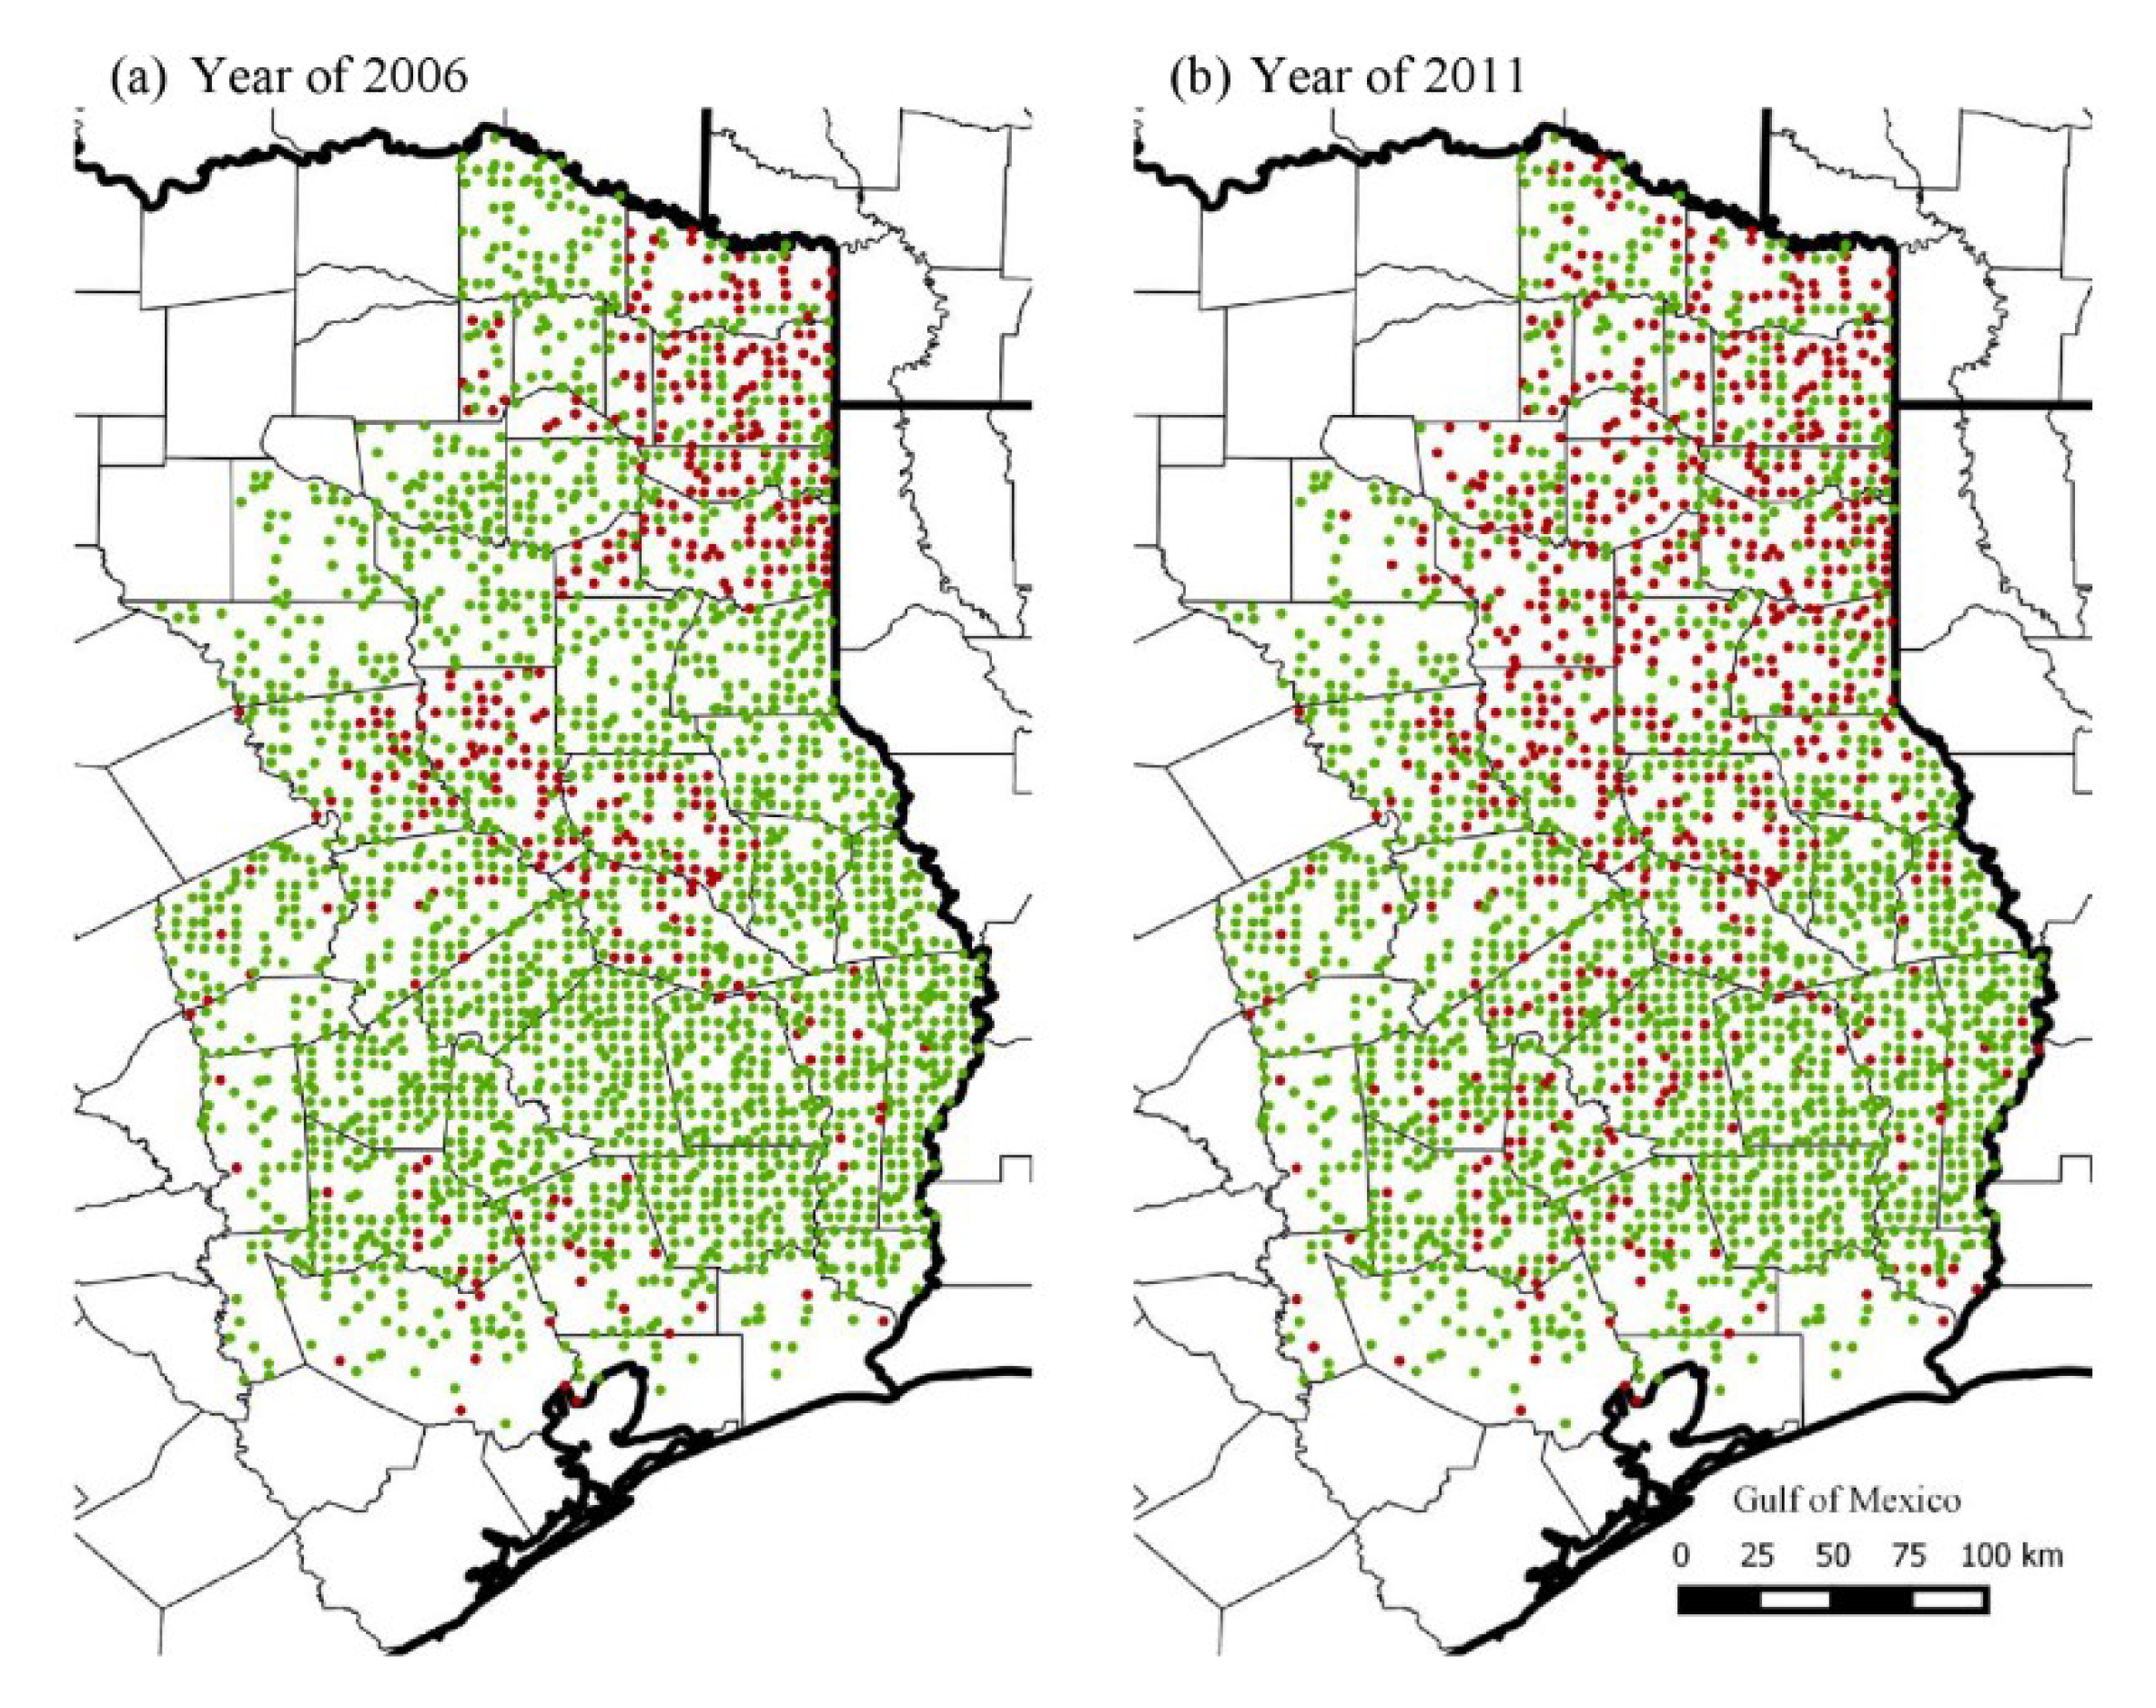
2.2. Quantification of the Range Expansion

At present, two state inventory cycles recording the presence of nonnative plant species have been reported (in 2006 and 2011) for eastern Texas [25]. We documented range expansion by noting the presence (with cover) or absence (without cover) of Japanese honeysuckle on each subplot sampled during each of these two inventories and then mapping and counting the plots in each inventory with Japanese honeysuckle present. We also calculated an index of potential rate of spread based on the distance between each plot in which Japanese honeysuckle was first detected during the second survey and the nearest plot in which Japanese honeysuckle had been detected during the first survey, that is, the distance to the nearest known propagule source.

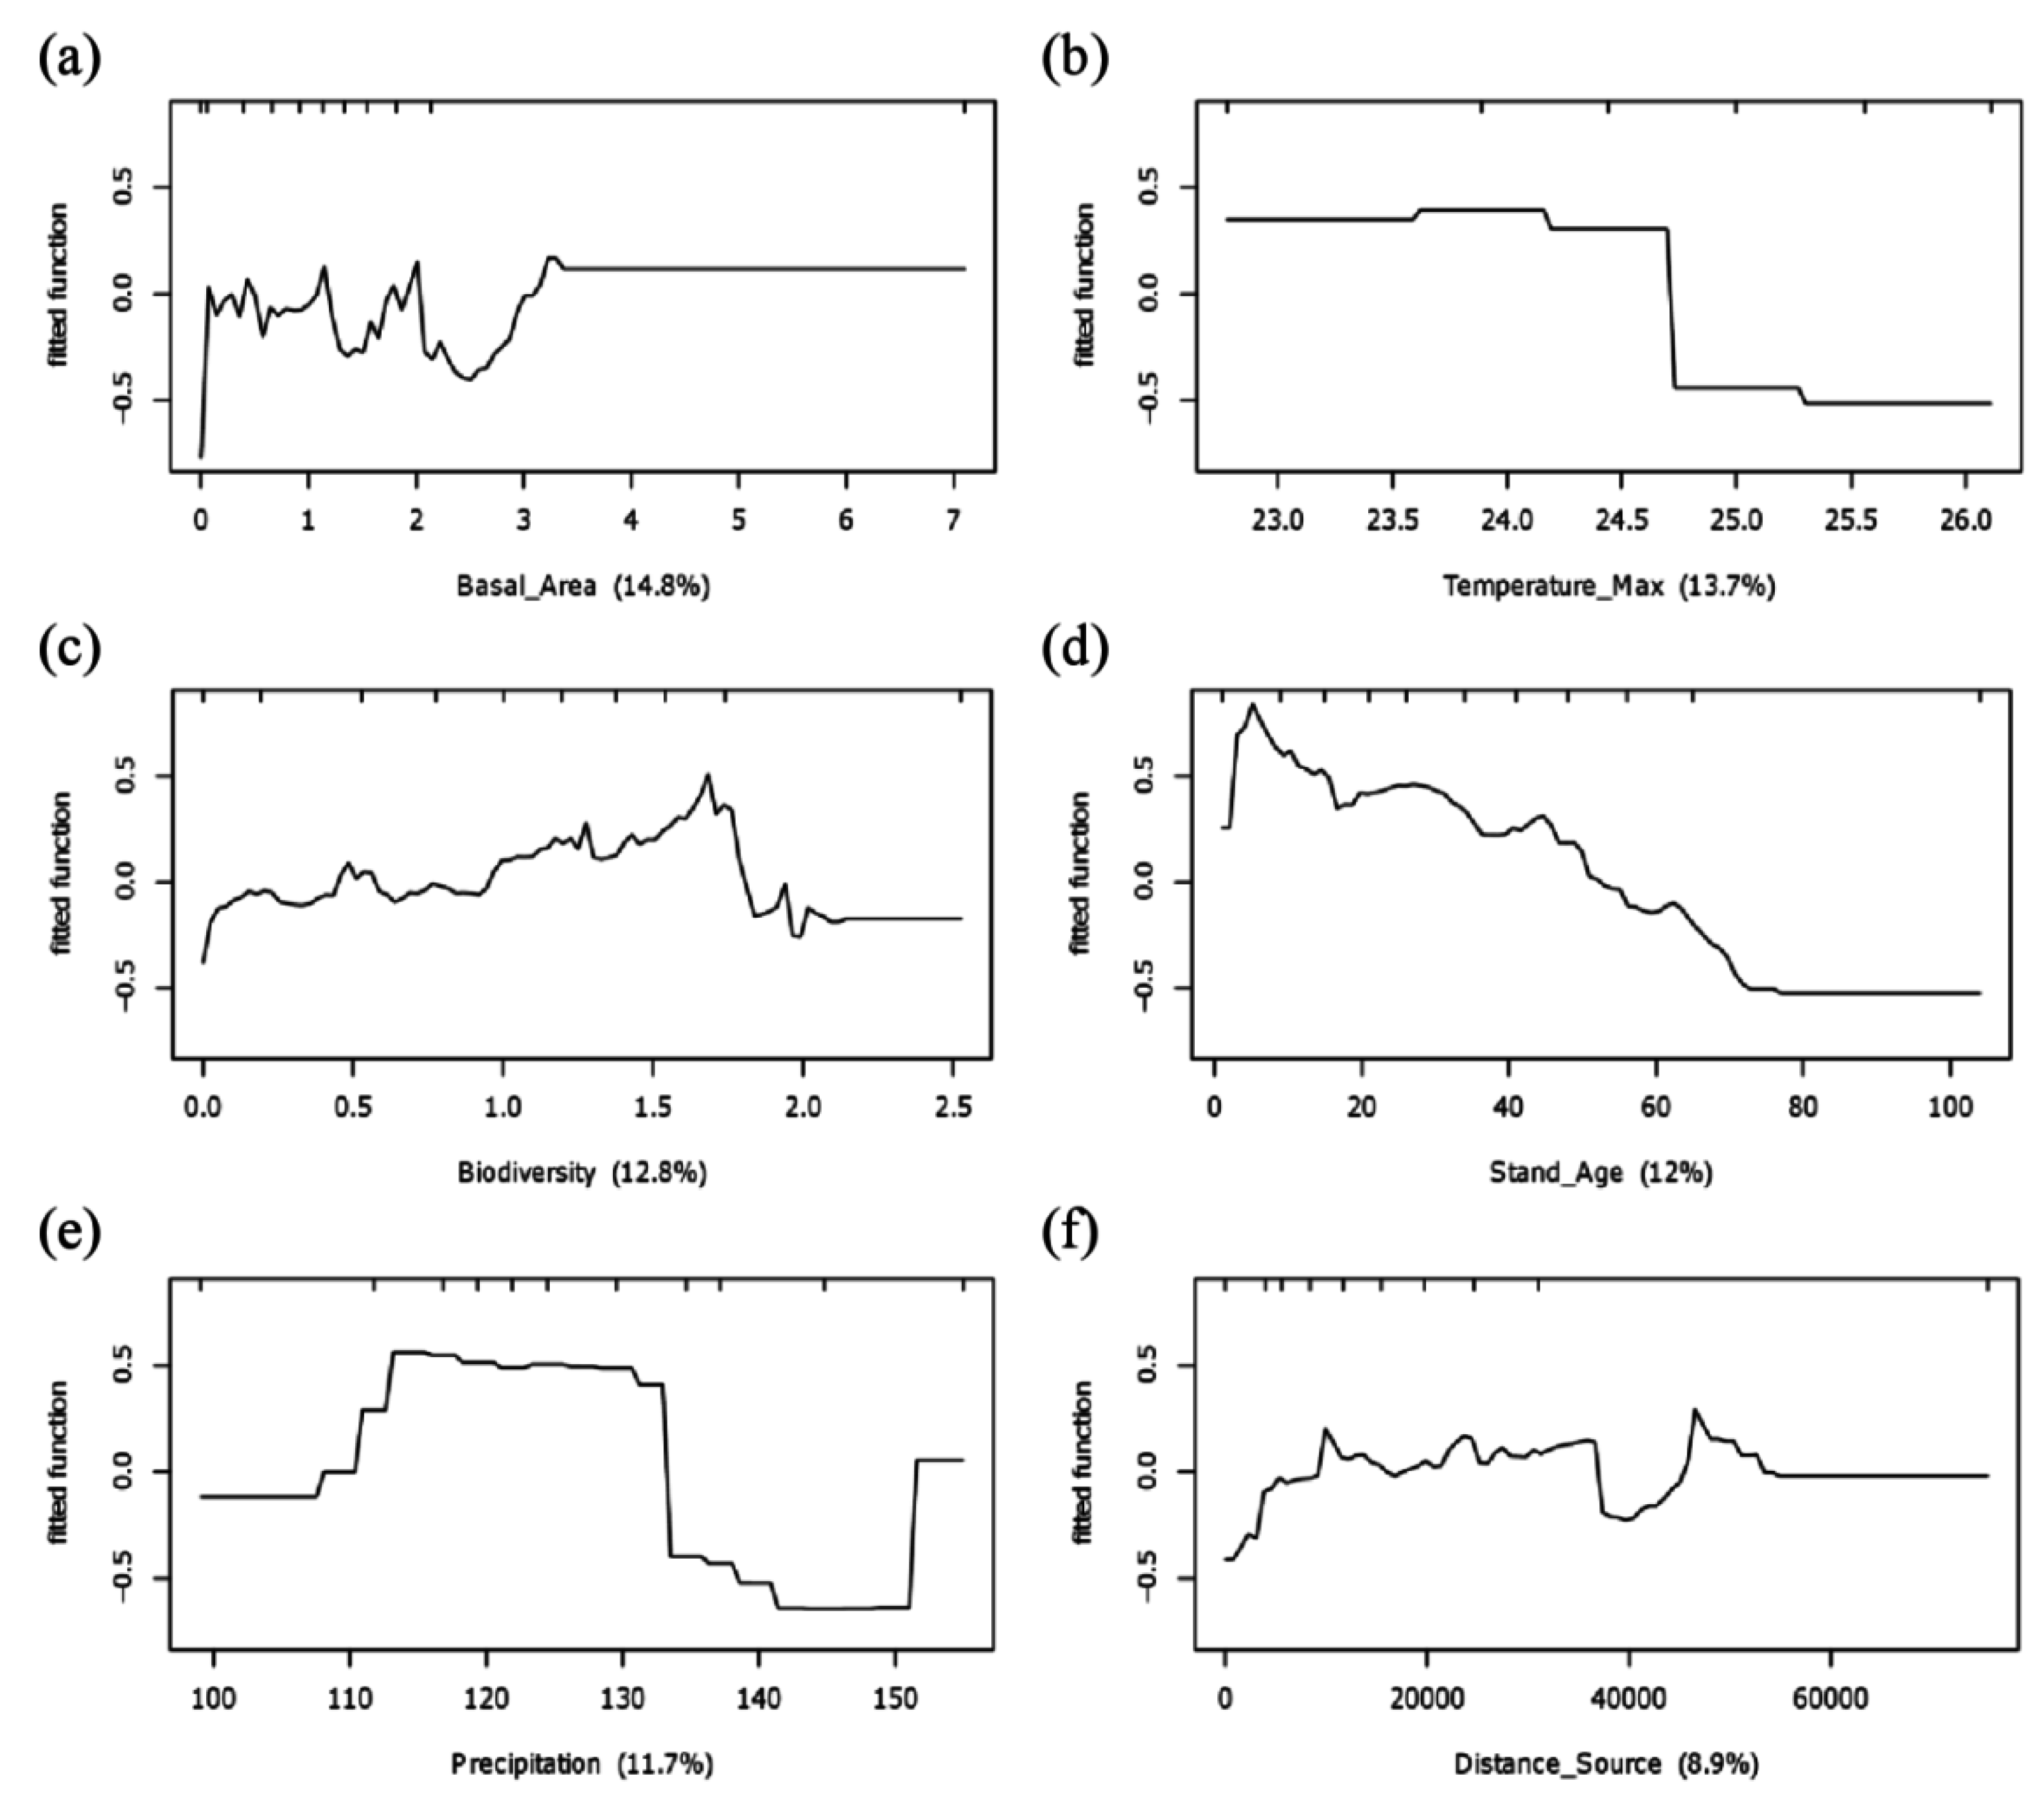
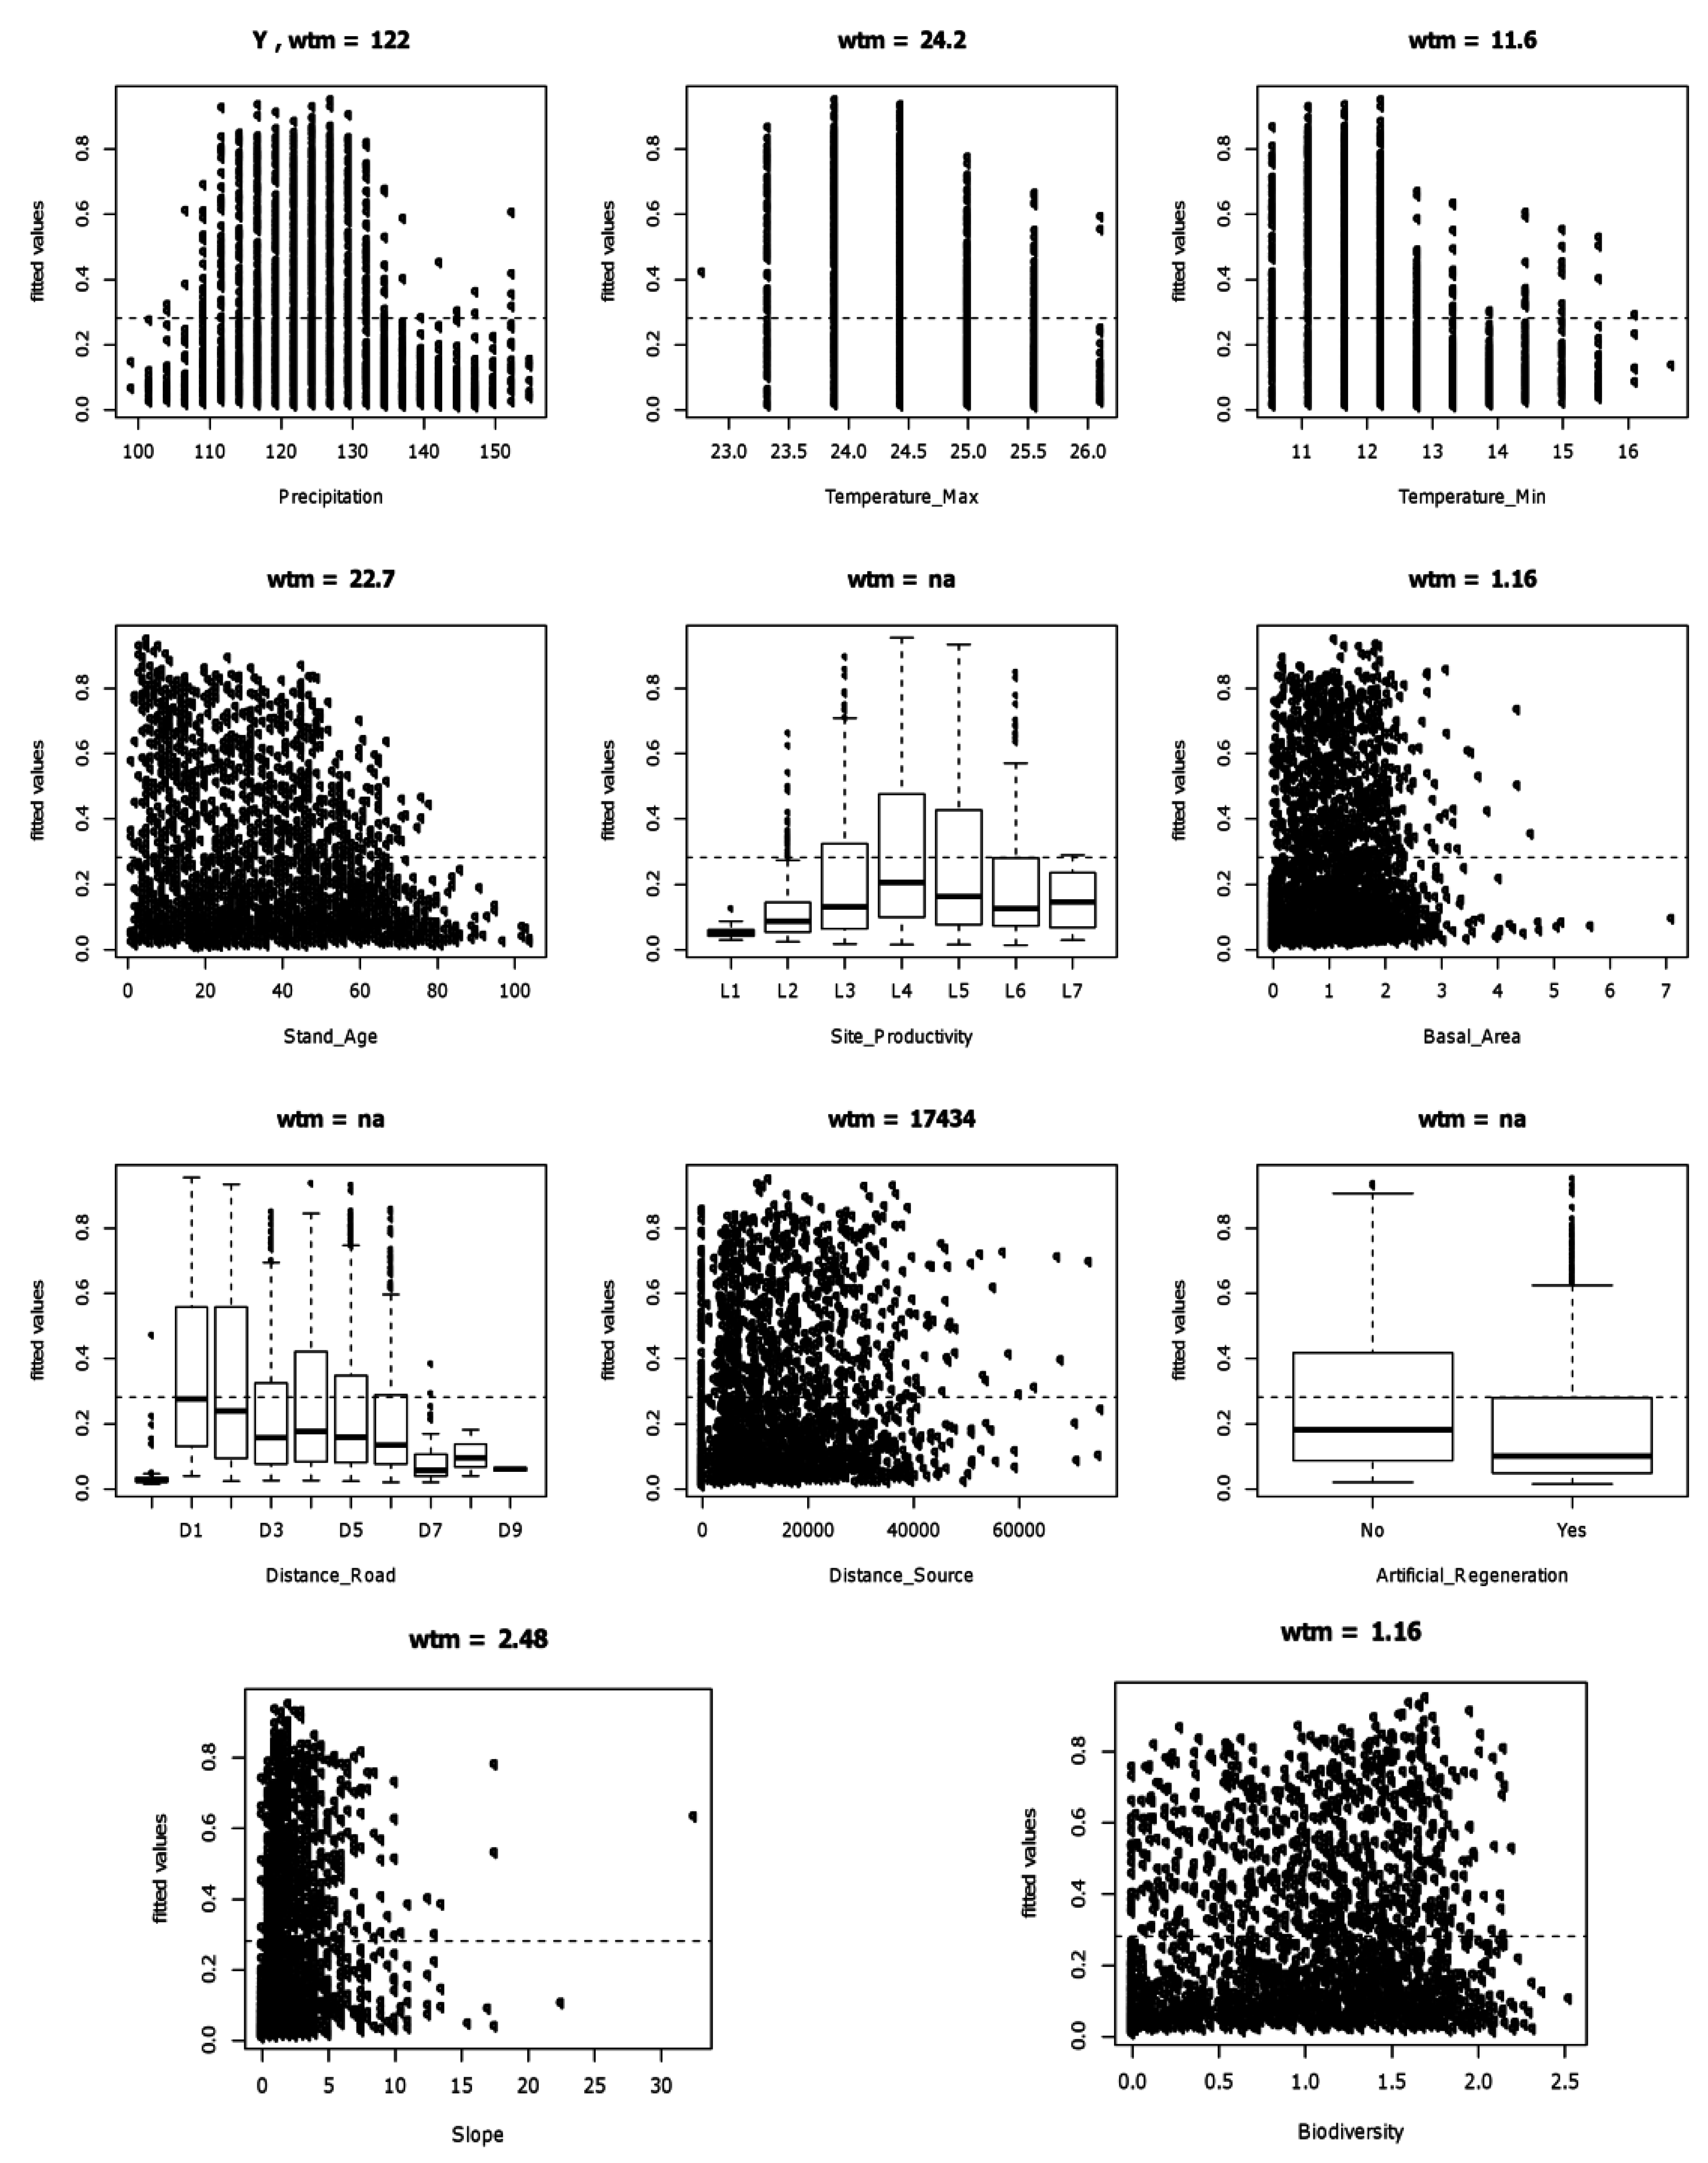
2.3. Identification of Potential Factors Influencing Likelihood of Invasion

Widely recognized factors influencing the likelihood of invasion of Japanese honeysuckle include landscape conditions, climatic conditions, forest features, disturbance factors, and forest management activities [26,31,32]. Landscape conditions include slope and adjacency to water bodies within 300 m. Climatic conditions include mean annual precipitation, and mean annual minimum and maximum temperature. Forest features include stand age, site productivity, basal area, and natural regeneration (growth of existing trees, natural seeding, or both, resulting in a stand at least 50% stocked with live trees of any size). Disturbance factors include distance between the plot and the nearest road, distances between the plot and the nearest known propagule source, and forest disturbance (such as those caused by animals, disease, fire, insects, and/or wind). Forest management activities such as harvesting, site preparation (including clearing, slash burning, chopping, disking, bedding, or other practices clearly intended to prepare a site for reforestation), and artificial regeneration (planting or direct seeding resulting in a stand in at least 50% stocking with trees of any size). Data on several factors in each of these broad categories are available from the traditional FIA dataset for plots within our study area (Table 1). Drawing on the literature on plant invasions, we selected a set of possible variables for plots within our study area from the PRISM database [33,34] and the FIA dataset (Table 1). We also used the same dataset to compute Shannon’s index of tree species diversity, Hs, for each plot [35,36]:
H s = i = 1 n s B i B ln ( B i B )
where B and Bi are the total stand basal area and the basal area of trees of species i, respectively, and ns is the number of tree species.
Table 1. Descriptions, possible values or units of measure, and means or counts of landscape conditions, forest features, disturbance factors, and forest management activities evaluated as potential factors of site invasion by Japanese honeysuckle in forest plots of eastern Texas.
VariableValue or Unit of MeasureMean (Range) for Continuous Data/Count for Categorical Data
Landscape conditions
SlopeDegree2.07 (0.00–32.50)
Adjacency to water bodies within 300 mNo1830
Yes471
Climate conditions
Mean annual precipitationcm127.06 (99.06–154.94)
Mean annual minimum temperature°C12.43 (10.56–16.67)
Mean annual maximum temperature°C24.89 (22.78–26.11)
Forest features
Stand ageYear35.76 (1–104)
Site productivityL1: 0–1.39 m3·ha−1·year−19
L2: 1.40–3.49154
L3: 3.50–5.94660
L4: 5.95–8.39931
L5: 8.40–11.54541
L6: 11.55–15.7495
L7: >15.744
Basal aream21.26 (0.00–7.10)
Species diversityShannon’s species diversity1.02 (0.00–2.53)
Natural regeneration aNo2348
Yes46
Disturbance factors
Distance to the nearest roadD1: <30 m169
D2: 30–91382
D3: 92–152273
D4: 153–305492
D5: 306–805674
D6: 806–1609239
D7: 1610–482862
D8: 4829–80473
D9: >80472
Distance to the nearest known propagule sourcem14,343 (0–75,529)
Forest disturbance a,bNo2294
Yes100
Forest management activities
Harvesting aNo1969
Yes425
Site preparation aNo2309
Yes85
Artificial regeneration aNo1802
Yes592
a Normally within the past five years; b A disturbance code of “yes” indicates that at least 25% of the trees in a stand are damaged by animals (from deer/ungulates, rabbits, or a combination of animals), disease, fire (from crown or ground fire, either prescribed or natural), insects, and/or wind (including, but not limited to, damages from hurricanes and tornados).

2.4. Data Analysis

We associated the data on presence or absence of Japanese honeysuckle (SNIPET) with the data on landscape conditions, forest features, disturbance factors, and forest management activities (FIA Data and Tools) using the FIA plot identification numbers. We then conducted our analysis with a process of machine learning that uses boosted regression trees, which combines decision trees and a boosting algorithm with a form of logistic regression [37]. For boosted regression trees, the probability (p) of species occurrence ( y = 1 ) at a location with the potential explanatory variables ( X ) is given by p ( y = 1 | X ) and is modeled via the logit: l o g i t   p ( y = 1 | X ) = f ( X ) . We fitted our model in R (R Development Core Team 2006 version 2.14.1, R Foundation for Statistical Computing, Vienna, Austria) using the gbm package version 1.5-7 [38]. Our aim was to find the best combination of parameters (learning rate and tree complexity) that achieved the minimum predictive error (minimum error for predictions of independent samples). The learning rate, also known as the shrinkage parameter, determines the contribution of each tree to the growing model, and the tree complexity controls whether interactions are fitted. We determined the optimal model following the recommendations of Elith et al. [37] by altering the learning rate and tree complexity (the number of split nodes in a tree) until the predictive deviance was minimized without over-fitting, and by limiting our choice of the final model to those that contained at least 1000 trees. We included randomness into the models to reduce over-fitting and also to improve accuracy and speed of the model selection process [39]. We represented randomness using a “bag fraction” that specifies the proportion of data to be selected at each step [37]. We set the default bag fraction at 0.6, meaning that 60% of the data were drawn at random without replacement from the full training set during each iteration. When we obtained the optimal model, we evaluated model performance using a ten-fold cross-validation procedure with re-substitution. For each cross-validation trial, we randomly selected 60% of the dataset for model fitting and we used the excluded 40% for testing. We then used plot Universal Transverse Mercator (UTM) coordinates, x for distance east and y for distance north of the UTM origin, to test for spatial autocorrelation of the residuals of the model, employing Moran’s I index. We calculated the response variance explained, the area under the receiver operator characteristic curve (AUC), and the overall accuracy based on the aggregated cross-validation results. We evaluated the reliability and validity of the optimal model as fair (0.50 < AUC ≤ 0.75), good (0.75 < AUC ≤ 0.92), very good (0.92 < AUC ≤ 0.97), or excellent (0.97 < AUC ≤ 1.00) based on the value of AUC [40]. We then used the gbm library to derive the relative influence of each potential explanatory variable in the optimal model and constructed partial dependence plots and fitted values plots for the most influential variables [37].

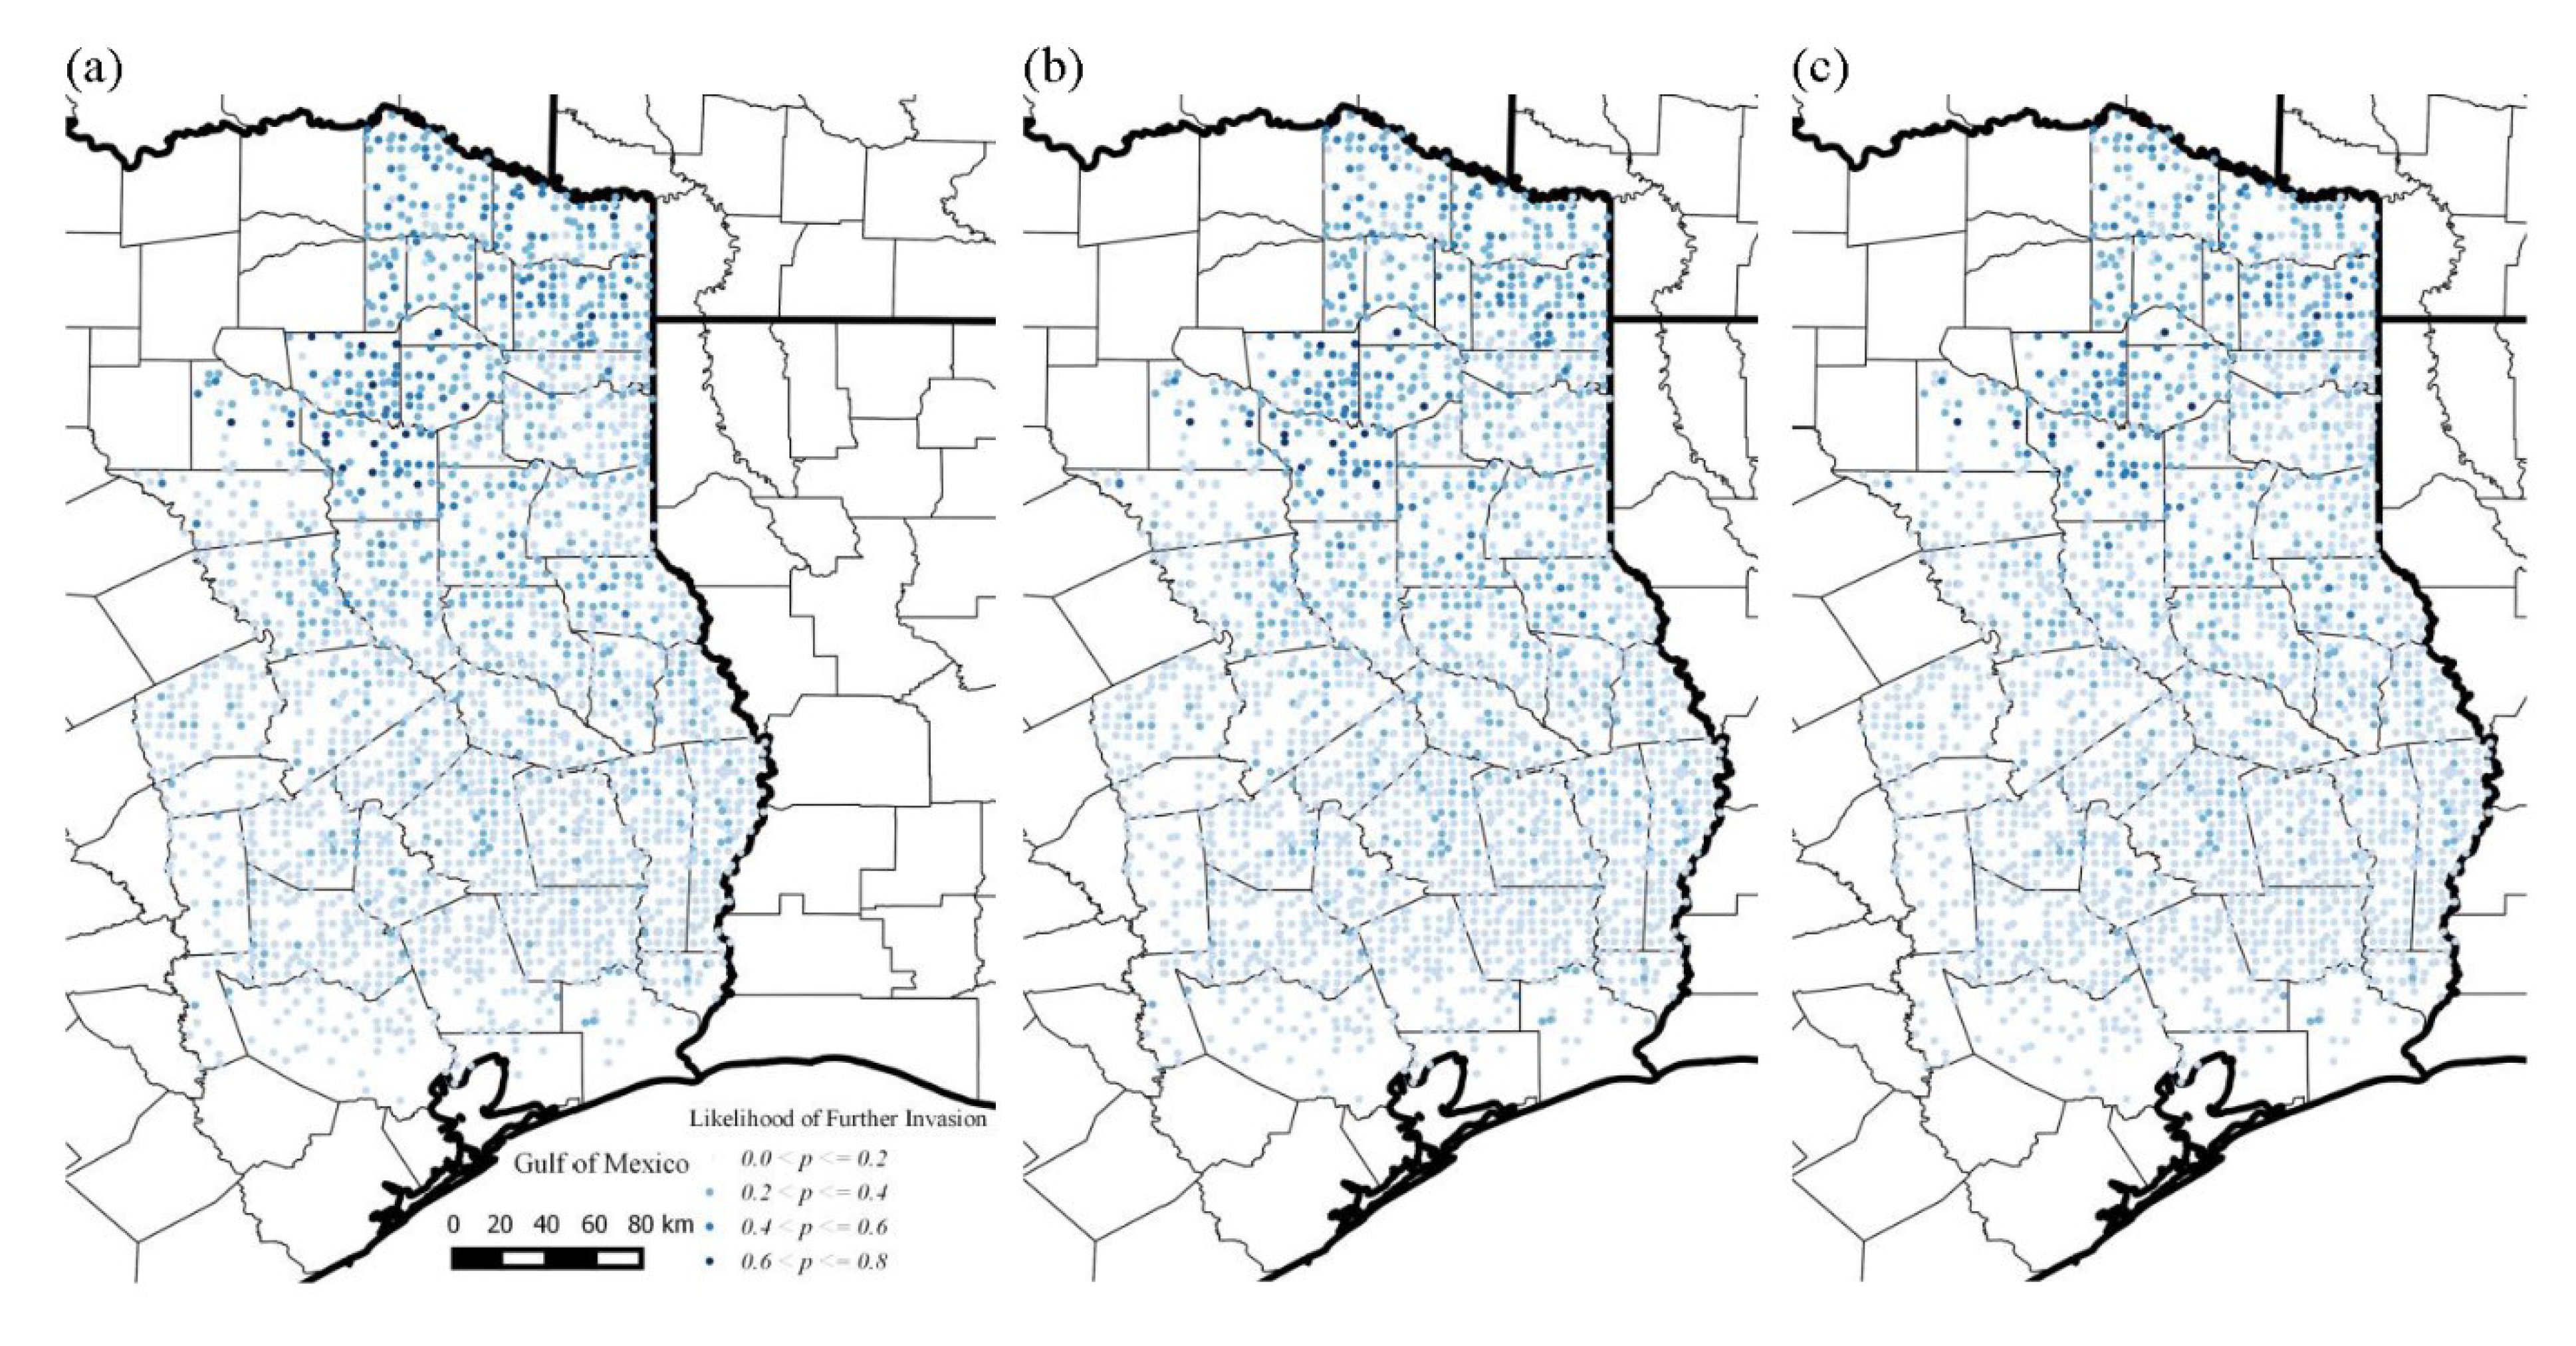
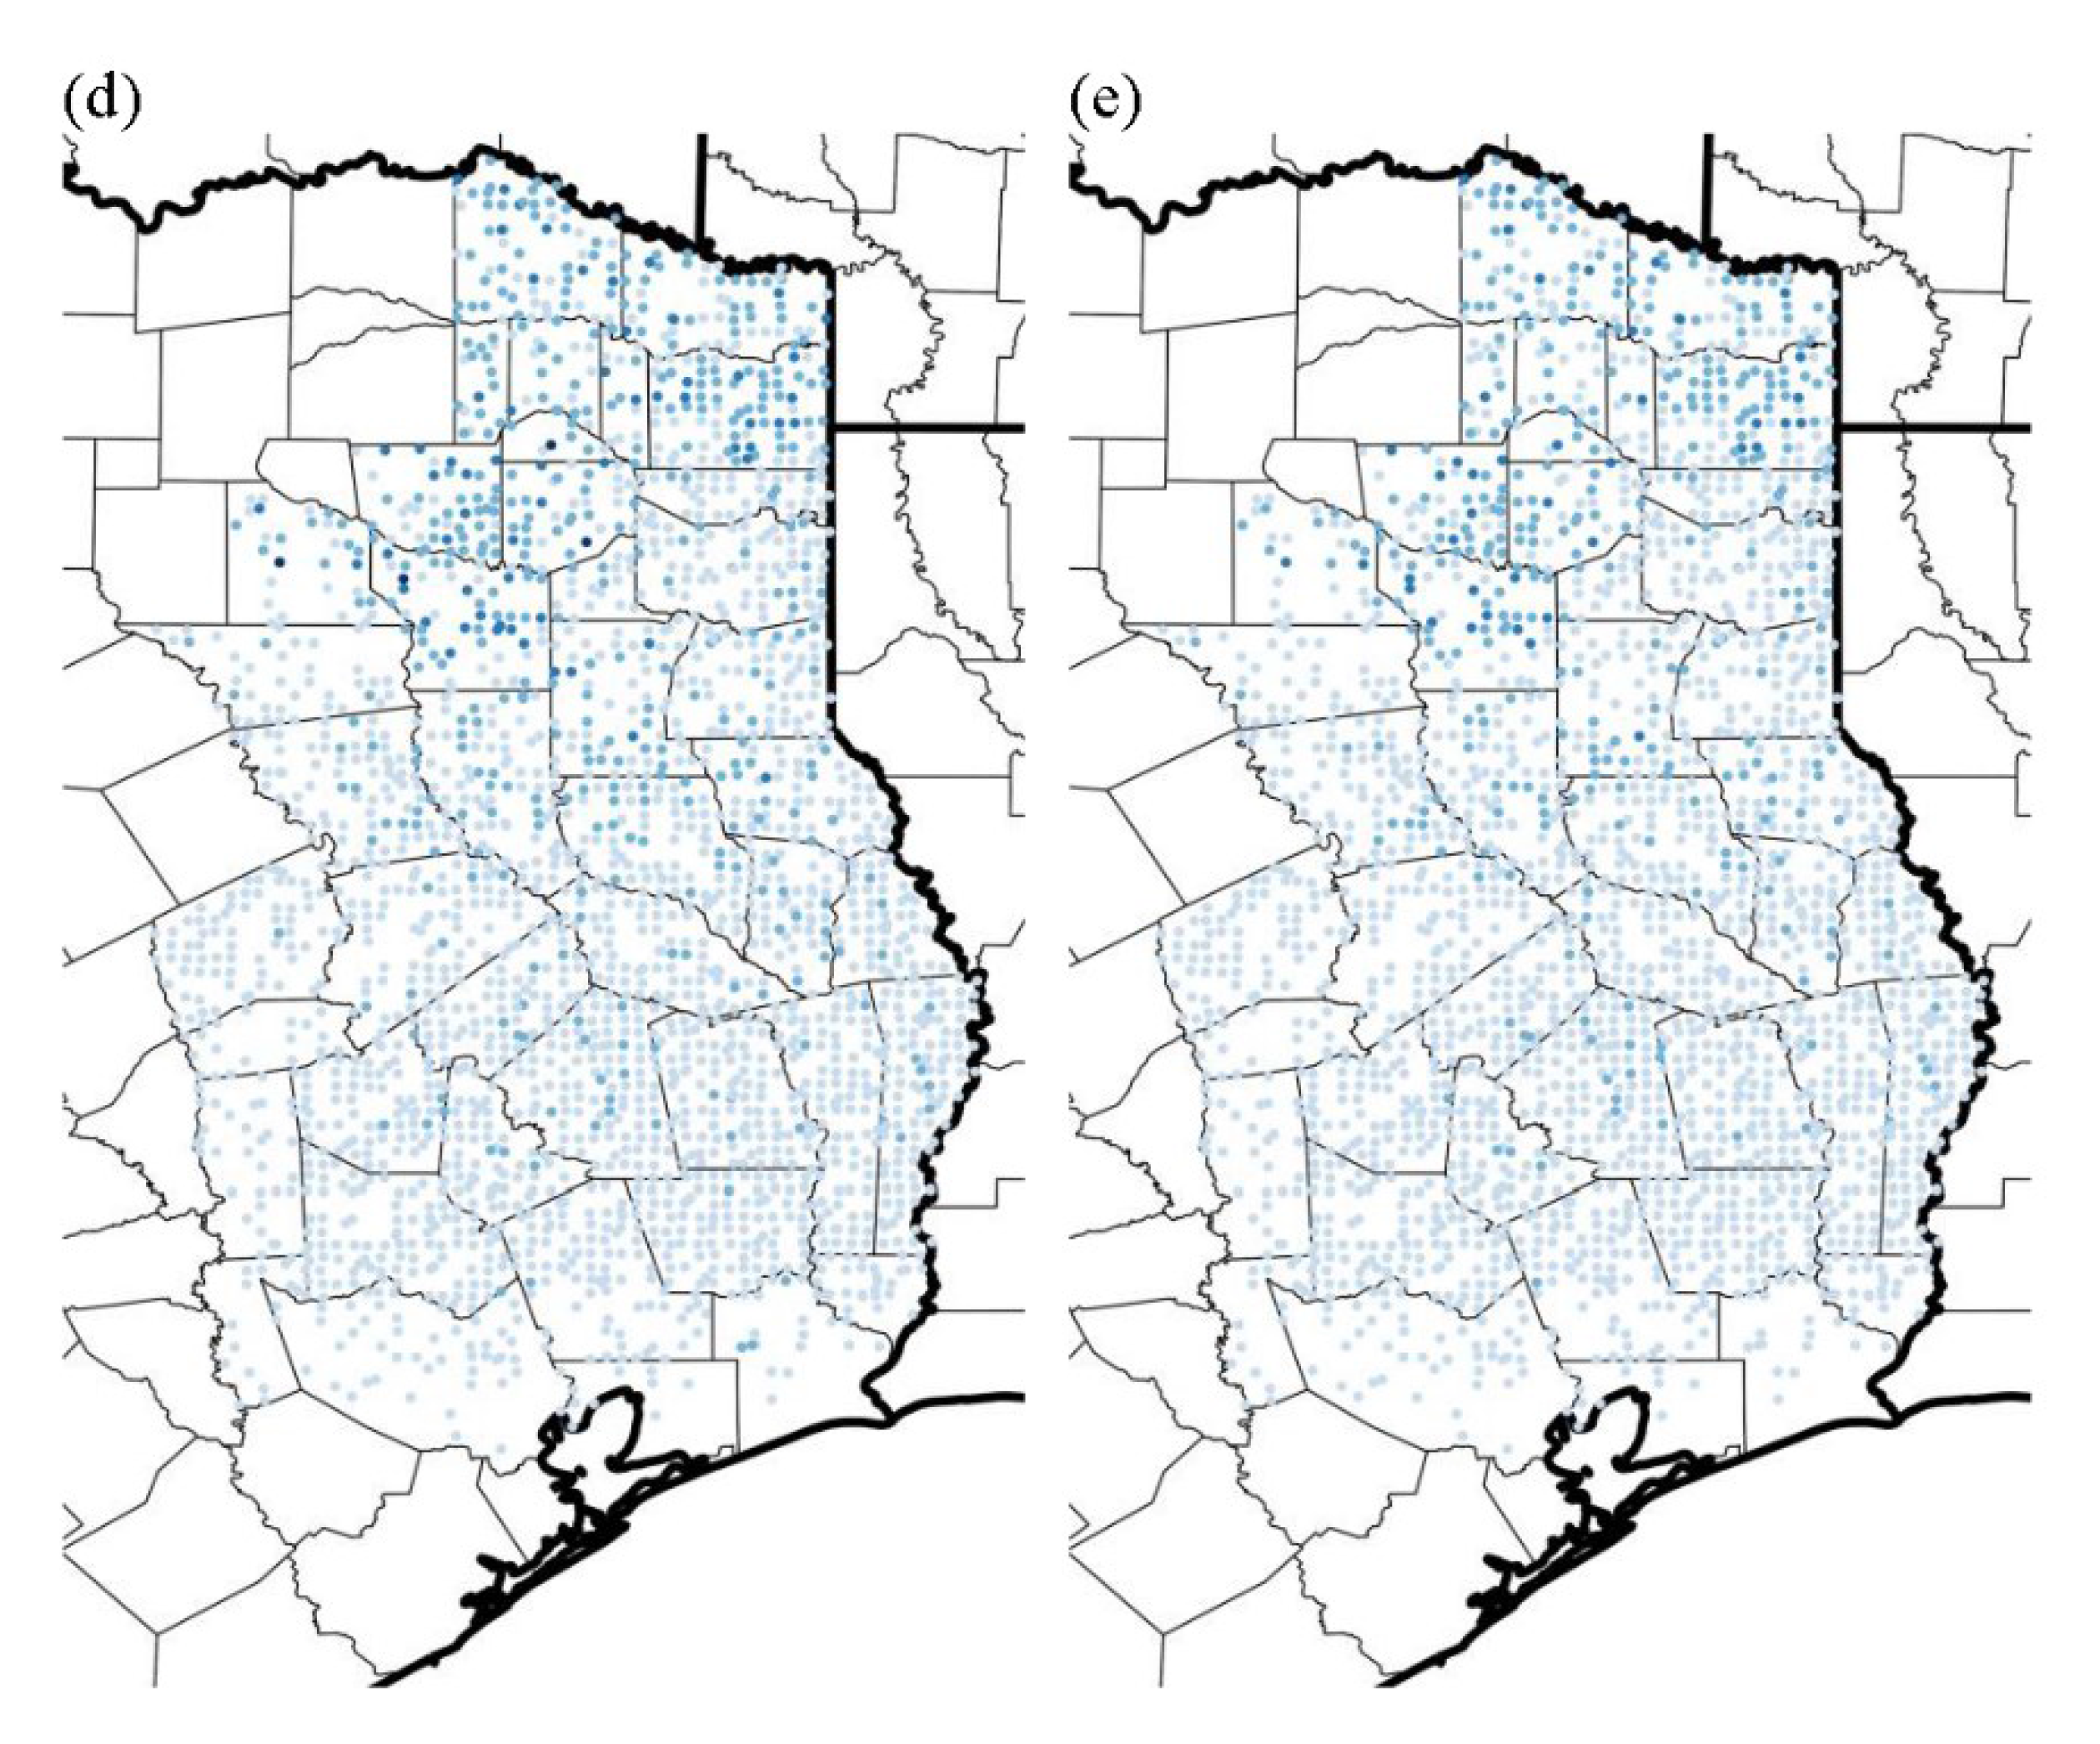
2.5. Likelihood of Invasion

We used the optimal model to calculate the probability of presence of Japanese honeysuckle on each of the study plots. We then re-estimated the probabilities of presence assuming that artificial regeneration occurred on 25%, 50%, 75%, or 100% of the plots. We represented these different levels of management activity by changing the value of the corresponding element of X (e.g., artificial regeneration) from “No” to “Yes.” To visually display the results, we superimposed the probabilities of presence predicted under each level of management activity on maps of the study area using ArcMapTM 10.2.1 (ESRI, Redlands, CA, USA).

3. Results

3.1. Historical Trends in Range Expansion

As indicated by the FIA records from 2011, Japanese honeysuckle spread extensively throughout eastern Texas during only a five-year period. The range expansion has been particularly dramatic in the northern part of the studied area, but the few, initially sparse, hot-spots in the south have also shown dynamism that seems to match that of the north (Figure 1). The presence of Japanese honeysuckle almost doubled from 352 plots (14.69%) in 2006 to 616 plots (25.7%) in 2011, and the number of counties invaded increased from 23 to 41, leaving only two counties un-invaded. The distance between each plot in which Japanese honeysuckle was first detected during the second survey and the nearest plot in which Japanese honeysuckle had been detected during the first survey ranged from 0 km to 75 km, with a mean (±SE) of 16 km (±0.5 km).
Figure 1. Presence (red dots) and absence (green dots) of Japanese honeysuckle in forested plots sampled in eastern Texas in (a) 2006 and (b) 2011 as part of the Forest Inventory and Analysis Program of the U.S. Forest Service [25].
Forests 06 04374 g001

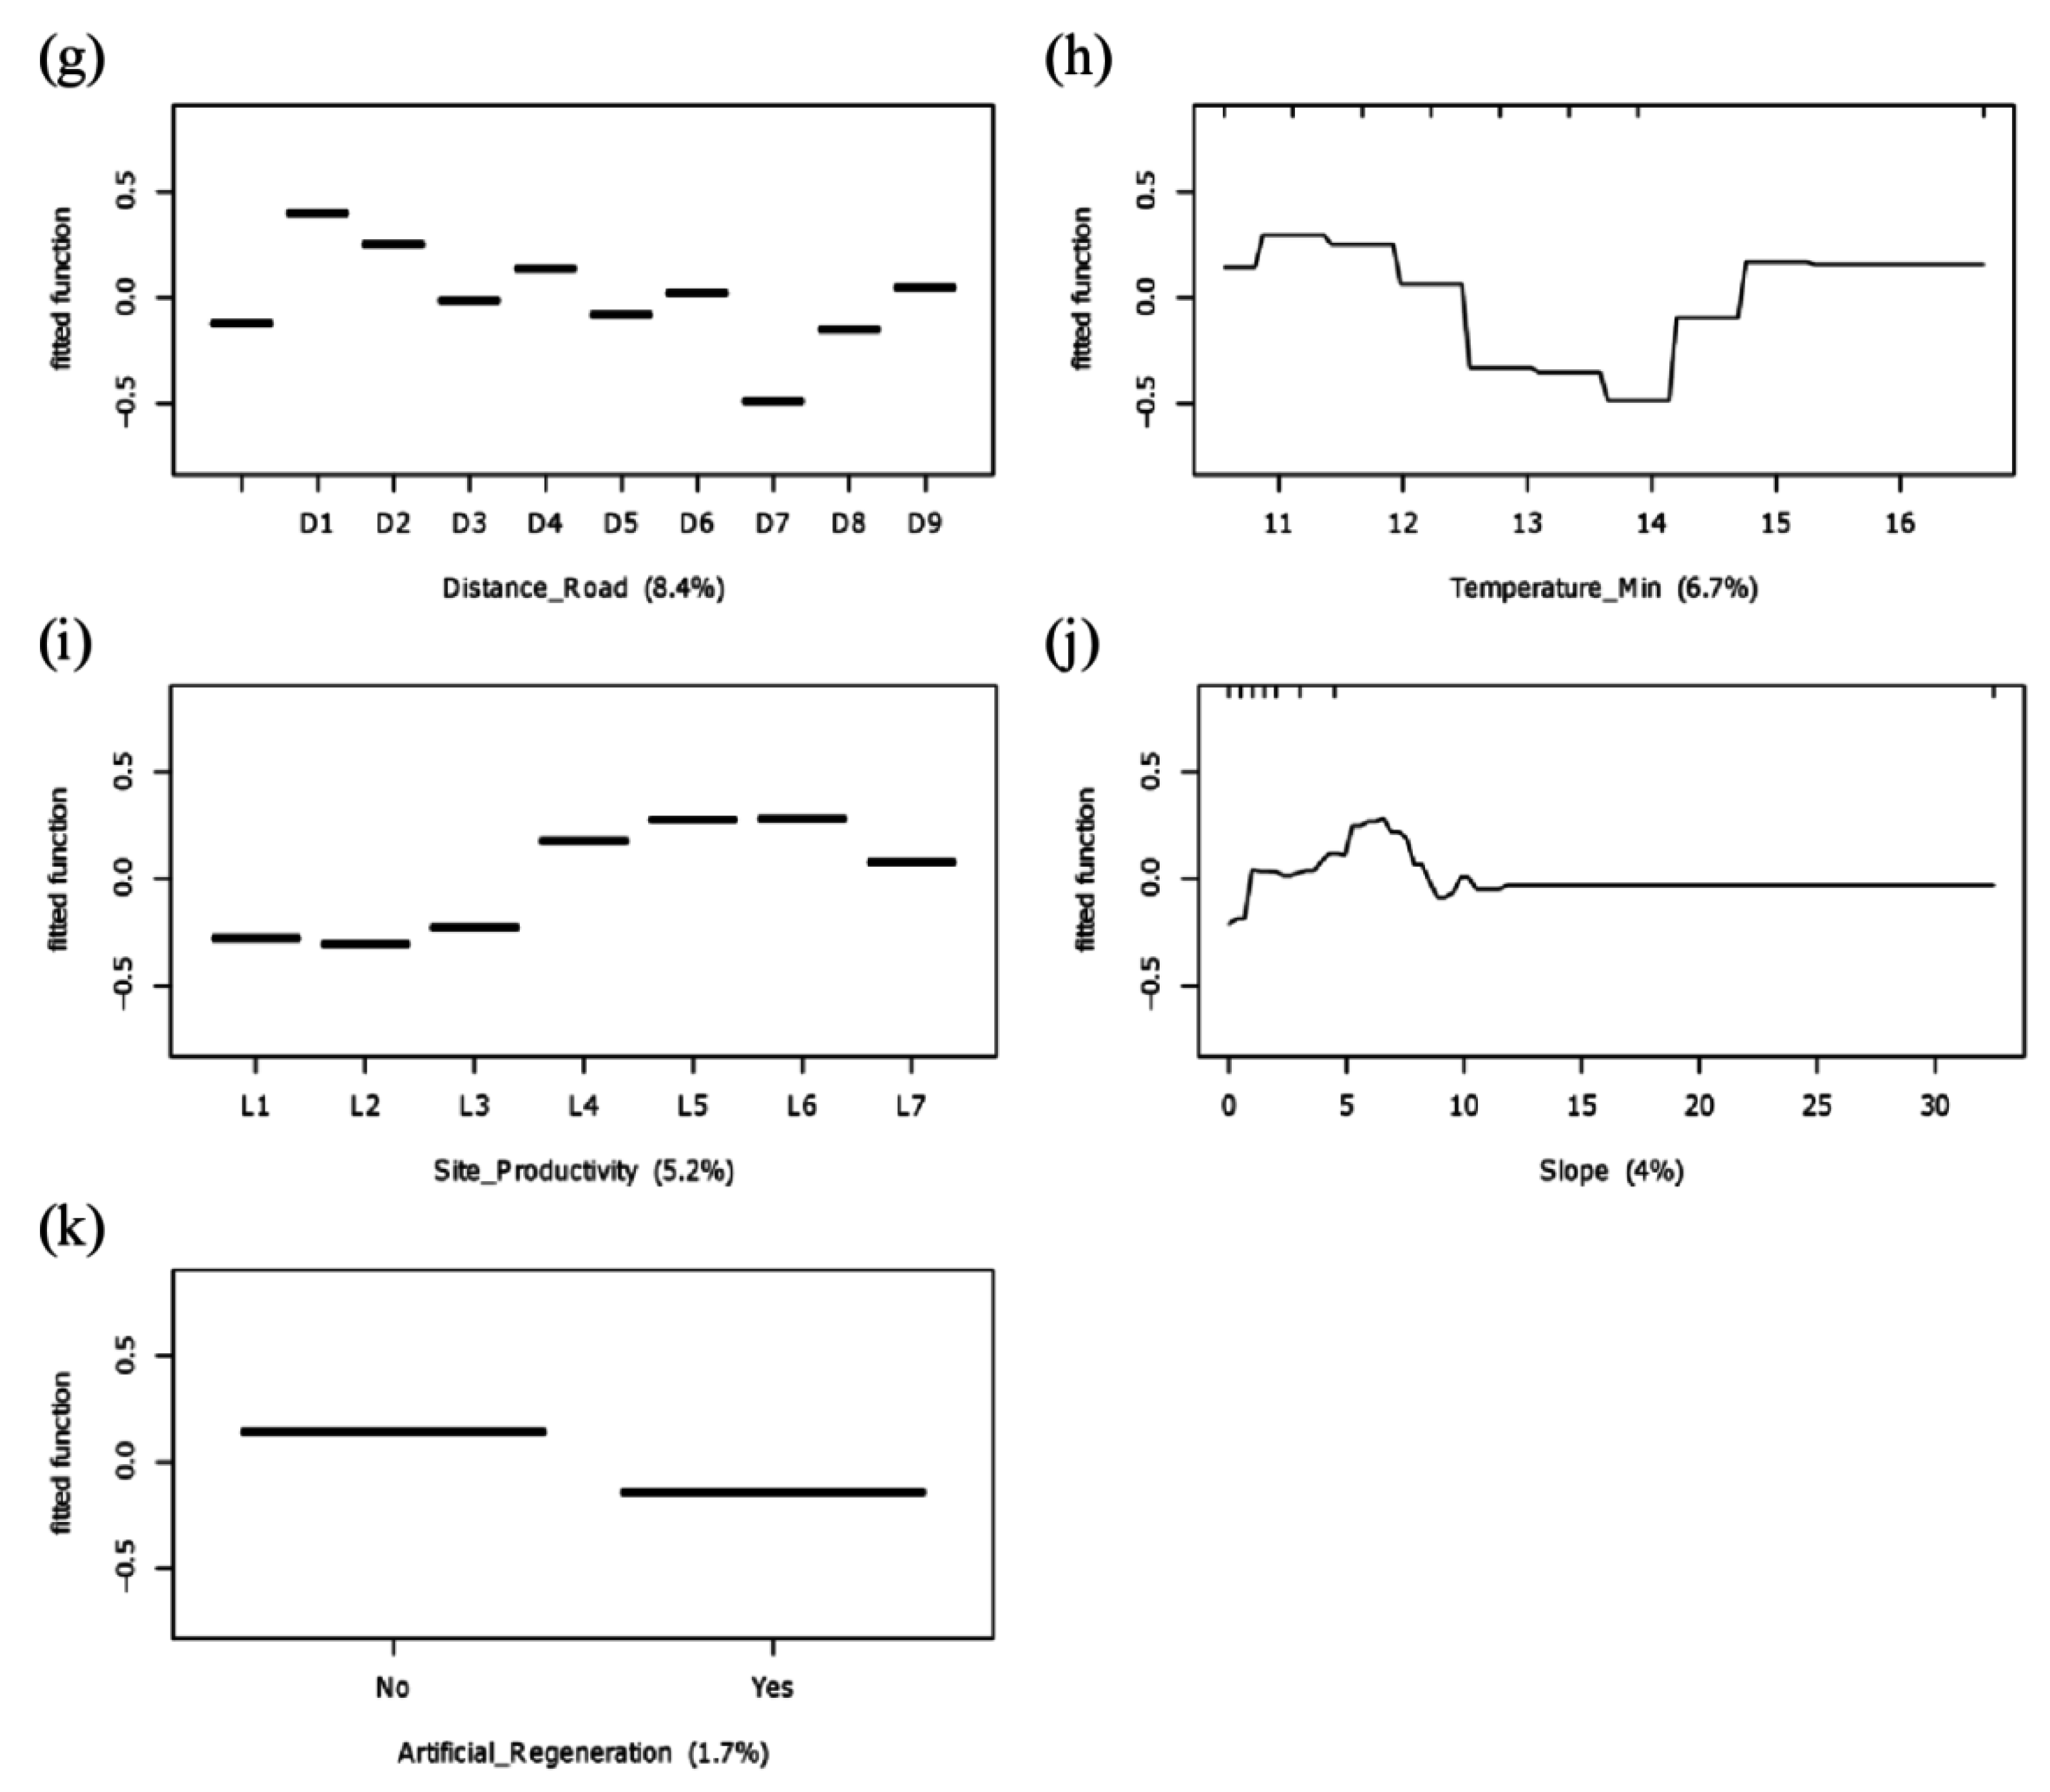
3.2. Potential Determinants of Invasion

We explored 250 combinations of tree complexity (ranging from three to seven) and learning rate (ranging from 0.001 to 0.05); these produced models with between 800 and 1400 trees. The optimal model had a tree complexity of five, a learning rate of 0.01, and a total of 1100 trees. Moran’s I index (I = 0.002) indicated no statistically significant (p = 0.17) spatial autocorrelation. Model predictive deviance was 0.894 ± 0.015 with 80.6% of the total response variance explained. The AUC score was 0.855 ± 0.008 (“good” ability to discriminate between species presence and absence) and the overall accuracy was 80.8%. Recursive feature elimination tests showed that five variables could be removed from the model before the resulting predictive deviance exceeded the initial predictive deviance of the model with all variables.
Examination of the relative contribution of the predictor variables indicated that the top five accounted for approximately 65% of the contribution in the overall model (Figure 2). Of the five most influential variables, three were forest features and two were climatic conditions. Basal area was the most influential variable, contributing 14.8%. Mean annual maximum temperature, biodiversity index (Shannon’s species diversity), stand age, and precipitation were the second, third, fourth, and fifth most important variables, contributing 13.7%, 12.8%, 12.0%, and 11.7%, respectively. Distances to the nearest known propagule source and distance to the nearest road were selected from disturbance factors. Landscape conditions, climatic conditions, forest features, disturbance factors, and forest management activities had total contributions of 4.0%, 32.1%, 44.8%, 17.3%, and 1.7%, respectively (Figure 2).
Figure 2. Partial dependence plots for the explanatory variables included in the optimal boosted regression tree models for Japanese honeysuckle based on analyses of the 11 most influential variables. Hash marks at the top of each plot indicate distribution of sample plots along the range of the indicated variable. X axis labels include the relative contributions (%) of each influential variable included in the final model (see Table 1 for the description of variables). Y axes are based on the logit scale used for the indicated variable.
Forests 06 04374 g002aForests 06 04374 g002b
Partial dependence plots indicated that Japanese honeysuckle occurrences were associated with plots with a slope ratio lower than 8% (Figure 2j). Climatic conditions included a mean annual maximum temperature below 24.7 °C (Figure 2b), an annual precipitation between 110 and 133 cm (Figure 2e), and a mean annual minimum temperature between 10.6 °C and 12.5 °C (Figure 2h). Forest features usually included a basal area less than 2 m2 (Figure 2a), a biodiversity index between 1.0 and 1.8 (Figure 2c), stand age younger than 50 years (Figure 2d), and site productivity higher than 5.95 m3·ha−1·year−1 (above L3, Figure 2i). Occurrences were more likely in plots with distances to the nearest known propagule less than 35,000 m (Figure 2f) and to the nearest road less than 91 m (below D3, Figure 2g), and with no artificial regeneration within the past five years (Figure 2k). In addition, the fitted values plots (Figure 3) indicated all fitted values in each factor type.
Figure 3. Fitted values plots for the explanatory variables included in the optimal boosted regression tree models for Japanese honeysuckle based on analyses of the 11 most influential variables. Values above each graph indicate the weighted mean of fitted values in relation to each non-factor explanatory variable.
Forests 06 04374 g003

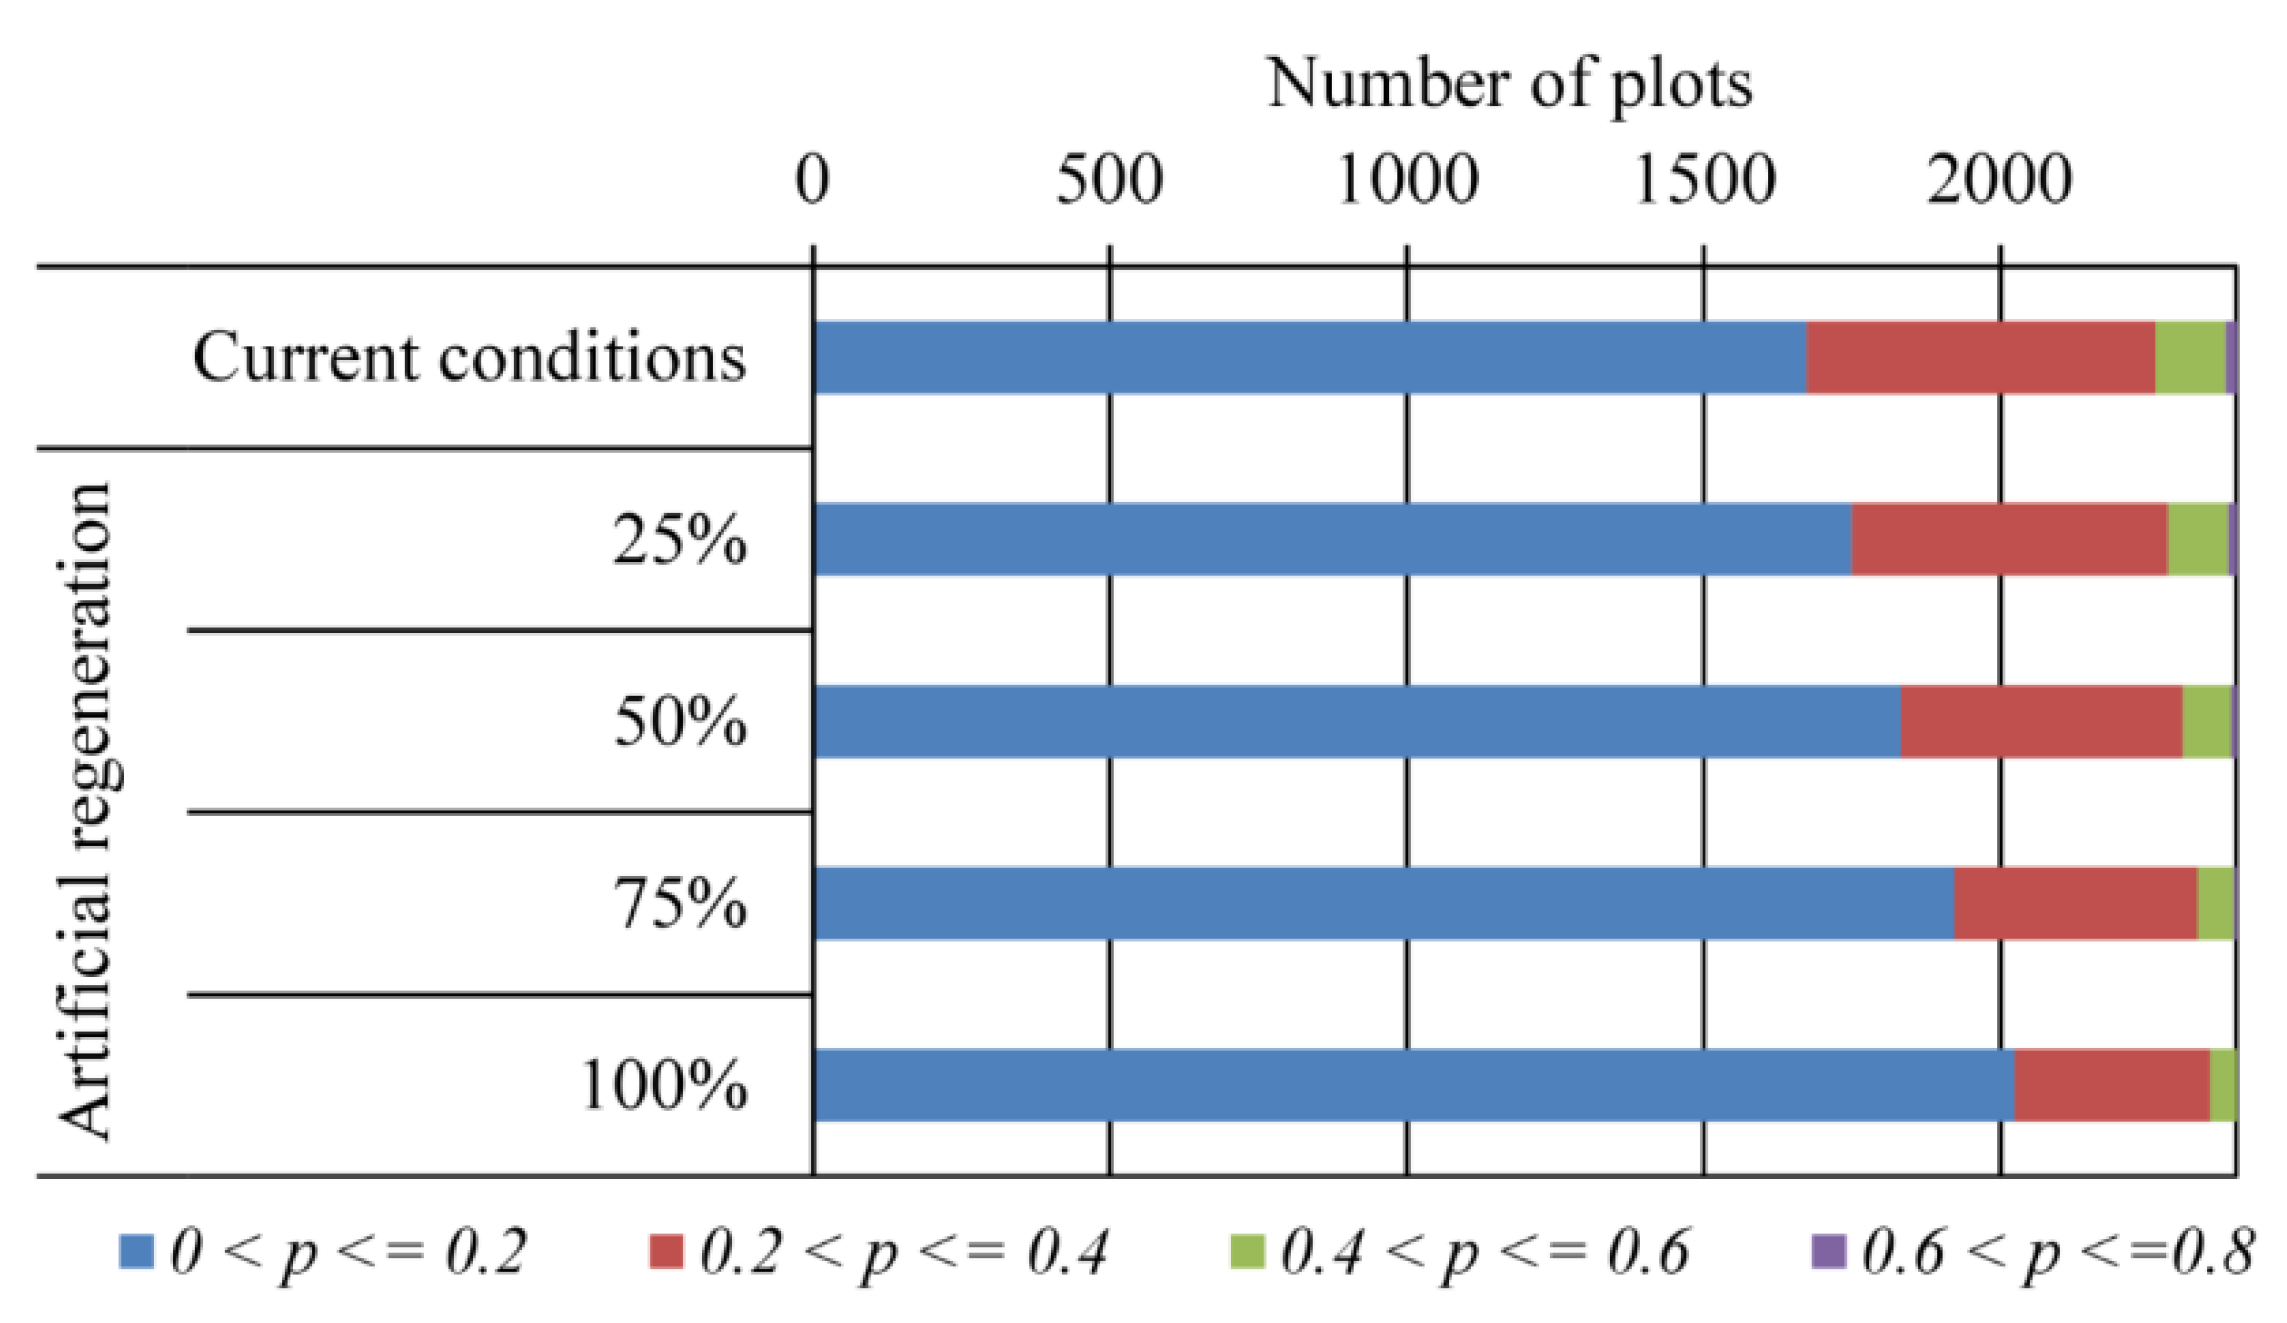
3.3. Likelihood of Invasion under Current Conditions and Different Levels of Management

Estimated probabilities (p) of invasion under current conditions indicated that approximately 70% of the plots fell within the 0 < p ≤ 0.2 category, 24% within the 0.2 < p ≤ 0.4 category, 5% within the 0.4 < p ≤ 0.6 category, and about 1% within the 0.6 < p ≤ 0.8 category (Figure 4). The majority of the relatively higher estimated probabilities (p > 0.4) were located in northeastern Texas (Figure 5a).
Figure 4. Number of plots within the indicated categories of estimated probability (p) of invasion (blue: 0 < p ≤ 0.2, red: 0.2 < p ≤ 0.4, green: 0.4 < p ≤ 0.6, purple: 0.6 < p ≤ 0.8) by Japanese honeysuckle assuming current conditions, and artificial regeneration on 25%, 50%, 75%, or 100% of the plots (chosen at random).
Forests 06 04374 g004
Increasing the level of artificial regeneration from zero to 100% in increments of 25% reduced estimated mean probabilities (p) of invasion from 0.17 to 0.16, 0.15, 0.13, and 0.12, respectively, and decreased the number of plots with p > 0.2 from 724 to 648, 564, 474, and 373, respectively, (Figure 4). Once again, the majority of the plots with relatively higher estimated probabilities (p > 0.2) were located in northeastern Texas (Figure 5b–e).
Figure 5. Estimated probabilities of invasion by Japanese honeysuckle in plots sampled in eastern Texas as part of the Forest Inventory and Analysis Program of the USDA Forest Service assuming (a) current conditions, (b) artificial regeneration on 25%, (c) 50%, (d) 75%, or (e) 100% of the plots (chosen at random).
Forests 06 04374 g005aForests 06 04374 g005b

4. Discussion

The number of sites invaded by Japanese honeysuckle almost doubled within only five years. Clearly, northern sites are far more frequently invaded than those in the south (Figure 1), and the species was identified in, what seems moderate, 25.7% of the sampled sites. However, for a better understanding of the species presence one should perhaps consider that in 2011 less than 5% of the forested counties in eastern Texas remained uninvaded. The species abundance throughout the region seems uneven, but given its ability to spread rapidly, as evidenced by comparison of 2006 vs. 2011 presence-absence records, and its current distribution, there is potential for further invasion into other currently uninvaded sites. The change in spatial patterns, as shown by our results, agrees with the earlier work by Wang et al. [26] who estimated probabilities of invasion of Japanese honeysuckle throughout the Southern US forestlands based primarily on analysis of data collected during the FIA inventory period that ended in 2006. In particular, they identified areas vulnerable to invasion in eastern Texas, with northeastern sites showing higher probability of invasion. Our index of potential rate of spread, assuming a mean interval of five years between samples on any given plot, suggests a mean potential dispersal velocity of 3200 m/year (16 km/5 years), which is faster than the rates used in the models of Morales and Carlo [41] and Clark et al. [42]. Morales and Carlo [41] used a spatially-explicit simulation model to estimate a dispersal velocity of approximately 800 m per year for plants dispersed by frugivores. Clark et al. [42] used a stochastic model based on information from a variety of sources to estimate a range of annual velocities of seed dispersal by birds: 90% of the seeds were dispersed 0–100 m from the parent tree, 8% were dispersed 100–500 m, 1.7% were dispersed 500–5000 m and 0.3% were >5000 m. Our index was almost surely biased by exclusion of propagule sources in relatively close, un-sampled areas; the FIA field data were collected from a lattice of 4047-m2 hexagons, with only one sample plot located randomly within each hexagon [29]. On the other hand, given that seeds of Japanese honeysuckle are dispersed by wide-ranging animals, such as white-tailed deer, a relatively high dispersal velocity is not surprising.
While several factors affect a site’s susceptibility to Japanese honeysuckle invasion, forest features and climate conditions seem to play predominant roles. The majority of the species occurrences have been noted on sites with very low basal area, although the exact impact of basal area is somewhat ambiguous considering the interlacing positive and negative effects upon the fitted function along the variable’s distribution. A clear and consistent effect, however, may be observed in the case of other major contributors from the forest features group of variables. In particular, the youngest stands are most invasion-prone, and the susceptibility gradually decreases with age. High site productivity appears to favor invasions, as well. Logically, relatively young and highly-productive sites provide favorable conditions for any species, native and invasive ones alike [43]. The main factor identified as a limitation to mature forest stand invasions by Japanese honeysuckle was limited light availability, even though the species can tolerate a relatively low light environment [44,45]. Relatively open habitats facilitate early age flowering and prolific seed production. Halls [46] showed that Japanese honeysuckle in eastern Texas reproduced fruit at three years of age when plants were grown in the open, but at age five when grown in the shade. In addition, signs of stress developed after two years of growth under 8% of ambient light [47]. Even though new growth was initiated each spring, leaders would subsequently die back and a portion of the current leaf crop would abscise following maturation of the flush [47].
Japanese honeysuckle invasions were more abundant on sites with medium-high biodiversity index values. Although it seems counterintuitive that a new species would successfully establish itself in a diverse and likely balanced community (a classic view by Elton; [48]), post-invasion dynamics within this community as well as fate of the invader remain unknown. Debate is ongoing with arguments and evidence both supporting and opposing the classic perspective, however [48,49,50,51]. This disagreement also was noted between theoretical analyses and field studies (reviewed in [52]). In a recent case study, Wang and Grant [53] noted that sites with dominant loblolly pine overstory were less diverse than mixed evergreen-deciduous and mostly-deciduous stands. They suggested that the evergreen canopy was the likely factor diminishing risk of encroachment by invasive shrubs due to the decreased amount of light reaching the understory. On the contrary, the mixed canopy partially opens up from fall to early spring allowing for more light to reach the understory during that period. Indeed, the interspecies feedback loops [54,55] that characterize ecological communities challenge us to focus on the processes by which resident species affect the availability of physical resources, such as light, with which the likelihood of species invasions often are correlated.
Apart from favorable forest features, climate conditions of eastern Texas forest stands also appear to facilitate Japanese honeysuckle invasions. Leatherman [15] reported that Japanese honeysuckle in Eastern North America expands generally south of an isotherm where mean January temperature is −1 °C, north of an isotherm where only 5% of January daily low temperatures are <0 °C, and east of a mean annual precipitation of 1016 mm. Although Japanese honeysuckle may tolerate cool winter temperatures and regrow vigorously the following summer, late spring frosts that damage new growth and short growing seasons limit the northern distribution [13,56]. Sasek and Strain [57] suggested that projected future climate change may allow Japanese honeysuckle to expand its northern range; however, its southern distribution may be limited by mild winter temperatures that are insufficient for seed stratification. Our simulated intensity of invasion generally decreased with increasing mean annual temperature and decreasing annual precipitation.
Among the investigated disturbance factors, proximities of the nearest known propagule source and road were significantly correlated with the distribution of Japanese honeysuckle. Propagule pressure has been shown to affect the distribution and abundance of many invasive plants [58,59] and, like many other invasive plants, recruitment limitation tends to slow the range expansion of Japanese honeysuckle [60,61]. These results support the concept that invasions are best mitigated during the early stages of recruitment and establishment [62,63] or via control of outlier populations [64]. The control of biological invasions has become a topic discussed at the highest scientific, policy and management levels [65]. While long-term invasive plant management strategies are recognized as essential to reduce the ecological damage and economic costs associated with invasions, the development and implementation of such plans lags considerably behind [66]. Most of invasive plant management strategies, including that of Japanese honeysuckle, have emphasized controlling highly infested areas, despite this knowledge.
Roads have been shown as invasion corridors that facilitate the spread of invasive plants [67,68]. This is especially likely for an invasive vine such as Japanese honeysuckle, capable of plastic responses to heterogeneous habitat and thus of rapid growth in light gaps such as road-sides [69]. If there are no structures available for twining, Japanese honeysuckle can grow in a mat form along the ground, increasing the likelihood that roads could act as corridors for, rather than barriers to, spread. Spread of the species along roads may be additionally augmented by seed dispersal, also across the road, by wildlife. Japanese honeysuckle has been recognized as an important browse and forage species, especially for white-tailed deer, but also for other wildlife [70,71,72] throughout much of the eastern and southern United States, particularly during poor mast years and during winter when other food sources are scarce or inaccessible [73,74]. For example, in areas of northern Alabama managed primarily for loblolly pine production, Japanese honeysuckle constituted 49.4% of the year-round diet of white-tailed deer, whereas no other single food item accounted for more than 6% [75]. White-tailed deer can move over large distances [76,77,78] and have been observed utilizing roadways [79,80] and, thus, may be important vectors of Japanese honeysuckle seed dispersal.
The roles of other studied factors, namely landscape conditions and forest management activities, were rather minor. About 75% of the plots in eastern Texas currently occupied by Japanese honeysuckle occur at the northern part of the area, and about 98% occur on lands with a slope ratio less than 8%, where favorable habitats are created on well-drained sites [81]. In general, the species is noticeably absent on coarse sands and poor peat soils [82]. Extensive areas of poorly drained soils have also been linked with the absence of Japanese honeysuckle in southern Florida [15].
Anthropogenic effects on Japanese honeysuckle distribution are multifaceted. However, while roadways may facilitate the spread of the invader, artificial forest regeneration, one of the management practices we considered in this work, was shown effective in reducing the likelihood of Japanese honeysuckle invasions. A positive outcome of artificial regeneration, which generally involves some effort to control woody competition prior to planting, is that these types of sites are at least temporarily less susceptible to Japanese honeysuckle invasion. Approaches like herbicide application, mechanical treatment, or burning, aim to reduce interspecific competition and allow for successful establishment of the newly planted seedlings. However, as a side effect, this step may also reduce biodiversity on artificially regenerated sites in general (mean Hs = 0.69 vs. Hs = 1.06 on sites with and without history of artificial regeneration, respectively). The majority of the industrial plantations are located in southeastern Texas and, consequently, artificial regeneration is more common in this part of the state, with about 30% of the sites being classified in this category, as compared to about 21% of the sites in northeastern Texas, a region with less frequent human intervention and more favorable soil types.
We estimated invasion likelihood by applying boosted regression trees to data on landscape features, climatic conditions, forest conditions, disturbance factors, and forest management activities collected over a five-year period. Two valid criticisms of our approach are that our estimates of invasion likelihood are unique to our method of analysis [83] and to our specification of the variables included in that analysis [84]. These criticisms are generic problems related to structural uncertainty in the mathematical representation of natural systems [85]. We identified most of our potential independent variables following a recent study focused on the invasion of Japanese honeysuckle in forestlands of the southern United States [27]; however, we did not use exactly the same set of independent variables and we used a different modeling approach. The possibility remains that there might be a more powerful model [83] and/or a more useful set of explanatory variables [66]. Evaluation of the relative merits of the different methodological approaches to geographical distribution modeling currently is a topic of much debate [83,86,87], but is beyond the scope of the present study.
In conclusion, our analyses suggest that the range of Japanese honeysuckle in forestlands of eastern Texas is expanding. Even though providing reliable predictions of habitats that are most at risk, distribution limits, and efficacy of management strategies for any invasive species remain a challenge, our model showed the positive impact of selected management practices upon reducing the likelihood of invasion. Our model may also guide forest managers in development of long term monitoring and control strategies for Japanese honeysuckle by facilitating detection and eradication of newly established invasions in eastern Texas.

Acknowledgments

The study was supported by the Undergraduate Research Fund of the Department of Wildlife and Fisheries Sciences, Texas A&M University and The Pine Integrated Network: Education, Mitigation, and Adaptation Project (PINEMAP), a Coordinated Agricultural Project funded by the USDA National Institute of Food and Agriculture, Award #2011-68002-30185. We also thank three anonymous reviewers for their time and effort. The manuscript is greatly improved as a result of their comments.

Author Contributions

This study was designed by Hsiao-Hsuan Wang. Erin K. McGrew organized the data. Tomasz E. Koralewski computed indexes. Hsiao-Hsuan Wang conducted statistical analyses. Hsiao-Hsuan Wang, Tomasz E. Koralewski, William E. Grant and Thomas D. Byram led the writing.

Conflicts of Interest

The authors declare no conflict of interest.

References

  1. Moser, W.K.; Barnard, E.L.; Billings, R.F.; Crocker, S.J.; Dix, M.E.; Gray, A.N.; Ice, G.G.; Kim, M.-S.; Reid, R.; Rodman, S.U.; et al. Impacts of nonnative invasive species on US forests and recommendations for policy and management. J. For. 2009, 107, 320–327. [Google Scholar]
  2. Pejchar, L.; Mooney, H.A. Invasive species, ecosystem services and human well-being. Trends Ecol. Evol. 2009, 24, 497–504. [Google Scholar] [CrossRef] [PubMed]
  3. Pimentel, D.; Zuniga, R.; Morrison, D. Update on the environmental and economic costs associated with alien-invasive species in the United States. Ecol. Econ. 2005, 52, 273–288. [Google Scholar] [CrossRef]
  4. Wilcove, D.S.; Rothstein, D.; Jason, D.; Phillips, A.; Losos, E. Quantifying threats to imperiled species in the United States. BioScience 1998, 48, 607–615. [Google Scholar] [CrossRef]
  5. Gurevitch, J.; Padilla, D.K. Are invasive species a major cause of extinctions? Trends Ecol. Evol. 2004, 19, 470–474. [Google Scholar] [CrossRef] [PubMed]
  6. Wang, H.-H.; Grant, W.E.; Gan, J.; Rogers, W.E.; Swannack, T.M.; Koralewski, T.E.; Miller, J.H.; Taylor, J.W. Integrating spread dynamics and economics of timber production to manage Chinese tallow invasions in southern US forestlands. PLoS ONE 2012, 7, e33877. [Google Scholar] [CrossRef] [PubMed]
  7. McNulty, S.G.; Moore, J.A.; Iverson, L.; Prasad, A.; Abt, R.; Smith, B.; Sun, G.; Gavazzi, M.; Bartlett, J.; Murray, B.; et al. Application of linked regional scale growth, biogeography, and economic models for southeastern United States pine forests. World Resour. Rev. 2000, 12, 298–320. [Google Scholar]
  8. Linder, E.T. Biodiversity and Southern Forests; General Technical Report SRS 75; US Department of Agriculture, Forest Service, Southern Research Station: Asheville, NC, USA, 2004; pp. 303–306.
  9. Hayes, D. Earth day 1990: Threshold of the green decade. World Policy J. 1990, 7, 289–304. [Google Scholar]
  10. Reubens, B.; Poesen, J.; Danjon, F.; Geudens, G.; Muys, B. The role of fine and coarse roots in shallow slope stability and soil erosion control with a focus on root system architecture: A review. Trees 2007, 21, 385–402. [Google Scholar] [CrossRef]
  11. Schierenbeck, K.A. Japanese honeysuckle (Lonicera japonica) as an invasive species; history, ecology, and context. Crit. Rev. Plant Sci. 2004, 23, 391–400. [Google Scholar] [CrossRef]
  12. Natural Resources Conservation Service (NRCS). The PLANTS Database. Available online: http://plants.usda.gov (accessed on 1 July 2015).
  13. Hardt, R.A. Japanese honeysuckle: From “one of the best” to ruthless pest. Arnoldia 1986, 46, 27–34. [Google Scholar]
  14. Andrews, E.F. The Japanese honeysuckle in the eastern United States. Torreya 1919, 19, 37–43. [Google Scholar]
  15. Leatherman, A.D. Ecological Life-History of Lonicera japonica Thunb. Ph.D. Thesis, University of Tennessee, Knoxville, TN, USA, 1955. [Google Scholar]
  16. Schierenbeck, K.A. Comparative ecological and genetic studies between a native (Lonicera sempervirens L.) and an introduced congener (L. japonica Thunb.). Ph.D. Thesis, Washington State University, Pullman, WA, USA, 1992. [Google Scholar]
  17. West, N.M.; Gibson, D.J.; Minchin, P.R. Microhabitat analysis of the invasive exotic liana Lonicera japonica Thunb. J. Torrey Bot. Soc. 2010, 137, 380–390. [Google Scholar] [CrossRef]
  18. Garrison, G.A.; Bjugstad, A.J.; Duncan, D.A.; Lewis, M.E.; Smith, D.R. Vegetation and Environmental Features of Forest and Range Ecosystems; Forest Service, Department of Agriculture: Washington, DC, USA, 1977; p. 68.
  19. Nyboer, R. Vegetation management guideline—Japanese honeysuckle (Lonicera japonica Thunb.). Nat. Areas J. 1992, 12, 217–218. [Google Scholar]
  20. Oosting, H.J.; Livingston, R.B. A resurvey of a loblolly pine community twenty-nine years after ground and crown fire. Bull. Torrey Bot. Club 1964, 91, 387–395. [Google Scholar] [CrossRef]
  21. Yurkonis, K.A.; Meiners, S.J. Invasion impacts local species turnover in a successional system. Ecol. Lett. 2004, 7, 764–769. [Google Scholar] [CrossRef]
  22. McLemore, B.F. Comparison of Three Methods for Regenerating Honeysuckle-Infested Openings in Uneven-Aged Loblolly Pine Stands; Southern Forest Experiment Station, Forest Service, US Department of Agriculture: Atlanta, GA, USA, 1985.
  23. Wear, D.N.; Greis, J.G. Southern forest resource assessment: Summary of findings. J. For. 2002, 100, 6–14. [Google Scholar]
  24. McKeand, S.; Mullin, T.; Byram, T.; White, T. Deployment of genetically improved loblolly and slash pines in the south. J. For. 2003, 101, 32–37. [Google Scholar]
  25. United States Department of Agriculture (USDA). Southern Nonnative Invasive Plant data Extraction Tool (SNIPET). Available online: http://srsfia2.fs.fed.us/data_center/index.shtml (accessed on 1 July 2015).
  26. Wang, H.-H.; Wonkka, C.L.; Grant, W.E.; Rogers, W.E. Potential range expansion of Japanese honeysuckle (Lonicera japonica Thunb.) in southern US forestlands. Forests 2012, 3, 573–590. [Google Scholar] [CrossRef]
  27. Gan, J.; Smith, C.T. Co-benefits of utilizing logging residues for bioenergy production: The case for East Texas, USA. Biomass Bioenergy 2007, 31, 623–630. [Google Scholar] [CrossRef]
  28. Rudis, V.A.; Gray, A.; McWilliams, W.; O’Brien, R.; Olson, C.; Oswalt, S.; Schulz, B. Regional Monitoring of Nonnative Plant Invasions with the Forest Inventory and Analysis program, Proceedings of the Sixth Annual FIA Symposium, Denver, CO, USA, 21–24 September 2006; McRoberts, R.E., Reams, G.A., Eds.; General Technical Report WO-70. USDA Forest Service: Denver, CO, USA, 2006; pp. 49–64.
  29. Bechtold, W.A.; Patterson, P.L. The Enhanced Forest Inventory and Analysis Program—National Sampling Design and Estimation Procedures; General Technical Report SRS-80; Southern Research Station, Forest Service, US Department of Agriculture: Asheville, NC, USA, 2005; p. 14.
  30. United States Department of Agriculture (USDA). The Forest Inventory and Analysis Database: Database Description and Users Manual Version 5.1; US Department of Agriculture Forest Service: Arlington, VA, USA, 2011; pp. 12–15.
  31. Lemke, D.; Hulme, P.E.; Brown, J.A.; Tadesse, W. Distribution modelling of Japanese honeysuckle (Lonicera japonica) invasion in the Cumberland Plateau and Mountain Region, USA. For. Ecol. Manag. 2011, 262, 139–149. [Google Scholar] [CrossRef]
  32. Lemke, D.; Schweitzer, C.J.; Tadesse, W.; Wang, Y.; Brown, J.A. Geospatial assessment of invasive plants on reclaimed mines in Alabama. Invasive Plant Sci. Manag. 2013, 6, 401–410. [Google Scholar] [CrossRef]
  33. Daly, C.; Halbleib, M.; Smith, J.I.; Gibson, W.P.; Doggett, M.K.; Taylor, G.H.; Curtis, J.; Pasteris, P.P. Physiographically sensitive mapping of climatological temperature and precipitation across the conterminous United States. Int. J. Climatol. 2008, 28, 2031–2064. [Google Scholar] [CrossRef]
  34. Belda, E.J.; Sánchez, A. Seabird mortality on longline fisheries in the western Mediterranean: Factors affecting bycatch and proposed mitigating measures. Biol. Conserv. 2001, 98, 357–363. [Google Scholar] [CrossRef]
  35. Wills, C.; Condit, R.; Foster, R.B.; Hubbell, S.P. Strong density- and diversity-related effects help to maintain tree species diversity in a neotropical forest. Proc. Natl. Acad. Sci. USA 1997, 94, 1252–1257. [Google Scholar] [CrossRef] [PubMed]
  36. Filipescu, C.N.; Comeau, P.G. Competitive interactions between aspen and white spruce vary with stand age in boreal mixedwoods. For. Ecol. Manag. 2007, 247, 175–184. [Google Scholar] [CrossRef]
  37. Elith, J.; Leathwick, J.R.; Hastie, T. A working guide to boosted regression trees. J. Anim. Ecol. 2008, 77, 802–813. [Google Scholar] [CrossRef] [PubMed]
  38. Ridgeway, G. Generalized Boosted Regression Models. Documentation on the R Package ‘gbm’, Version 1-5-7. Available online: http://www.i-pensieri.com/gregr/gbm.shtml (accessed on 4 April 2012).
  39. Friedman, J.H. Stochastic gradient boosting. Comput. Stat. Data Anal. 2002, 38, 367–378. [Google Scholar] [CrossRef]
  40. Hosmer, D.W.; Lemeshow, S. Applied Logistic Regression; John Wiley and Sons, Inc.: New York, NY, USA, 2000. [Google Scholar]
  41. Morales, J.M.; Carlo, T.A. The effects of plant distribution and frugivore density on the scale and shape of dispersal kernels. Ecology 2006, 87, 1489–1496. [Google Scholar] [CrossRef]
  42. Clark, J.S.; Lewis, M.; McLachlan, J.S.; HilleRisLambers, J. Estimating population spread: What can we forecast and how well? Ecology 2003, 84, 1979–1988. [Google Scholar] [CrossRef]
  43. Davies, K.F.; Harrison, S.; Safford, H.D.; Viers, J.H. Productivity alters the scale dependence of the diversity-invasibility relationship. Ecology 2007, 88, 1940–1947. [Google Scholar] [CrossRef] [PubMed]
  44. Baars, R.; Kelly, D. Survival and growth responses of native and introduced vines in New Zealand to light availability. N. Z. J. Bot. 1996, 34, 389–400. [Google Scholar] [CrossRef]
  45. Carter, G.A.; Teramura, A.H. Vine photosynthesis and relationships to climbing mechanics in a forest understory. Am. J. Bot. 1988, 75, 1011–1018. [Google Scholar] [CrossRef]
  46. Halls, L.K. Flowering and Fruiting of Southern Browse Species; US Department of Agriculture, Forest Service, Southern Forest Experiment Station: New Orleans, LA, USA, 1973; p. 10.
  47. Blair, R.M. Growth and nonstructural carbohydrate content of southern browse species as influenced by light intensity. J. Range Manag. 1982, 35, 756–760. [Google Scholar] [CrossRef]
  48. Elton, C.S. The Ecology of Invasions by Plants and Anmials; University of Chicago Press: Chicago, IL, USA, 1958. [Google Scholar]
  49. Hector, A.; Dobson, K.; Minns, A.; Bazeley-White, E.; Hartley Lawton, J. Community diversity and invasion resistance: An experimental test in a grassland ecosystem and a review of comparable studies. Ecol. Res. 2001, 16, 819–831. [Google Scholar] [CrossRef]
  50. Levine, J.M. Species diversity and biological invasions: Relating local process to community pattern. Science 2000, 288, 852–854. [Google Scholar] [CrossRef] [PubMed]
  51. Lyons, K.G.; Schwartz, M.W. Rare species loss alters ecosystem function—Invasion resistance. Ecol. Lett. 2001, 4, 358–365. [Google Scholar] [CrossRef]
  52. Levine, J.M.; D’Antonio, C.M. Elton revisited: A review of evidence linking diversity and invasibility. Oikos 1999, 87, 15–26. [Google Scholar] [CrossRef]
  53. Wang, H.-H.; Grant, W.E. Determinants of Chinese and European privet (Ligustrum sinense and Ligustrum vulgare) invasion and likelihood of further invasion in southern US forestlands. Invasive Plant Sci. Manag. 2012, 5, 454–463. [Google Scholar] [CrossRef]
  54. Richardson, D.M.; Pyšek, P.; Rejmánek, M.; Barbour, M.G.; Panetta, F.D.; West, C.J. Naturalization and invasion of alien plants: Concepts and definitions. Divers. Distrib. 2000, 6, 93–107. [Google Scholar] [CrossRef]
  55. Mitchell, C.E.; Agrawal, A.A.; Bever, J.D.; Gilbert, G.S.; Hufbauer, R.A.; Klironomos, J.N.; Maron, J.L.; Morris, W.F.; Parker, I.M.; Power, A.G.; et al. Biotic interactions and plant invasions. Ecol. Lett. 2006, 9, 726–740. [Google Scholar] [CrossRef] [PubMed]
  56. Pelczar, R. When vigor is not a virtue: Beware the beautiful but invasive Japanese honeysuckle. Horticulture 1995, 73, 64–66. [Google Scholar]
  57. Sasek, T.W.; Strain, B.R. Implications of atmospheric CO2 enrichment and climatic change for the geographical distribution of two introduced vines in the USA. Clim. Chang. 1990, 16, 31–51. [Google Scholar] [CrossRef]
  58. Holle, B.V.; Simberloff, D. Ecological resistance to biological invasion overwhelmed by propagule pressure. Ecology 2005, 86, 3212–3218. [Google Scholar] [CrossRef]
  59. Merritt, D.M.; Nilsson, C.; Jansson, R. Consequences of propagule dispersal and river fragmentation for riparian plant community diversity and turnover. Ecol. Monogr. 2010, 80, 609–626. [Google Scholar] [CrossRef]
  60. Primack, R.B.; Miao, S.L. Dispersal can limit local plant distribution. Conserv. Biol. 1992, 6, 513–519. [Google Scholar] [CrossRef]
  61. Tilman, D. Community invasibility, recruitment limitation, and grassland biodiversity. Ecology 1997, 78, 81–92. [Google Scholar] [CrossRef]
  62. Moody, M.E.; Mack, R.N. Controlling the spread of plant invasions: The importance of nascent foci. J. Appl. Ecol. 1988, 25, 1009–1021. [Google Scholar] [CrossRef]
  63. Sheley, R.L.; Mangold, J.M.; Anderson, J.L. Potential for successional theory to guide restoration of invasive plant-dominated rangeland. Ecol. Monogr. 2006, 76, 365–379. [Google Scholar] [CrossRef]
  64. Miller, J.H.; Schelhas, J. Adaptive collaborative restoration: A key concept for invasive plant management. In Invasive Plants and Forest Ecosystems; Kohli, R.K., Singh, J.P., Eds.; CRC Press: Boca Raton, FL, USA, 2008; pp. 251–265. [Google Scholar]
  65. Lodge, D.M.; Williams, S.; MacIsaac, H.J.; Hayes, K.R.; Leung, B.; Reichard, S.; Mack, R.N.; Moyle, P.B.; Smith, M.; Andow, D.A.; et al. Biological invasions: Recommendations for US policy and management. Ecol. Appl. 2006, 16, 2035–2054. [Google Scholar] [CrossRef]
  66. Wang, H.-H.; Swannack, T.M.; Grant, W.E.; Gan, J.; Rogers, W.E.; Koralewski, T.E.; Miller, J.H.; Taylor, J.W. Predicted range expansion of Chinese tallow tree (Triadica sebifera) in forestlands of the southern United States. Divers. Distrib. 2011, 17, 552–565. [Google Scholar] [CrossRef]
  67. Gelbard, J.L.; Belnap, J. Roads as conduits for exotic plant invasions in a semiarid landscape. Conserv. Biol. 2003, 17, 420–432. [Google Scholar] [CrossRef]
  68. Parendes, L.A.; Jones, J.A. Role of light availability and sispersal in exotic plant invasion along roads and streams in the H.J. Andrews Experimental Forest, Oregon. Conserv. Biol. 2000, 14, 64–75. [Google Scholar] [CrossRef]
  69. Schweitzer, J.A.; Larson, K.C. Greater morphological plasticity of exotic honeysuckle species may make them better invaders than native species. J. Torrey Bot. Soc. 1999, 126, 15–23. [Google Scholar] [CrossRef]
  70. Pitts, T.D. Foods of eastern bluebirds during exceptionally cold weather in Tennessee. J. Wildl. Manag. 1979, 43, 752–754. [Google Scholar] [CrossRef]
  71. Suthers, H.B.; Bickal, J.M.; Rodewald, P.G. Use of successional habitat and fruit resources by songbirds during autumn migration in central New Jersey. Wilson Bull. 2000, 112, 249–260. [Google Scholar] [CrossRef]
  72. Halls, L.K. Managing deer habitat in loblolly-shortleaf pine forest. J. For. 1973, 71, 752–757. [Google Scholar]
  73. Nixon, C.M.; McClain, M.W.; Russell, K.R. Deer food habits and range characteristics in Ohio. J. Wildl. Manag. 1970, 34, 870–886. [Google Scholar] [CrossRef]
  74. Sotala, D.J.; Kirkpatrick, C.M. Foods of white-tailed deer, Odocoileus virginianus, in Martin County, Indiana. Am. Midl. Nat. 1973, 89, 281–286. [Google Scholar] [CrossRef]
  75. Sheldon, J.J.; Causey, K. Deer habitat management—Availability use of Japanese honeysuckle by white-tailed deer. J. For. 1974, 72, 286–287. [Google Scholar]
  76. Michael, E.D. Movements of white-tailed deer on the Welder Wildlife Refuge. J. Wildl. Manag. 1965, 29, 44–52. [Google Scholar] [CrossRef]
  77. Inglis, J.M.; Hood, R.E.; Brown, B.A.; DeYoung, C.A. Home range of white-tailed deer in Texas coastal prairie brushland. J. Mammal. 1979, 60, 377–389. [Google Scholar] [CrossRef]
  78. Thomas, J.W.; Teer, J.G.; Walker, E.A. Mobility and home range of white-tailed deer on the Edwards Plateau in Texas. J. Wildl. Manag. 1964, 28, 463–472. [Google Scholar] [CrossRef]
  79. Sage, R.W., Jr.; Tierson, W.C.; Mattfeld, G.F.; Behrend, D.F. White-tailed deer visibility and behavior along forest roads. J. Wildl. Manag. 1983, 47, 940–953. [Google Scholar] [CrossRef]
  80. Kilgo, J.C.; Labisky, R.F.; Fritzen, D.E. Influences of hunting on the behavior of white-tailed deer: Implications for conservation of the Florida panther. Conserv. Biol. 1998, 12, 1359–1364. [Google Scholar] [CrossRef]
  81. Conner, W.; Stanturf, J.A.; Gardiner, E.S.; Schweitzer, C.J.; Ezell, A.W. Recognizing and overcoming difficult site conditions for afforestation of bottomland hardwoods. Ecol. Restor. 2004, 22, 183–193. [Google Scholar]
  82. Jackson, L.W. Honeysuckles. In Shrubs and Vines for Northeastern Wildlife; Gill, J.D., Healy, W.M., Eds.; US Department of Agriculture, Forest Service, Northeastern Forest Experiment Station: Upper Darby, PA, USA, 1974; pp. 71–82. [Google Scholar]
  83. Elith, J.; Graham, C.H. Do they? How do they? WHY do they differ? On finding reasons for differing performances of species distribution models. Ecography 2009, 32, 66–77. [Google Scholar] [CrossRef]
  84. Agresti, A. An Introduction to Categorical Data Analysis; John Wiley and Sons, Inc.: Hoboken, NJ, USA, 2007. [Google Scholar]
  85. Walters, C.J. Adaptive Management of Renewable Resources; Macmillan Publishing Company: New York, NY, USA, 1986. [Google Scholar]
  86. Barry, S.; Elith, J. Error and uncertainty in habitat models. J. Appl. Ecol. 2006, 43, 413–423. [Google Scholar] [CrossRef]
  87. Elith, J.; Leathwick, J.R. Species distribution models: Ecological explanation and prediction across space and time. Annu. Rev. Ecol. Evol. Syst. 2009, 40, 677–697. [Google Scholar] [CrossRef]

