Article

How the Succession Process Affects Soil Microbial Community Diversity and Network Complexity in Karst Forests


Guizhou Academy of Testing and Analysis, Guizhou Academy of Sciences, Guiyang 550000, China
*
Author to whom correspondence should be addressed.
Forests 2026, 17(8), 981; https://doi.org/10.3390/f17080981
Submission received: 8 July 2026 / Revised: 7 August 2026 / Accepted: 12 August 2026 / Published: 18 August 2026
(This article belongs to the Section Forest Soil)

Abstract

Although many studies had been conducted on soil microbial communities in forest ecosystems before this one, how the diversity and network complexity of soil microbial communities evolved throughout the succession of karst forests remained unclear. We collected soil samples from three vegetation successional stages (grassland stage, shrub stage and arbor stage) in Maolan National Nature Reserve, Guizhou Province, China, and applied high-throughput sequencing technology to explore soil microbial diversity, community composition, co-occurrence network characteristics and their internal correlations. The results showed that the succession process significantly affected soil microbial diversity (p < 0.05). Bacterial diversity increased by 12.33% as succession proceeded, whereas fungal diversity declined by 37.50%. The dominant microbial communities exhibited obvious stage-specific characteristics. For bacteria, Bacillaceae served as a universally dominant taxon. Paenibacillaceae and Thermoactinomycetaceae were enriched in the grassland (CD) stage, and the relative abundance of Streptosporangiaceae reached its maximum in the arbor (QM) stage. For fungi, Trimorphomycetaceae and Hypocreaceae were ubiquitous dominant groups. Aspergillaceae possessed the highest relative abundance in the CD stage, while Clavicipitaceae peaked in relative abundance in the QM stage. The complexity of bacterial co-occurrence networks rose with succession, whereas fungal network complexity decreased. Both positive and negative linkages in bacterial networks increased over succession, while both types of connections in fungal networks declined. Soil organic carbon (SOC), total nitrogen (TN), total phosphorus (TP) and N/P ratio exerted the strongest influences on bacterial communities and bulk density; SOC and TN were the key drivers structuring fungal assemblages. Micromonosporaceae and Xanthobacteraceae showed significant positive correlations with TP and N/P ratio (p < 0.05), whereas Thermoactinomycetaceae and Oscillospiraceae presented significant negative correlations with these two indicators (p < 0.01). Clavicipitaceae had strong positive correlations with SOC and TN (p < 0.01), and Herpotrichiellaceae together with Aspergillaceae displayed significant negative correlations with SOC and TN (p < 0.05). This study clarified the regulatory effects of karst forest secondary succession on soil microbial communities and provided theoretical evidence for the ecological restoration of karst regions.

1. Introduction

The succession process is a natural process in ecological restoration that enhances ecosystem function [1,2]. Soil microorganisms—an “invisible engine” within the ecosystem—participate in key processes such as soil carbon (C), nitrogen (N), and phosphorus (P) cycling, organic matter decomposition, and nutrient transformation [3]. Dynamic changes in community structure and function of these microorganisms directly affect the health of an ecosystem and its restoration [4,5]. An understanding of how soil microbial communities change in karst ecosystems during the succession process and what influences these changes is important if ecological restoration strategies are to be optimized [6].
Succession-driven directional turnover of soil microbial communities is a prevalent ecological phenomenon rather than an occasional process, which widely occurs in forest succession sequences across different climatic zones and soil types worldwide [7,8]. The universality of this phenomenon derives from the unified bottom-up regulatory mechanism of vegetation succession: the staged evolution of vegetation community structure and litter input continuously reshapes soil microhabitats and resource supply patterns, thereby driving adaptive succession of soil microbial communities. At present, scholars worldwide have verified the response patterns of microorganisms to succession in various typical forest ecosystems, establishing multi-dimensional research understandings [9,10]. Previous studies have confirmed that vegetation succession indirectly drives directional variations in soil microbial diversity and community composition by altering vegetation community structure, regulating litter decomposition processes, and modifying root secretion characteristics [11,12]. However, due to the divergent effects of climatic conditions and soil background properties, the response characteristics and driving mechanisms of microbial communities during forest vegetation succession exhibit significant spatial heterogeneity across regions. At different succession stages of southwest karst forests, bacterial α-diversity first increases and then stabilizes, while fungal diversity gradually declines with the development of primary forests [13]. During positive vegetation succession, the node number, connectivity and stability of bacterial co-occurrence networks continuously improve, whereas fungal networks exhibit weaker interaction intensity and more prominent modular aggregation characteristics [14]. Bacterial communities are mainly regulated by soil pH and C:N ratio, whereas fungal communities are more responsive to total nitrogen, total phosphorus and available nitrogen contents [2]. These results confirm the influence of succession on microbial ecological functions at a functional level and reveal the microbial-driving mechanism involved in improving soil nutrient cycling efficiency during the succession process [15].
Despite considerable progress achieved in existing studies, obvious research gaps still remain regarding the unique nutrient-poor karst habitats. Most current investigations focus on overall shifts in microbial diversity and community composition along succession gradients [16,17,18], while neglecting the divergent responses of network complexity between bacterial and fungal communities [19,20]. The structural stability of microbial co-occurrence networks directly determines the anti-disturbance capacity of ecosystems, yet the adaptive differentiation mechanisms of bacterial and fungal networks during karst forest succession remain unclear [21,22]. Accordingly, this study took the vegetation succession process in Maolan National Nature Reserve as the research object to address the following core scientific questions: (1) How do soil microbial diversity and community structure change during karst forest succession? (2) How does the complexity of soil microbial co-occurrence networks respond to karst forest succession? (3) How are the coupling relationships between soil microorganisms and soil physicochemical properties regulated? The findings of this study are expected to provide important theoretical foundations and technical support for the scientific restoration and precise management of ecosystems in karst regions.

2. Materials and Methods

2.1. Study Area

Surveys were performed in the Maolan National Nature Reserve, Libo County, Guizhou Province (25.15–25.33° N, 107.87–107.08° E). The reserve covers 213 km2, of which 87.3% is covered in forest. The reserve features a terrain higher in the northwest and lower in the southeast. Its elevation ranges from a minimum of 430 m to a maximum of 1079 m, with an average altitude between 550 m and 850 m. The landscape features typical karst topography, with cone-shaped karst hills and funnel depressions. The region experiences a subtropical monsoon humid climate, 18.3 °C annual mean temperature, 1752.5 mm annual precipitation (concentrated between April and October), 83% average relative humidity, and 1271 h annual sunshine. Native forests are mixed evergreen–deciduous and broad-leaved. The parent rock is dolomitic limestone, and the soil is predominantly calcareous; soil layers are shallow and discontinuous [23].

2.2. Sample Collection and Processing

Using a space-for-time substitution method, we identified three natural succession stages (grassland (CD), shrub (GM), and arbor (QM)). Three replicate plots were established in each stage (nine plots in total), and in July 2025, plant communities within each plot were surveyed (Table 1). Topsoil samples (0–20 cm depth) were collected using a S-shaped five-point composite method along the diagonal of each plot [24]. One composite soil sample was collected per plot, with three composite samples for each succession stage (nine soil samples in total). Each soil sample was subdivided and returned to the laboratory: one part was placed into a sealed plastic bag, air-dried, ground, and sieved through a 0.25 mm mesh to determine soil physicochemical properties (Table 2); the second was placed into liquid nitrogen and stored in an ultra-low temperature freezer at −80 °C for soil microorganism high-throughput sequencing.

2.3. Soil Physical and Chemical Properties

Soil physicochemical properties were determined based on the methods described in Bao [25]. Soil pH was determined using the potentiometric method with a soil–water ratio of 1:2.5 (PHS-25, Shanghai INESA Scientific Instrument Co., Ltd., Shanghai, China), and bulk density (BD) was measured using the ring-knife weighing method. The oil bath-heated potassium dichromate oxidation volumetric technique was applied to calculate the total organic C (TOC) content (HH-S, Changzhou Guohua Electric Appliance Co., Ltd., Changzhou, China). Total nitrogen (TN) was determined by Kjeldahl distillation (Kjeltec 8100, FOSS Analytical A/S, Hillerød, Denmark), while the molybdenum antimony anti-colorimetry allowed the estimation of total phosphorus content (UV-9000s, Shanghai Metash Instruments Co., Ltd., Shanghai, China), respectively.

2.4. Soil Microbial Sequencing

2.4.1. DNA Extraction and PCR Amplification

Total DNA was extracted using an E.Z.N.A. soil DNA kit (Omega Bio-tek, Norcross, GA, USA) following manufacturer instructions; DNA concentration and purity were detected by a NanoDrop 2000 spectrophotometer (Thermo Fisher Scientific, Cambridge, UK), with DNA quality verified by 1% agarose gel electrophoresis [26]. The V3–V4 variable region of the bacterial 16S rRNA gene was amplified using primers 338F (5′-ACTCCTACGGGAGGCAGCAG-3′) and 806R (5′-GGACTACHVGGGTWTCTAAT-3′) [27]; the fungal endogenous chloroplast intergenic spacer region (ITS1 region) was amplified using primers ITS1F (5′-CTTGGTCATTTAGAGGAAGTAA-3′) and ITS2R (5′-GCTGCGTTCTTCATCGATGC-3′) [28]. PCR products were purified using an AxyPrep DNA Gel Extraction Kit (Axygen Biosciences, Union City, CA, USA) and quantified using QuantiFluor-ST (Promega, Madison, WI, USA). Processed PCR amplification products were sequenced on an Illumina MiSeq platform (Illumina, San Diego, CA, USA) using a dual-end sequencing method, as provided by Shanghai Meiji Biopharmaceutical Technology Co., Ltd. (Shanghai, China).

2.4.2. Sequence Data Processing

FLASH v.1.2.11 was used to merge paired-end sequences into a single sequence; Trimmomatic v.0.33 was used for quality filtering (average quality score > 20). To obtain valid reads, the Uchime algorithm was used to identify and remove chimeric sequences. Uparse v.7.0 was used to identify operational taxonomic units (OTUs) based on a 97% similarity threshold [29]. To reduce false OTUs, those with fewer than two sequence representations were removed. Finally, the most representative sequence for each OTU was selected. Bacteria and fungi were classified using the RDP (Ribosomal Database Project) classifier based on the Silva 132 and Unite 8.0 databases, with a confidence threshold of 70%. To minimize the influence of read variations from different samples, all sequences were standardized based on the minimum sequence for each sample.

2.5. Data Processing and Analysis

SPSS (16.0) was used for statistical analyses; the “vegan package” and “diversity function” in R language were used to calculate microbial community α-diversity indices [30]; ggplot2 was used for bar chart and bubble chart preparation, and pheatmap was used to draw correlation plots. Two-way analysis of variance (ANOVA) was used to analyze soil microbial diversity; means were compared using the least significant difference and Student’s t-tests, with a level of significance (α) of 0.05. The decision coefficient R2 depended on optimal simulation models.

3. Results

3.1. Soil Microbial Diversity During Forest Succession

Forest succession significantly affected bacterial and fungal community diversity (Figure 1a,b). Bacterial diversity increased with succession and was significantly higher in QM than CD and GM stages (Figure 1a, p < 0.05). Fungal diversity decreased progressively with succession and was highest during the CD stage (significantly higher than in GM and QM stages) (Figure 1b, p < 0.001). Forest succession increased microbial community structure diversity, with the response of fungi stronger than that of bacteria (Figure 1c,d). Analysis of similarity (ANOSIM) revealed that bacterial and fungal communities differed significantly at different succession stages (p = 0.001).

3.2. Microbial Community Structure and Composition During Forest Succession

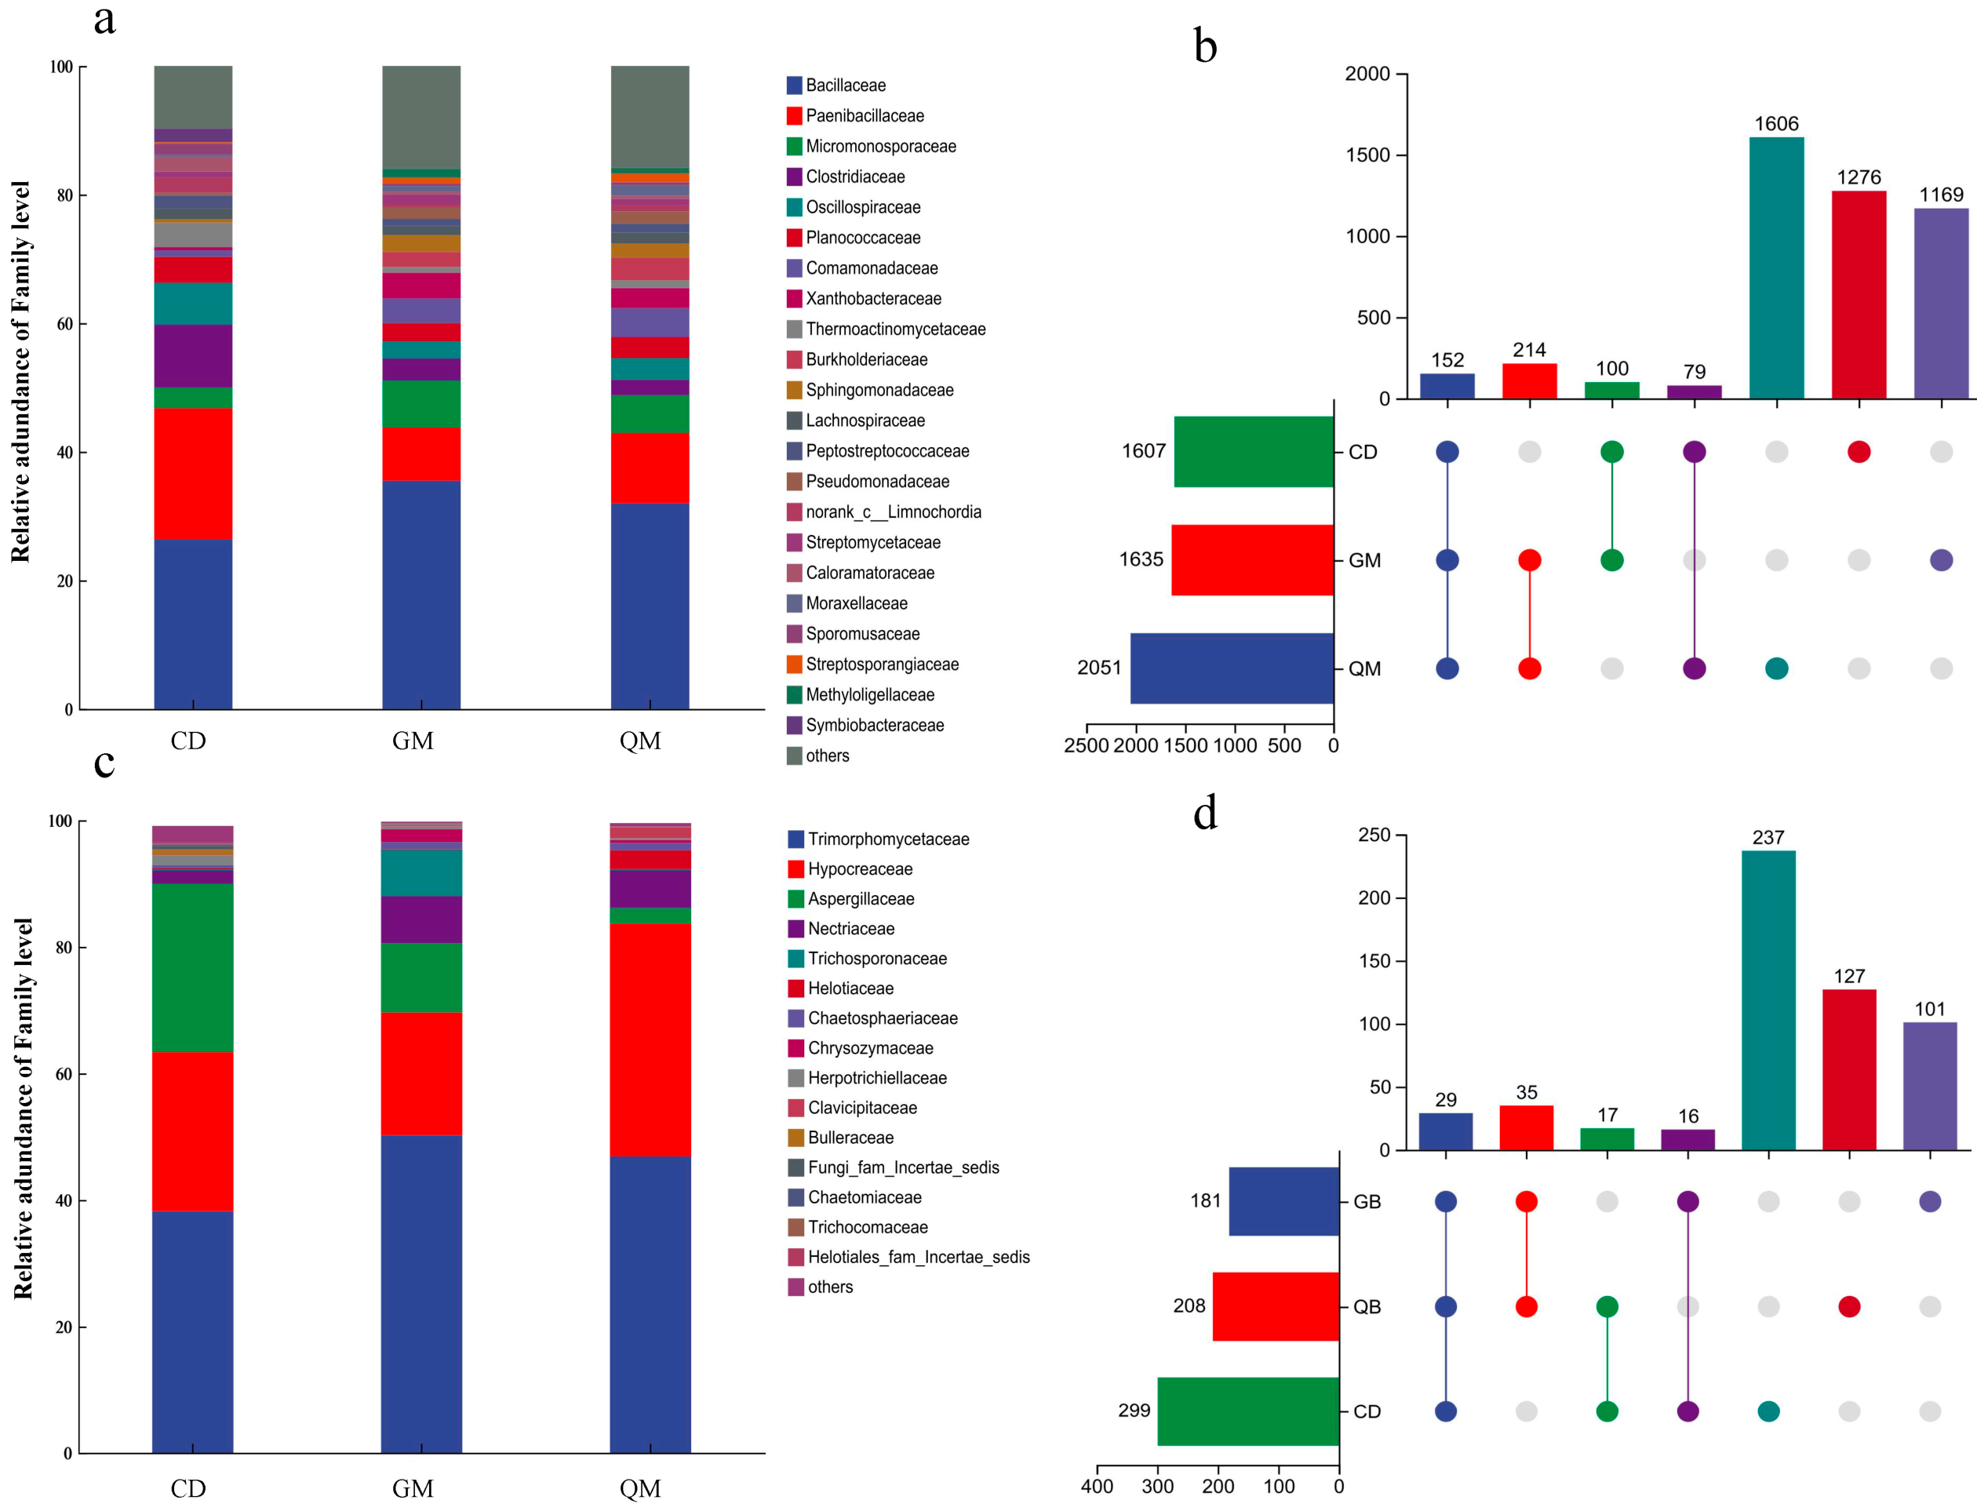
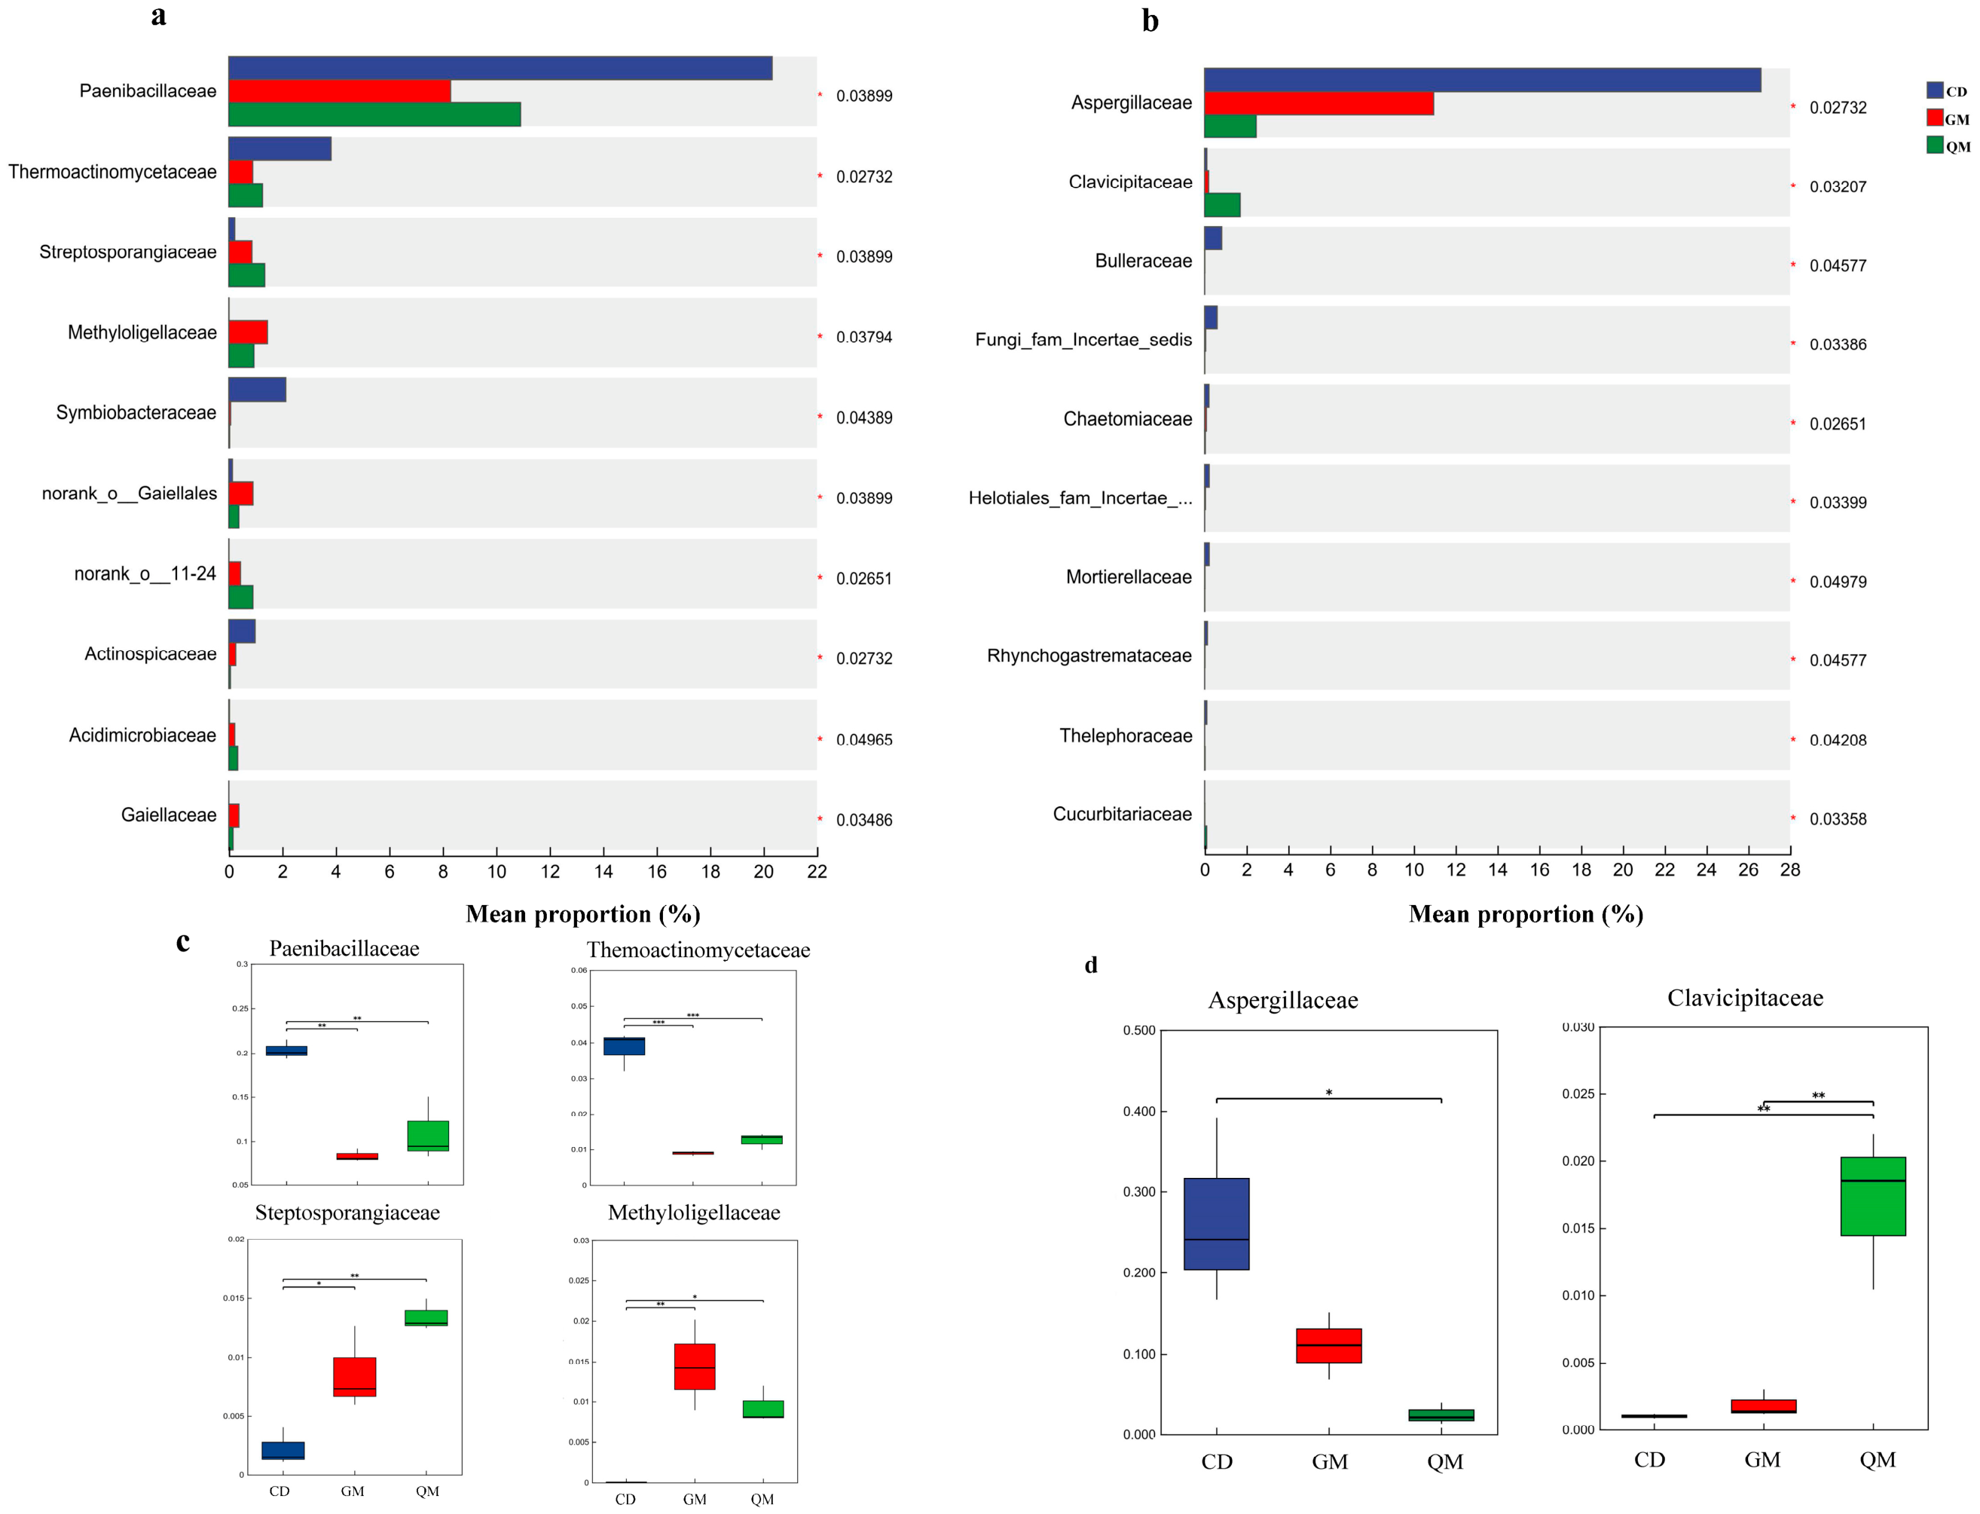
Within the bacterial communities (Figure 2a and Figure 3a,c), the family Bacillaceae was the most relatively abundant (31.31%), although its abundance did not differ significantly across succession stages; in contrast, the abundances of Paenibacillaceae, Thermoactinomycetaceae, Streptosporangiaceae, and Methyloligellaceae did differ significantly. Relative abundances of Paenibacillaceae (20.32%) and Thermoactinomycetaceae (3.82%) peaked during the CD stage, Streptosporangiaceae peaked at 1.31% during the QM stage, and Methyloligellaceae peaked at 1.44% during the GM stage. An Upset plot (Figure 2b) revealed the QM stage to have the most OTUs (2051) and the CD stage the least (1607); 152 OTUs were shared by all three stages.
Of fungal communities (Figure 2c and Figure 3b,d), Trimorphomycetaceae and Hypocreaceae did not differ significantly among stages, with relative abundances of 45.12% and 27.10%, respectively. Significant inter-stage variations were apparent for Aspergillaceae and Clavicipitaceae; relative abundances of Aspergillaceae were: CD (26.60%), GM (10.95%), and QM (2.46%) stages. Clavicipitaceae peaked at 1.70% during the QM stage. The Upset plot (Figure 2d) revealed the CD stage to have the most fungal OTUs (299) and the QM stage the least (181); 29 fungal OTUs were shared across all succession stages.

3.3. Microbial Co-Occurrence Networks During Forest Succession

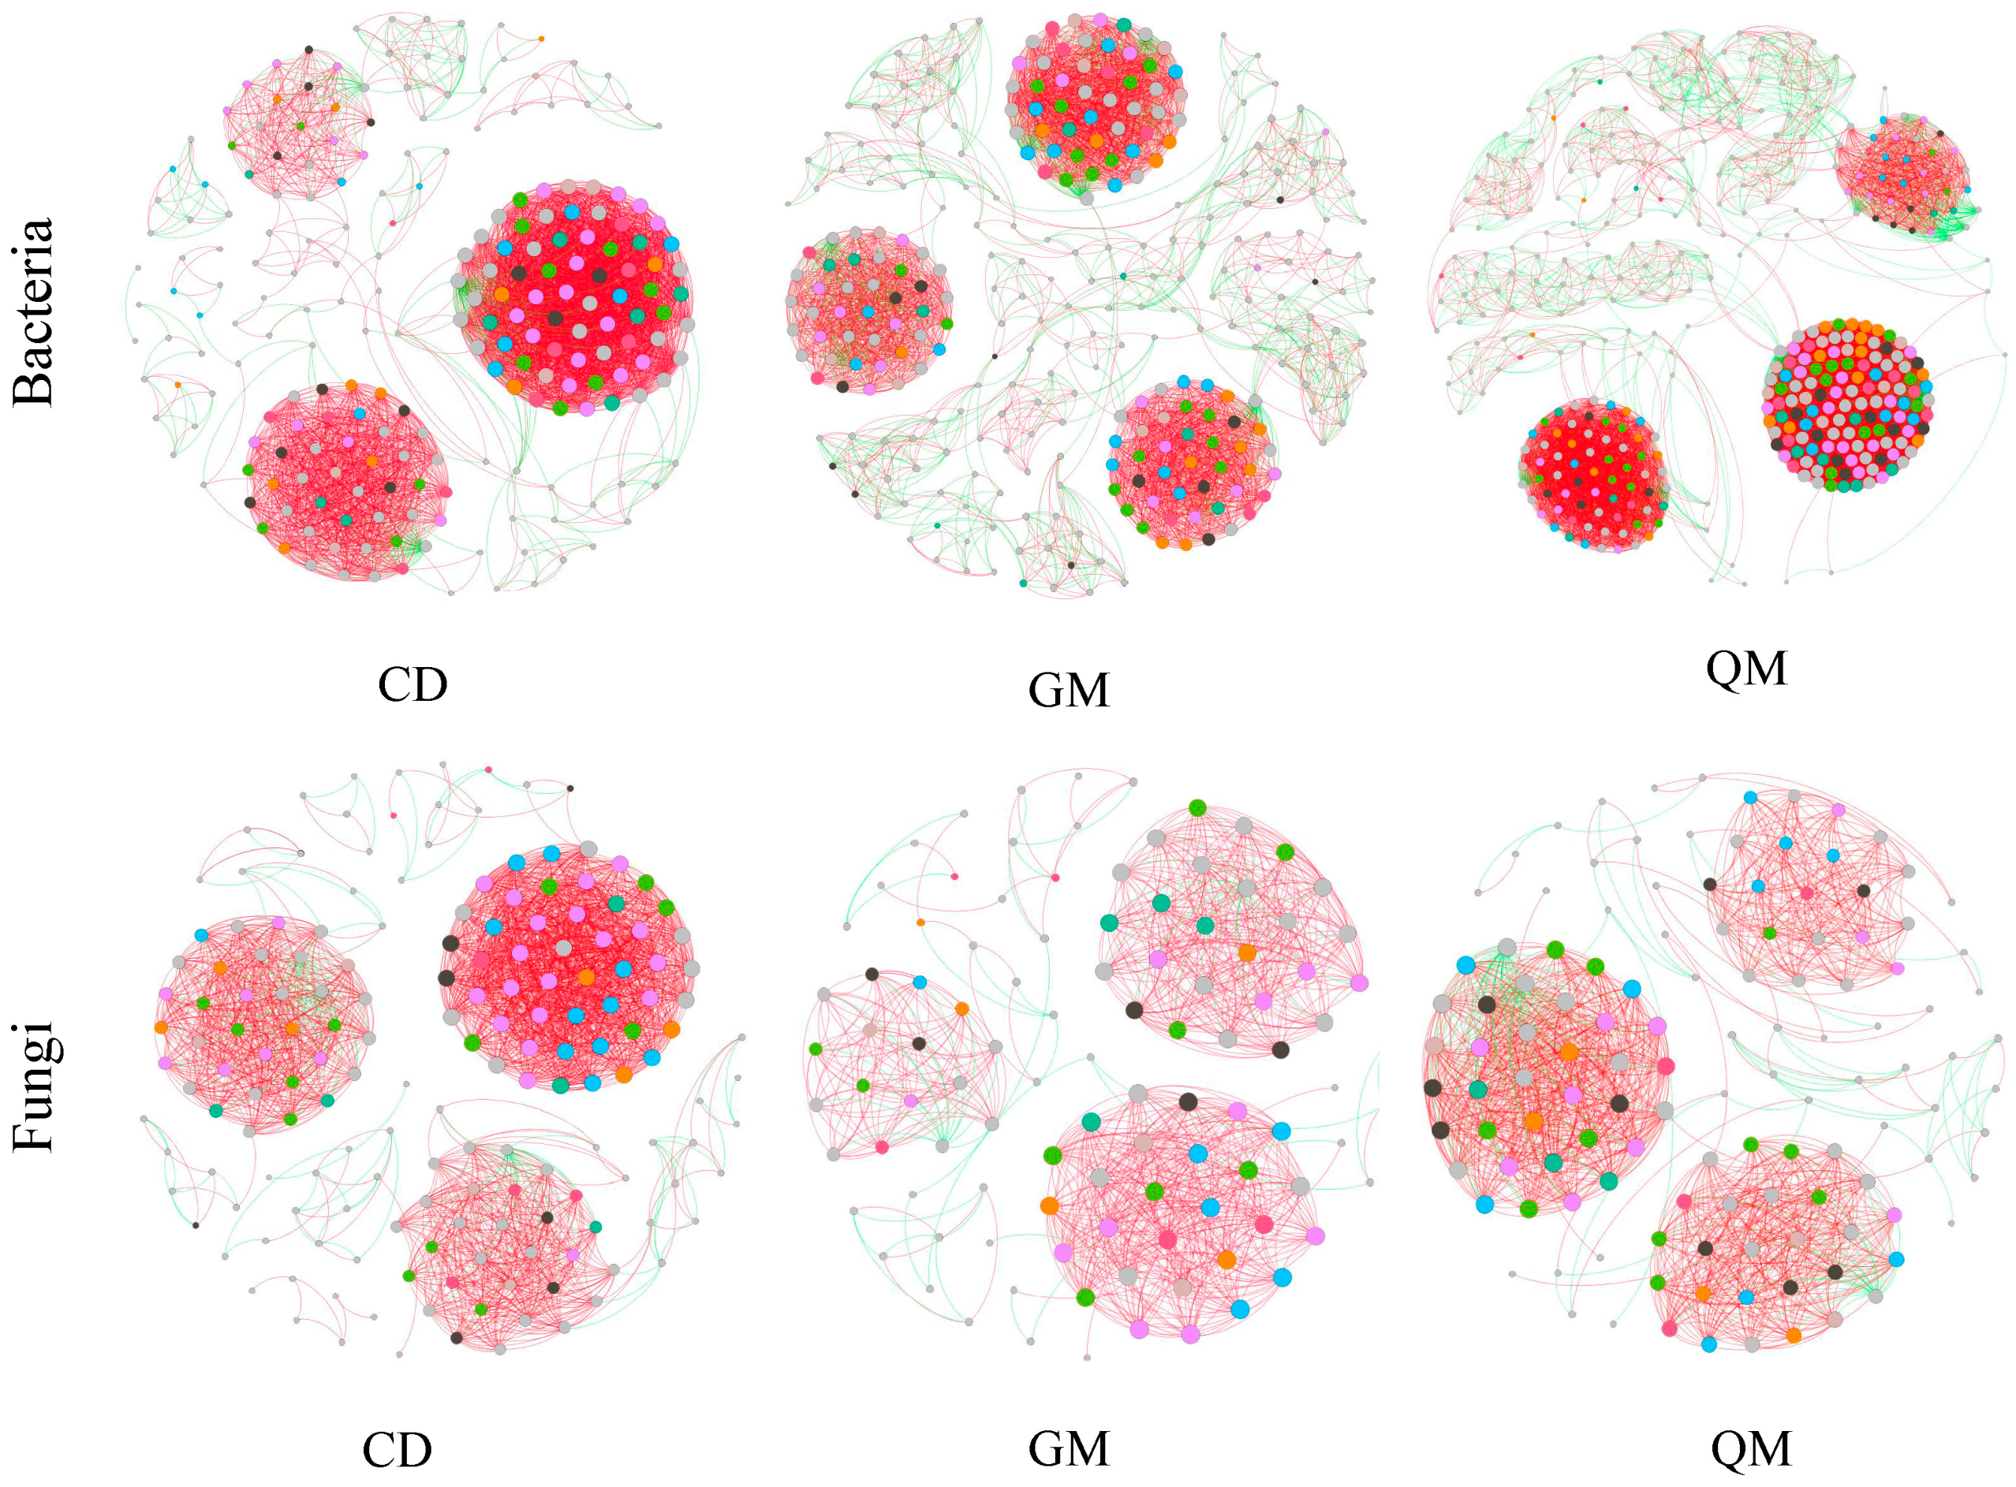
We conducted screening and calculation of Spearman correlation coefficients and significance for at least 50% of the sample OTUs. Based on strong and significant correlations (R > 0.6, p < 0.05), coexistence patterns of soil microbial communities were explored at different succession stages using network analysis. Bacterial community network complexity gradually increased as succession progressed, while that of fungal communities decreased (Figure 4).
Numbers of nodes and edges in bacterial networks were lowest during the CD stage and highest during the QM stage, increasing from 222 nodes and 4480 edges to 398 nodes and 15,801 edges, respectively (Table 3). Peak numbers of nodes and edges occurred in fungal networks during the CD stage (173 nodes, 2637 edges) and were lowest during the GM stage (108 nodes, 1015 edges). Throughout succession, positive correlations dominated connections in both bacterial and fungal networks. As succession progressed, both positive and negative linkages in bacterial networks increased, while those in fungal networks trended down.

3.4. Links Between Soil Properties and Soil Microbial Communities During Succession

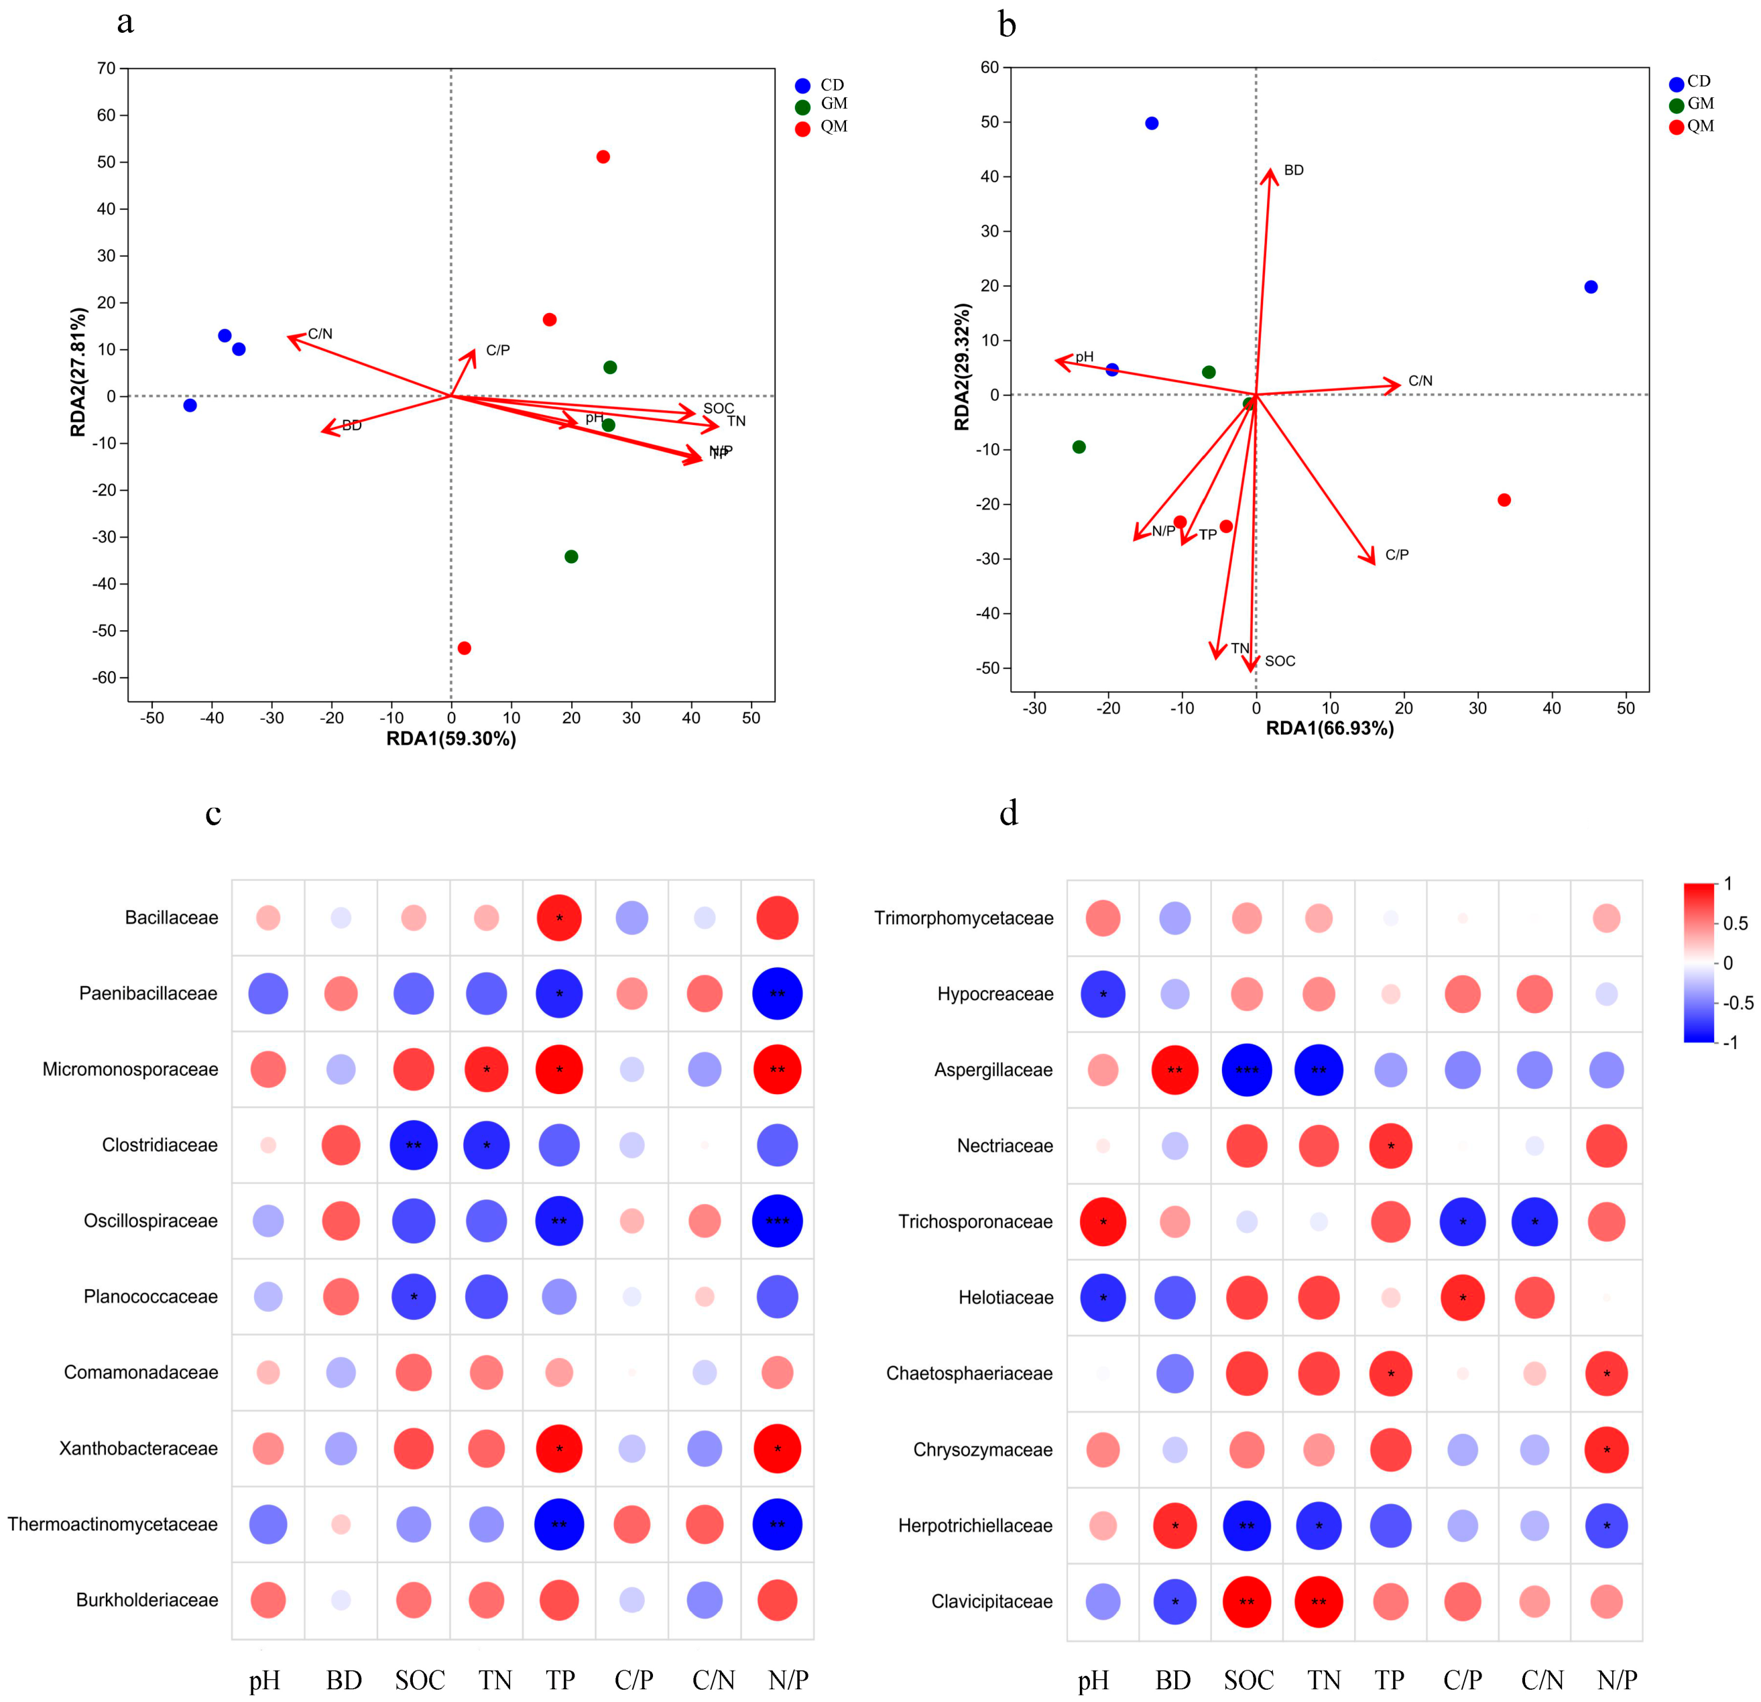
Redundancy analysis (RDA) revealed that environmental factors exert significant impacts on bacterial and fungal community structure (Figure 5a,b). The first two RDA axes jointly explained 87.11% of the total variation in bacterial communities, with SOC, TN, N/P, and TP being the main drivers. For fungal communities, RDA1 and RDA2 together accounted for 96.25% of the total variation, with BD, SOC, and TN being the main drivers.
Correlation heatmap analysis at the taxonomic level of family revealed distinct patterns. For bacteria, Micromonosporaceae and Xanthobacteraceae correlated significantly and positively with TP and N/P (p < 0.05), and Thermoactinomycetaceae and Oscillospiraceae correlated significantly and negatively with these two soil variables (Figure 5c, p < 0.01). Of fungal families, Clavicipitaceae correlated strongly and positively with SOC and TN (p < 0.01), and Herpotrichiellaceae and Aspergillaceae correlated negatively with these same two variables (Figure 5d, p < 0.05).

4. Discussion

4.1. Soil Microbial Diversity and Community Composition in the Karst Forest Succession Process

Soil microorganisms are both important indicators of succession processes and directly relate to ecosystem function integrity and stability [31,32]. We report bacterial diversity to increase significantly with succession, but fungal diversity to trend down, consistent with Jiang et al. [31], who reported pronounced differences in fungal community structure and stage-wise elevation of bacterial diversity during forest succession in the karst region of southwest China. As succession process progresses, an increasingly complex canopy structure and enriched species composition at the QM stage increase the quantity and functional diversity of litter input. Decomposition of these organic materials facilitates SOC and TN accumulation by supplying scarce and diverse C and N substrates for bacterial proliferation that drive a gradual increase in bacterial diversity [5]. The reduction in fungal diversity can be explained by three factors. First, mycorrhizal symbiotic fungi become the absolutely dominant taxa in the arbor stage, occupying the ecological niches of numerous saprophytic fungi and resulting in the decline of species richness. Second, the soil microhabitat becomes relatively stable in the arbor stage, and the reduced habitat heterogeneity cannot sustain the coexistence of more functionally differentiated fungal species. Third, litter components in the arbor stage are more complex and lignified with simplified substrate types [33,34]. Only a small number of functionally specialized symbiotic fungi and highly tolerant saprophytic fungi can adapt to the nutrient conditions in the late succession stage, whereas a great many generalist saprophytic fungi are gradually eliminated, ultimately causing a continuous decrease in the species richness of fungal communities [35].
In bacterial communities, the Bacillaceae were relatively most abundant (up to 31.31%) throughout succession and did not differ significantly among stages. These bacteria can tolerate considerable fluctuations in nutrients in karst soils and frequent drought stress, and thereby maintain dominance throughout succession [36,37]. However, Paenibacillaceae and Thermoactinomycetaceae were significantly enriched during early succession. Most members of these two families are copiotrophic and can efficiently utilize labile organic matter such as simple sugars derived from herbaceous residues. Because Streptosporangiaceae can decompose recalcitrant substrates including lignin and cellulose, their relative abundance peaks during late succession [38]. Trimorphomycetaceae and Hypocreaceae were dominant fungal community families (with relative abundances of 45.12% and 27.10%, respectively), indicating that both were broadly adaptable to environmental shifts during karst forest succession. Aspergillaceae (typical saprophytic fungi) can rapidly decompose fresh herbaceous residues and are markedly enriched during early succession [39]. Clavicipitaceae peaked in relative abundance during the QM stage; some taxa in this family form symbiotic associations with QM plants, and by absorbing nutrients via symbiosis, they can adapt to late succession ecological conditions [40].

4.2. Complexity of Soil Microbial Co-Occurrence Networks During the Karst Forest Succession Process

We report bacterial co-occurrence network complexity to gradually increase with succession, and that of fungal networks to trend down. These results are consistent with those of Li et al. [41], who reported rare microbial networks to be more responsive to the succession process in a subalpine secondary forest. The increased complexity of bacterial networks during succession suggests that cooperative and competitive interactions among bacterial species become increasingly closer and more intricate [4]. In nutrient-poor karst soils, increased bacterial diversity provides a rich foundation for functional complementarity among species. Different bacterial functional groups can more efficiently utilize scarce soil nutrients through synergistic interactions [42,43]. With progression in succession, both positive and negative connections within the bacterial network tend to increase. The rise in positive connections strengthens mutualistic interactions among species, promoting nutrient sharing and complementary metabolic products. The increase in negative connections helps to eliminate redundant species with overlapping niches, reducing resource competition and enhancing community resource use efficiency and stability. This coordinated increase in positive and negative connections reflects the flexible adaptation strategy of bacterial communities to dynamic karst habitats and explains why their competitive advantage and diversity are continuously enhanced throughout succession [44].
Fungal co-occurrence network complexity decreased significantly through the succession process in karst forests. This pattern is closely associated with the turnover of dominant fungal taxa and shifts in habitat stress during succession. During early succession, herbaceous plants prevail, and saprophytic fungi (e.g., Aspergillaceae) dominate the soil. Various saprophytic fungal groups form intricate competitive and cooperative interactions to compete for limited organic resources, leading to relatively complex network architectures [45,46]. As succession progresses, trees gradually come to dominate, and symbiotic fungi replace saprophytic fungi as dominant taxa. These symbiotic fungi acquire nutrients mainly through mutualistic associations with host trees, shifting their survival strategy from competition for soil organic substrates to plant–fungus symbiosis. Direct interspecific interactions are markedly weakened, resulting in a sharp reduction in the number of network nodes and edges [13]. Notably, positive linkages consistently dominated fungal networks across all succession stages, and both positive and negative connections declined continuously as succession proceeded. This pattern indicates that cooperative interactions prevail within fungal communities. However, in dynamically changing karst habitats, it is difficult for fungal communities to adapt to environmental fluctuations by rapidly adjusting interspecies relationships (in contrast to the more flexible bacterial communities) [10,47].

4.3. Correlation Between Soil Characteristics and Microbial Communities During the Karst Ecosystem Succession Process

RDA revealed soil properties to collectively explain 87.11% of all variation in bacterial community structure, with SOC, TN, N/P, and TP most affecting them. Soil characteristics explained up to 96.25% of all variation in fungal community structure, with BD, SOC, and TN most affecting them. These results are consistent with those of Li et al. [48] for karst mountain ecosystems, where TOC and TN were reported to most affect microbial community differentiation. This confirms that soil nutrient contents, including C, N, and P, and physicochemical properties such as BD, strongly affect microbial communities in nutrient-poor karst habitat and highlights the importance of soil-microbe interactions in karst forest succession.
At the level of bacterial family, Micromonosporaceae and Xanthobacteraceae correlated significantly and positively with TP and the N/P ratio. In karst soils, P deficiency is a major constraint. Elevated TP concentrations and optimized N/P ratios substantially improve P bioavailability. Because these two types of bacteria may efficiently absorb and utilize P, they can better adapt to P-deficient karst habitats and accumulate during succession stages with relatively higher P contents [48,49]. In contrast, Thermoactinomycetaceae and Oscillospiraceae correlated significantly and negatively with TP and the N/P ratio, possibly because (1) high P concentrations suppress the activities of specific metabolic enzymes in these two families, or (2) intensified competitive exclusion from other dominant bacteria under high P conditions restrains their growth [25].
At the level of fungal family, Clavicipitaceae correlated strongly and positively with SOC and TN. These fungi obtain carbohydrates from plants, and plants can absorb more nutrients through fungal mycelial networks. This mutually beneficial symbiotic relationship is more stable in a high C and N environment, for which reason the abundance of taxa in this family increases with increased C and N content [50]. In contrast, Herpotrichiellaceae and Aspergillaceae correlated significantly and negatively with SOC and TN. These two types of fungi are mostly saprophytic and better adapted to habitats with lower SOC and TN levels during early succession [51,52]. They can efficiently decompose simple herbaceous residues to obtain nutrients [53]. In late succession, SOC and TN contents increase markedly, symbiotic fungi gradually dominate, and the living space for saprophytic fungi compresses, significantly reducing their abundance [54].

5. Conclusions

This study investigated the effects of karst forest succession on soil microbial community diversity and network complexity, as well as their correlations with soil properties. The results showed that karst forest succession significantly altered soil microbial diversity and network complexity. Bacterial diversity and network complexity increased with succession, while the opposite trend was observed for fungi. SOC, TN, N/P, and TP were the key drivers of bacterial communities, whereas BD, SOC, and TN governed fungal communities. This suggests that bacteria can better adapt to habitat changes during karst succession through flexible interspecific relationships and efficient nutrient utilization strategies. In contrast, fungi exhibit relatively weak environmental adaptability constrained by vegetation turnover and inherent population traits. This study clarifies the synergistic “vegetation–soil–microbe” regulatory mechanism and reveals the successional patterns of soil microbial communities under karst forest succession.

Author Contributions

Conceptualization, L.Z. (Limin Zhang); methodology, S.M.; software, L.Z. (Limin Zhang) and Y.Z.; validation, L.Z. (Lihua Zhao) and Y.L.; formal analysis, L.Z. (Limin Zhang); investigation, S.M.; data curation, L.Z. (Lihua Zhao) and Y.L.; writing—original draft preparation, L.Z. (Limin Zhang); writing—review and editing, L.Z. (Limin Zhang) and Y.L.; supervision, L.Z. (Limin Zhang); project administration, L.Z. (Limin Zhang); funding acquisition, L.Z. (Limin Zhang). All authors have read and agreed to the published version of the manuscript.

Funding

This research was funded by Guizhou Provincial Basic Research Program (Natural Science) (No. Qiankehe foundation-ZK [2024] Major 092, Qiankehe foundation ZD(2026)092).

Data Availability Statement

The original contributions presented in this study are included in the article. Further inquiries can be directed to the corresponding author.

Conflicts of Interest

The authors declare no conflicts of interest.

References

  1. Ma, H.; Hans, H.B.; Qiu, Y.Z.; Gao, E.; Wang, Y.X.; Rosendahl, S.; Bahram, M.; Zhao, Z.G. Stochastic processes and biotic interactions shape the structure of soil bacterial and fungal communities during secondary succession in high-altitude oldfields. Appl. Soil Ecol. 2025, 214, 106401. [Google Scholar] [CrossRef] [Scilit]
  2. Wang, M.M.; Shao, Y.H.; Zhang, W.X.; Yu, B.B.; Shen, Z.F.; Fan, Z.J.; Zu, W.J.; Dai, G.H.; Fu, S.L. Secondary succession increases diversity and network complexity of soil microbial communities in subtropical and temperate forests. Catena 2025, 249, 108662. [Google Scholar] [CrossRef] [Scilit]
  3. Zhu, Z.; Xu, X.; Liu, S.; Jones, D.L.; Kuzyakov, Y.; Shibistova, O.; Wu, J.S.; Ge, T.D. Carbon and nitrogen recycling from microbial necromass to cope with C:N stoichiometric imbalance by priming. Soil Biol. Biochem. 2020, 142, 107720. [Google Scholar] [CrossRef] [Scilit]
  4. Banerjee, S.; Wolf, J.; Heijden, M.G.A. Keystone taxa as drivers of microbiome structure and functioning. Nat. Rev. Microbiol. 2018, 16, 567–576. [Google Scholar] [CrossRef] [Scilit] [PubMed]
  5. Cai, X.Y.; Liu, W.J.; Zhu, X.A.; Li, Y.; Zhang, L.; Wang, C. Tradeoffs between microbial life-history strategies drive soil carbon cycling during revegetation in karst ecosystems: A metagenomic perspective. J. Environ. Manag. 2025, 398, 113345. [Google Scholar] [CrossRef] [Scilit] [PubMed]
  6. Zhou, G.H.; Long, F.Y.; Zu, L.; Scott, J.; Peng, Y.; Zang, L.P.; Chen, D.M.; Zhang, G.Q.; Sui, M.Z.; He, Y.J.; et al. Stand spatial structure and microbial diversity are key drivers of soil multifunctionality during secondary succession in degraded karst forests. Sci. Total Environ. 2024, 937, 173504. [Google Scholar] [CrossRef] [Scilit] [PubMed]
  7. Peng, W.X.; Song, M.; Du, H.; Jiang, S.H.; Zeng, F.P.; Chen, H.J.; Song, T.Q. Assembly processes and networks of soil microbial communities along karst forest succession. Catena 2025, 248, 108574. [Google Scholar] [CrossRef] [Scilit]
  8. Sui, X.; Zhang, R.T.; Beat, F.; Yang, L.B.; Liu, Y.N.; Ni, H.W.; Li, M.H. Soil physicochemical properties drive the variation in soil microbial communities along a forest successional series in a degraded wetland in northeastern China. Ecol. Evol. 2021, 11, 2194–2208. [Google Scholar] [CrossRef] [Scilit] [PubMed]
  9. Saltonstall, K.; van Breugel, M.; Navia, W.; Hall, J.S. Soil microbial communities in dry and moist tropical forests exhibit distinct shifts in community composition but not diversity with succession. Microorganisms 2025, 13, 387. [Google Scholar] [CrossRef] [Scilit] [PubMed]
  10. Zhao, C.; Long, J.; Liao, H.K.; Zheng, C.L.; Li, J.; Liu, L.F.; Zhang, M.J. Dynamics of soil microbial communities following vegetation succession in a karst mountain ecosystem, Southwest China. Sci. Rep. 2019, 9, 2160. [Google Scholar] [CrossRef] [Scilit] [PubMed]
  11. Wang, L.; Zhou, Y.; Zhang, X.; Xu, M. Compartment-specific dynamics of soil microbiota along a Pinus armandii plantation chronosequence in karst mountain ecosystems. Front. Microbiol. 2025, 16, 1626892. [Google Scholar] [CrossRef] [Scilit] [PubMed]
  12. Xu, M.P.; Xi, J.Z.; Liu, Y.S.; Li, S.Q. Adaptation strategies of soil microorganisms in resource changes and stoichiometric imbalances induced by secondary succession on the loess plateau. J. Environ. Manag. 2024, 370, 122668. [Google Scholar] [CrossRef] [Scilit] [PubMed]
  13. Hou, M.T.; Zhang, G.Q.; Liu, Q.F.; Zhao, Y.Q.; Zang, L.P.; Chen, D.M.; Sui, M.Z.; He, Y.J.; Ding, F.J. Canopy gaps amplify stochastic assembly and reduce network complexity of soil microbial community in a karst forest. Catena 2025, 254, 109009. [Google Scholar] [CrossRef] [Scilit]
  14. Kang, Y.L.; Shen, L.J.; Li, C.F.; Huang, Y.; Chen, L.D. Increased soil multifunctionality is determined by altered bacterial–fungal–protistan compositions and co-occurrence network complexity during vegetation restoration in a Karst region, southwest China. J. Appl. Ecol. 2025, 62, 1216–1228. [Google Scholar] [CrossRef] [Scilit]
  15. Long, C.; Liu, R.L.; Ying, L.; Song, Y.S.; He, G.H.; Liu, Z.W. The effect of soil organic carbon composition on microbial population characteristics in acidified red soil area. Acta Sci. Circumstantiae 2024, 44, 377–388. [Google Scholar]
  16. He, G.X.; Peng, T.S.; Guo, Y.; Wen, S.Z. Forest succession improves the complexity of soil microbial interaction and ecological stochasticity of community assembly: Evidence from Phoebe bournei-dominated forests in subtropical regions. Front. Microbiol. 2022, 13, 1021258. [Google Scholar] [CrossRef] [Scilit] [PubMed]
  17. Wang, X.; Long, J.; Li, J.; Liu, L.F.; Liao, H.K.; Li, Y.R.; Yang, R. Diversity of Soil Eukaryotic Microbes in Different Succession Stages in Maolan Karst Forest of Guizhou. Environ. Sci. 2020, 41, 4314–4321. (In Chinese) [Google Scholar]
  18. Zhu, D.D.; Sheng, M.Y.; Liu, Y.Y.; Wang, L.J. Responses of Soil Microbial Community to Rocky Desertification Succession and Their Relationships With Plant Functional Diversity in Southwest China Karst Ecosystem. Ecol. Evol. 2026, 16, e73013. [Google Scholar] [CrossRef] [Scilit] [PubMed]
  19. Yu, P.J.; Tang, H.Y.; Sun, X.Z.; Shi, W.Y.; Pan, J.J.; Liu, S.W.; Jia, H.T.; Ding, Z.; Tang, X.G.; Chen, M. Afforestation alters soil microbial community composition and reduces microbial network complexity in a karst region of Southwest China. Land Degrad. Dev. 2024, 35, 2926–2939. [Google Scholar] [CrossRef] [Scilit]
  20. Chen, M.; Qin, H.L.; Liang, Y.M.; Xiao, D.; Yan, P.D.; Yin, M.S.; Pan, F.J. The phoD-Harboring Microorganism Communities and Networks in Karst and Non-Karst Forests in Southwest China. Forests 2024, 15, 341. [Google Scholar] [CrossRef] [Scilit]
  21. Gao, B.Y.; Xiao, D.; Yang, K.Y.; Sun, M.M.; Luo, S.T.; Zhang, W.; Wang, K.L. Increased vegetation disturbance intensity reduces soil nutrients while enhancing microbial network interactions. Front. Microbiol. 2025, 16, 1634424. [Google Scholar] [CrossRef] [Scilit] [PubMed]
  22. Lu, Z.X.; Wang, P.; Ou, H.B.; Wei, S.X.; Wu, L.C.; Jiang, Y.; Wang, R.J.; Liu, S.X.; Wang, Z.H.; Chen, L.J.; et al. Effects of different vegetation restoration on soil nutrients, enzyme activities, and microbial communities in degraded karst landscapes in southwest China. For. Ecol. Manag. 2022, 508, 120002. [Google Scholar] [CrossRef] [Scilit]
  23. Tang, H.; Ding, F.J.; Zhang, S.L.; Li, X.Y. Soil stoichiometric characteristics and influencing factors in karst forests at microtopography and microhabitat scales. Soil 2026, 12, 263–279. [Google Scholar] [CrossRef] [Scilit]
  24. Zu, L.; Zhou, G.H.; Long, F.Y.; Zang, L.P.; Chen, D.M.; Zhang, G.Q.; Sui, M.Z.; He, Y.J.; Liu, Q.F. Stochastic Processes Dominate Soil Microbial Community Assembly during the Restoration of Degraded Karst Forests. Forests 2024, 15, 594. [Google Scholar] [CrossRef] [Scilit]
  25. Bao, S.D. Soil Agrochemical Analysis, 3rd ed.; China Agriculture Press: Beijing, China, 2001; pp. 3–109. [Google Scholar]
  26. Parada-Pozo, G.; Bravo, L.A.; Sáez, P.L.; Cavieres, L.A.; Reyes-Díaz, M.; Abades, S.; Alfaro, F.D.; De la Iglesia, R.; Trefault, N. Vegetation drives the response of the active fraction of the rhizosphere microbial communities to soil warming in Antarctic vascular plants. FEMS Microbiol. Ecol. 2022, 98, fiac099. [Google Scholar] [CrossRef] [Scilit] [PubMed]
  27. Xu, N.; Tan, G.; Wang, H.; Gai, X. Effect of biochar additions to soil on nitrogen leaching, microbial biomass and bacterial community structure. Eur. J. Soil Biol. 2016, 74, 1–8. [Google Scholar] [CrossRef] [Scilit]
  28. Adams, R.I.; Miletto, M.; Taylor, J.W.; Bruns, T.D. Dispersal in microbes: Fungi in indoor air are dominated by outdoor air and show dispersal limitation at short distances. ISME J. 2013, 7, 1262–1273. [Google Scholar] [CrossRef] [Scilit] [PubMed]
  29. Edgr, R.C. UPARSE: Highly accurate OTU sequences from microbial amplicon reads. Nat. Methods 2013, 10, 996–998. [Google Scholar] [CrossRef] [Scilit] [PubMed]
  30. Dixon, P. VEGAN, a package of R functions for community ecology. J. Veg. Sci. 2003, 14, 927–930. [Google Scholar] [CrossRef]
  31. Jiang, S.H.; Song, M.; Du, H.; Li, Z.; Wang, Y.; Zhang, L. Soil Properties Regulate Soil Microbial Communities During Forest Succession in a Karst Region of Southwest China. Microorganisms 2024, 12, 2136. [Google Scholar] [CrossRef] [Scilit] [PubMed]
  32. Porter, T.M.; Smenderovac, E.; Morris, D.; Venier, L. All boreal forest successional stages needed to maintain the full suite of soil biodiversity, community composition, and function following wildfire. Sci. Rep. 2023, 13, 7978. [Google Scholar] [CrossRef] [Scilit] [PubMed]
  33. Zhang, M.X.; Sayer, E.J.; Ye, J.; Yuan, Z.Q.; Lin, F.; Hao, Z.Q.; Fang, S.; Mao, Z.K.; Jiang, P.C.; Zhu, M.H.; et al. Tree mycorrhizal associations regulate relationships between plant and microbial communities and soil organic carbon stocks at local scales in a temperate forest. Funct. Ecol. 2025, 39, 1550–1566. [Google Scholar] [CrossRef] [Scilit]
  34. Lin, Y.; He, Y.J.; He, M.H.; Wu, C.Y.; Fang, Z.Y. Diversity of arbuscular mycorrhizal fungi in soil during karst vegetation succession. Acta Ecol. Sin. 2022, 42, 3315–3324. (In Chinese) [Google Scholar]
  35. Zhao, A.; Wen, X.; He, X.; Duan, P.; Xiao, K.; Li, D. Forest recovery suppresses soil microbial carbon use efficiency via geochemical and biotic constraints in a subtropical karst region. J. Plant Ecol. 2026, rtag123. [Google Scholar] [CrossRef] [Scilit]
  36. Yang, W.; Diao, L.F.; Wang, Y.Q.; Yang, X.T.; Zhang, H.; Wang, J.S.; Luo, Y.Q.; An, S.Q.; Cheng, X.L. Responses of soil fungal communities and functional guilds to ~160 years of natural revegetation in the Loess Plateau of China. Front. Microbiol. 2022, 13, 967565. [Google Scholar] [CrossRef] [Scilit] [PubMed]
  37. Pan, F.J.; Liang, Y.M.; Wang, K.L.; Zhang, W. Responses of Fine Root Functional Traits to Soil Nutrient Limitations in a Karst Ecosystem of Southwest China. Forests 2018, 9, 743. [Google Scholar] [CrossRef] [Scilit]
  38. Luo, W.X.; Wang, P.; Liu, J.C.; Tao, J.P. Microbial keystone taxa and network complexity, rather than diversity, sustain soil multifunctionality along an elevational gradient in a subtropical karst mountain. Catena 2025, 256, 109115. [Google Scholar] [CrossRef] [Scilit]
  39. Chen, M.; Feng, Q.H.; Li, J.; Wang, Y.; Zhang, H.; Liu, X. The effects of subalpine forest succession on soil fungal community composition and diversity vary with soil depth and trophic mode on the eastern Qinghai-Tibetan Plateau. J. Fungi 2025, 11, 881. [Google Scholar] [CrossRef] [Scilit] [PubMed]
  40. Masumoto, S.; Kitagawa, R.; Nishizawa, K.; Kaneko, R.; Osono, T.; Hasegawa, M.; Matsuoka, S.; Uchida, M.; Mori, A.S. Functionally explicit partitioning of plant β-diversity reveal soil fungal assembly in the subarctic tundra. FEMS Microbiol. Ecol. 2021, 97, fiab129. [Google Scholar] [CrossRef] [Scilit] [PubMed]
  41. Luo, L.; Luo, R.Y.; Liu, Q.H.; Du, L.; Zhu, Y.; Wang, E.T.; Pang, X.Y.; Yin, C.Y. Parallel responses of gross nitrogen mineralization rate and related functional gene abundance along subalpine secondary succession. J. Appl. Ecol. 2026, 63, e70340. [Google Scholar] [CrossRef] [Scilit]
  42. Veresoglou, S.D.; Lambers, H. Does the mycorrhizal mediation hypothesis capture biogeographical patterns in plant-soil feedback? The case of conspecific negative density dependencies. Soil Ecol. Lett. 2025, 7, 250293. [Google Scholar] [CrossRef] [Scilit]
  43. Li, Y.Y.; Tang, Q.; Yuan, C.J.; Zhu, S.X.; Ye, Y.Y.; Wu, P.; Cui, Y.C.; Ding, F.J. Changes in Community Structure and Functional Characteristics of Soil Bacteria and Fungi along Karst Vegetation Succession. Forests 2023, 14, 1562. [Google Scholar] [CrossRef] [Scilit]
  44. Li, J.; Huang, X.B.; Li, S.F.; Tang, R.; Su, J.R. Microbial network complexity and diversity together drive the soil ecosystem multifunctionality of forests during different woodland use intensity in dry and wet season. For. Ecol. Manag. 2023, 542, 121086. [Google Scholar] [CrossRef] [Scilit]
  45. Pena, R.; Anderson, I.C.; Treseder, K.K. Unravelling the facilitation-competition continuum among ectomycorrhizal and saprotrophic fungi. Soil Biol. Biochem. 2025, 203, 109087. [Google Scholar] [CrossRef] [Scilit]
  46. Tian, Y.; Yang, H.L.; Zeng, Q. Analysis of fungal community structure and co-occurrence networks across vegetation types in volcanic lava habitats. Front. Fungal Biol. 2025, 6, 1760883. [Google Scholar] [CrossRef] [Scilit] [PubMed]
  47. Zhang, X.Y.; Zhao, W.Q.; Liu, Y.J.; He, H.L.; Kou, Y.P.; Liu, Q. Dominant plant species and soil properties drive differential responses of fungal communities and functional in the soils and roots during secondary forest succession in the subalpine region. Rhizosphere 2022, 21, 100483. [Google Scholar] [CrossRef] [Scilit]
  48. Chen, D.H.; Duan, Y.; Liu, D.; Wang, F.; Cui, X.Y.; Xu, Z.H.; Che, R.X. Priority effects largely determine the consequences of soil microbial community coalescence. Geoderma 2025, 463, 117592. [Google Scholar] [CrossRef] [Scilit]
  49. Shi, Z.; Zhang, Y.Y.; Cheng, H.R.; Liu, W.X.; Guo, H.C.; Zhang, H.L.; Dang, Y.P.; Bai, W.; Zhao, X. Degradation dynamics of saflufenacil and tiafenacil in agricultural soils and their impacts on soil microbial networks and carbon–nitrogen cycling. Pestic. Biochem. Physiol. 2026, 222, 107205. [Google Scholar] [CrossRef] [Scilit] [PubMed]
  50. Lan, J.C.; Jiang, Y.X.; Huang, M.Z. Vegetation restoration enhances soil organic carbon accumulation in Southwest China’s karst region: The role of aggregation, calcium, and microbes. Catena 2025, 257, 109184. [Google Scholar] [CrossRef] [Scilit]
  51. Jana, V.; Baldrian, P. Fungal community on decomposing leaf litter undergoes rapid successional changes. ISME J. 2013, 7, 477–486. [Google Scholar] [CrossRef] [Scilit] [PubMed]
  52. Sha, G.L.; Chen, Y.X.; Wei, T.X.; Guo, X.; Yu, H.; Jiang, S.; Xin, P.C.; Ren, K. Responses of soil microbial communities to vegetation restoration on the Loess Plateau of China: A meta-analysis. Appl. Soil Ecol. 2023, 189, 104910. [Google Scholar] [CrossRef] [Scilit]
  53. Huang, T.Z.; Wang, Y.Y.; Wang, X.M.; Ma, L.; Yang, X.T. Discrepant diversity patterns and function of bacterial and fungal communities on an earthquake-prone mountain gradient in Northwest Sichuan, China. Front. Microbiol. 2023, 14, 1217925. [Google Scholar] [CrossRef] [Scilit] [PubMed]
  54. Wang, W.Y.; Peng, P.Q.; Li, J.N.; Liao, X.H.; Zhang, W.; Wang, K.L.; Zhao, J. Effects of Vegetation Succession on Soil Microbial Communities on Karst Mountain Peaks. Forests 2024, 15, 586. [Google Scholar] [CrossRef] [Scilit]
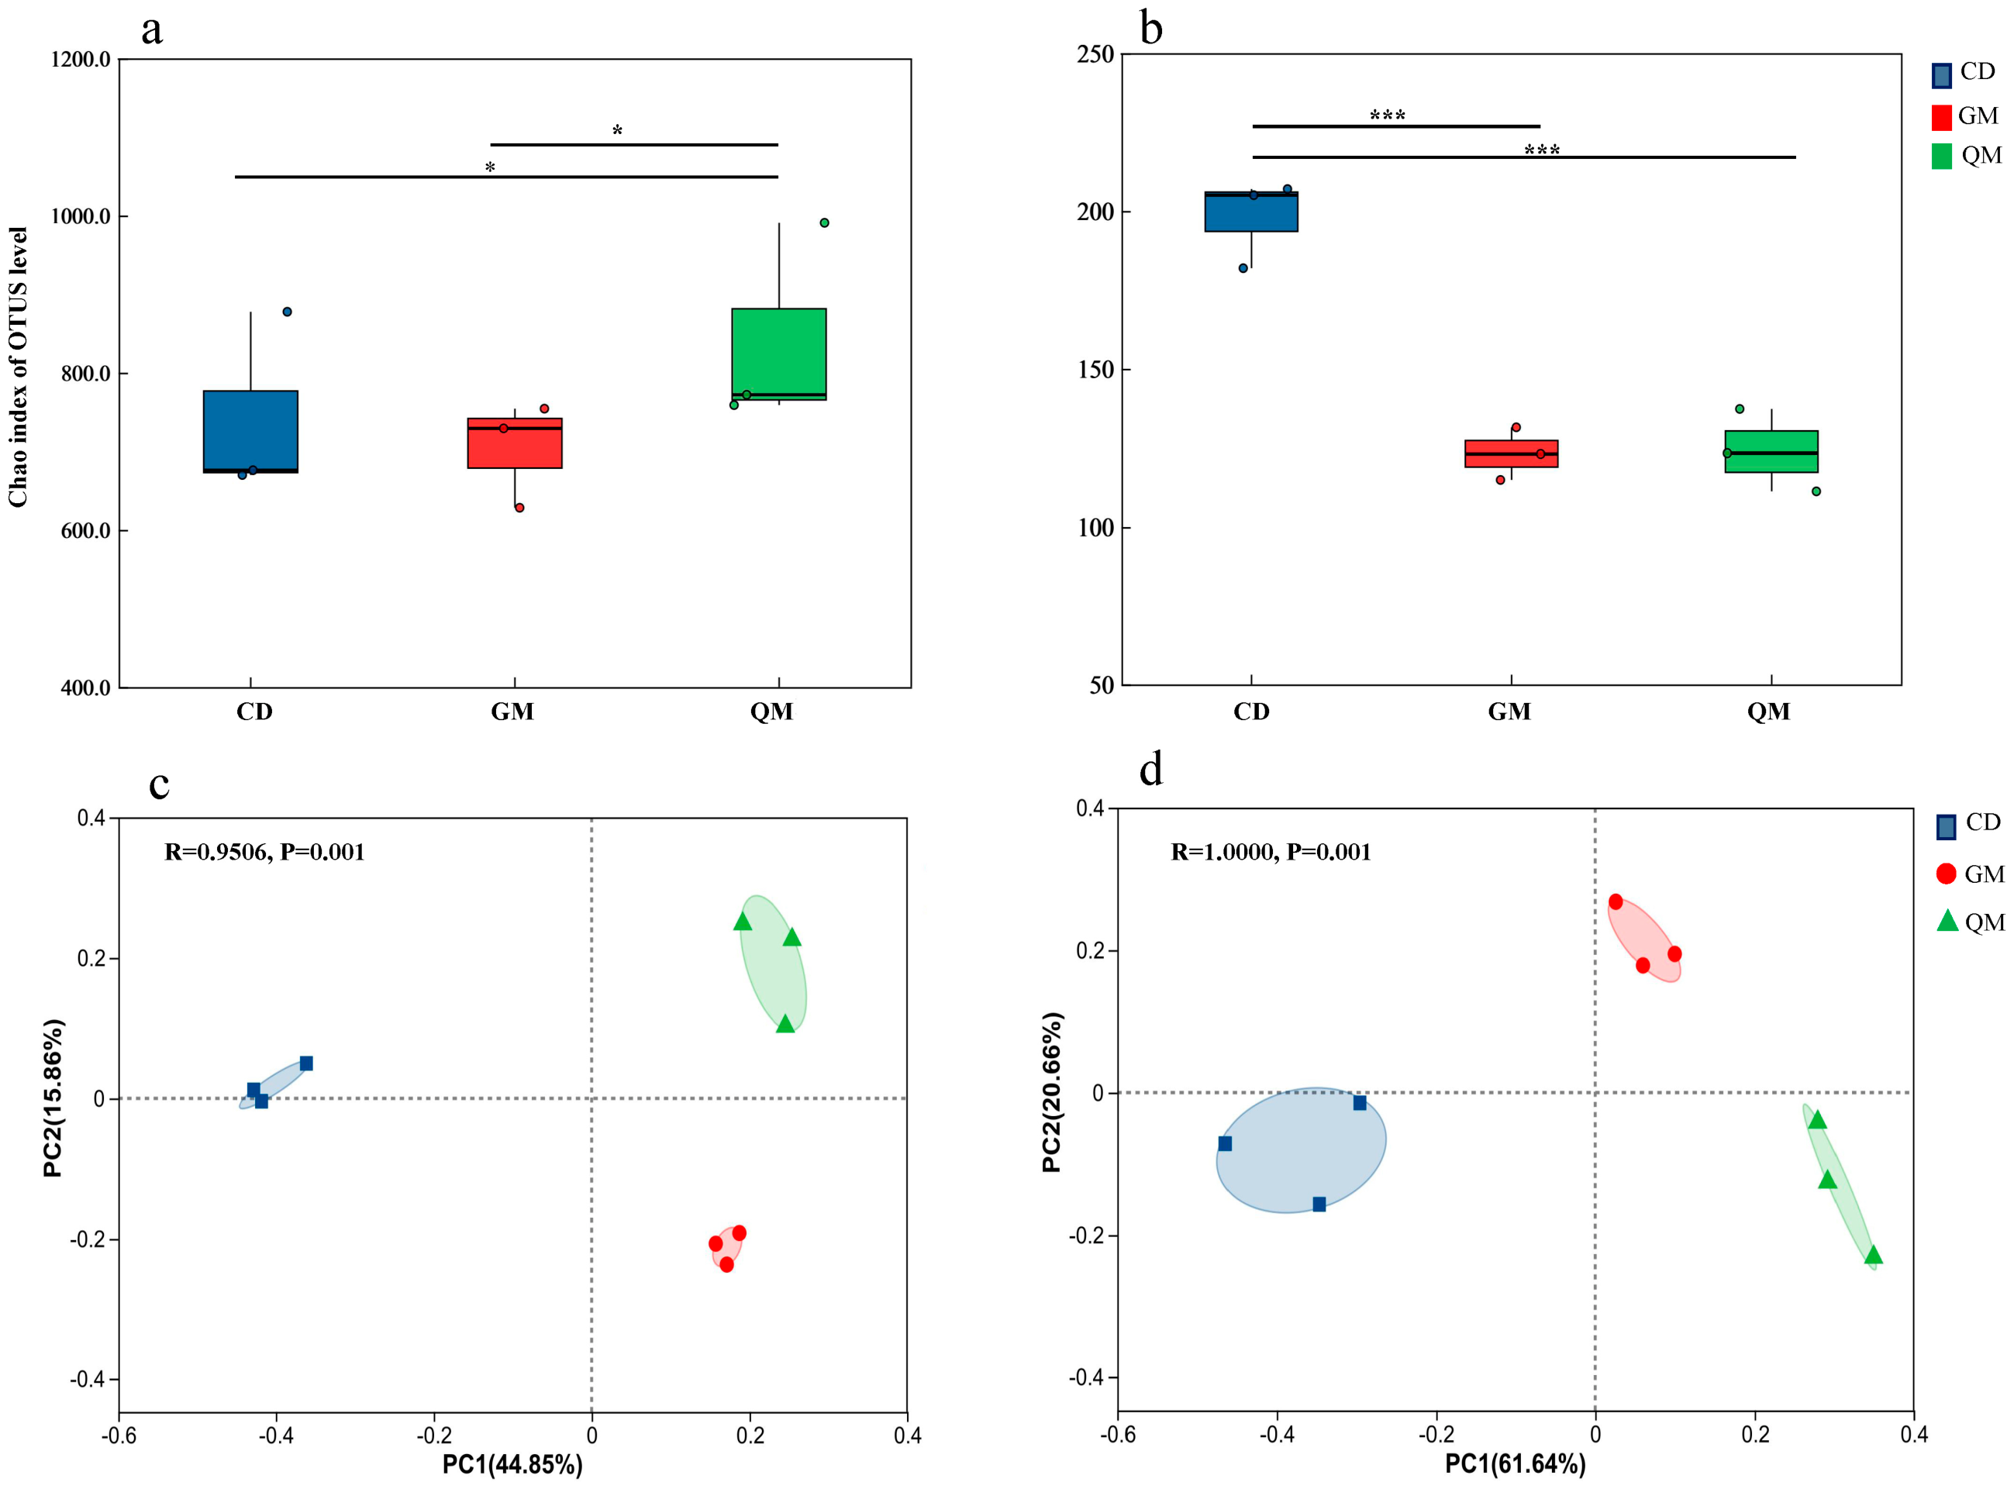
Figure 1. Variations in soil microbial diversity at the OTU level during different forest succession. CD: grassland stage; GM: shrub stage; and QM: arbor stage. (a,b) represent the Chao diversity index of bacteria and fungi, respectively. (c,d) represent the β diversity of bacteria and fungi, respectively. Asterisks represent significant differences between the different forest succession (*** p < 0.001, * 0.01 ≤ p < 0.05).
Forests 17 00981 g001
Figure 2. Soil microbial community composition during different forest succession stages. CD: grassland stage; GM: shrub stage; and QM: arbor stage. (a,c) represent the community composition of bacteria and fungi at the family level, respectively, with taxa having an abundance of less than 0.01 merged into “others”. (b,d) represent the upset plots of bacteria and fungi, respectively. The bar chart on the left shows the total number of species at each forest succession; a single dot on the right indicates the number of unique species in a specific forest succession, and the lines connecting the dots represent the intersections between different forest succession; the vertical bar charts show the number of shared species corresponding to each intersection.
Forests 17 00981 g002
Figure 3. Analysis of soil microbial species differences during different forest succession. CD: grassland stage; GM: shrub stage; and QM: arbor stage. (a,b) represent the species difference plots of bacteria and fungi, respectively, with the Kruskal–Wallis test used as the statistical method. (c,d) represent the analysis plots of species with significant differences in bacteria and fungi, respectively. Asterisks represent significant differences between the different forest succession (*** p < 0.001, ** 0.001 ≤ p < 0.01, * 0.01 ≤ p < 0.05).
Forests 17 00981 g003
Figure 4. Soil microbial network analysis during different forest succession stages. CD: grassland stage; GM: shrub stage; and QM: arbor stage. The lines between species means correlations, green bar means negative relation, red bar means positive relation. Construct a univariate correlation network diagram using the thresholds of correlation coefficient R > 0.6 and significance level p < 0.05.
Forests 17 00981 g004
Figure 5. Relationship between soil microbial communities and soil properties. CD: grassland stage; GM: shrub stage; and QM: arbor stage. BD: soil bulk density; SOC: soil organic carbon; TN: total nitrogen; TP: total phosphorus. (a,b) represent the RDA plots of bacteria and fungi, respectively. (c,d) represent the spearman correlation heatmaps of bacteria and fungi, respectively. Red indicates a positive correlation between soil microorganisms and environmental factors, while blue represents a negative correlation; darker colors correspond to stronger correlation coefficients. Asterisks represent significant differences between the textures (*** p < 0.001, ** 0.001 ≤ p < 0.01,* 0.01 ≤ p < 0.05). Statistical significance was analyzed using an unpaired two-sided t-test.
Forests 17 00981 g005
Table 1. Basic information of the sample site. CD: grassland stage; GM: shrub stage; and QM: arbor stage.
Succession
Stages
Altitude
(m)
Aspect/
Slope Position
Dominant SpeciesParent BedrockSoil ClassArea
(m2)
CD840NWPteridium revolutum, Imperata cylindrical var. major, Pogonatherum crinitum, Trisetum bifidumDolomitic limestoneCalcareous soil2 × 5
GM820SWPyracantha fortuneana, Nandina domestica, Lindera communis, Myrsine semiserrata, Clausena dunniana, Ulmus parvifoliaDolomitic limestoneCalcareous soil4 × 10
QM840SWSwida wilsoniana, Machilus chienkweiensis, Lindera communis, Cladrastis platycarpa, Choerospondias axillaris, Pittosporum brevicalyxDolomitic limestoneCalcareous soil20 × 20
Table 2. Basic properties of the experimental soils. CD: grassland stage; GM: shrub stage; and QM: arbor stage. BD: soil bulk density; TOC: total organic carbon; TN: total nitrogen; TP: total phosphorus. Different lowercase letters indicate a significant difference (p < 0.05) among different succession stages for soil property. Contents are reported as mean ± SE.
Succession StagespHBD
(g·cm−3)
TOC
(g·kg−1)
TN
(g·kg−1)
TP
(g·kg−1)
C/PC/NN/P
CD7.34 ± 0.18 a1.31 ± 0.06 a28.34 ± 6.87 c1.57 ± 0.07 b0.36 ± 0.02 c80.42 ± 22.71 b18.11 ± 4.70 a4.43 ± 0.29 c
GM7.63 ± 0.17 a1.25 ± 0.04 a65.30 ± 15.58 b6.75 ± 1.06 a1.01 ± 0.24 a66.30 ± 17.74 c8.62 ± 2.52 b7.89 ± 1.42 a
QM7.23 ± 0.14 a1.19 ± 0.27 a85.22 ± 9.03 a7.55 ± 0.26 a0.77 ± 0.06 ab111.43 ± 11.90 a18.82 ± 2.69 a5.98 ± 0.64 b
Table 3. Correlative parameters of network in different forest succession. CD: grassland stage; GM: shrub stage; and QM: arbor stage.
MicroorganismSuccession StagesEdgesNodesNegativeProportion
(%)
PositiveProportion
(%)
BacteriaCD448022284318.81363781.19
GM7587298264334.84494465.16
QM15,801398300118.9912,80081.01
FungiCD263717353520.29210279.71
GM101510814113.8987486.11
QM139012821515.47117584.53
Disclaimer/Publisher’s Note: The statements, opinions and data contained in all publications are solely those of the individual author(s) and contributor(s) and not of MDPI and/or the editor(s). MDPI and/or the editor(s) disclaim responsibility for any injury to people or property resulting from any ideas, methods, instructions or products referred to in the content.