Article

Thinning Effects on Trade-Offs and Relative Benefits Among Forest Ecosystem Services in a Pinus koraiensis Plantation on Mt Gari, Republic of Korea


Division of Forest Ecology, National Institute of Forest Science, Seoul 02445, Republic of Korea
*
Author to whom correspondence should be addressed.
Forests 2026, 17(8), 949; https://doi.org/10.3390/f17080949
Submission received: 6 July 2026 / Revised: 2 August 2026 / Accepted: 7 August 2026 / Published: 11 August 2026

Abstract

Forest thinning is a critical silvicultural practice for managing forest structure and enhancing various ecosystem services, yet its long-term impacts on trade-offs among these services remain complex. This study evaluated ecosystem services 17 years after thinning (applied in 2007) in a 40-year-old Pinus koraiensis plantation on Mt. Gari, Republic of Korea, to evaluate the effects of thinning on ecosystem services and to examine the magnitude of trade-offs between ecosystem services across different thinning treatments. Three thinning treatments were implemented in 2007: (1) control, (2) light thinning (~35% removal of stand density), and (3) heavy thinning (~65% removal of stand density). A total of 12 plots were established to assess ecosystem services 17 years after thinning. Measured variables included aboveground carbon storage (trees), understory species richness (shrubs and herbs), soil moisture, soil organic carbon, and total soil nitrogen. Relative benefits and trade-offs were quantified using standardization and root mean square error, and differences across treatments were tested using one-way. Relative benefits and trade-offs were analyzed to assess the effects of thinning on ecosystem services and how relationships among ecosystem services changed across treatments. Significantly higher aboveground carbon storage was observed in the control plot than in the other plots. The heavy-thinning plots showed the highest values for species richness and soil moisture, whereas the light-thinning plots showed the highest values for soil organic carbon and total soil nitrogen. Generally, high trade-offs were observed for pairs involving aboveground carbon storage, while pairs involving species richness showed lower trade-offs. To detect clear relationships among ecosystem services, further in-depth research and long-term monitoring are required to identify complex interactions and trade-offs.

1. Introduction

Ecosystems provide a wide range of goods and services that directly and indirectly support human well-being. These ecosystem services (ESs) are commonly classified into four categories: (1) provisioning services, such as timber, fresh water, and biomass; (2) regulating services, such as carbon storage, water purification, and climate regulation; (3) supporting services, such as biodiversity, habitat provision, and nutrient cycling; and (4) cultural services, such as recreation and ecotourism [1].
Human activities that tend to maximize certain ESs, such as timber and food, may lead to unintentional decreases in other ESs, which is recognized as a trade-off (TO). TO is defined as a situation in which one ES increases while other ESs decrease. In contrast, synergy is a situation in which two or more ESs increase or decrease together [2,3]. For instance, TOs were observed between global climate regulation and biodiversity at all three restoration sites from early to late stages, indicating increases in global climate regulation with decreases in biodiversity [4], and Lu et al. [5] found not only TO between understory plant diversity and soil total nitrogen, but also synergy between soil organic carbon and soil total nitrogen at young stands. In a broader sense, TO also refers to unidirectional changes with an uneven pace or rate in ESs [5].
Thinning is a forest management practice commonly implemented to enhance ESs such as growth [6], timber production [7], species diversity [8], carbon uptake [9], and soil nutrient cycling [10]. By reducing tree density, thinning increases forest gaps; reduces competition for nutrients, light, and water; and alters the forest floor’s microclimate, thereby influencing tree growth, health status, and species diversity [8,11,12]. The impact of thinning on synergies and trade-offs among ecosystem services varies with intensity. Burton et al. [13] observed that the relationship between species richness for vascular plant species and total aboveground carbon storage varied with residual stand density, showing a positive relationship under high residual density (300 trees ha−1) and a negative relationship under low residual density (200 trees ha−1). Moreover, in a Pinus massoniana plantation, synergistic relationships between carbon sequestration (defined as total above- and belowground tree carbon storage) and biodiversity (defined as stand structural size diversity) were observed in plots subjected to 65% and 80% thinning (based on stand stocking intensity). Yet, this relationship was inconsistent in plots subjected to 70% thinning 9 years post-thinning, likely driven by dynamic recovery processes, density thresholds, and competitive shifts [14]. Therefore, the relationship between thinning intensity and the synergies and trade-offs among ecosystem services is not straightforward, but rather context-dependent and potentially non-linear across varying thinning intensities.
In Republic of Korea, the nation’s total forestland covers 6,298,134 ha, within which coniferous forests account for 37%, with pine species comprising approximately 75% of the coniferous forest area, and P. koraiensis stands cover 151,579 ha. [15]. Distributed throughout Northeast China, Korea, Russia, and Japan, P. koraiensis is important ecologically and economically [16]. This species is highly valuable for producing timber products and edible nuts [17]. Furthermore, its shade tolerance allows it to endure low-light environments, and its physiological attributes enable it to establish dominance during the climax successional stage [18]. Given its high value, P. koraiensis has been extensively researched across multiple subjects, including biomass and carbon sequestration [19,20], ecophysiology [21], nutrient cycling [22,23], and drought resilience [24]. Nonetheless, comprehensive data on the long-term effects of thinning on relationships among ESs within P. koraiensis plantations in Republic of Korea remain scarce.
Although a previous study [6] examined the short-to-medium-term trade-offs between aboveground carbon storage and species richness up to 2021, comprehensive assessments incorporating belowground soil properties (such as soil organic carbon, total nitrogen, and soil moisture) over a longer temporal scale (17 years post-thinning) remain scarce. Therefore, this study aimed to (1) evaluate the long-term responses of individual ecosystem services (ESs) to thinning 17 years post-treatment, (2) compare differences in ESs across varying thinning intensities, and (3) quantify the magnitude of trade-offs and relative benefits among paired ESs.

2. Materials and Methods

2.1. Site Description

The study was carried out in an approximately 40-year-old P. koraiensis plantation on Mt. Gari, Chuncheon City, Gangwon Province, Republic of Korea (37°52′49.12 N, 127°52′30.11 E). The P. koraiensis plantation was originally established in the early 1980s, covering 18 ha. The mean annual air temperature was 11.1 °C (±0.12 °C), ranging from −4.6 °C to 24.6 °C, and mean annual precipitation was 1347.3 mm (±70.8 mm) from 2000 to 2020 [6]. The soil type was dry, brown forest soil with a shallow depth and low organic content [22]. Precommercial thinning (~25% reduction in stand density) was applied uniformly across the entire study area in 2002 before establishing study plots. Additionally, the uniform precommercial thinning applied in 2002 (~25% reduction in stand density) served as a preconditioning factor that shaped the uniform initial stand conditions prior to the experimental thinning treatments initiated in 2007–2008.
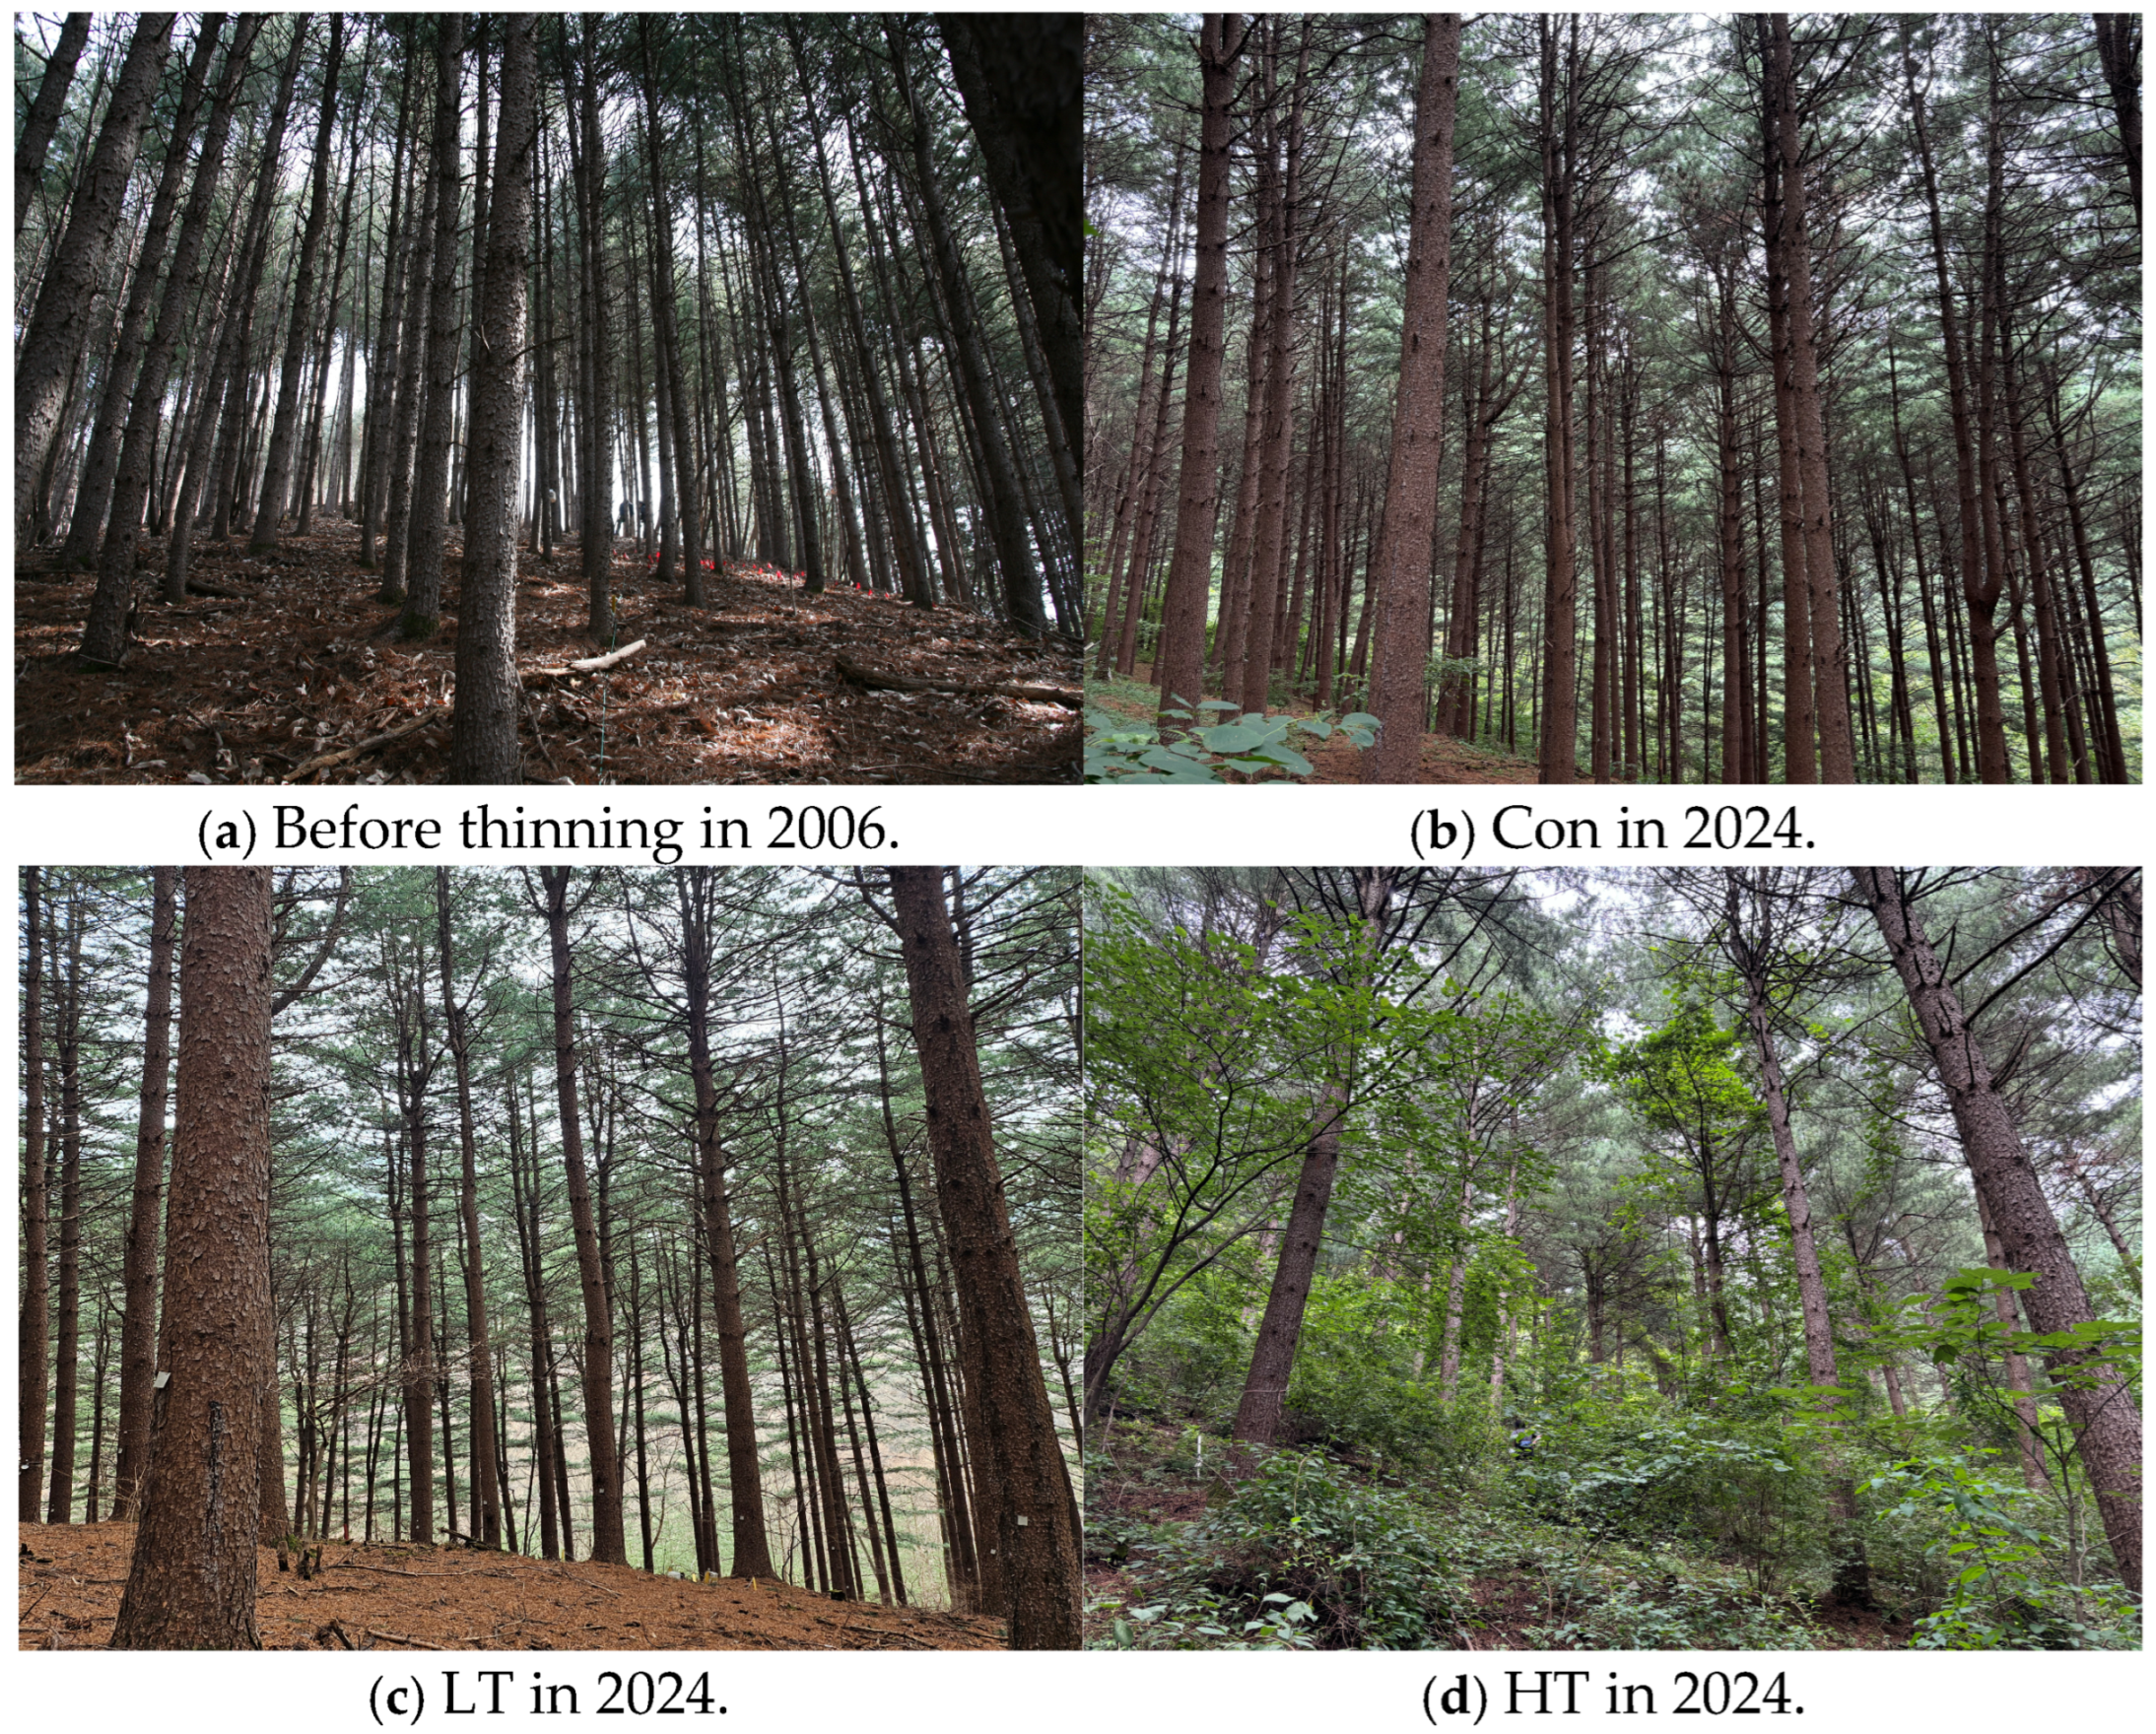
To conduct this research, the study plots were established between 2005 and 2006. Their elevation ranged from 430 to 500 m above sea level, with generally a west-facing aspect and slopes between 10° and 26° P. koraiensis was the dominant woody species with a mean diameter at breast height (DBH: 1.2 m) of 22.5 cm and a stand density of 572.3 trees ha−1. In 2006, four 20 m × 20 m plots were established for each of the three thinning treatments, for a total of 12 plots. Experimental thinning was conducted from March 2007 to March 2008, and all harvested trees were completely removed from the site. This intervention was implemented as below thinning. To achieve the target thinning intensities, residual spacing was strictly maintained, requiring at least 3 m between trees in the light-thinning plots (LT, ~35% reduction in stand density) and at least 5 m in the heavy-thinning plots (HT, ~65% reduction in stand density) (Table 1; Figure 1).

2.2. Forest Inventory and Vegetation Survey

Forest inventories were conducted at three distinct intervals: before thinning in 2006, after thinning in 2008, and during the long-term monitoring period in June 2024. In each 20 m × 20 m plot, the DBH and height of individual trees (≥6 cm in DBH) were measured to estimate aboveground biomass (AGB) and aboveground carbon storage (AGC). Tree DBH and height were measured with DBH tapes (KDS, Kyoto, Japan) and a hypsometer (Vertex 5, Haglöf, Långsele, Sweden), respectively. Understory vegetation surveys were conducted in July 2006, July 2008, and specifically on 15 July 2024, following the end of the monsoon season. Within each 20 m × 20 m plot, all understory vegetation, including shrubs and herbs, was surveyed using the Braun–Blanquet approach [25]. Plant species were identified following the standard taxonomic reference provided by the Korea National Arboretum [26]. Species richness was determined by counting the total number of species recorded within each plot.

2.3. Aboveground Carbon Storage Calculation

Aboveground biomass (AGB) was calculated using the equations below [27].
Stem (kg) = 0.064(DBH)2.377
Branch (kg) = 0.621(DBH)1.395
Leaf (kg) = 0.025(DBH)2.175
The AGB was calculated as the sum of the three compartments from the equations. Aboveground carbon storage (AGC) was calculated by multiplying the biomass by the carbon coefficient (0.5).

2.4. Soil Sampling

Soil samples were collected to assess soil chemical properties and soil moisture. Four soil pits were randomly selected in each plot, and approximately 300 g of soil was collected from the 0–20 cm depth in each pit. The collected soil samples were sealed in plastic bags and stored in a refrigerator. The samples were sent to the National Instrumentation Center for Environmental Management (NICEM) at Seoul National University in Korea. Analyses included soil organic matter (OM), total soil nitrogen (TN), and soil moisture (SM) (Table 2). Soil organic carbon (SOC) was calculated by dividing OM by 1.724.

2.5. Relative Benefits and Trade-Offs

We quantified relative benefits (RBs) and trade-offs (TOs) using standardization and root mean square error (RMSE), following Bradford and D’Amato [28]. This method is a simple and effective way to quantify the degree of trade-offs between two or more ecosystem services. Data standardization is required to calculate the trade-off because it eliminates unit differences among ecosystem services. The standardization equation is provided below.
ESstd = (ESobs − ESmin)/(ESmax − ESmin)
where ESstd represents a standardized ES value, ranging from 0 to 1. ESobs, ESmin, and ESmax indicate the observed, minimum, and maximum values, respectively. Total relative benefit (TRB) was calculated as the sum of the individual ESstd values.
The RMSE equation is below.
RMSE = 1 n 1 i = 1 n ( ES i ES ¯ ) 2
where ESi and ES ¯ indicate the standardized value of the ith ES and the expected value of the i number of ESs, respectively.
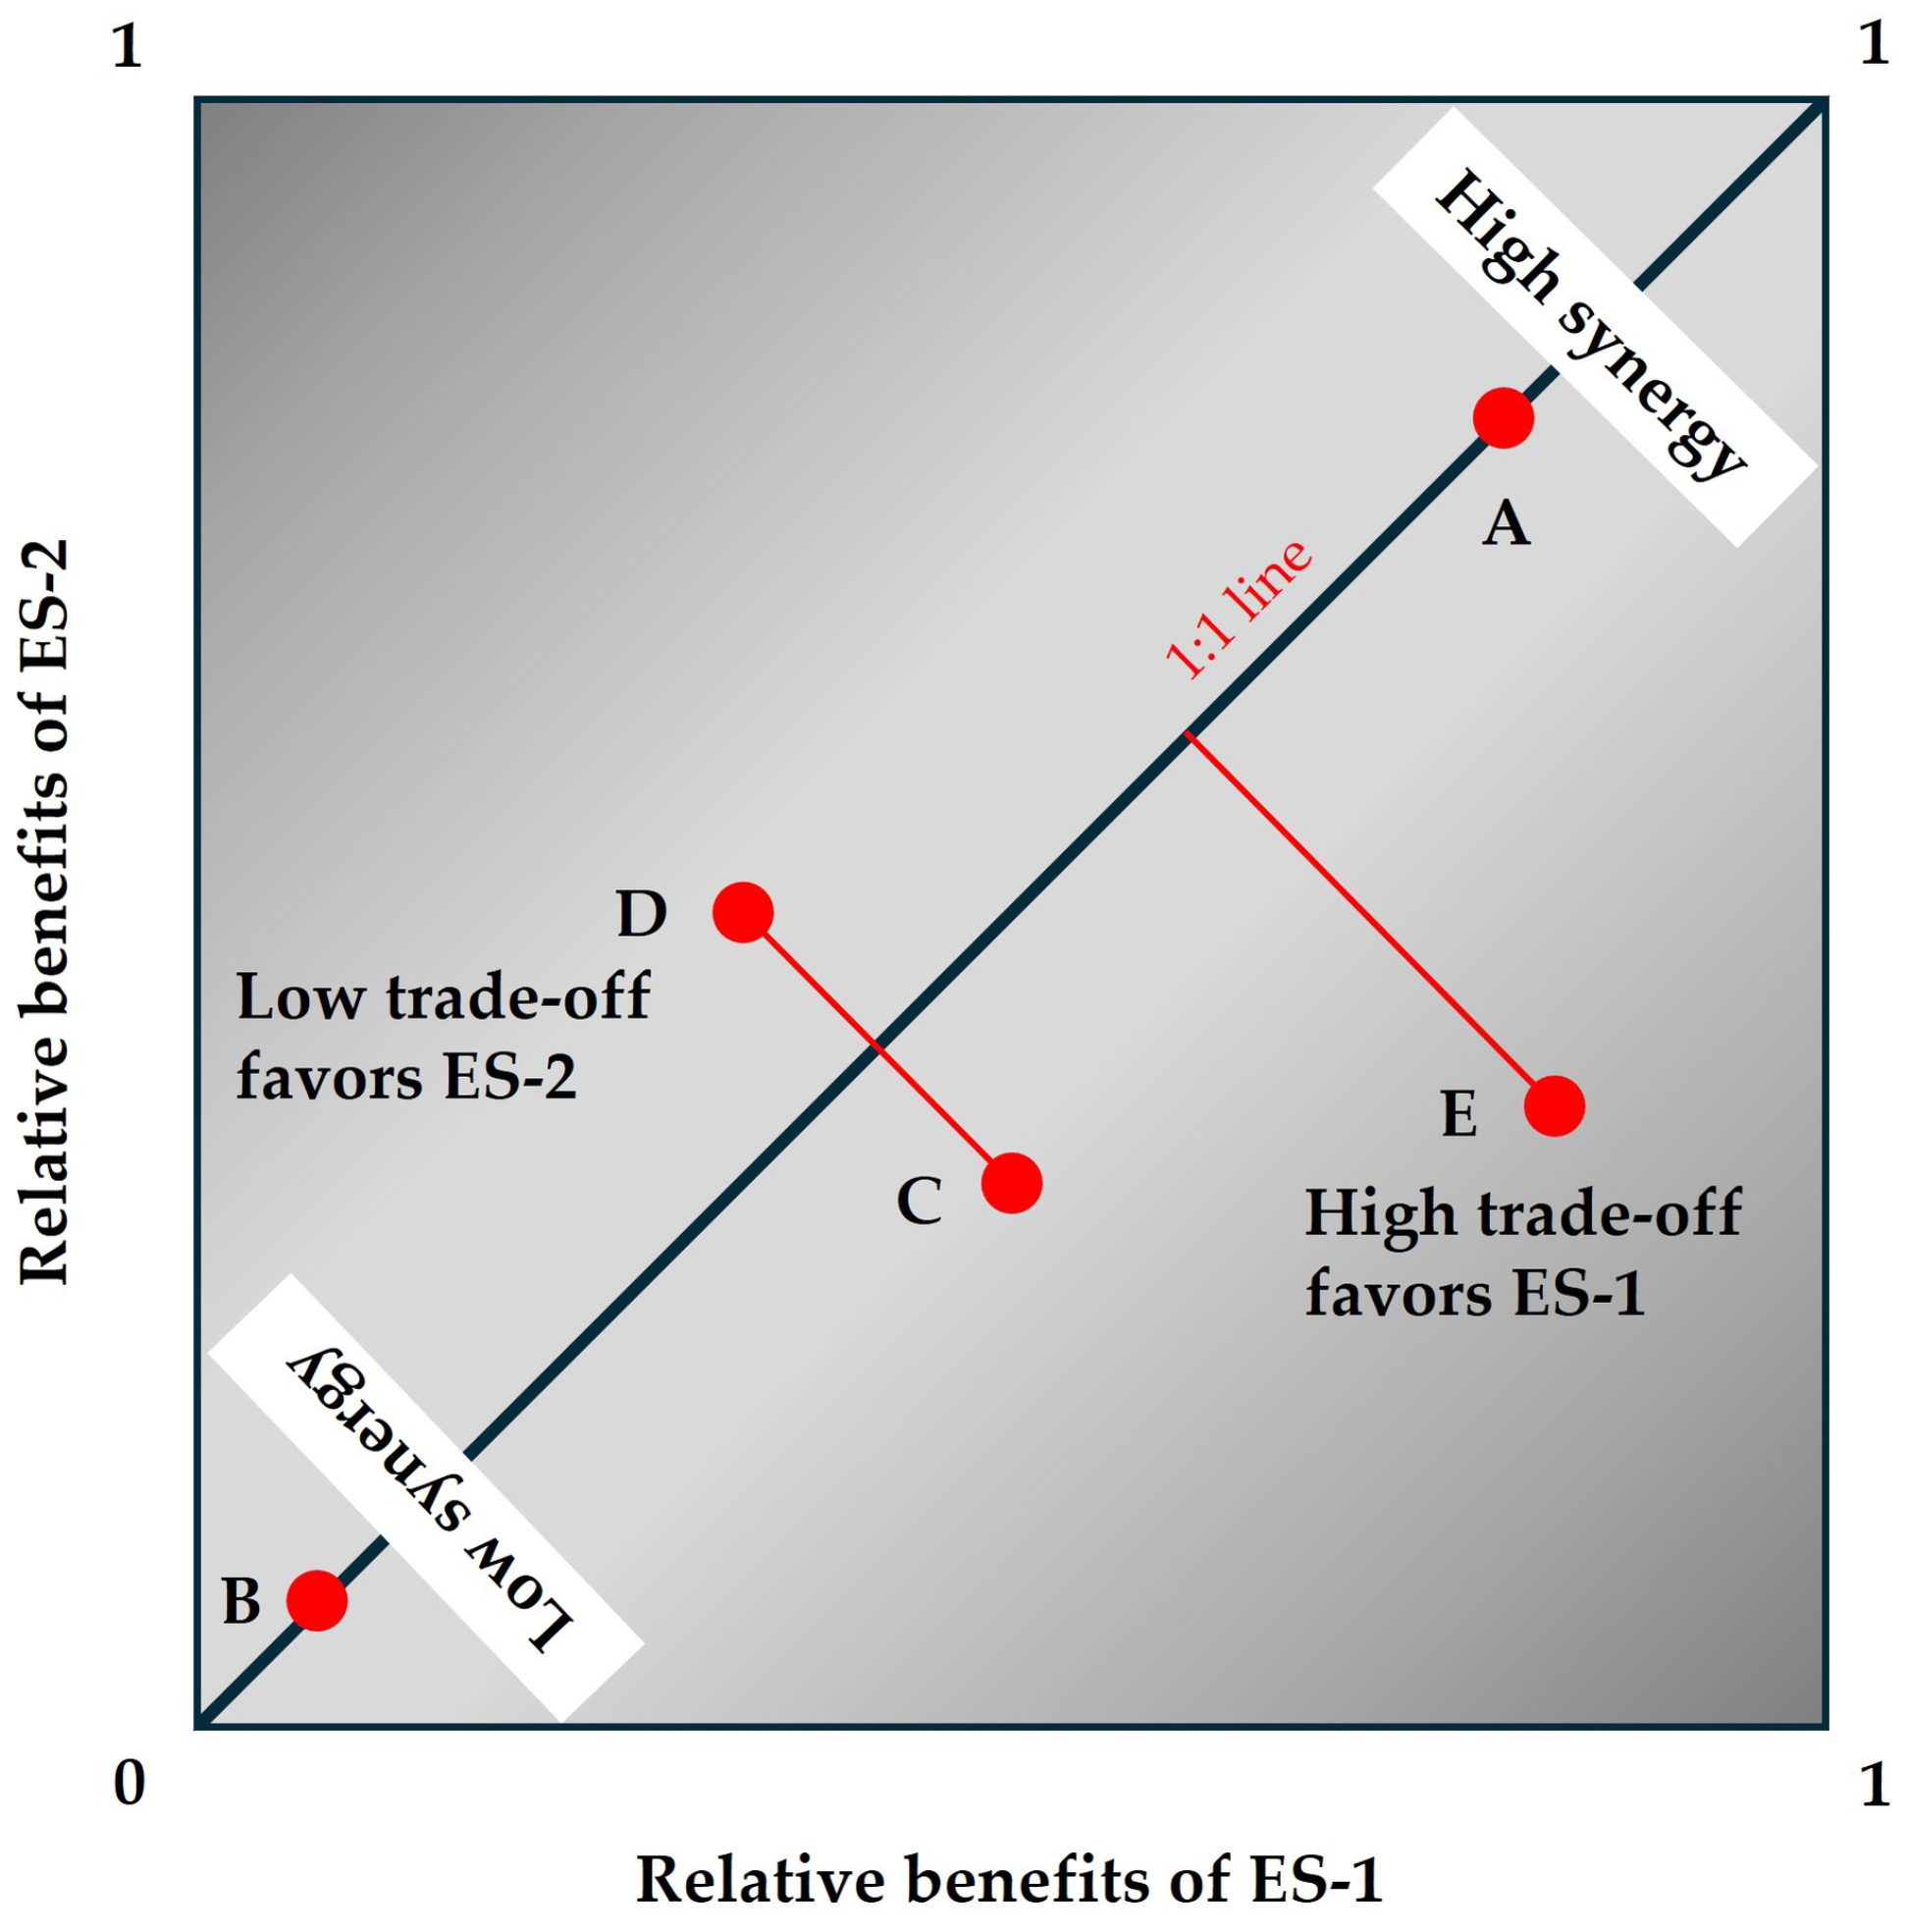
Bradford and D’Amato [28] proposed a diagram describing TOs between two ESs (Figure 2). The magnitude of TO between two ESs is calculated using RMSE. The distance between the coordinates of paired ESs and the 1:1 line represents TO. The longer the distance between the coordinate and the 1:1 line, the greater the TO. Point A on the diagram, lying on the 1:1 line, represents zero TO, with high synergy. Point B also exhibits zero TO but with low synergy. The distances between the 1:1 line and points C and D are equal, indicating that the degrees of the TOs are the same but in opposite directions. The magnitude of point E’s TO is greater than that of point D’s TO. Additionally, the relative position to the 1:1 line represents which ES is more beneficial. Points C and D favor ES-1 and ES-2, respectively. Point E offers greater benefit for ES-1 than point C, accompanied by a higher TO (Figure 2).

2.6. Statistical Analyses

Differences in the obtained values, relative benefits, and trade-offs across the three treatments were analyzed using one-way ANOVA after confirming normality and homogeneity of variances. After ANOVA, a post hoc comparison was performed using the Tukey HSD test (α = 0.05). Pearson’s correlation coefficient was used to test relationships among variables. All statistical analyses were performed using R (version 4.1.2; R Core Team, Vienna, Austria).

3. Results

3.1. Stand Structure and DBH Frequency Distribution

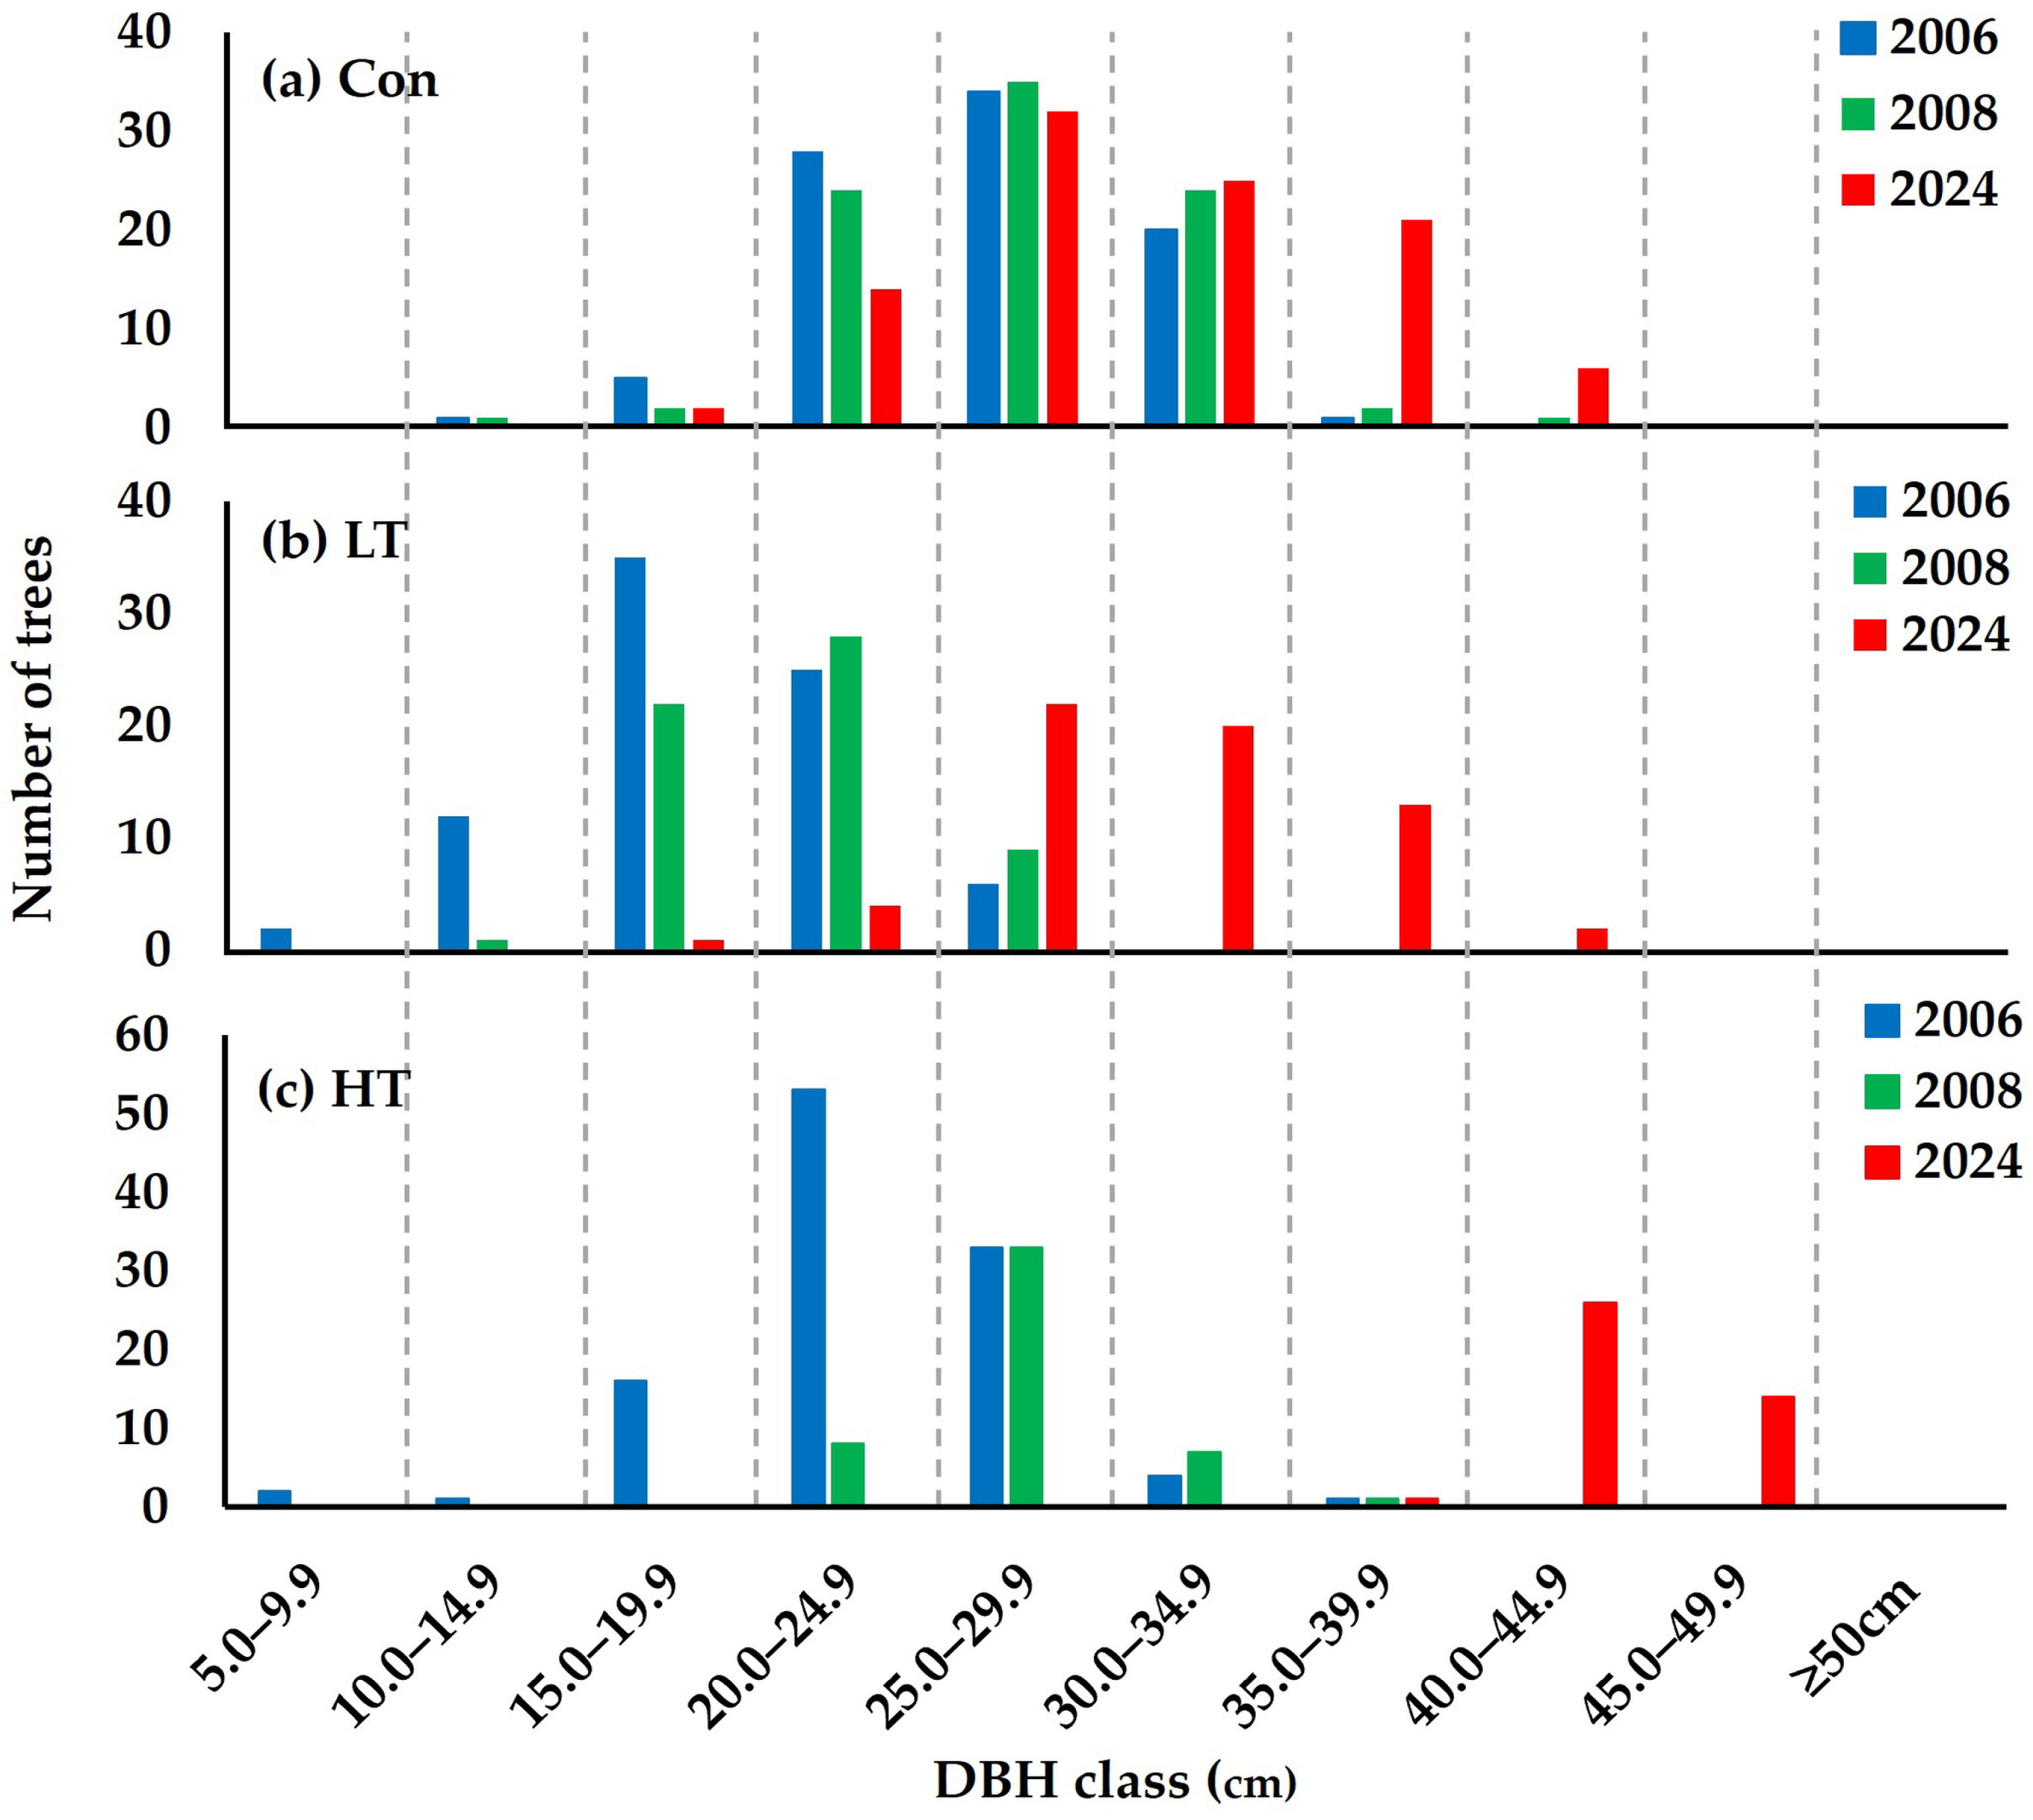
The DBH frequency distribution of the P. koraiensis plantation showed distinct structural shifts across thinning intensities and monitoring years (2006, 2008, and 2024) (Figure 3). Before the 2007–2008 thinning, a unimodal bell-shaped distribution was observed, with trees centered around the 15.0–19.9 cm DBH class in the LT plot, 20.0–24.9 cm DBH class in the HT plot, and 25.0–29.9 cm DBH class in the Con plot. Seventeen years after thinning in 2007–2008, the Con plot showed that tree distribution remained heavily concentrated in the mid-size classes (25.0–34.9 cm). Conversely, the thinned plots (LT and HT) exhibited a pronounced shift toward larger DBH classes (≥35 cm and ≥40 cm, respectively). In particular, the HT plot showed a remarkable expansion into higher-diameter classes, with a significant proportion of trees exceeding 40.0 cm DBH by 2024.

3.2. Variation in Obtained Ecosystem Services

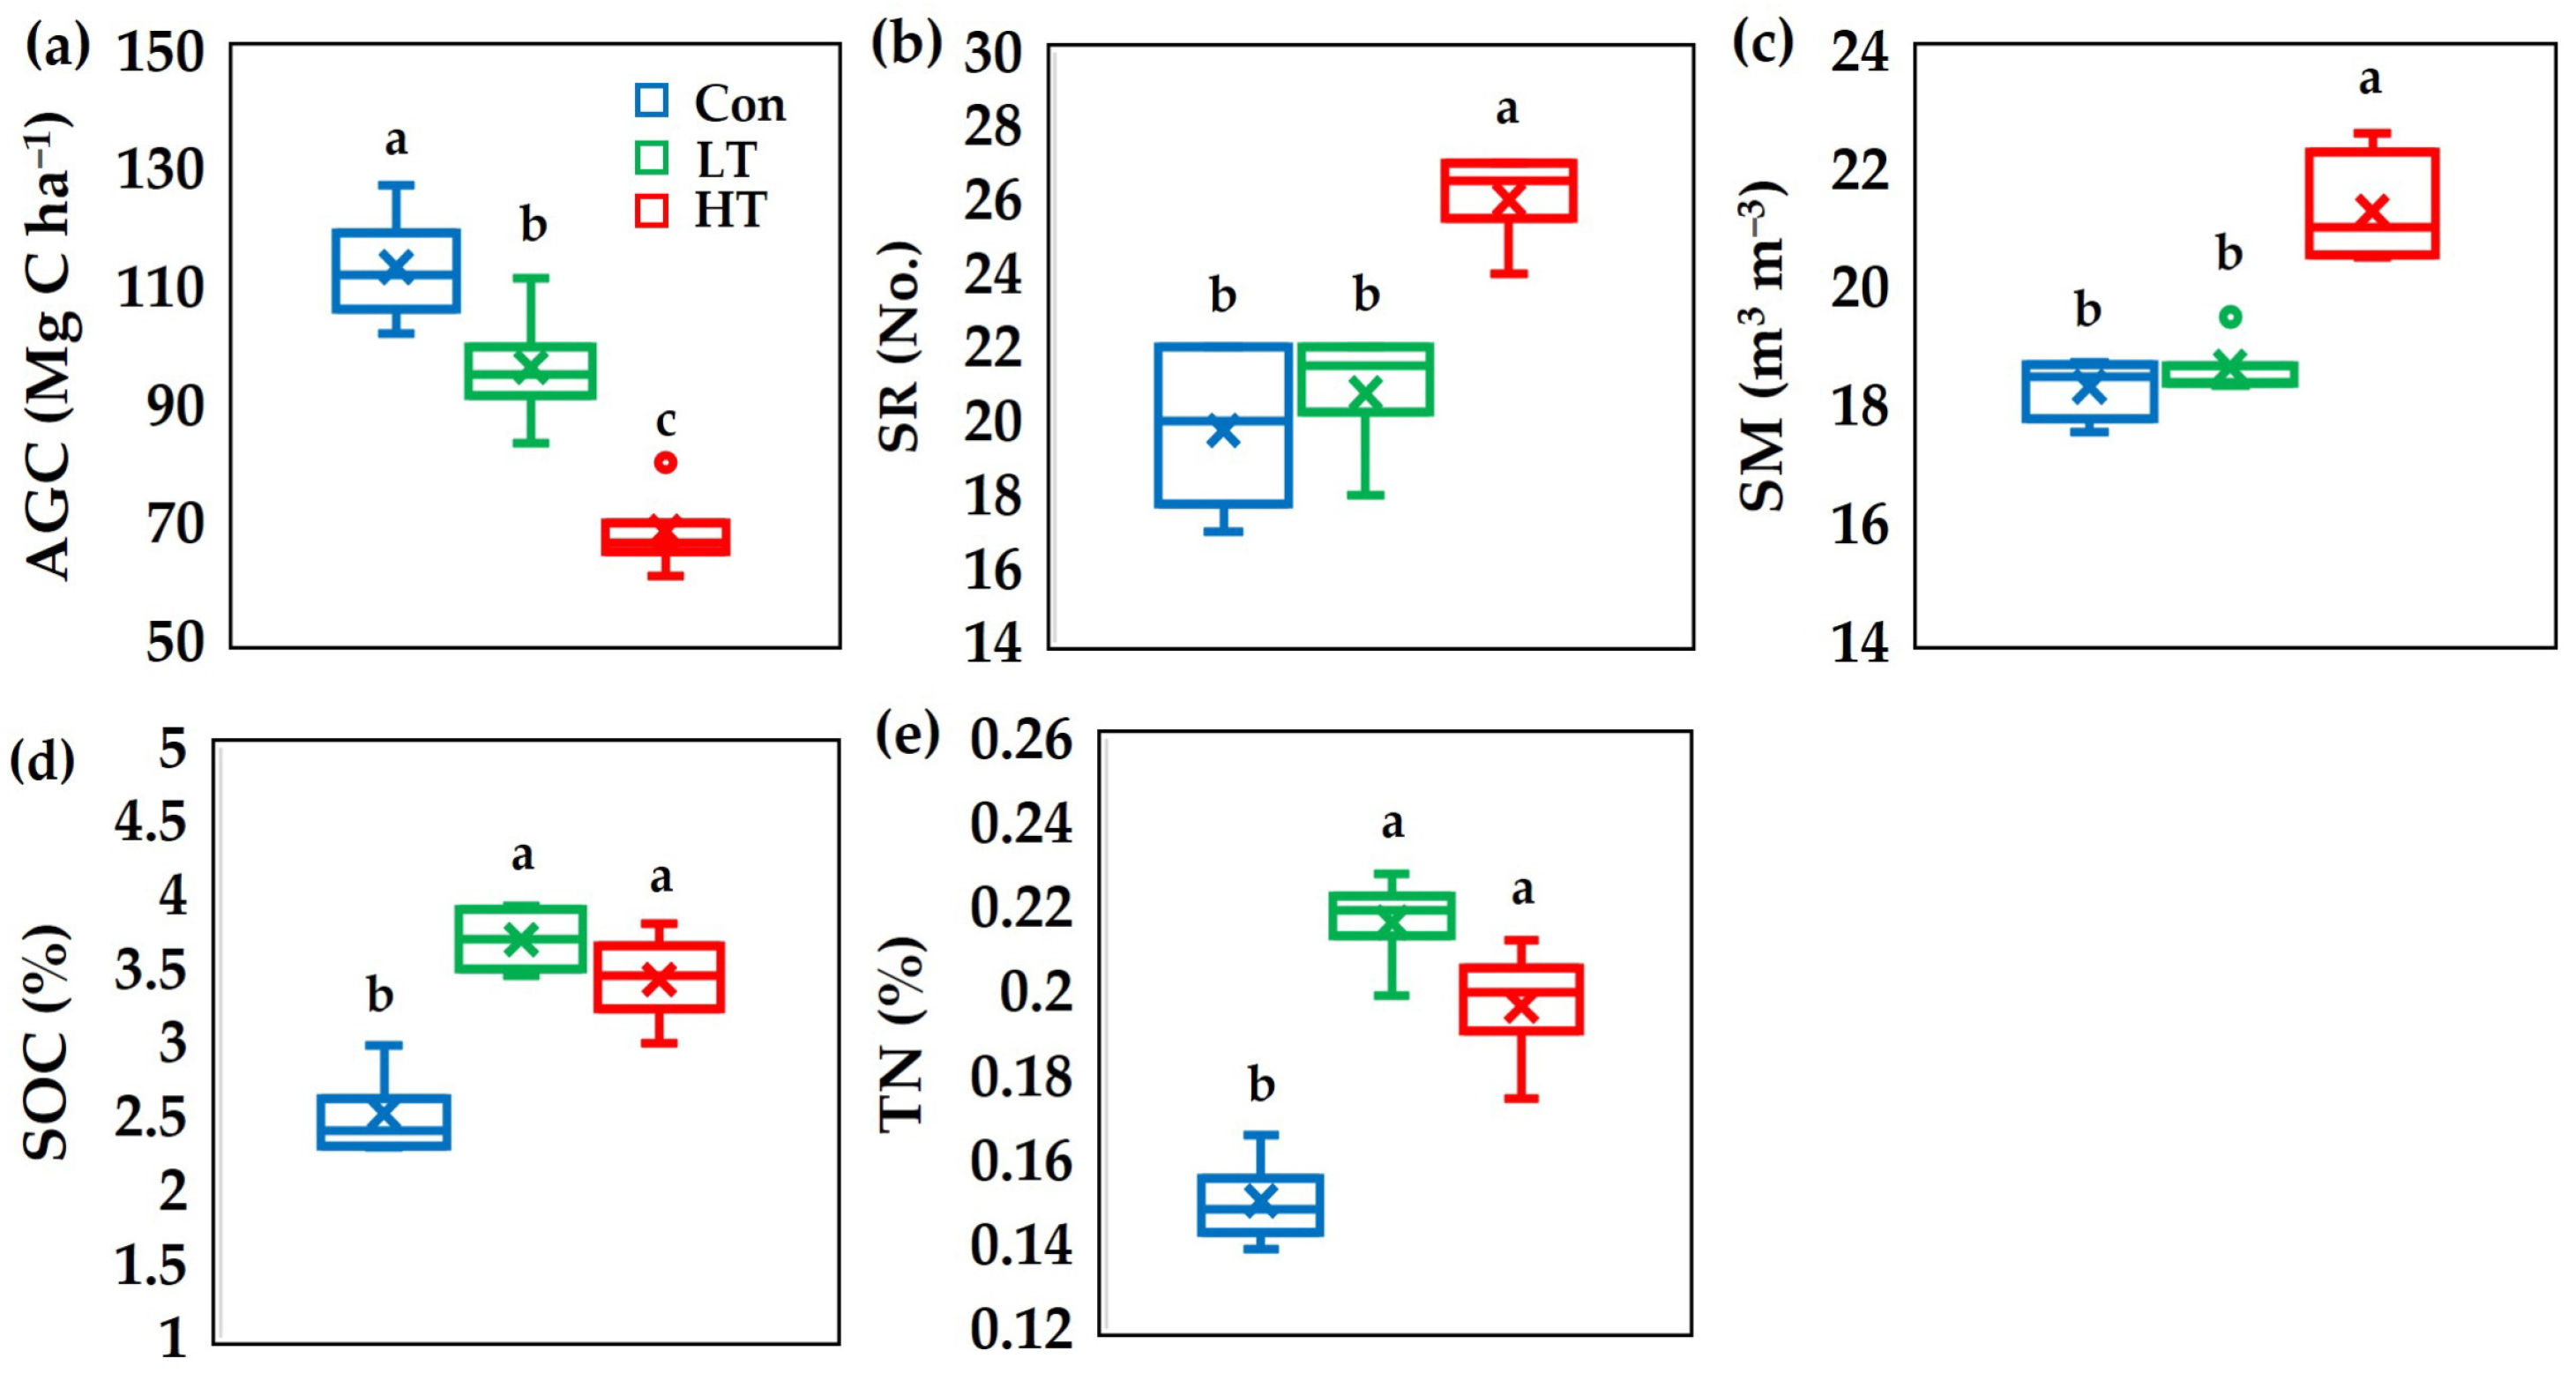
Thinning had a significant effect on ESs in the P. koraiensis plantation (p < 0.05, Figure 4). AGC values in both the LT (93.4 Mg C ha−1) and HT plots (68.4 Mg C ha−1) were lower than in the Con plot (113.4 Mg C ha−1). Compared to the Con plot, thinning reduced AGC by approximately 15% in the LT plot and 34% in the HT plot. SR (26 species) in the HT plot was significantly higher among treatments, yet no significant difference was observed between the LT (20.8) and Con plots (19.8). Additionally, SM in the HT plot was the highest across treatments, but no difference was found between the LT and Con plots. SM in the HT plot increased by 16.2% and 14.1% compared to the Con and LT plots, respectively. SOC increased significantly in the LT and the HT plots by 31.8% and 26.5%, respectively, compared to the Con plot. TN showed a similar pattern to SOC, with higher TN in the LT (0.22%) and HT (0.20%) plots than in the Con plot (0.15%).

3.3. Relative Benefits of Ecosystem Services

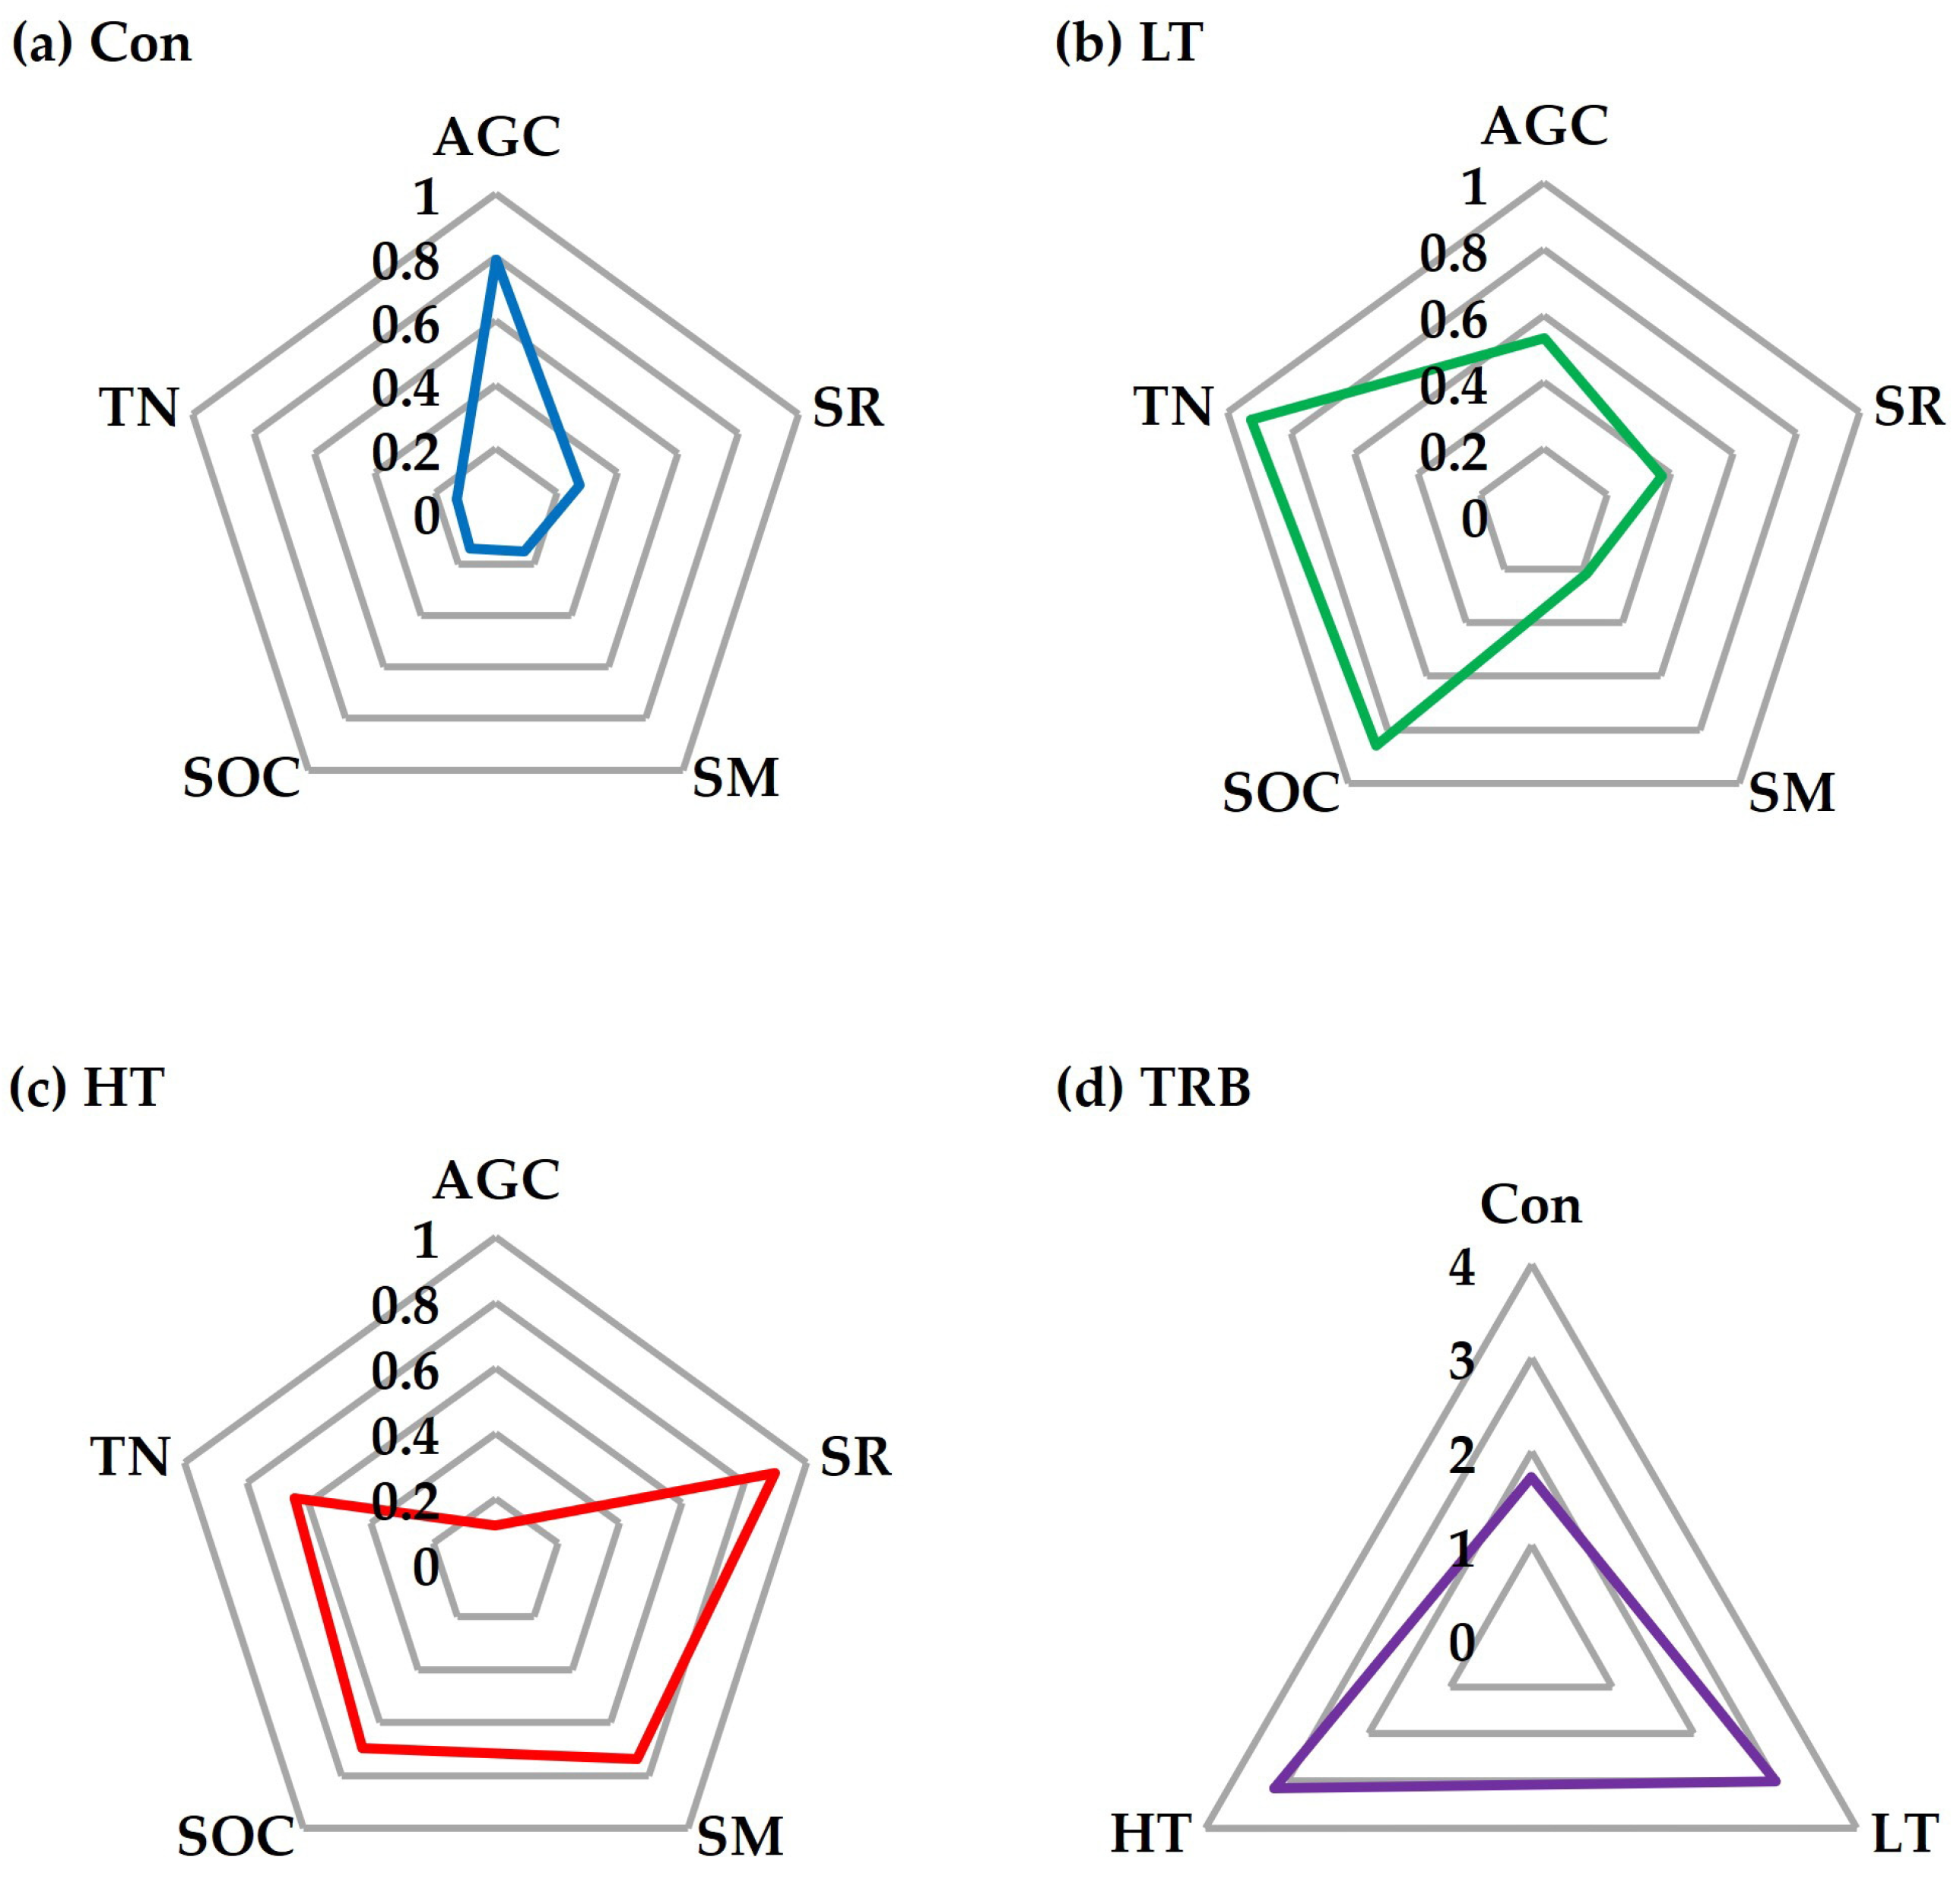
RB of ESs showed patterns similar to the obtained ESs. The values of RB ranged from 0.12 to 0.93. Therefore, the values were categorized as high RB (>0.7), moderate RB (0.4–0.7), and low RB (<0.4). The patterns of RB clearly showed differences across thinning intensities. The unthinned treatment provided high benefits for AGC, but low benefits for other ESs. Conversely, LT was highly beneficial for SOC and TN, while offering low benefits for SR and SM. Additionally, HT provided high benefits for SR, SM, and SOC, but low benefits for AGC. Consequently, Con, LT, and HT provided the greatest relative benefits for AGC, TN, and SR, respectively. The TRB values on both the LT and HT plots were significantly higher than in the Con plot (p < 0.05, Figure 5).

3.4. Correlations Among Ecosystem Services

Correlations among variables are presented in Table 3. The exploratory correlation analysis revealed that AGC tended to be negatively correlated with SR, SM, SOC, and TN, with a notable inverse trend observed between AGC and SR. In contrast, SR showed positive associations with SM, SOC, and TN. SM was positively correlated with SOC, whereas no significant correlation was found with TN. Furthermore, a close positive association was found between SOC and TN.

3.5. Trade-Offs for Ecosystem Services Pairs

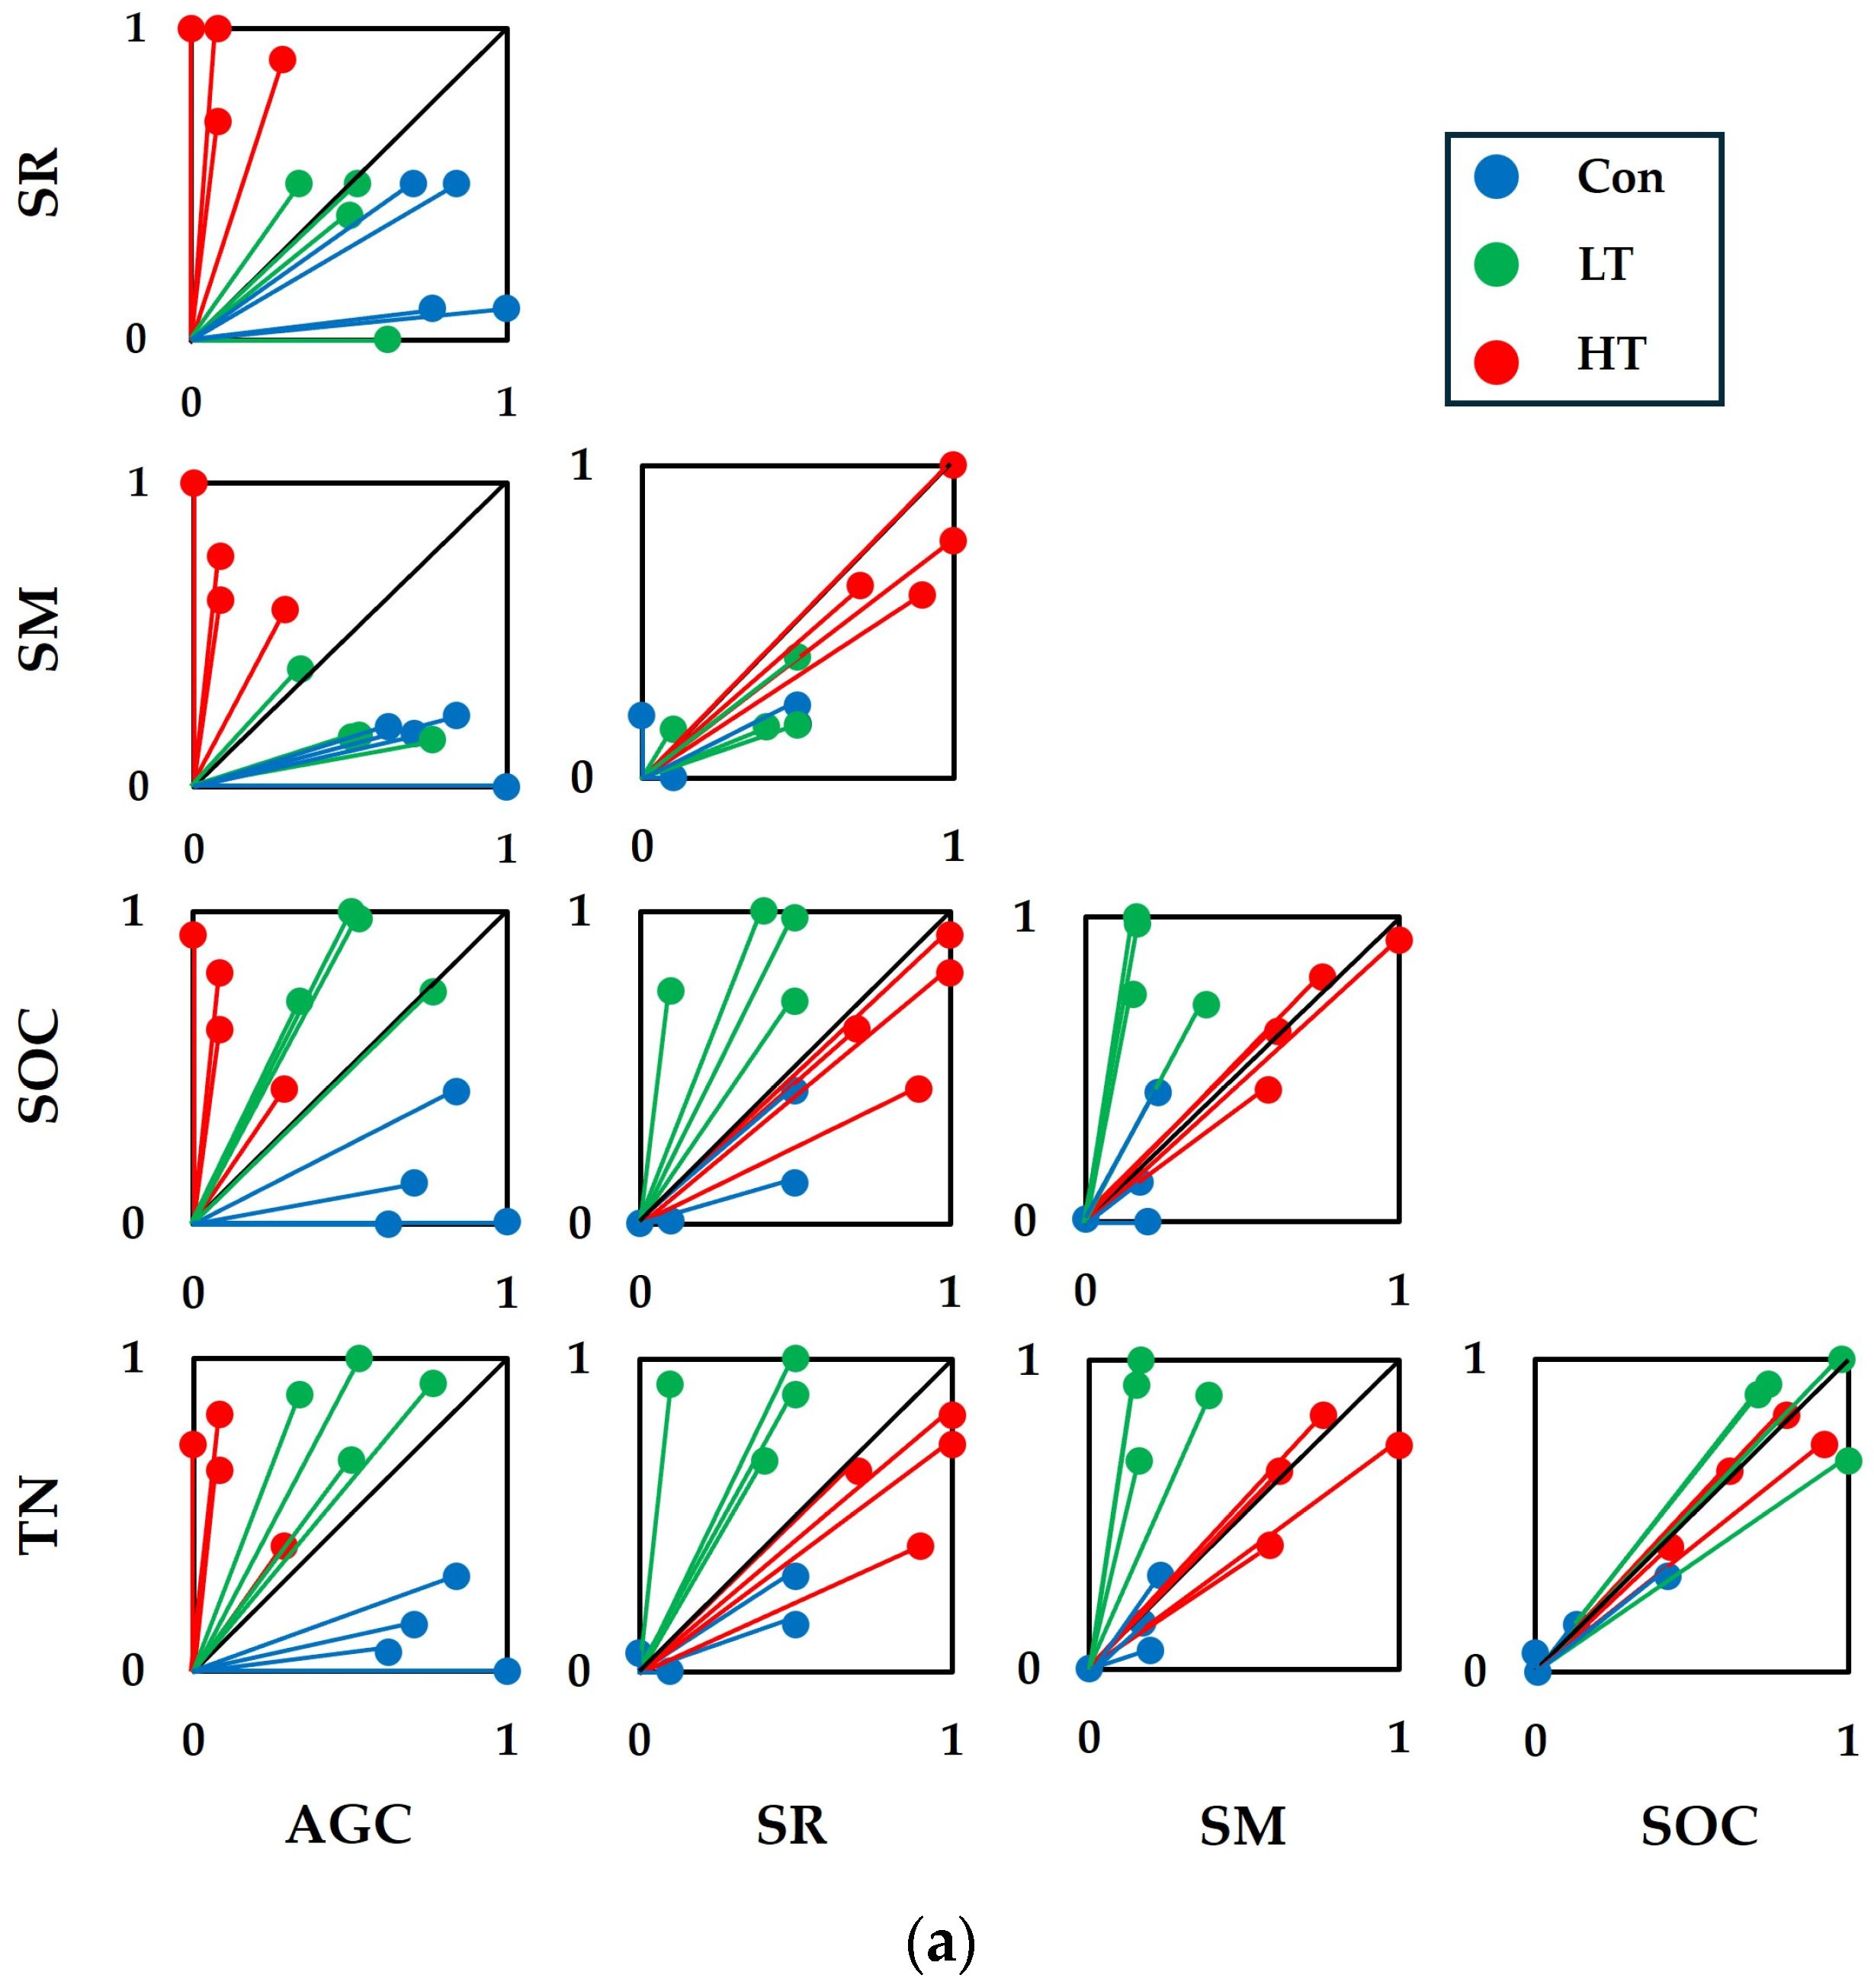
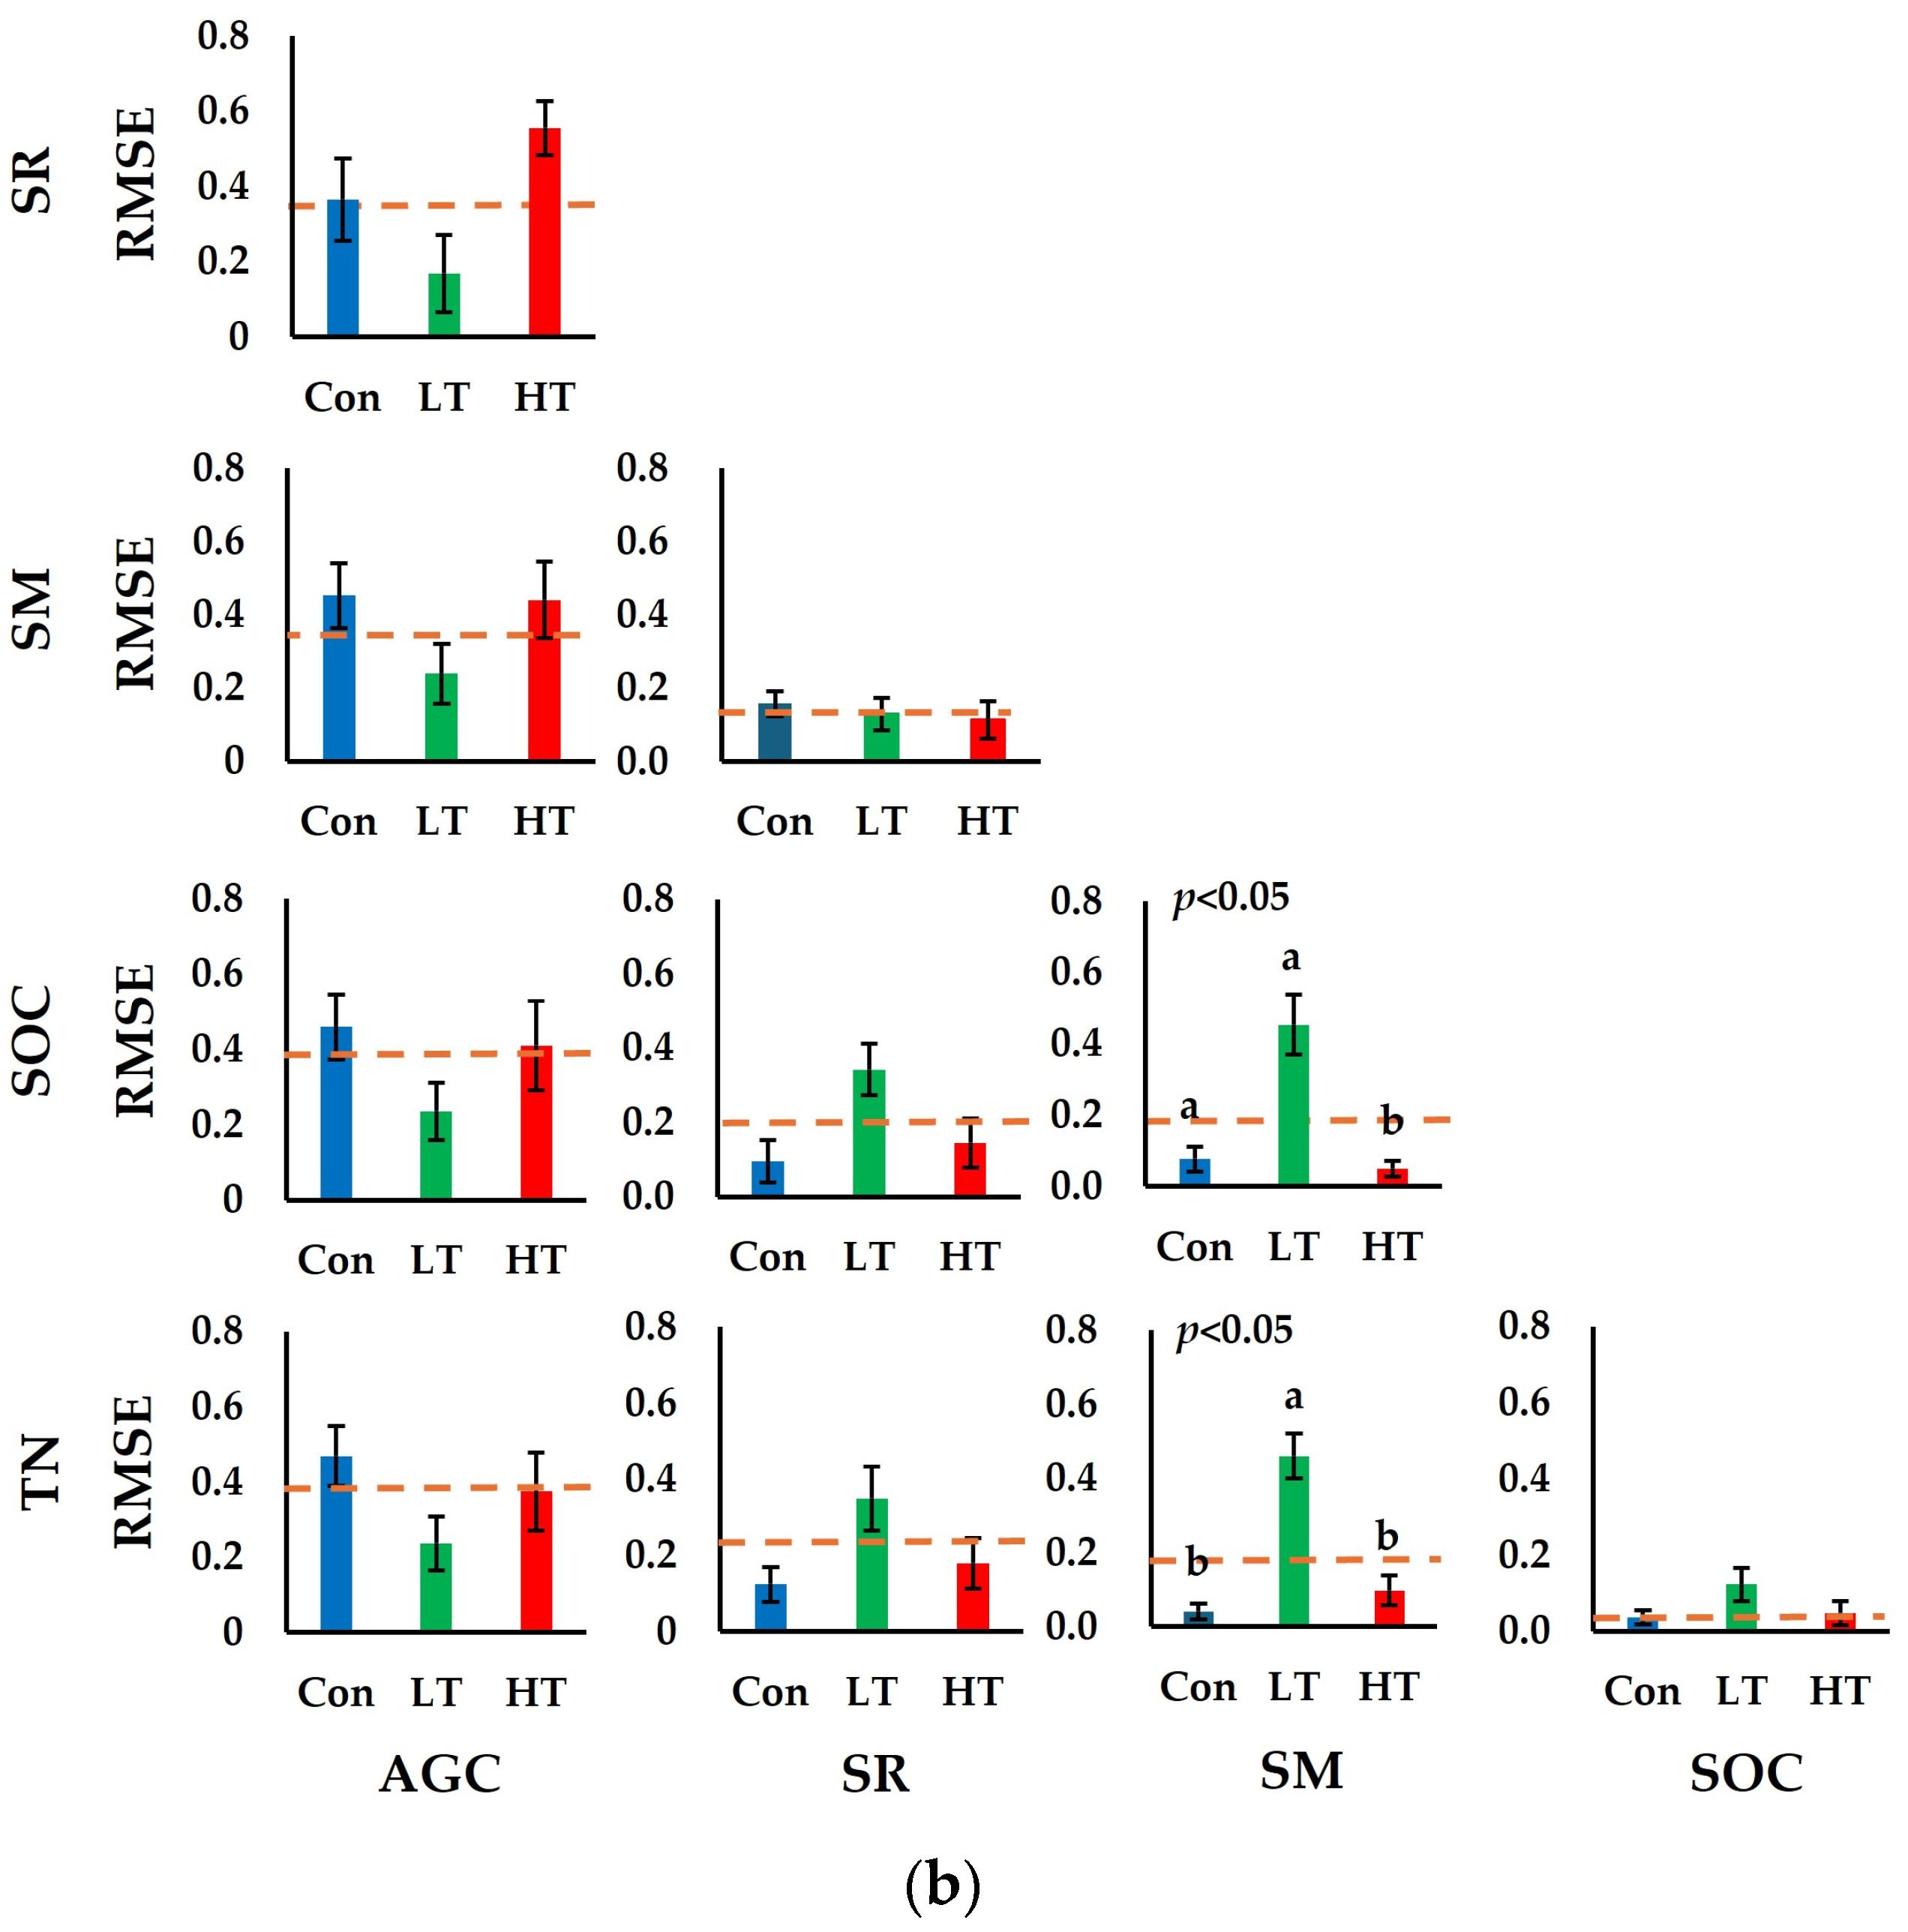
The TO varied among paired ESs (Figure 5). The overall mean TO was categorized as very low or synergistic when <0.1; low when between 0.1 and 0.2; moderate when between 0.2 and 0.3; and high when >0.3. On the whole, SOC and TN generally aligned with the 1:1 line in the scatter plot, indicating that the TO between SOC and TN was very low or assumed to be synergistic (overall mean TO = 0.07). The pair of SR and SM also showed a low overall mean TO (0.13). For the pairs of TN and SR and TN and SM, both pairs deviated from the 1:1 line to some extent, suggesting that their TOs were moderate (overall mean TO = 0.21 and 0.20, respectively). Both SOC and SR and SOC and SM pairs exhibited low TOs (0.19). Additionally, the highest TOs were observed for the pairs of AGC-related ESs (overall mean = 0.36–0.37) (Figure 6).
The deviation of the coordination of ES pairs from the 1:1 line implied that the sensitivities of TOs across ES pairs to thinning intensities varied. TOs of some ES pairs exhibited significant differences (Figure 6). In particular, the TOs of pairs SM and SOC and SM and TN were significantly higher in LT than in other thinning intensities (p < 0.05).

4. Discussion

Our findings revealed that most of the RBs were higher in both LT and HT plots than in the Con plot. Specifically, most of the individual RBs in the HT plot showed an even distribution in the high class, whereas those in the LT plot tended to spread across both the moderate and high classes. However, the vast majority of RB values in the Con plots were concentrated in the low class. This implies that thinning is an effective silvicultural practice for enhancing certain ESs.

4.1. Effect of Thinning on Ecosystem Services

Thinning significantly reduced AGC in both LT and HT plots. This is probably due to reduced stand density in thinned plots. Although thinning treatments increased DBH in the remaining trees at the individual tree level, aboveground biomass decreased at the stand level in the thinned plots; thus, AGC decreased. This result agrees with previous studies on 45-year-old Chamaecyparis obtusa forests in southwestern Korea [9], 34- and 45-year-old P. koraiensis plantations in central Korea [29], and around 30-year-old Quercus acuta forests in southern Korea [30], which revealed that AGC in thinned plots was lower than in the Con plot; the higher the thinning intensity, the lower the AGC.
Although canopy openness and light penetration were not directly measured in this study, thinning generally creates canopy gaps that increase light availability to the forest floor. We suggest that the invasion and colonization of light-demanding species in these potential gaps may have contributed to the higher understory species richness observed in our thinned plots [8,11,31]. In the study, HT had an impact on SR, whereas LT did not. This may be because the canopy closed by recovering from the disturbance; in other words, the gaps created by LT had already closed, yet those in the HT plots remained open. A meta-analysis revealed that SR in the herb layer reached a peak 3 to 5 years after thinning, and then there was no significant difference between treatments 6 to 10 years after thinning, depending on forest type and ecological domain, indicating that the canopy had recovered from thinning [32]. Additionally, a study reported that on a 40–60-year-old Korean pine plantation, the canopy was closed around 10 years after LT application [6]. We hypothesize that the canopy in the LT plots may have largely re-closed over the 17-year period. This possibility is partially inferred from our results, which show that both SR and SM in the LT plots returned to levels comparable to the Con plots (Figure 3b,c). In contrast, the persistent gaps in the HT plots appeared to be associated with maintaining significantly higher SR and SM.
The effect of thinning on soil properties is well documented in previous studies [9,33,34]. Moreover, thinning intensity also influences soil properties in the short and long terms [35,36]. In this study, SM in the HT plot was the highest. The result is in agreement with previous studies [11,37]. While throughfall and transpiration were not measured in this study, we infer that the increase in soil moisture could be attributed, in part, to potentially increased throughfall and decreased transpiration, as supported by previous findings. Molina and del Campo [38] found that throughfall in an Aleppo pine plantation (planted in the late 1940s) increased with thinning intensity; throughfall values were significantly higher in the moderate (63% reduction) and high-intensity thinning (86% reduction) treatments by 12% and 28%, respectively, compared to the control treatment, owing to the creation of more canopy gaps. Moreover, Cheng et al. [39] observed reductions in interception loss in thinned treatments in a Larix principis-rupprechtii plantation (planted in the 1960s). Also, the increase in SM after thinning may be explained by reduced transpiration due to the decrease in tree density. Tateishi et al. [40] reported that transpiration was related to sapflow density and sapwood area. The percentage reduction in transpiration was comparable to that in sapwood area [41,42]. Park et al. [21] demonstrated that experimental thinning in a mature P. koraiensis plantation significantly alters microclimates, enhances throughfall and soil water availability, and directly modifies tree-level water use (sap flux density and transpiration) through reductions in stand density and sapwood area. Reduced sapwood area following thinning may decrease transpiration. These findings can explain why thinning increases soil moisture. In the LT plots, the canopy is assumed to be closed 17 years after thinning, so throughfall is lower, interception loss is higher, and transpiration may be higher compared to the HT plot.
In the study, we found that thinning increased soil chemical properties (SOC and TN), showing SOC and TN significantly higher in both LT and HT plots than in the Con plots. This is consistent with previous studies that observed increases in soil chemical properties after thinning [43,44,45]. We propose as a working hypothesis that the higher SOC and TN values might be mediated by potential increases in root exudation and microbial activity driven by altered microenvironments, such as increased light and soil temperature following thinning [46,47]. In contrast, several studies reported that soil chemical properties did not differ or even decreased following thinning [9,35]. This may be due to variations depending on tree species, the interval between thinning and soil sampling, and topographical conditions [9,48].

4.2. Effect of Thinning on Relative Benefits and Trade-Offs

Several studies have revealed TO relationships between ESs under forest management practices [49,50,51]. In this study, we found that TOs varied not only between ES pairs but also across thinning intensities, although the overall magnitude of TOs did not differ among thinning intensities. These changes are complicated because ESs are affected not only by thinning but also by time scales, time lags, and scale-dependent ecological processes [5].
Overall, our synthesis reveals that no single treatment maximized all examined indicators simultaneously, highlighting distinct management trade-offs. Specifically, the Con plots retained the greatest AGC, whereas HT was associated with higher SR and SM, and LT showed the highest values for SOC and TN.
While the previous study [6] emphasized that LT was a balanced option, focusing primarily on AGC and SR, our expanded evaluation incorporating belowground properties 17 years post-thinning provides a more comprehensive, multi-objective management perspective. Specifically, our results demonstrate that LT is best suited for soil carbon and nutrient storage, whereas HT more effectively favors species diversity and hydrological regulation. Consequently, rather than merely extending the temporal scale, connecting aboveground trade-offs with belowground soil properties indicates that forest managers must select thinning treatments based on specific management priorities.

4.3. Limitations of the Study

Although we identified valuable insights into the interactions between ESs, some limitations remained. First, while the aboveground structural indicators (such as tree DBH and AGC) evaluated multi-year changes across 2006, 2008, and 2024, the comprehensive assessment of ecosystem services, particularly the belowground soil properties (SM, SOC, and TN) and their trade-offs, relied primarily on data measured in 2024 (17 years post-thinning). Future studies should incorporate continuous time-series data for belowground properties. Second, applying various thinning intensities and practices is necessary. Because this study included only two thinning treatments (LT and HT), the results are insufficient to propose operational thinning guidelines. Future studies should incorporate additional intensities and ecologically oriented practices, such as variable-density thinning. Finally, while minor micro-topographic variations (such as slope gradients ranging from 10° to 26°) were observed among plots, similar environmental gradients are characteristic of mountainous P. koraiensis plantations in this region, as documented in prior long-term studies at Mt. Gari [22,23]. While initial pre-treatment baseline data were limited, the distinct divergence in soil chemical properties (e.g., SOC and TN) and understory responses observed 17 years post-treatment aligns with the cumulative temporal trajectories identified over a decade of monitoring in the same ecosystem [22]. This confirms that the observed patterns are driven primarily by long-term silvicultural interventions rather than baseline topographic heterogeneity.

5. Conclusions

This study examined the effects of thinning on ESs, RBs, and TOs 17 years after treatment. Although forest inventory and vegetation surveys were previously conducted in 2006 and 2008, the data analysis in this study was specifically based on measurements obtained in 2024 for AGC, SR, and soil properties. ES responses and TO magnitudes differed among thinning treatments based on these 2024 data. Compared to the Con, the thinned treatments showed lower AGC, whereas HT was associated with higher SR and SM, and both LT and HT exhibited higher SOC and TN values. In particular, SR and SM were higher only under HT. Overall mean TOs indicated synergistic or very low TOs between SOC and TN and between SR and SM. These findings suggest that selecting an appropriate thinning intensity is critical for achieving forest-management objectives, because benefits and trade-offs vary substantially among ESs. Future studies incorporating continuous time-series data are needed to clarify long-term changes in ES relationships.

Author Contributions

Conceptualization, K.L.; methodology, K.L.; validation, K.L. and A.R.K.; formal analysis, K.L.; investigation, K.L., M.K., S.J.Y. and A.R.K.; data curation, K.L., M.K. and S.J.Y.; writing—original draft preparation, K.L.; writing—review and editing, K.L. and A.R.K.; visualization, K.L.; supervision, A.R.K.; project administration, A.R.K.; funding acquisition, A.R.K. All authors have read and agreed to the published version of the manuscript.

Funding

This research was funded by the National Institute of Forest Science (Project no.: FE0100-2024-04-2026).

Data Availability Statement

All the data used are already reflected in the article. Other relevant data may be available upon request from the authors.

Acknowledgments

The authors would like to thank the members of the Forest Ecology Laboratory for their assistance in carrying out field research. Special thanks to Hee Mun Yang, who established and maintained the site.

Conflicts of Interest

The authors declare no conflicts of interest.

Abbreviations

The following abbreviations are used in this manuscript:
AGCAboveground carbon storage
RMSERoot mean square error
SOCSoil organic carbon
TNSoil total nitrogen
ESsEcosystem services
SRSpecies richness
TOTrade-off
RBRelative benefit
ConControl
LTLight thinning
SMSoil moisture
HTHeavy thinning

References

  1. Millennium Ecosystem Assessment. Ecosystems and Human Well-Being: Wetlands and Water; World Resources Institute: Washington, DC, USA, 2005. [Google Scholar]
  2. Bennett, E.M.; Peterson, G.D.; Gordon, L.J. Understanding relationships among multiple ecosystem services. Ecol. Lett. 2009, 12, 1394–1404. [Google Scholar] [CrossRef] [PubMed]
  3. Egoh, B.; Reyers, B.; Rouget, M.; Richardson, D.M.; Le Maitre, D.C.; van Jaarsveld, A.S. Mapping ecosystem services for planning and management. Agric. Ecosyst. Environ. 2008, 127, 135–140. [Google Scholar] [CrossRef]
  4. Zeng, Y.; Gou, M.; Ouyang, S.; Chen, L.; Fang, X.; Zhao, L.; Li, J.; Peng, C.; Xiang, W. The impact of secondary forest restoration on multiple ecosystem services and their trade-offs. Ecol. Indic. 2019, 104, 248–258. [Google Scholar] [CrossRef]
  5. Lu, N.; Fu, B.; Jin, T.; Chang, R. Trade-off analyses of multiple ecosystem services by plantations along a precipitation gradient across Loess Plateau landscapes. Landsc. Ecol. 2014, 29, 1697–1708. [Google Scholar] [CrossRef]
  6. Lee, K.; Yun, S.J.; Kim, M.; Yang, H.M.; Kim, A.R. The effect of thinning on trade-offs in ecosystem services: The case study of a Korean pine plantation on Mt. Gari. J. Ecol. Environ. 2024, 48, 137–143. [Google Scholar] [CrossRef]
  7. Seiwa, K.; Eto, Y.; Hishita, M.; Masaka, K. Effects of thinning intensity on species diversity and timber production in a conifer (Cryptomeria japonica) plantation in Japan. J. For. Res. 2012, 17, 468–478. [Google Scholar] [CrossRef]
  8. Ares, A.; Neill, A.R.; Puettmann, K.J. Understory abundance, species diversity and functional attribute response to thinning in coniferous stands. For. Ecol. Manag. 2010, 260, 1104–1113. [Google Scholar] [CrossRef]
  9. Lee, J.-G.; Lee, D.-H.; Jung, J.-Y.; Lee, S.-G.; Han, S.H.; Kim, S.; Kim, H.-J. The effects of stand density control on carbon cycle in Chamaecyparis obtusa (Siebold and Zucc.) Endl. forests. Forests 2023, 14, 217. [Google Scholar] [CrossRef]
  10. Zhou, T.; Wang, C.; Zhou, Z. Thinning promotes the nitrogen and phosphorous cycling in forest soils. Agric. For. Meteorol. 2021, 311, 108665. [Google Scholar] [CrossRef]
  11. Bae, S.W.; Hwang, J.H.; Lee, S.T.; Kim, H.S.; Jeong, J.-M. Changes in soil temperature, moisture content, light availability and diameter growth after thinning in Korean pine (Pinus koraiensis) plantation. J. Korean For. Soc. 2010, 99, 397–403. [Google Scholar]
  12. Taki, H.; Inoue, T.; Tanaka, H.; Makihara, H.; Sueyoshi, M.; Isono, M.; Okabe, K. Responses of community structure, diversity, and abundance of understory plants and insect assemblages to thinning in plantations. For. Ecol. Manag. 2010, 259, 607–613. [Google Scholar] [CrossRef]
  13. Burton, J.I.; Ares, A.; Olson, D.H.; Puettmann, K.J. Management trade-off between aboveground carbon storage and understory plant species richness in temperate forests. Ecol. Appl. 2013, 23, 1297–1310. [Google Scholar] [CrossRef] [PubMed]
  14. Zhang, K.; Zou, H.; Lei, X.; Zeng, J.; Lan, J.; Guo, X.; Cao, B.; Wang, J.; Zhang, H. Impact of management measures on multiple ecosystem function trade-offs and their dynamics in subtropic Pinus massoniana plantations. Forests 2024, 15, 1224. [Google Scholar] [CrossRef]
  15. Korea Forest Service. Statistical Yearbook of Forestry 2024; Korea Forest Service: Daejeon, Republic of Korea, 2023. Available online: https://kfss.forest.go.kr/ (accessed on 10 October 2025).
  16. Aizawa, M.; Kim, Z.-S.; Yoshimaru, H. Phylogeography of the Korean pine (Pinus koraiensis) in northeast Asia: Inferences from organelle gene sequences. J. Plant Res. 2012, 125, 713–723. [Google Scholar] [CrossRef] [PubMed]
  17. Jin, X.; Li, F.; Pukkala, T.; Dong, L. Modelling the cone yields of Korean pine. For. Ecol. Manag. 2020, 464, 118086. [Google Scholar] [CrossRef]
  18. Kwon, K.-C.; Lee, D.K. Biomass and energy content of Pinus koraiensis stand planted in Mt. Wolak. J. Korean Wood Sci. Technol. 2006, 34, 66–75. [Google Scholar]
  19. Son, Y.; Hwang, J.W.; Kim, Z.S.; Lee, W.K.; Kim, J.S. Allometry and biomass of Korean pine (Pinus koraiensis) in central Korea. Bioresour. Technol. 2001, 78, 251–255. [Google Scholar] [CrossRef] [PubMed]
  20. Li, X.; Yi, M.J.; Son, Y.; Park, P.S.; Lee, K.H.; Son, Y.M.; Kim, R.H.; Jeong, M.J. Biomass and carbon storage in an age-sequence of Korean pine (Pinus koraiensis) plantation forests in central Korea. J. Plant Biol. 2011, 54, 33–42. [Google Scholar]
  21. Park, J.; Kim, T.; Moon, M.; Cho, S.; Ryu, D.; Kim, H.S. Effects of thinning intensities on tree water use, growth, and resultant water use efficiency of 50-year-old Pinus koraiensis forest over four years. For. Ecol. Manag. 2018, 408, 121–128. [Google Scholar] [CrossRef]
  22. Han, S.H.; An, J.Y.; Hernandez, J.O.; Yang, H.M.; Kim, E.-S.; Noh, N.J.; Seo, J.M.; Park, B.B. Effects of thinning intensity on litterfall production, soil chemical properties, and fine root distribution in Pinus koraiensis plantation in Republic of Korea. Plants 2023, 12, 3614. [Google Scholar] [CrossRef] [PubMed]
  23. Park, B.-B.; Lee, I.-K.; Yang, H.-M. The effects of thinning on fine root distribution and litterfall in a Pinus koraiensis plantation. J. Ecol. Environ. 2009, 32, 159–165. [Google Scholar] [CrossRef]
  24. Lee, J.; Yun, S.J.; Kim, M.; Kim, A.R.; Lee, K. Evaluation of resilience of Korean pine plantations to drought by thinning frequency. J. Korean Soc. For. Sci. 2025, 114, 18–29. [Google Scholar]
  25. Braun-Blanquet, J. Pflanzensoziologie: Grundzüge der Vegetationskunde, 3rd ed.; Springer: Vienna, Austria, 2013; pp. 1–865. [Google Scholar]
  26. Korea National Arboretum. Korean Plant Names Index (KPNI). 2003. Available online: http://www.nature.go.kr/kpni/index.do (accessed on 22 July 2024).
  27. Son, Y.; Kim, R.; Lee, K.; Pyo, J.; Kim, S.; Hwang, J.; Lee, S.; Park, H. Carbon Emission Factors and Biomass Allometric Equations by Species in Korea; Korea Forest Research Institute Report: Seoul, Republic of Korea, 2014; pp. 14–18.
  28. Bradford, J.B.; D’Amato, A.W. Recognizing trade-offs in multi-objective land management. Front. Ecol. Environ. 2012, 10, 210–216. [Google Scholar]
  29. Hwang, J.; Bae, S.-W.; Lee, K.J.; Lee, K.-S.; Kim, H.-S. Short-term effect of thinning on aboveground carbon storage in Korean pine (Pinus koraiensis) plantation. J. Korean Soc. For. Sci. 2008, 97, 605–610. [Google Scholar]
  30. Lee, S.T.; Son, Y.M.; Lee, K.J.; Hwang, J.; Choi, J.C.; Shin, H.C.; Park, N.C. Aboveground Carbon Storage of Quercus acuta Stands by Thinning Intensity. Korean J. Agric. For. Meteorol. 2005, 7, 282–288. [Google Scholar]
  31. Fahey, R.T.; Puettmann, K.J. Ground-layer disturbance and initial conditions influence gap partitioning of understorey vegetation. J. Ecol. 2007, 95, 1098–1109. [Google Scholar] [CrossRef]
  32. Li, X.; Li, Y.; Zhang, J.; Peng, S.; Chen, Y.; Cao, Y. The effects of forest thinning on understory diversity in China: A meta-analysis. Land Degrad. Dev. 2020, 31, 1225–1240. [Google Scholar] [CrossRef]
  33. Ko, S.; Yoon, T.K.; Kim, S.; Kim, C.; Lee, S.-T.; Seo, K.W.; Son, Y. Thinning intensity effects on carbon storage of soil, forest floor and coarse woody debris in Pinus densiflora stands. J. Korean Soc. For. Sci. 2014, 103, 30–36. [Google Scholar] [CrossRef]
  34. Lee, J.; Han, S.H.; Kim, S.; Lee, S.; Son, Y.M.; Son, Y. A meta-analysis on the effect of forest thinning on diameter growth and carbon stocks in Korea. J. Korean For. Soc. 2015, 104, 527–535. [Google Scholar] [CrossRef]
  35. Cheng, X.; Yu, M.; Li, Z. Short term effects of thinning on soil organic carbon fractions, soil properties, and forest floor in Cunninghamia lanceolata plantations. J. Soil Sci. Environ. Manag. 2018, 9, 21–29. [Google Scholar] [CrossRef]
  36. Ganatsas, P.; Tsakaldimi, M.; Karydopoulos, T.; Papaemannuil, A.; Papadopoulos, S. Long-term effect of different forest thinning intensity on carbon sequestration rates and potential uses in climate change mitigation actions. Mitig. Adapt. Strateg. Glob. Change 2024, 29, 3. [Google Scholar] [CrossRef]
  37. Yang, A.-R.; Son, Y.; Noh, N.J.; Lee, S.K.; Jo, W.; Son, J.-A.; Kim, C.; Bae, S.-W.; Lee, S.-T.; Kim, H.-S. Effect of thinning on carbon storage in soil, forest floor and coarse woody debris of Pinus densiflora stands with different stand ages in Gangwon-do, central Korea. For. Sci. Technol. 2011, 7, 30–37. [Google Scholar] [CrossRef]
  38. Molina, A.J.; del Campo, A.D. The effects of experimental thinning on throughfall and stemflow: A contribution towards hydrology-oriented silviculture in Aleppo pine plantations. For. Ecol. Manag. 2012, 269, 206–213. [Google Scholar] [CrossRef]
  39. Cheng, X.; Bai, Y.; Zhu, J.; Han, H. Effects of forest thinning on interception and surface runoff in Larix principis-rupprechtii plantation during the growing season. J. Arid Environ. 2020, 181, 104222. [Google Scholar] [CrossRef]
  40. Tateishi, M.; Xiang, Y.; Saito, T.; Otsuki, K.; Kasahara, T. Changes in canopy transpiration of Japanese cypress and Japanese cedar plantations because of selective thinning. Hydrol. Process. 2015, 29, 5088–5097. [Google Scholar] [CrossRef]
  41. Komatsu, H.; Shinohara, Y.; Nogata, M.; Tsuruta, K.; Otsuki, K. Changes in canopy transpiration due to thinning of a Cryptomeria japonica plantation. Hydrol. Res. Lett. 2013, 7, 60–65. [Google Scholar] [CrossRef]
  42. Morikawa, Y.; Hattori, S.; Kiyono, Y. Transpiration of a 31-year-old Chamaecyparis obtusa Endl. stand before and after thinning. Tree Physiol. 1986, 2, 105–114. [Google Scholar] [CrossRef] [PubMed]
  43. Cheng, X.; Yu, M.; Wang, G.G. Effects of thinning on soil organic carbon fractions and soil properties in Cunninghamia lanceolata stands in eastern China. Forests 2017, 8, 198. [Google Scholar] [CrossRef]
  44. Li, Y.; Hong, S.; Fang, S.; Cui, G. Thinning promotes litter decomposition and nutrient release in poplar plantations via altering the microclimate and understory plant diversity. Ann. For. Res. 2023, 66, 3–18. [Google Scholar] [CrossRef]
  45. Yao, L.; Wu, C.; Jiang, B.; Wu, M.; Shao, X.; Li, N. Thinning alters nitrogen transformation processes in subtropical forest soil: Key roles of physicochemical properties. Sci. Total Environ. 2024, 949, 175086. [Google Scholar] [CrossRef] [PubMed]
  46. Tian, H.; Cheng, X.; Han, H.; Jing, H.; Liu, X.; Li, Z. Seasonal variations and thinning effects on soil phosphorus fractions in Larix principis-rupprechtii Mayr. plantations. Forests 2019, 10, 172. [Google Scholar] [CrossRef]
  47. Lee, J.; Zhou, X.; Lee, S.T.; Yang, Y.; Yun, J.; Lee, H.H.; Kang, H. Thinning enhances forest soil C storage by shifting the soil toward an oligotrophic condition. Sci. Total Environ. 2024, 925, 171745. [Google Scholar] [CrossRef] [PubMed]
  48. Jurgensen, M.; Tarpey, R.; Pickens, J.; Kolka, R.; Palik, B. Long-term effect of silvicultural thinnings on soil carbon and nitrogen pools. Soil Sci. Soc. Am. J. 2012, 76, 1418–1425. [Google Scholar] [CrossRef]
  49. Strengbom, J.; Axelsson, E.P.; Lundmark, T.; Nordin, A. Trade-offs in the multi-use potential of managed boreal forests. J. Appl. Ecol. 2018, 55, 958–966. [Google Scholar] [CrossRef]
  50. Simon, D.-C.; Ameztegui, A. Modelling the influence of thinning intensity and frequency on the future provision of ecosystem services in Mediterranean mountain pine forests. Eur. J. For. Res. 2023, 142, 521–535. [Google Scholar] [CrossRef]
  51. Niemi, M.T.; Vauhkonen, J.; Uusitalo, J. Trade-off analysis for multi-objective boreal forest thinning. Forestry 2026, 99, cpaf027. [Google Scholar] [CrossRef]
Figure 1. Site view at the study site at Mt. Gari, Chuncheon. (a) Before thinning in 2006, (b) the unthinned control in 2024, (c) 17 years after light thinning in 2024, and (d) 17 years after heavy thinning in 2024. (Note: while the Con and LT plots are predominantly composed of Pinus koraiensis, minor hardwood species such as Rhus javanica and Morus bombycis are present in the heavy-thinning plot, with a combined representation of approximately 5%).
Forests 17 00949 g001
Figure 2. Diagram of trade-offs (TOs) between ecosystem services (ESs). The axes range from 0 to 1 for the relative benefits of ES-1 and ES-2, and the black diagonal 1:1 line indicates synergy between both ESs. Red dots labeled with letters (A to E) represent ES pairs: Points A and B indicate zero TO with high and low synergy, respectively; Points C and D represent equal TO magnitudes in opposite directions; and Point E represents a higher TO magnitude. The red lines indicate the magnitude of TO. This figure is modified from Bradford and D’Amato [28].
Forests 17 00949 g002
Figure 3. Changes in DBH frequency distribution across 2004, 2006, and 2024 under different thinning intensities. (a) Control, (b) light thinning, and (c) heavy thinning.
Forests 17 00949 g003
Figure 4. Differences in ESs 17 years after thinning. (a) Aboveground carbon storage, (b) Species richness, (c) Soil moisture, (d) Soil organic carbon, and (e) Total soil nitrogen. In the box plots, the horizontal lines and ‘×’ symbols indicate the medians and means, respectively. The upper and lower boundaries of the boxes represent the 25th and 75th percentiles, and the whiskers represent the maximum and minimum values excluding outliers. Different lowercase letters indicate significant differences among treatments (p < 0.05).
Forests 17 00949 g004
Figure 5. Spider diagrams of the relative benefits of ESs at different thinning intensities. (a) Control (Con), (b) light thinning (LT), (c) heavy thinning (HT), and (d) total relative benefits (TRB). AGC, SR, SM, SOC, and TN represent aboveground carbon storage, species richness, soil moisture, soil organic carbon, and total soil nitrogen, respectively.
Forests 17 00949 g005
Figure 6. Trade-off of paired ecosystem services (ESs) (relative benefits) among thinning treatments. Con, LT, and HT indicate control, light-thinning, and heavy-thinning plots, respectively. The scatter plots illustrate individual observations categorized by treatment groups (Con: blue, LT: green, HT: red), with solid trend lines and 1:1 diagonal reference lines representing zero trade-off and high synergy. The x-axis and y-axis on (a) represent the relative benefit of ES-1 and ES-2, respectively. AGC, SR, SM, SOC, and TN refer to aboveground carbon storage, species richness, soil moisture, soil organic carbon, and total soil nitrogen, respectively. (b) Root mean square error (RMSE) metrics quantifying the magnitude of trade-offs for paired ecosystem services (ESs) across different thinning treatments (Con: blue, LT: green, HT: red). The bar charts represent the RMSE values for each variable pair, where error bars indicate standard errors, and horizontal dashed lines represent overall mean references. Different lowercase letters indicate significant differences among treatments (p < 0.05). AGC, SR, SM, SOC, and TN represent aboveground carbon storage, species richness, soil moisture, soil organic carbon, and total soil nitrogen, respectively.
Forests 17 00949 g006aForests 17 00949 g006b
Table 1. Characteristics of the study site on the P. koraiensis plantation in 2006, 2008, and 2024. Con, LT, and HT indicate control, light-thinning, and heavy-thinning plots, respectively. Values in parentheses represent the standard errors.
ConLTHT
Elevation (m)438446454
AspectSWWSW
Slope (°)101526
200620082024200620082024200620082024
Stand density
(trees ha−1)
562.2
(37.5)
562.2
(37.5)
543.8 (24.0)587.5
(16.1)
389.3
(34.4)
387.5 (28.6)562.5
(37.5)
206.3
(15.7)
200.0 (15.3)
DBH (cm)25.2
(0.78)
26.3
(0.85)
33.2 (1.07)23.3
(0.39)
26.0
(0.40)
36.4 (0.48)23.0
(0.39)
27.9
(0.95)
42.1 (0.96)
Height (m)15.1
(0.13)
15.9
(0.24)
19.4
(0.16)
13.3
(0.09)
14.3
(0.09)
19.8
(0.15)
14.3
(0.21)
15.6
(0.21)
19.8
(0.23)
Basal area (m2 ha−1)28.0
(0.93)
30.5
(1.11)
47.5 (1.83)24.9
(0.59)
19.7
(1.55)
39.9 (2.13)24.1
(1.09)
12.8
(0.89)
27.8 (1.46)
Table 2. Methods used for soil property analyses in the National Instrumentation Center for Environmental Management at Seoul National University.
Soil PropertiesMethod
Soil organic matter (OM)Walkely black method and then calculated as OM
Total soil nitrogen (TN)Kjeldahl method
Soil moisture (SM)Calculated based on wet and dry weight
Table 3. Pearson correlation coefficients among ecosystem service variables measured in 2024 (n = 12).
AGCSRSMSOCTN
AGC1−0.81 *−0.69 *−0.56−0.49
SR 10.78 *0.470.33
SM 10.190.09
SOC 10.96 **
TN 1
Note: AGC, SR, SM, SOC, and TN represent aboveground carbon storage, species richness, soil moisture, soil organic carbon, and soil total nitrogen, respectively. p-values were adjusted for multiple testing using the Benjamini–Hochberg (BH) method. Asterisks denote statistical significance (*: p < 0.05, **: p < 0.01).
Disclaimer/Publisher’s Note: The statements, opinions and data contained in all publications are solely those of the individual author(s) and contributor(s) and not of MDPI and/or the editor(s). MDPI and/or the editor(s) disclaim responsibility for any injury to people or property resulting from any ideas, methods, instructions or products referred to in the content.