Article

Structural Complexity and Tree-Related Microhabitat Diversity Shape Beetle Richness Under Future Climates


1
GeoLAB-Laboratorio di Geomatica Forestale, Dipartimento di Scienze e Tecnologie Agrarie, Alimentari, Ambientali e Forestali, Università degli Studi di Firenze, Via San Bonaventura 13, 50145 Firenze, Italy
2
Department of Science and Technology of Agriculture and Environment (DISTAL), University of Bologna, 40126 Bologna, Italy
3
Forest Modelling Laboratory, Institute for Agriculture and Forestry Systems in Mediterranean, National Research Council of Italy (CNR-ISAFOM), 06128 Perugia, Italy
4
Dipartimento di Architettura e Progetto, Sapienza Università di Roma, Via Flaminia, 359, 00196 Roma, Italy
5
Department of Biosciences and Territory, University of Molise, Contrada Fonte Lappone, 86090 Pesche, Italy
6
NBFC—National Biodiversity Future Center, 90133 Palermo, Italy
7
National Research Council of Italy, Institute of Technologies and Environmental Intelligence (CNR-ITIAm), Area della Ricerca Roma 1, Strada Provinciale 35d, 9, Montelibretti, 00010 Rome, Italy
*
Authors to whom correspondence should be addressed.
Forests 2026, 17(8), 896; https://doi.org/10.3390/f17080896
Submission received: 28 May 2026 / Revised: 24 July 2026 / Accepted: 29 July 2026 / Published: 31 July 2026

Abstract

Climate change is expected to profoundly affect forest biodiversity, yet its impacts on saproxylic and non-saproxylic insects remain largely mediated by forest structure and management. Saproxylic beetles strongly depend on tree-related microhabitats (TreMs), which reflect stand development, deadwood dynamics, and habitat continuity. In this study, we assessed how future climate change may influence saproxylic beetle richness and TreM diversity across the Italian Apennines by integrating long-term field data from 336 forest plots with machine-learning models and the process-based forest model 3D-CMCC-FEM. Beetle and TreM richness were projected under a baseline current climate scenario (CCS) and two future climate scenarios (RCP4.5 and RCP8.5) until 2100. Gaussian process regression models with strong extrapolation performance were used to forecast richness trajectories based on simulated forest structural and climatic variables. Results show that host tree species and stand structural development are the primary drivers of both beetle and TreM richness, while differences among climate scenarios are comparatively small. Richness trajectories differed markedly among forest types: beech stands showed temporary mid-century increases under climate change scenarios, chestnut forests remained relatively stable, and silver fir and Turkey oak stands exhibited long-term declines or convergence toward lower richness levels. Patterns of TreM richness closely mirrored beetle richness, highlighting the central role of structural complexity and microhabitat availability. Overall, the effects of climate change on beetle diversity appear to be largely indirect, acting through forest growth, mortality, and microhabitat dynamics rather than through direct climatic constraints. These findings emphasize that forest management practices maintaining structural heterogeneity and microhabitat continuity can substantially mitigate climate-driven biodiversity changes, supporting the integration of TreMs into climate-adaptive forest management strategies.

1. Introduction

Climate change is a primary threat to global biodiversity [1,2]. Changes in temperature and precipitation have reduced the extent of suitable habitats for wild species [3,4], forcing them to move into suboptimal areas or leading to extinction [5,6]. The latter is certainly the most likely outcome for rare species, which are usually already threatened by other stressors such as habitat loss, contaminants, and interactions with invasive species, and that often suffer from small population sizes and restricted distributions [7,8]. For these species, rapid intervention through the planning of mitigation and conservation measures is essential, for example by improving networks of protected areas that ensure high-quality habitats, are less vulnerable to climatic extremes, are able to function as refuges and maintain important gene pools [3,9]. However, twenty-first-century conservation planning must address not only habitat degradation and fragmentation, but also the increasingly complex interactions between anthropogenic pressures and climate change. This requires predictive tools that anticipate biodiversity responses to future conditions, such as species distribution models (SDMs; [10]), which identify potential areas of conservation value under different climatic scenarios [11]. Nevertheless, most studies on the effects of climate change on animal species distributions have focused on vertebrates, whereas invertebrates—despite representing the overwhelming majority of global biodiversity—remain severely understudied [12,13]. This knowledge gap is critical, given the growing evidence of global declines in insect abundance and diversity [14,15,16]. The magnitude and drivers of these changes, however, remain poorly understood, especially for taxa with complex life cycles and strong microhabitat dependence, such as saproxylic beetles [17].
Saproxylic beetles represent a key functional group in forest ecosystems, as they depend on dead or decaying wood during at least one stage of their life cycle [18,19]. They play a pivotal role in decomposition processes, facilitating nutrient recycling and contributing to forest resilience [19,20]. Moreover, they support numerous trophic interactions, serving as an essential food source for several vertebrate species, including woodpeckers, bats, and martens [21,22]. Despite their ecological relevance, many saproxylic beetles are highly sensitive to environmental change due to their dependence on microclimatic stability and the availability of specific tree-related microhabitats, such as hollows, dead branches, or decaying trunks [23,24,25].
Several studies have shown that montane species are particularly vulnerable to climate change [26], mainly those with limited geographic ranges, high habitat specialization, or endemism [27,28]. This pattern is especially concerning for many saproxylic beetles, which exhibit restricted distributions and are often confined to relic forest habitats [29]. Although upward shifts in distribution have been reported for numerous taxa, it remains uncertain how localized saproxylic beetles inhabiting the highest mountain zones will respond to further warming, given their limited dispersal capabilities and strong habitat specificity.
Tree-related microhabitats (TreMs) are structural features occurring on living or standing-dead trees that provide essential resources for numerous forest-dwelling organisms [23,30,31]. These include cavities, sap runs, bark loss, cracks, exposed wood, dead branches, epiphytic growths, and fungal fruiting bodies, each of which supports distinct communities of invertebrates, fungi, lichens, and vertebrates [31,32,33]. For saproxylic beetles, TreMs act as critical breeding and feeding sites, influencing both species diversity and community composition at the stand level [34,35]. Their formation depends on long-term ecological processes, including tree senescence, decay, and disturbance regimes, and their persistence is closely linked to forest continuity and the presence of old-growth attributes [36,37]. Consequently, forest management practices that reduce the availability of large old trees, standing deadwood, or damaged structures can drastically limit TreM abundance and diversity [23,38]. The conservation of TreMs therefore represents an essential component of forest biodiversity strategies, as they encapsulate the fine-scale heterogeneity upon which saproxylic organisms rely [39].
Recent research has also revealed that climatic factors—particularly temperature and humidity—can influence saproxylic community dynamics and phenology [17,40]. Long-term monitoring in Mediterranean woodlands has shown that even modest temperature increases can shift species activity periods, altering phenological synchrony and potentially disrupting ecological interactions among trophic guilds [17]. Such changes may further exacerbate the vulnerability of these assemblages, especially in regions such as southern Europe, where climatic extremes are intensifying [41,42]. Increases in summer temperatures may benefit a few thermophilic or generalist species, while a larger proportion of specialists—particularly those adapted to cooler, more humid conditions—are likely to decline as precipitation patterns become more erratic [40,43].
Given the ecological significance and conservation sensitivity of saproxylic beetles, there is an urgent need to integrate climate projections into biodiversity assessments and management strategies. Predictive models based on climatic suitability are fundamental for anticipating distributional shifts and identifying potential refugia or “hotspots” of rare species richness [44,45]. These statistical approaches enable the evaluation of the potential effects of existing protected area networks under future scenarios. However, the implementation of conservation pathways to guide the prioritization of areas where conservation efforts would yield the greatest benefits should be supported by a range of models that together cover a broad set of indicators and processes. Coupling distribution models with the spatial assessment of TreMs and temporal dynamics of forest structure, as simulated by process-based forest models (PBFM), can provide a more mechanistic understanding of how microhabitat availability mediates species persistence under changing environmental conditions [39].
In this context, the present study examines how climate change may influence the diversity and richness of saproxylic and non-saproxylic beetles in the Italian Apennines by projecting biodiversity patterns under multiple future climate scenarios. By integrating process-based modelling of forest dynamics (3D-CMCC-FEM, [46]), TreMs, and machine-learning approaches, we evaluate how changes in forest structure may affect beetle richness under future climatic conditions.
We hypothesize that: (A) forest structural complexity and host tree species are stronger determinants of beetle richness than direct climatic variation; (B) climate change will primarily affect beetle communities indirectly through its influence on forest growth, stand development, and TreM availability; and (C) responses will differ among forest types because of species-specific structural and ecological characteristics.
The principal aim of this study is to quantify projected changes in beetle richness and TreM diversity under contrasting climate scenarios. The secondary aims are to: (i) compare the relative importance of forest structure, host tree species, and climate in explaining beetle and TreM richness; (ii) evaluate the predictive performance of machine-learning models under future extrapolation conditions; and (iii) identify forest types and management strategies that are most likely to promote biodiversity resilience under future climates.

2. Materials and Methods

2.1. Study Area and Data Collection

The present study is based on a long-term sampling framework, where some forest structural variables, tree-related microhabitats, and beetle assemblage data have previously been collected and reported [47,48,49]. Field data were collected from a network of 336 georeferenced forest plots distributed along the Apennine mountain chain in central and southern Italy, covering a wide latitudinal and altitudinal gradient from the northern Apennines of Tuscany and Umbria to the southernmost ranges of Calabria (Figure 1). The plots are located across seven Italian administrative regions and include valuable, often protected forest landscapes representative of a broad range of Mediterranean and montane forest ecosystems, capturing substantial variability in geomorphological, bioclimatic, and forest management conditions. Nine large forested areas (i.e., Abeti Soprani, Aspromonte, Bosco Pennataro, Casentino 1 and 2, Cilento, Gran Sasso, Gubbio, La Verna, Matese, Pian degli Ontani, Baldo, and Vallombrosa) were selected, with 1–3 sampling sites established within each area, for a total of 13 sites included in the present study. At each site, a variable number of traps were installed, usually spaced 20–250 m apart (Supplementary Information, Table S1).
Within each circular plot (radius 13 m), all living trees with Diameter at Breast Height (DBH) ≥ 10 cm were measured for species, diameter, height, and basal area, while deadwood components (standing and downed dead trees, snags, stumps, and coarse woody debris) were recorded and classified according to decay stage and volume [50,51]. TreMs were inventoried on both living and dead trees following the standardized typology proposed by Larrieu et al. [23].
Beetle assemblages were sampled between 2012 and 2021 using flight interception traps and emergence traps, following a standardized sampling protocol [52]. Flight interception traps consisted of transparent panes (60 × 40 cm) and remained active from May to September, with samples collected at approximately 30-day intervals. All collected specimens were preserved in 70% ethanol, then mounted (card-mounted or pinned), dried, and identified at the species level by taxonomic specialists (see Acknowledgments). Taxonomic nomenclature (family, scientific name, and authorship) was validated and harmonized according to the Fauna Europaea database. The entomological material is preserved at the Department of Biosciences and Territory, University of Molise.

2.2. Methods

2.2.1. Beetle Species and TreM Richness

Overall, 1572 occurrence records were collected, corresponding to 821 beetle species. Of these, 336 species (40.9%) have been assessed under the IUCN Red List categories, whereas 485 species (59.1%) have not yet been evaluated. Species were only weakly shared among the study areas: 492 species (59.9%) were recorded at a single site, whereas 329 species (40.1%) occurred at two or more sites. This high proportion of site-exclusive species indicates a marked turnover in beetle assemblages and highlights the substantial differences in community composition among the study areas (Supplementary Information, Table S2).
All microhabitat records were classified or harmonized according to the typology of Larrieu et al. [23], ensuring consistency and comparability among the surveyed forest stands. Overall, 5984 TreMs were recorded, covering a total sampled area of 17.84 ha and resulting in an overall density of 335 TreMs ha−1. At the site level, 420 TreMs were recorded in Abeti Soprani (158 TreMs ha−1), 495 TreMs in Aspromonte (466 TreMs ha−1), 420 TreMs in Bosco Pennataro (158 TreMs ha−1), 86 TreMs in Baldo (162 TreMs ha−1), 27 TreMs in Casentino 1 (51 TreMs ha−1), 107 TreMs in Casentino 2 (202 TreMs ha−1), 359 TreMs in Cilento (483 TreMs ha−1), 514 TreMs in Gran Sasso (510 TreMs ha−1), 245 TreMs in Gubbio (177 TreMs ha−1), 232 TreMs in La Verna (437 TreMs ha−1), 434 TreMs in Matese (136 TreMs ha−1), 72 TreMs in Pian degli Ontani (136 TreMs ha−1), and 2573 TreMs in Vallombrosa (1031 TreMs ha−1).
Richness was calculated separately for beetles and TreMs at the plot level by counting the number of unique beetle species and TreM types. Table 1 summarizes field plot data by species, including the number of plots, survey year, elevation, structural variables (mean of DBH and height), beetle richness, and TreMs (mean and standard deviation).

2.2.2. Modeling Framework

It is well established in the literature that the presence and behavior of many saproxylic and non-saproxylic beetles are influenced by living trees and dead wood, the size and species of the trees present, and various environmental and climate parameters, including radiation, temperature, and precipitation. We first modeled the observed variance in beetle and TreMs richness by building and comparing multiple ML models using independent variables known to be strongly related to the dependent variables. Secondly, we simulated forest growth and dynamics at the plot level under different future climatic conditions using a state-of-the-art process-based forest model, the 3D-CMCC-FEM model [46]. Finally, we applied the ML model to the simulated climatic and forest states produced by the forest model to predict beetle and TreMs richness for each simulation year. In the next sections, we present the ML and process-based models, along with the variables used to fit and initialize them.
ML Model Comparison
Numerous studies have found a relationship between saproxylic richness and structural and climatic variables [49,53,54], in different environments and at various spatial scales [17,45]. However, the ability of ML models to accurately predict previously unseen conditions and make reliable decisions is fundamentally determined by the information contained in the training dataset. Since the aim of this framework is to make predictions under future climate conditions and forest states, it is extremely likely that the prediction samples will lie outside the convex hull of the training set, so the model’s predictive performance will depend on its extrapolation ability [55]. In this study, we test different ML models within the validation framework proposed by Yu et al. [56], which was specifically designed to assess their extrapolation abilities across all independent variables. Briefly, their method consists of six steps:
Sort the dataset based on Xi in descending order (backward sequence), where Xi is the ith independent variable;
Split the dataset into training and test sets (80%/20%, respectively);
Fit ML model on training set;
Test the model on the test set and evaluate the performance;
Repeat 1–4 for every independent variable X;
Repeat 1–5, but sort the database in ascending order (forward sequence).
The extrapolation performance is calculated by averaging the performance metric over all independent variables for both sequences (i.e., backward and forward). In this study, we used the root mean square error (RMSE) as a performance metric (Equation (1)):
R M S E =   i = 1 n ( y i y i ^ ) 2 n
Yu et al. [56] also proposed an extrapolation degree metric (ED) to account for interpolation contribution while computing the performance (since ordering for one independent variable does not ensure that in the test set, all other variables will be outside their training range). The ED measures how far the independent variables in the test set extend beyond the range defined by the training data, thereby quantifying the proportion of test-set performance attributable to true extrapolation. Strong performance and high ED values suggest that model predictions remain reliable even for samples that lie well outside the training domain. Conversely, good performance with low ED values suggests that the model’s extrapolation capability is likely limited to samples only marginally beyond the training range.
ED is calculated as:
E D = 1 n i i j e i , j j a i , j
where
e i , j = m i n i x i , j t r a i n x i , j t e s t f o r   x i , j t e s t < m i n i x i , j t r a i n x i , j t e s t m a x i x i , j t r a i n f o r   x i , j t e s t > m a x i x i , j t r a i n 0 f o r   a l l   o t h e r s   c a s e s
a i , j = m e a n i x i , j t r a i n x i , j t e s t f o r   x i , j t e s t < m i n i x i , j t r a i n x i , j t e s t m e a n i x i , j t r a i n f o r   x i , j t e s t > m a x i x i , j t r a i n 0 f o r   a l l   o t h e r s   c a s e s
We computed ED for the extrapolation test set with respect to the training set, and we compared it to the ED computed for the prediction set (i.e., the dataset built for forecasting, see Section 2.3.) with respect to the whole field dataset. The comparison ensures that the model’s extrapolation capabilities are sufficient to predict under never-before-seen future conditions. For more details on the extrapolation validation, refer to the original work by Yu et al. [56].
We tested nine ML models, namely the Support Vector Machine with a radial kernel function (svmRadial), Gaussian Process regression with linear (gaussLinear), polynomial (gaussPoly), and radial kernel function (gaussRadial), K-nearest neighbour (kknn), multiple linear regression (lm), partial least square (pls), partial least squares with generalized linear model (plsRglm), and kernel-based regularized least squares (krlsRadial). Following the result of Yu et al. [56], we did not test tree-based ML models due to their known poor performance in extrapolation. Each model was optimized for its own hyperparameter set using a 25-iteration bootstrap procedure. The best model was then refitted and optimized using all observations (i.e., 336 field plots) for forecasting purposes (see Section 2.3.), and its interpolation performance was evaluated by averaging the RMSE over 100 bootstrap iterations. Model fitting and optimization were performed with the caret R package [57] in R version 4.2.1. The best model was chosen based on the lowest extrapolation RMSE.
Process-Based Modeling
To simulate forest growth under different climate scenarios, we used the PBFM ‘Three Dimensional-Coupled Model Carbon Cycle-Forest Ecosystem Module’ (3D-CMCC-FEM v 5.7) [58,59,60]. This model is a stand-level, process-based, biogeochemical and biophysical forest model designed to simulate carbon, nitrogen, and water cycles in forest ecosystems. The 3D-CMCC-FEM can simulate forest stand dynamics at the hectare- to landscape-scale (up to 1 km2), providing variables on daily to annual timescales. The model can reproduce key physiological processes that drive forest dynamics, including the effects of climate change and forest management. The underlying photosynthetic model is the biogeochemical model developed by Farquhar, von Caemmerer, and Berry [59], parameterized as described by Bernacchi et al. [61]. The Monsi–Saeki formulation of exponential light attenuation, coupled with the “Big-leaf” approach, is used to represent a multi-layered model and is implemented for sun- and shade-exposed leaves [62,63]. Autotrophic respiration (RA) is mechanistically divided into the maintenance of existing tissues (maintenance respiration, RM) and the cost of synthesizing new tissues (growth respiration, RG). Net primary productivity (NPP) is computed by subtracting RA from gross primary productivity (GPP). The model incorporates a seventh C-pool of non-structural carbon (NSC) to buffer periods during which respiration exceeds assimilation. For this reason, not all annual NPP is allocated to biomass production; instead, it can be used to replenish the NSC pool and sustain tree respiration (or leaf development during spring) during periods of negative carbon balance. In the extreme case of total NSC depletion, when current photosynthates cannot replenish the NSC pool, the model predicts stand mortality based on the carbon starvation hypothesis [46,64,65], one of the various mortality mechanisms accounted for by the model. The model accounts for six primary carbon and nitrogen structural biomass pools: leaves, stems, branches, fine roots, coarse roots, and fruits, as well as the NSC pool. Additionally, the model considers various C and N sub-pools, such as sapwood versus heartwood and live versus deadwood. All these pools are initialized at the start of the simulation and updated daily, monthly, or annually, depending on the process, and are handled differently for evergreen and deciduous species. The phenological and allocation schemes are all described in Collalti et al. [58].
The model output comprises a list of fluxes and structural and physiological variables, such as gross and net primary productivity, respiration flux, wood, biomass, and carbon stocks (partitioned by tree compartment). For a complete list of model output, refer to Collalti et al. [58]. In previous studies, the 3D-CMCC-FEM model was evaluated across a broad range of climate conditions and tree species at local, regional, and national scales [46,66,67]. Among other things, these studies demonstrated the model’s ability to realistically simulate GPP sensitivity to daily meteorology and forest structural attributes [66].

2.2.3. Structural Variables

Data on tree number per ha, DBH, height, and species were collected to characterize the living component of each plot. These structural variables, along with information on forest age, are required to initialize the 3D-CMCC-FEM model at the start of the simulation. The same variables, along with growing-stock volume, were included in the training set to train RF models to predict saproxylic beetle and TreM richness.

2.2.4. Climate Variables

Climate variables that drive the 3D-CMCC-FEM model include daily minimum, mean, and maximum temperatures (°C), shortwave incoming solar radiation (W m−2), precipitation (mm), and relative humidity (%). We extract these variables at a daily timescale from the dataset of climate variables obtained by dynamically downscaling the CMCC-CM global model climate simulations over Italy at 2.2 km resolution (see [66], for more details on this dataset [68]). The dataset provides such a suite of climatic variables for the historical period 1984–2006 and for two Representative Concentration Pathways (RCPs), namely RCP4.5 and RCP8.5. These are projections of future greenhouse gas concentration trajectories, formally adopted by the IPCC. RCP4.5 and RCP8.5 are the intermediate and the worst-case scenarios, respectively. In the former, an increase in radiative forcing of 4.5 W/m2 and a temperature rise of 2–3 °C relative to pre-industrial values are expected. In the latter, temperature and radiative forcing are even higher, increasing by 3–4 °C and 8.5 W/m2, respectively.
Finally, we generate a synthetic scenario with no climate change (current climate scenario, CCS) effects, to serve as a baseline for comparison. The CCS was created by repeating 30 years (1980–2010) of detrended historical climate variables through 2100. For more information on this procedure, please refer to Vangi et al. [66]. All climate variables were aggregated at the annual scale and included in the predictor set used to fit the ML models. A comparison of the climate variables across different scenarios is shown in the Supplementary Information (Figure S1).

2.2.5. Soil Variables

The 3D-CMCC-FEM also requires initial soil conditions, including soil texture (% of silt, sand, and clay) and depth. These data were derived from a national-level spatial soil database produced by the Soil Cartography Laboratory of the Council for Agricultural Research and Economics (CREA) [69]. The soil database has a spatial resolution of 250 m, representing Italy’s soil depth (in cm) and the weighted average content of silt, sand, and clay in the top meter of the soil profile. Since these variables are considered time-invariant, we do not include them in the predictor set used to fit the RF models. Their effect is, however, indirectly reflected in soil texture and depth, which shape the forest ecosystem’s response to changing environmental drivers, such as precipitation.

2.3. Prediction Under Future Conditions

A ML model for each independent variable (i.e., beetle richness and TreM richness) was fitted to the structural and climatic variables described above and validated using the extrapolation framework described above. The chosen models were used to make predictions under different climate scenarios (i.e., CCS, RCP4.5, and RCP8.5). The structural variables for each scenario were obtained from the 3D-CMCC-FEM model. The simulation runs were carried out without management, as we are interested in the direct climate impact on the response of undisturbed forest stands, avoiding the confounding effects of forest management. The climatic variables were directly derived from the high-resolution climate dataset for the corresponding scenario. Structural and climate variables represent the independent variables for model prediction.

3. Results

3.1. ML Validation

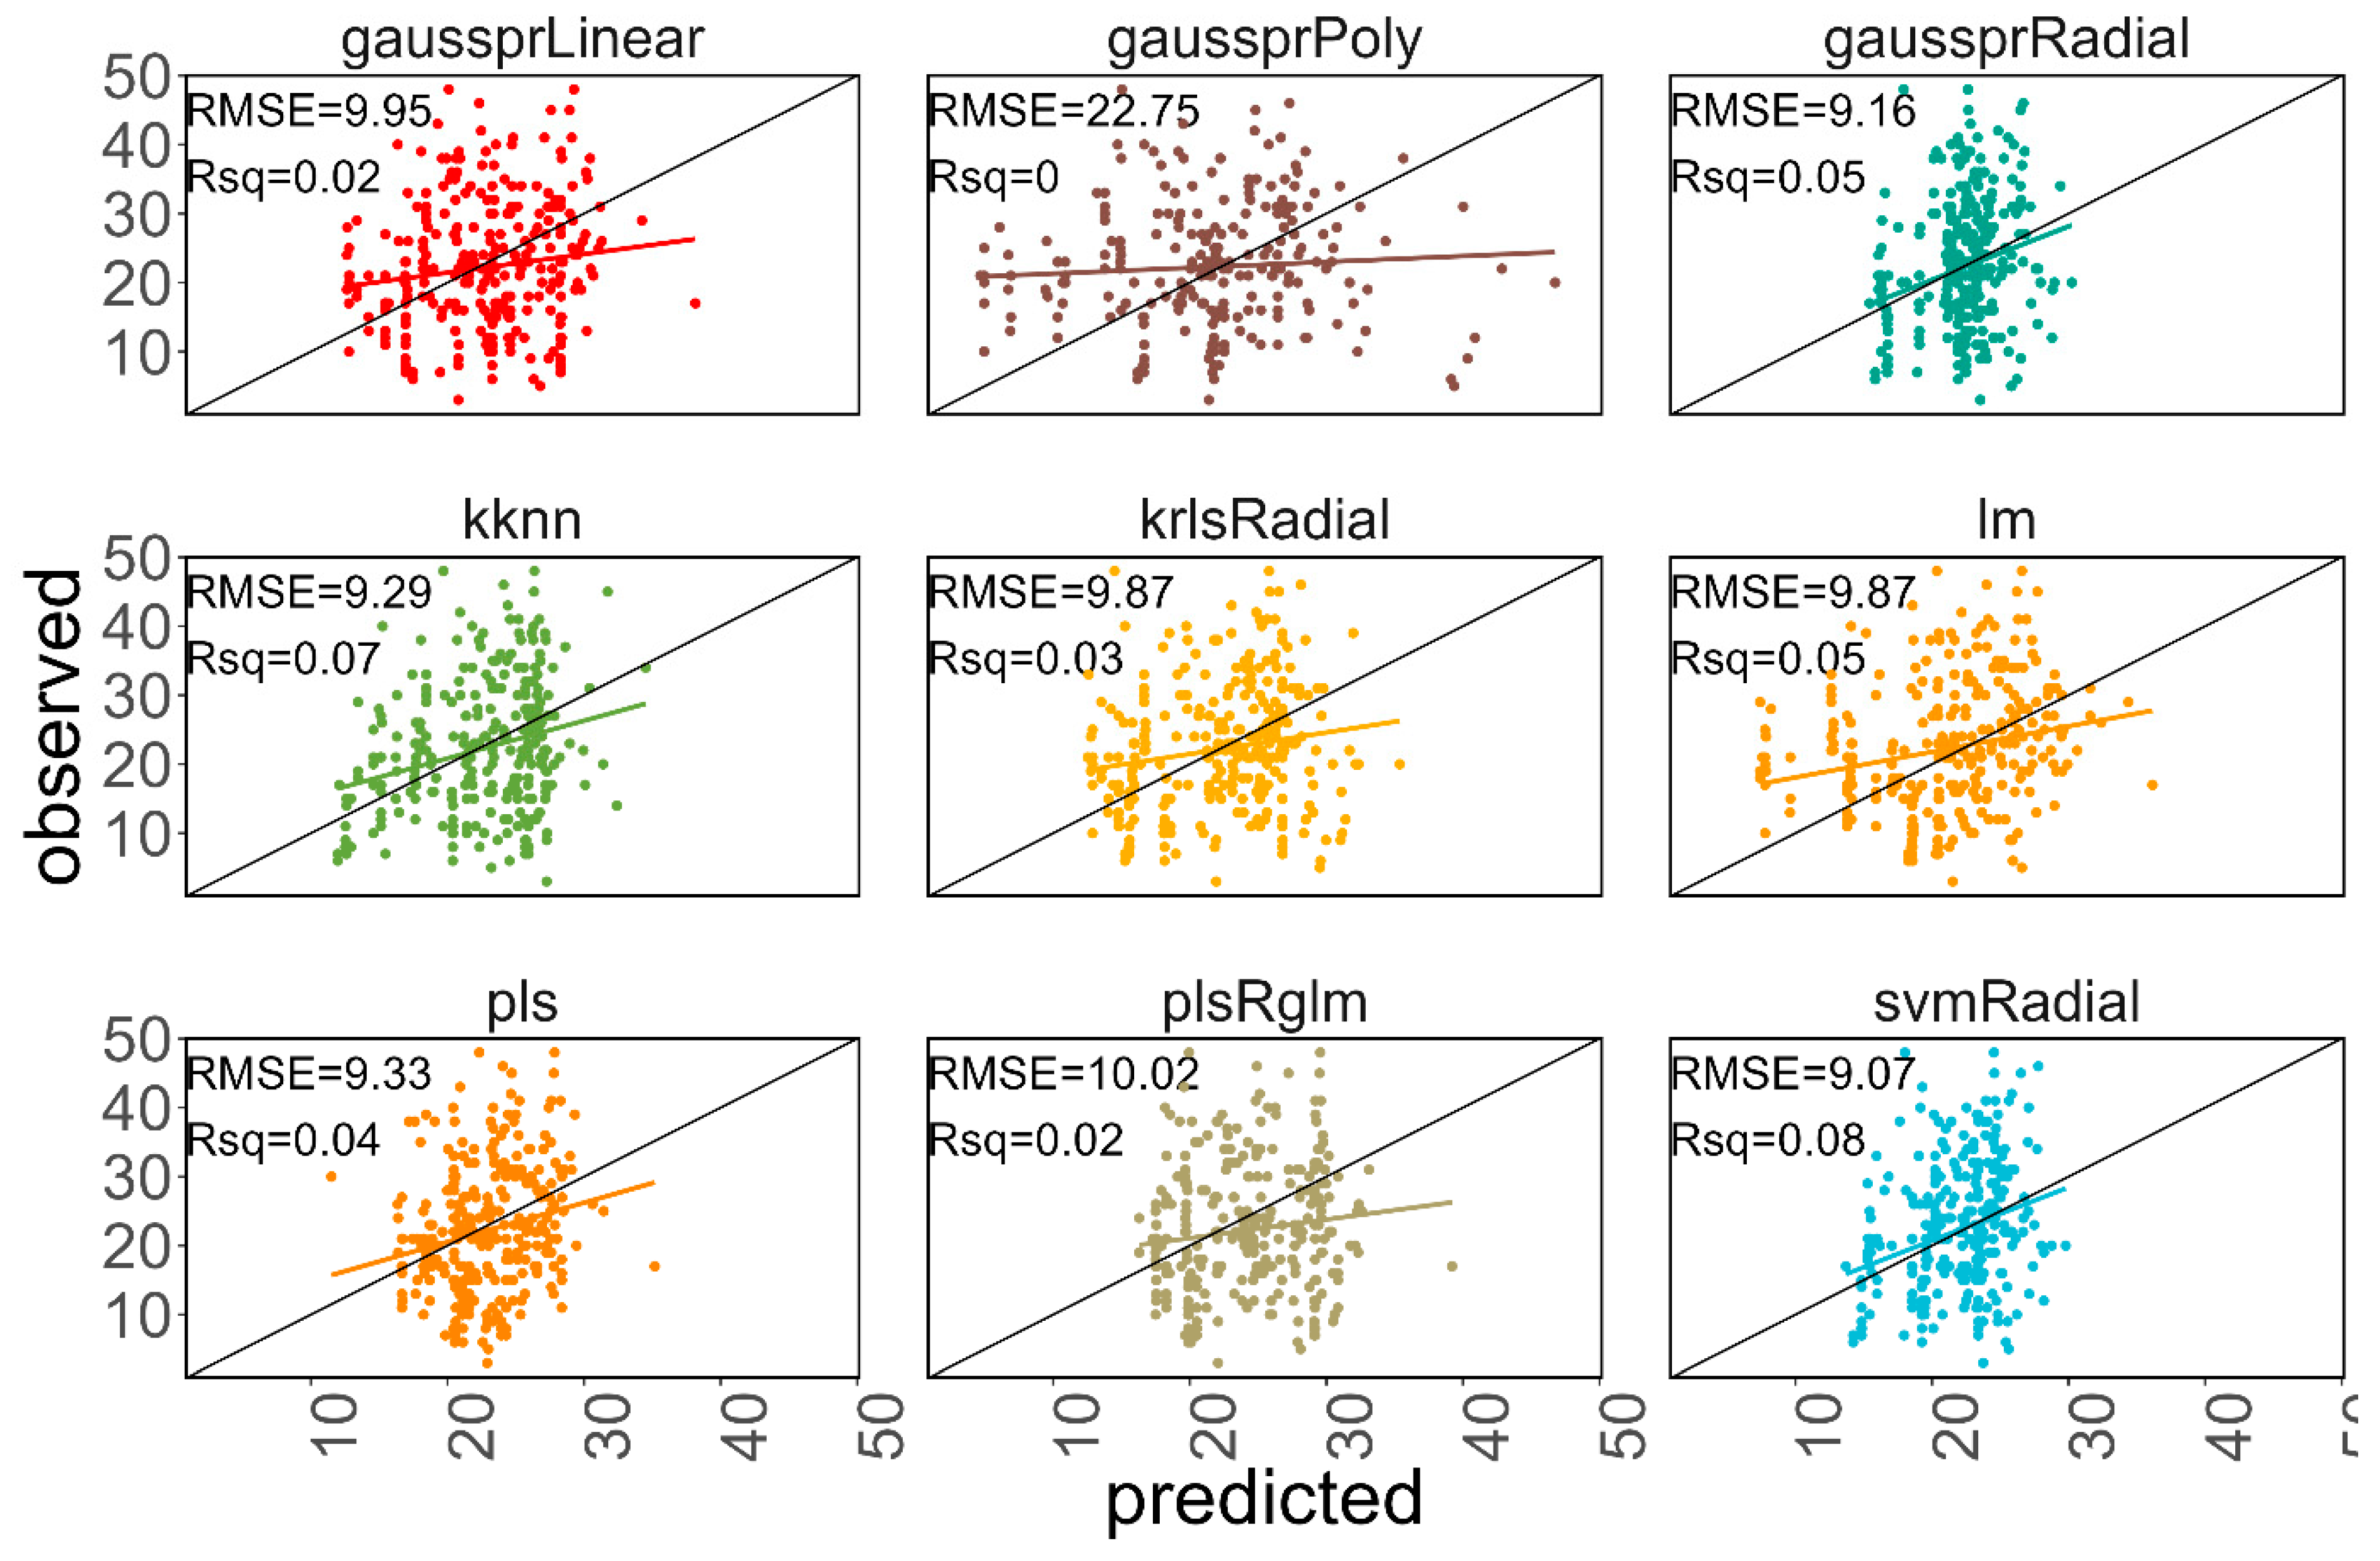
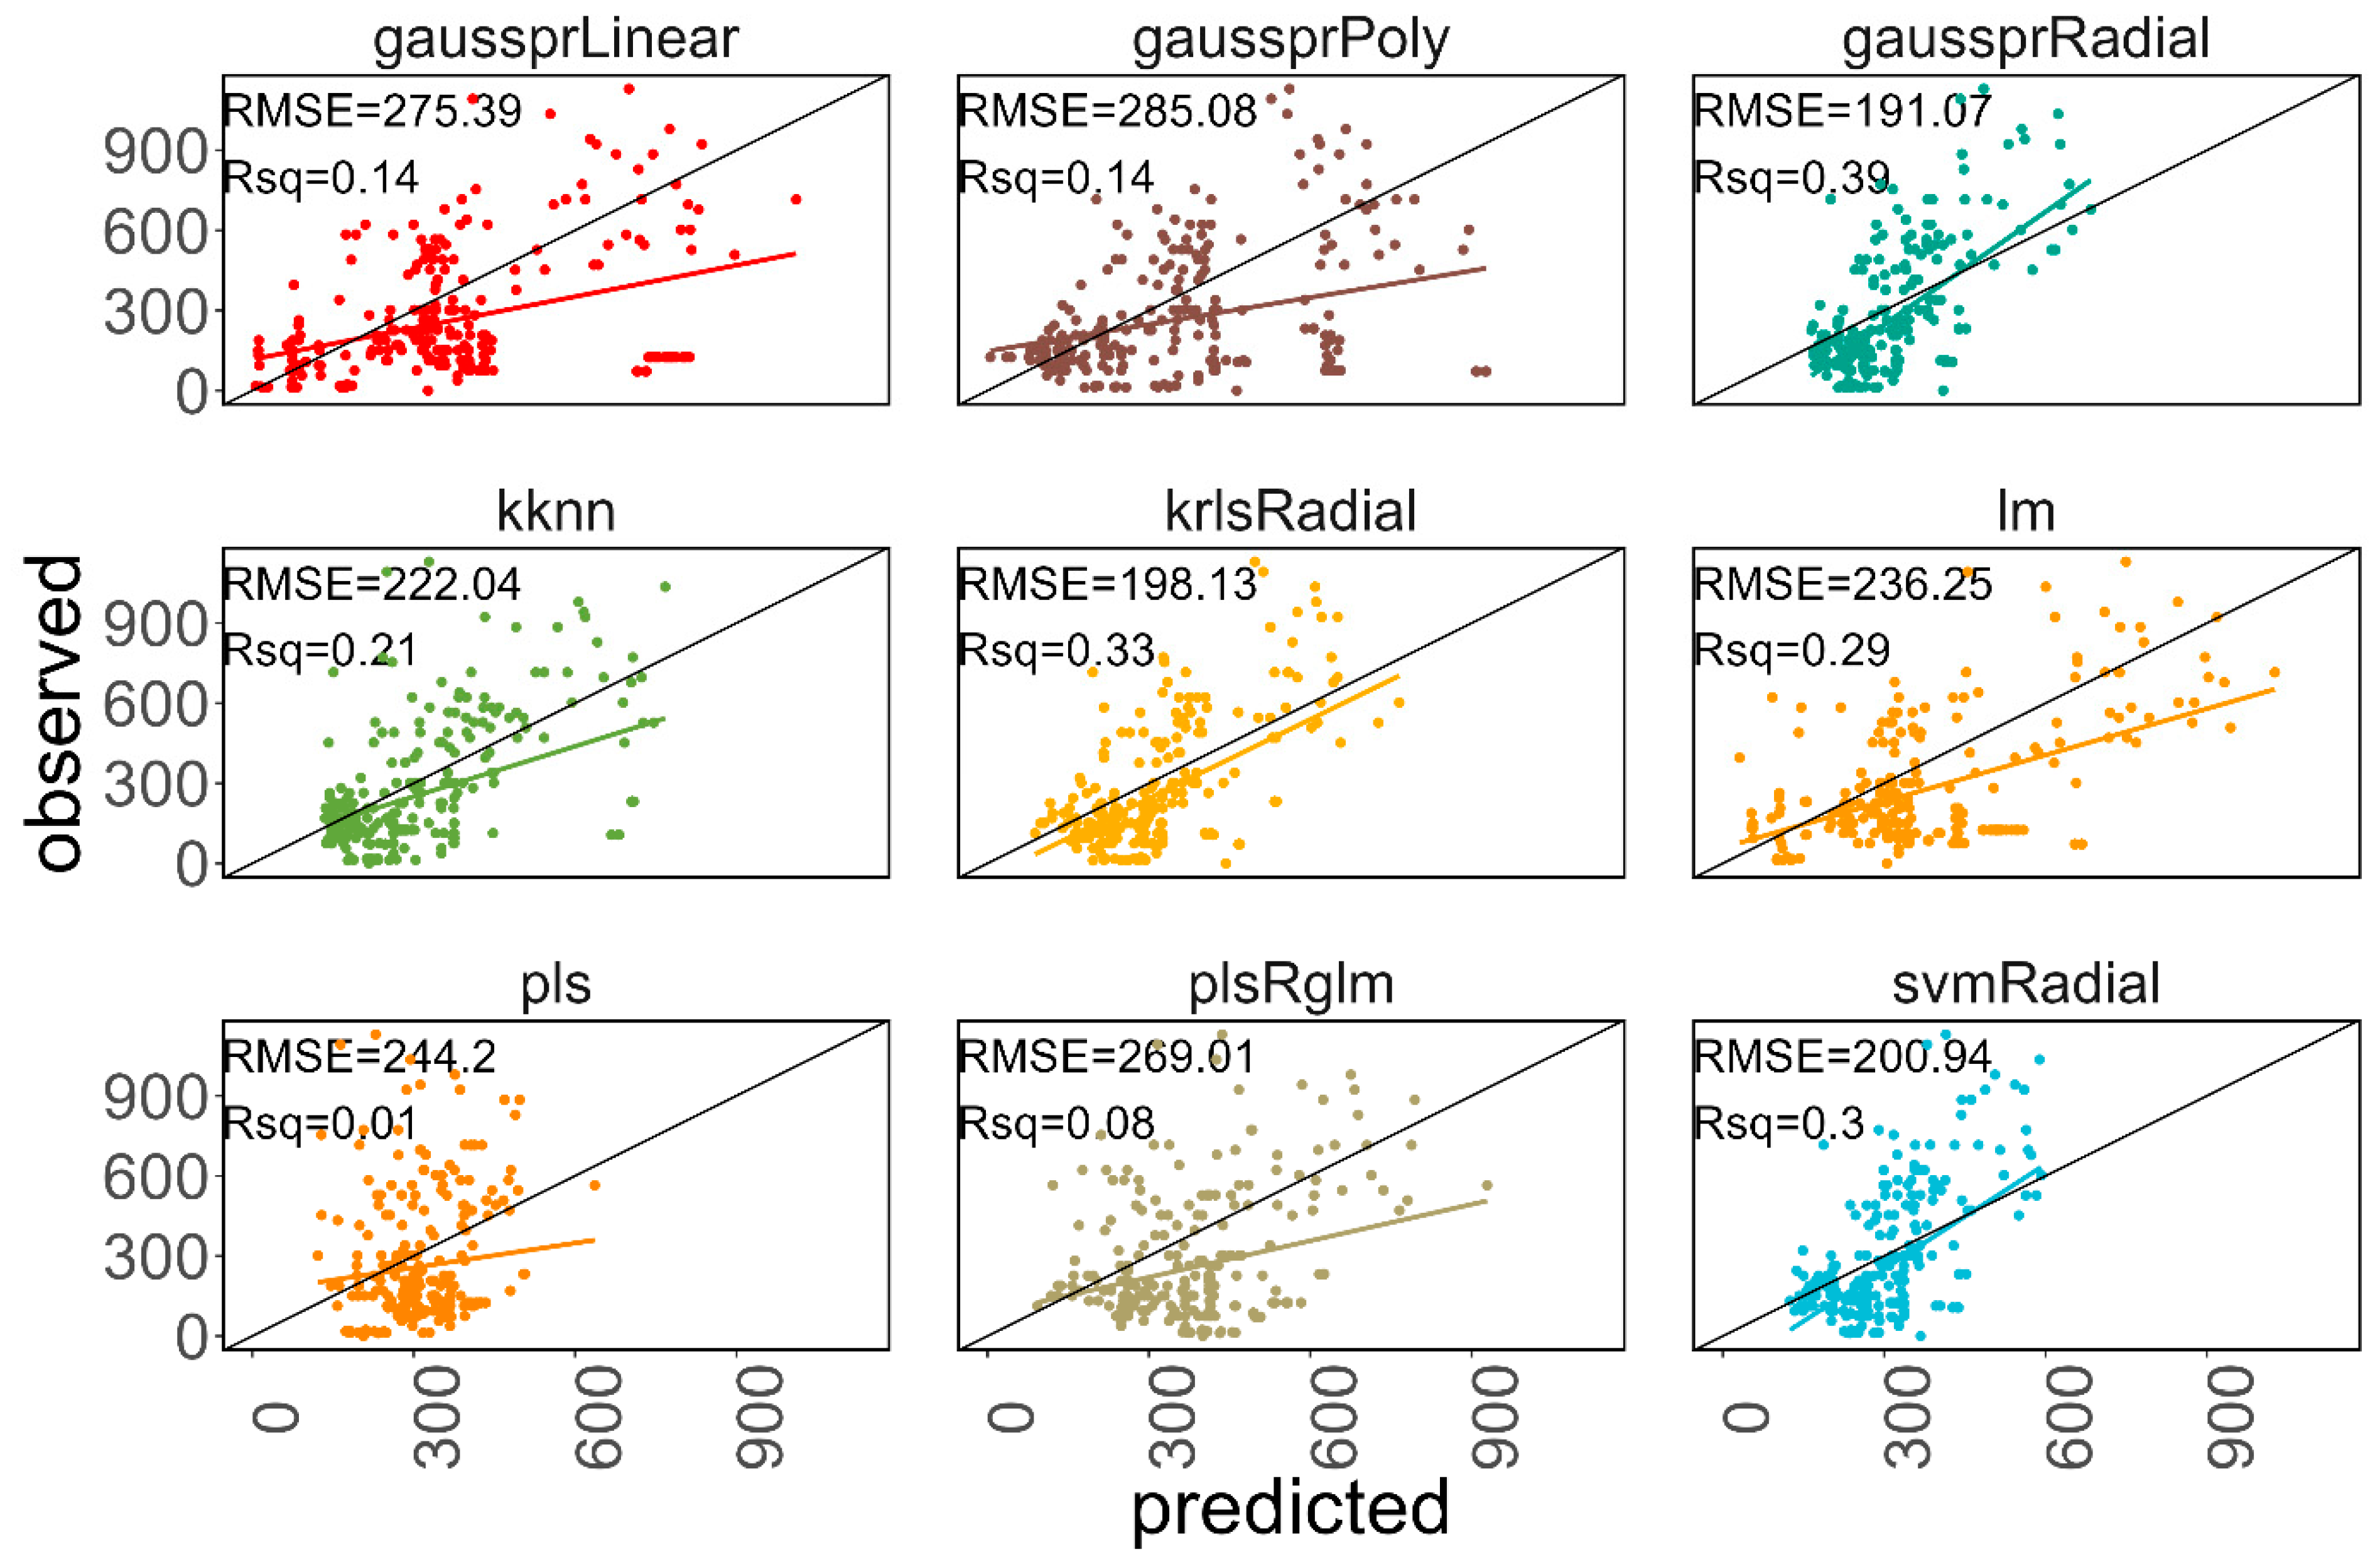
Gaussian process regression with a radial kernel function produced the best models in the extrapolation validation framework for both saproxylic and TreM richness, achieving RMSEs of 9.1 and 191.8 for beetles and TreM, respectively (Figure 2 and Figure 3). The ED in the extrapolation test set was 0.34, indicating that interpolation contributed ~66% to performance.
The interpolation validation yielded RMSE values of 7.3 and 139 for saproxylic beetles and TreM, respectively (Figure 2 and Figure 3 and Supplementary Information, Figures S2 and S3).

3.2. Prediction in Future Scenarios

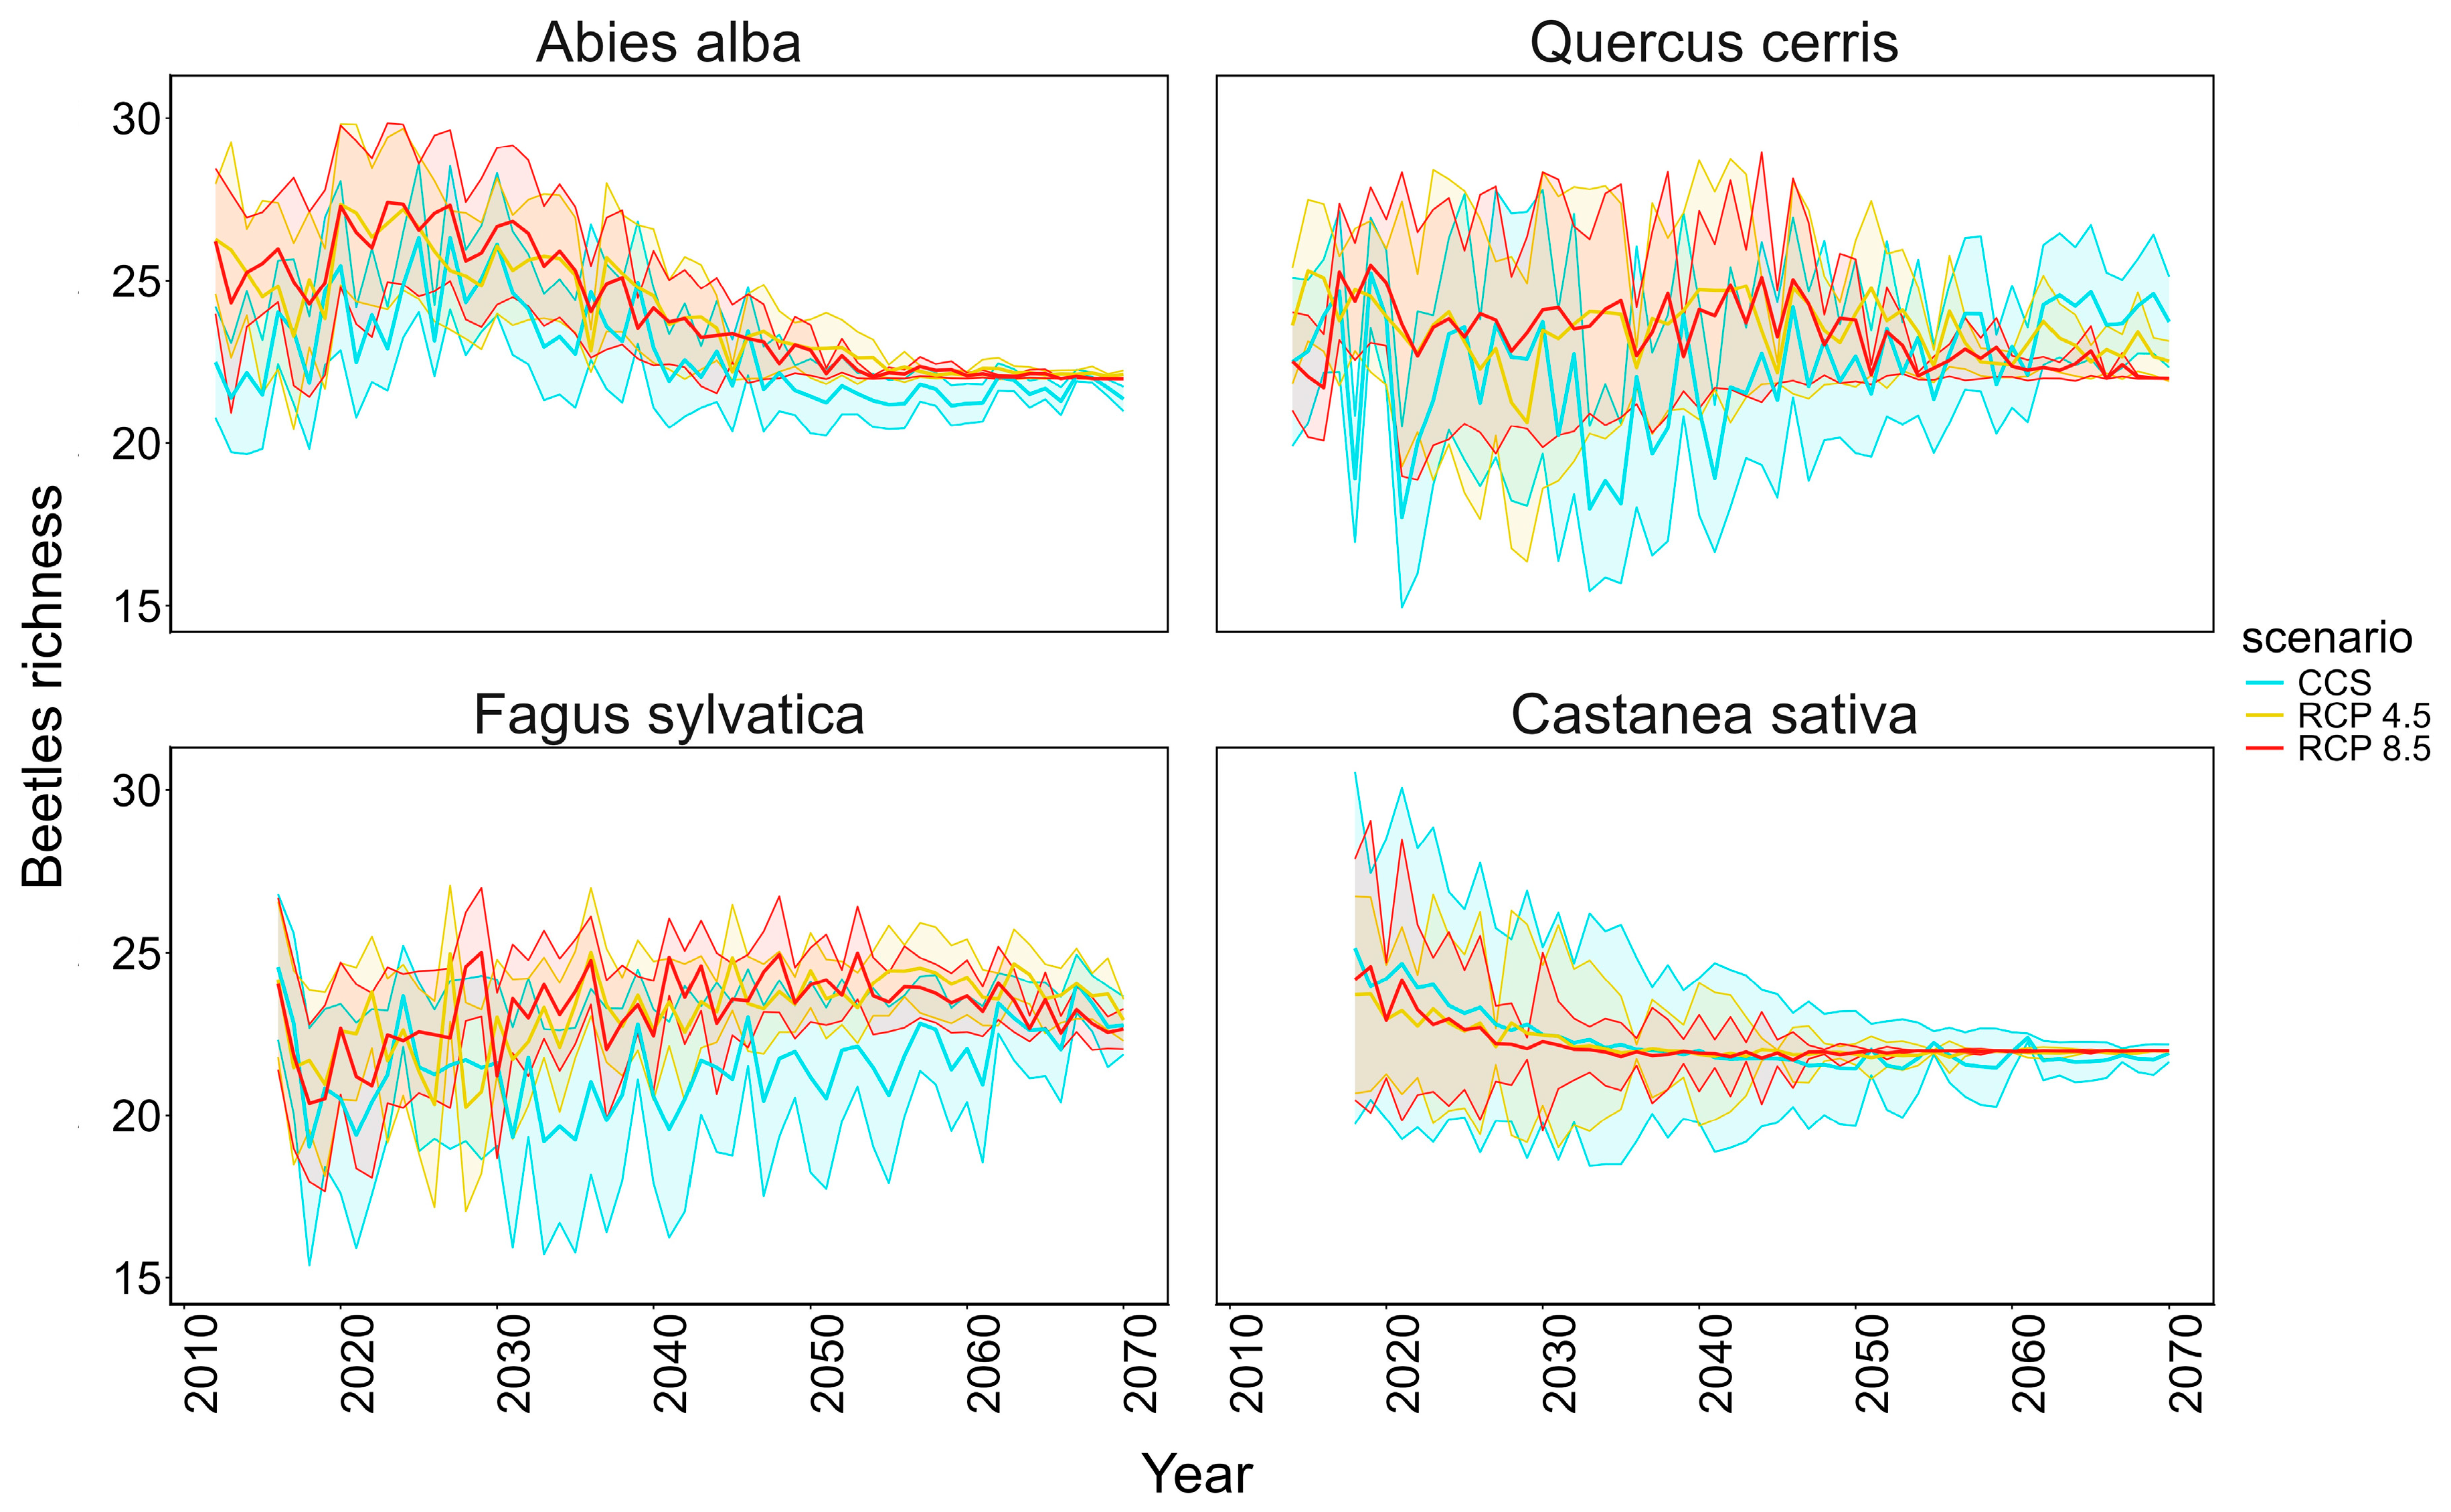
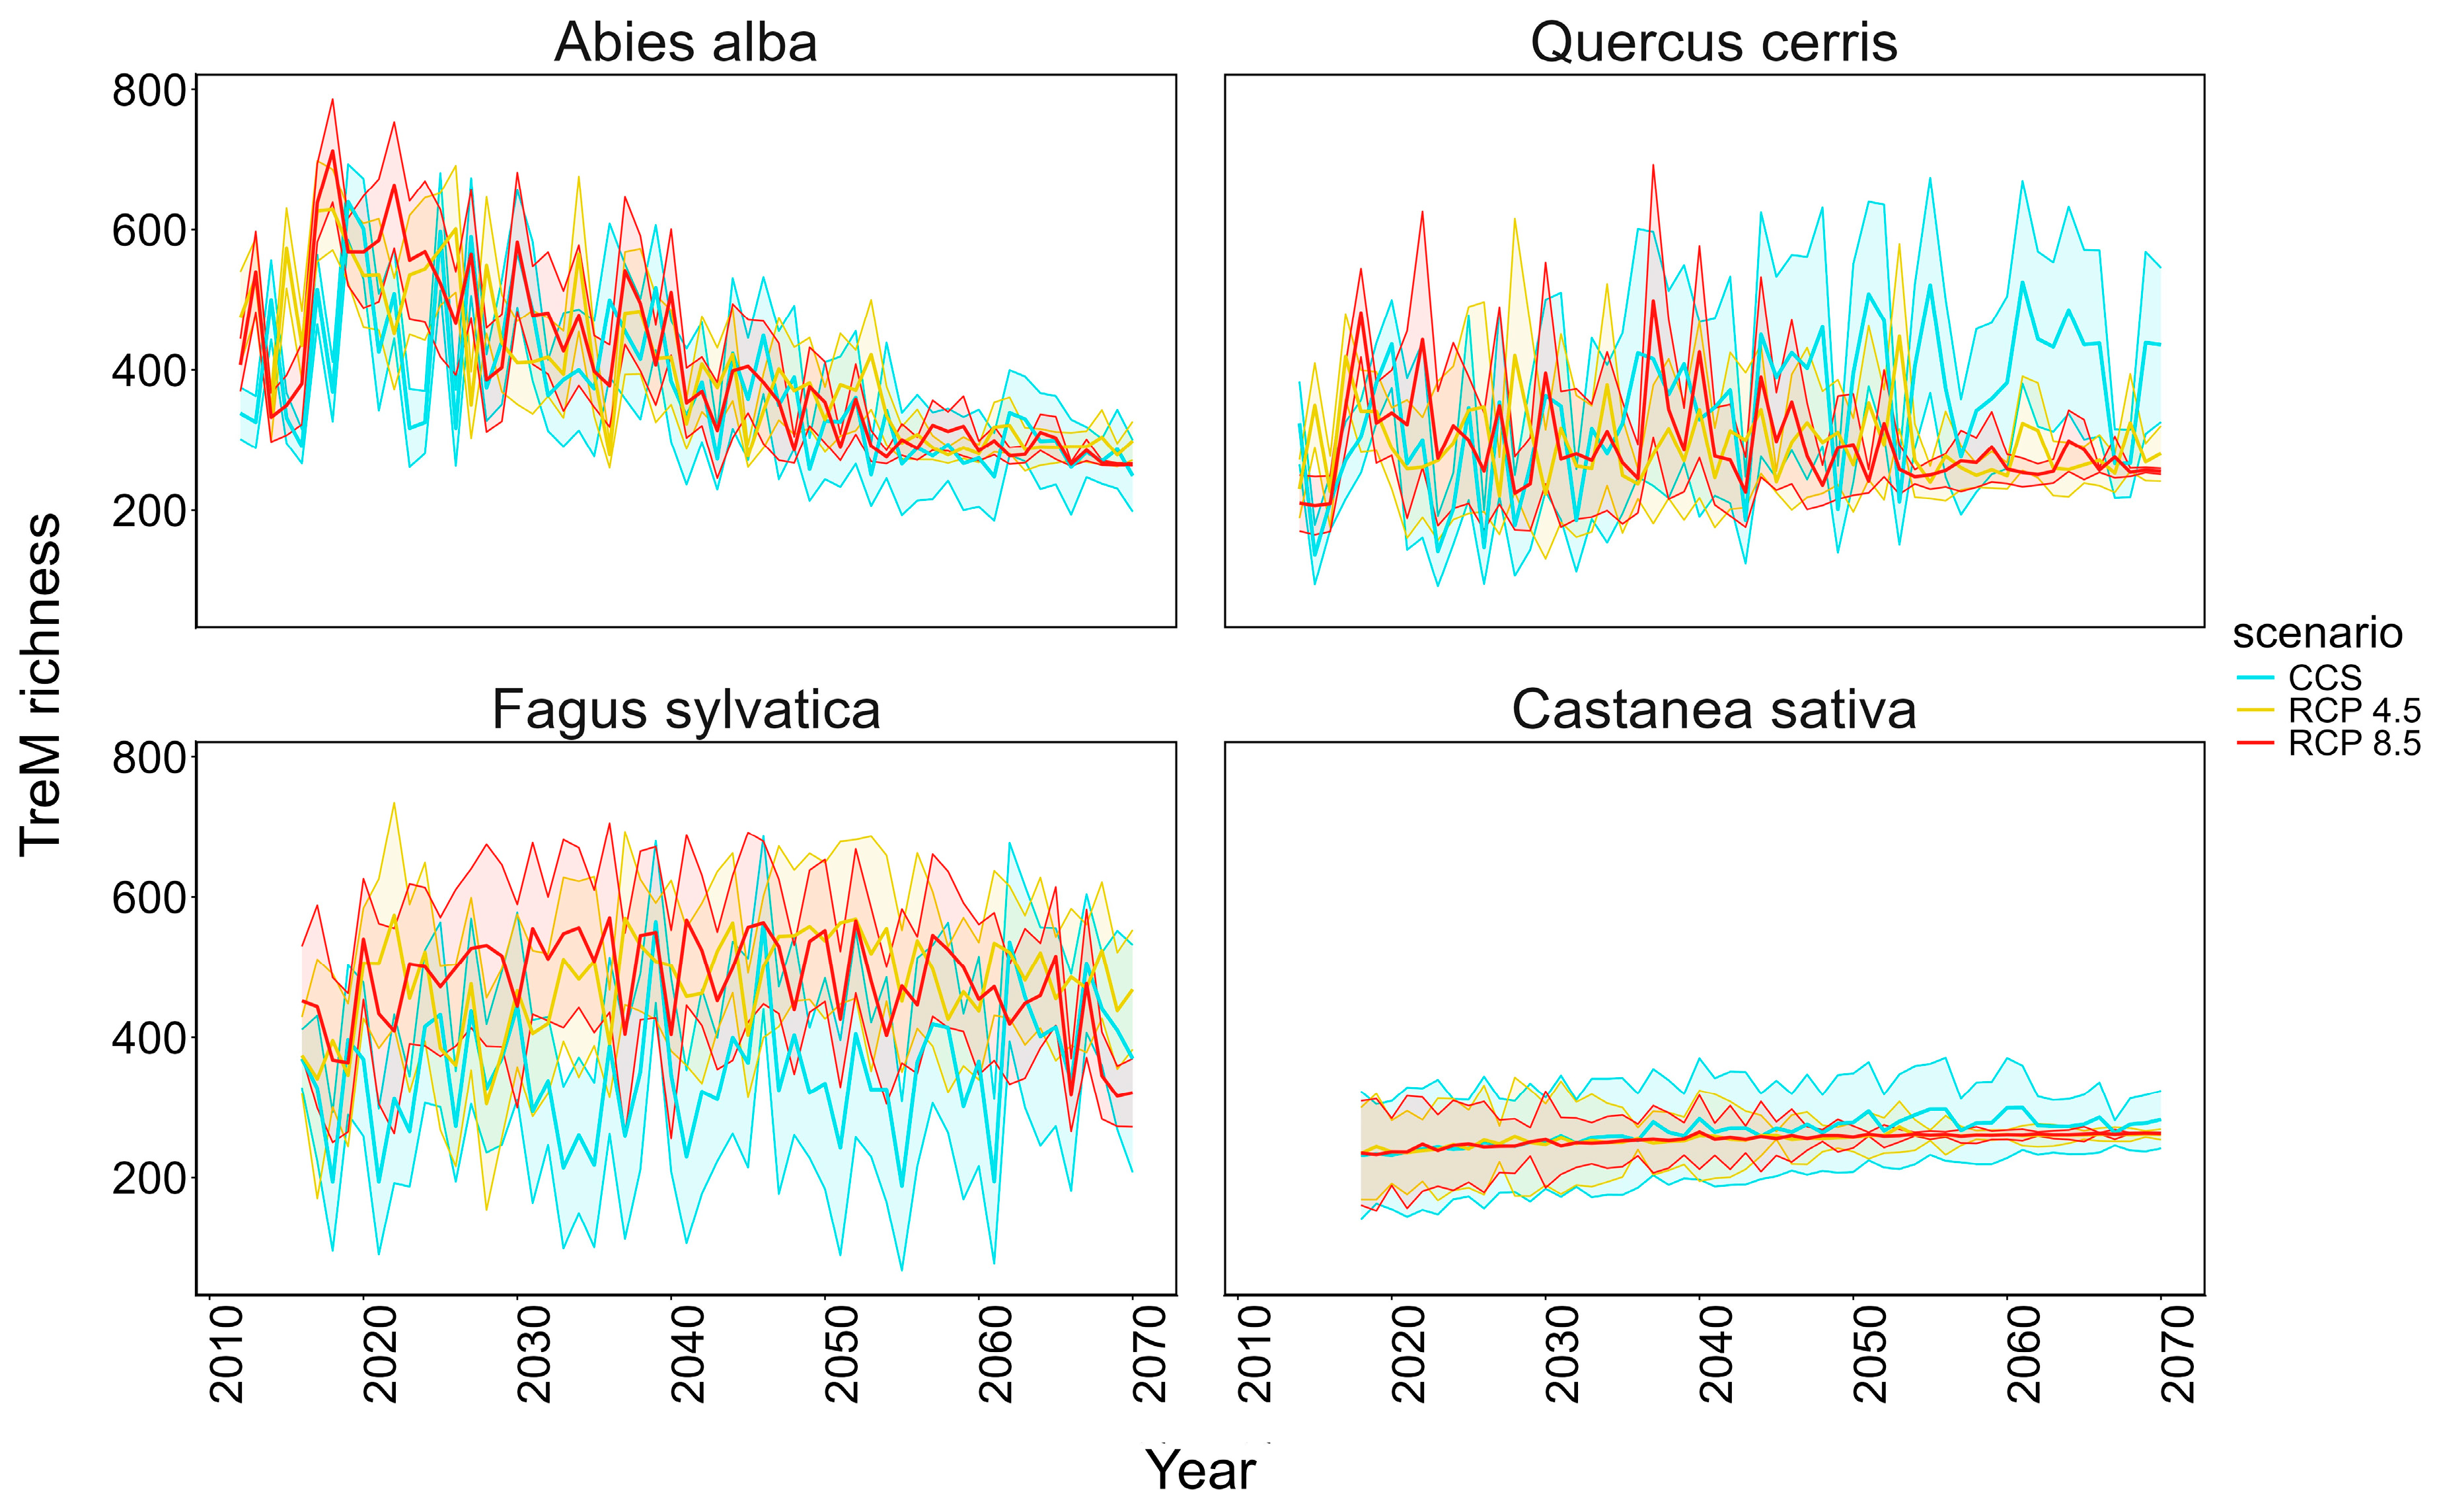
Using the GaussprRadial model, we predicted beetle and TreMs richness for each year simulated by the 3D-CMCC-FEM process-based model under three different future scenarios (Figure 4). The three scenarios yielded ED values of 0.13, 0.17, and 0.19 for CCS, RCP4.5, and RCP8.5, respectively. This indicates that the ML model extrapolated less than during the validation phase, confirming that its performance is also reliable for forecasting. After the first year of simulation, average richness ranged from 20 to 27 species per plot, indicating species-specific responses across different climate scenarios.
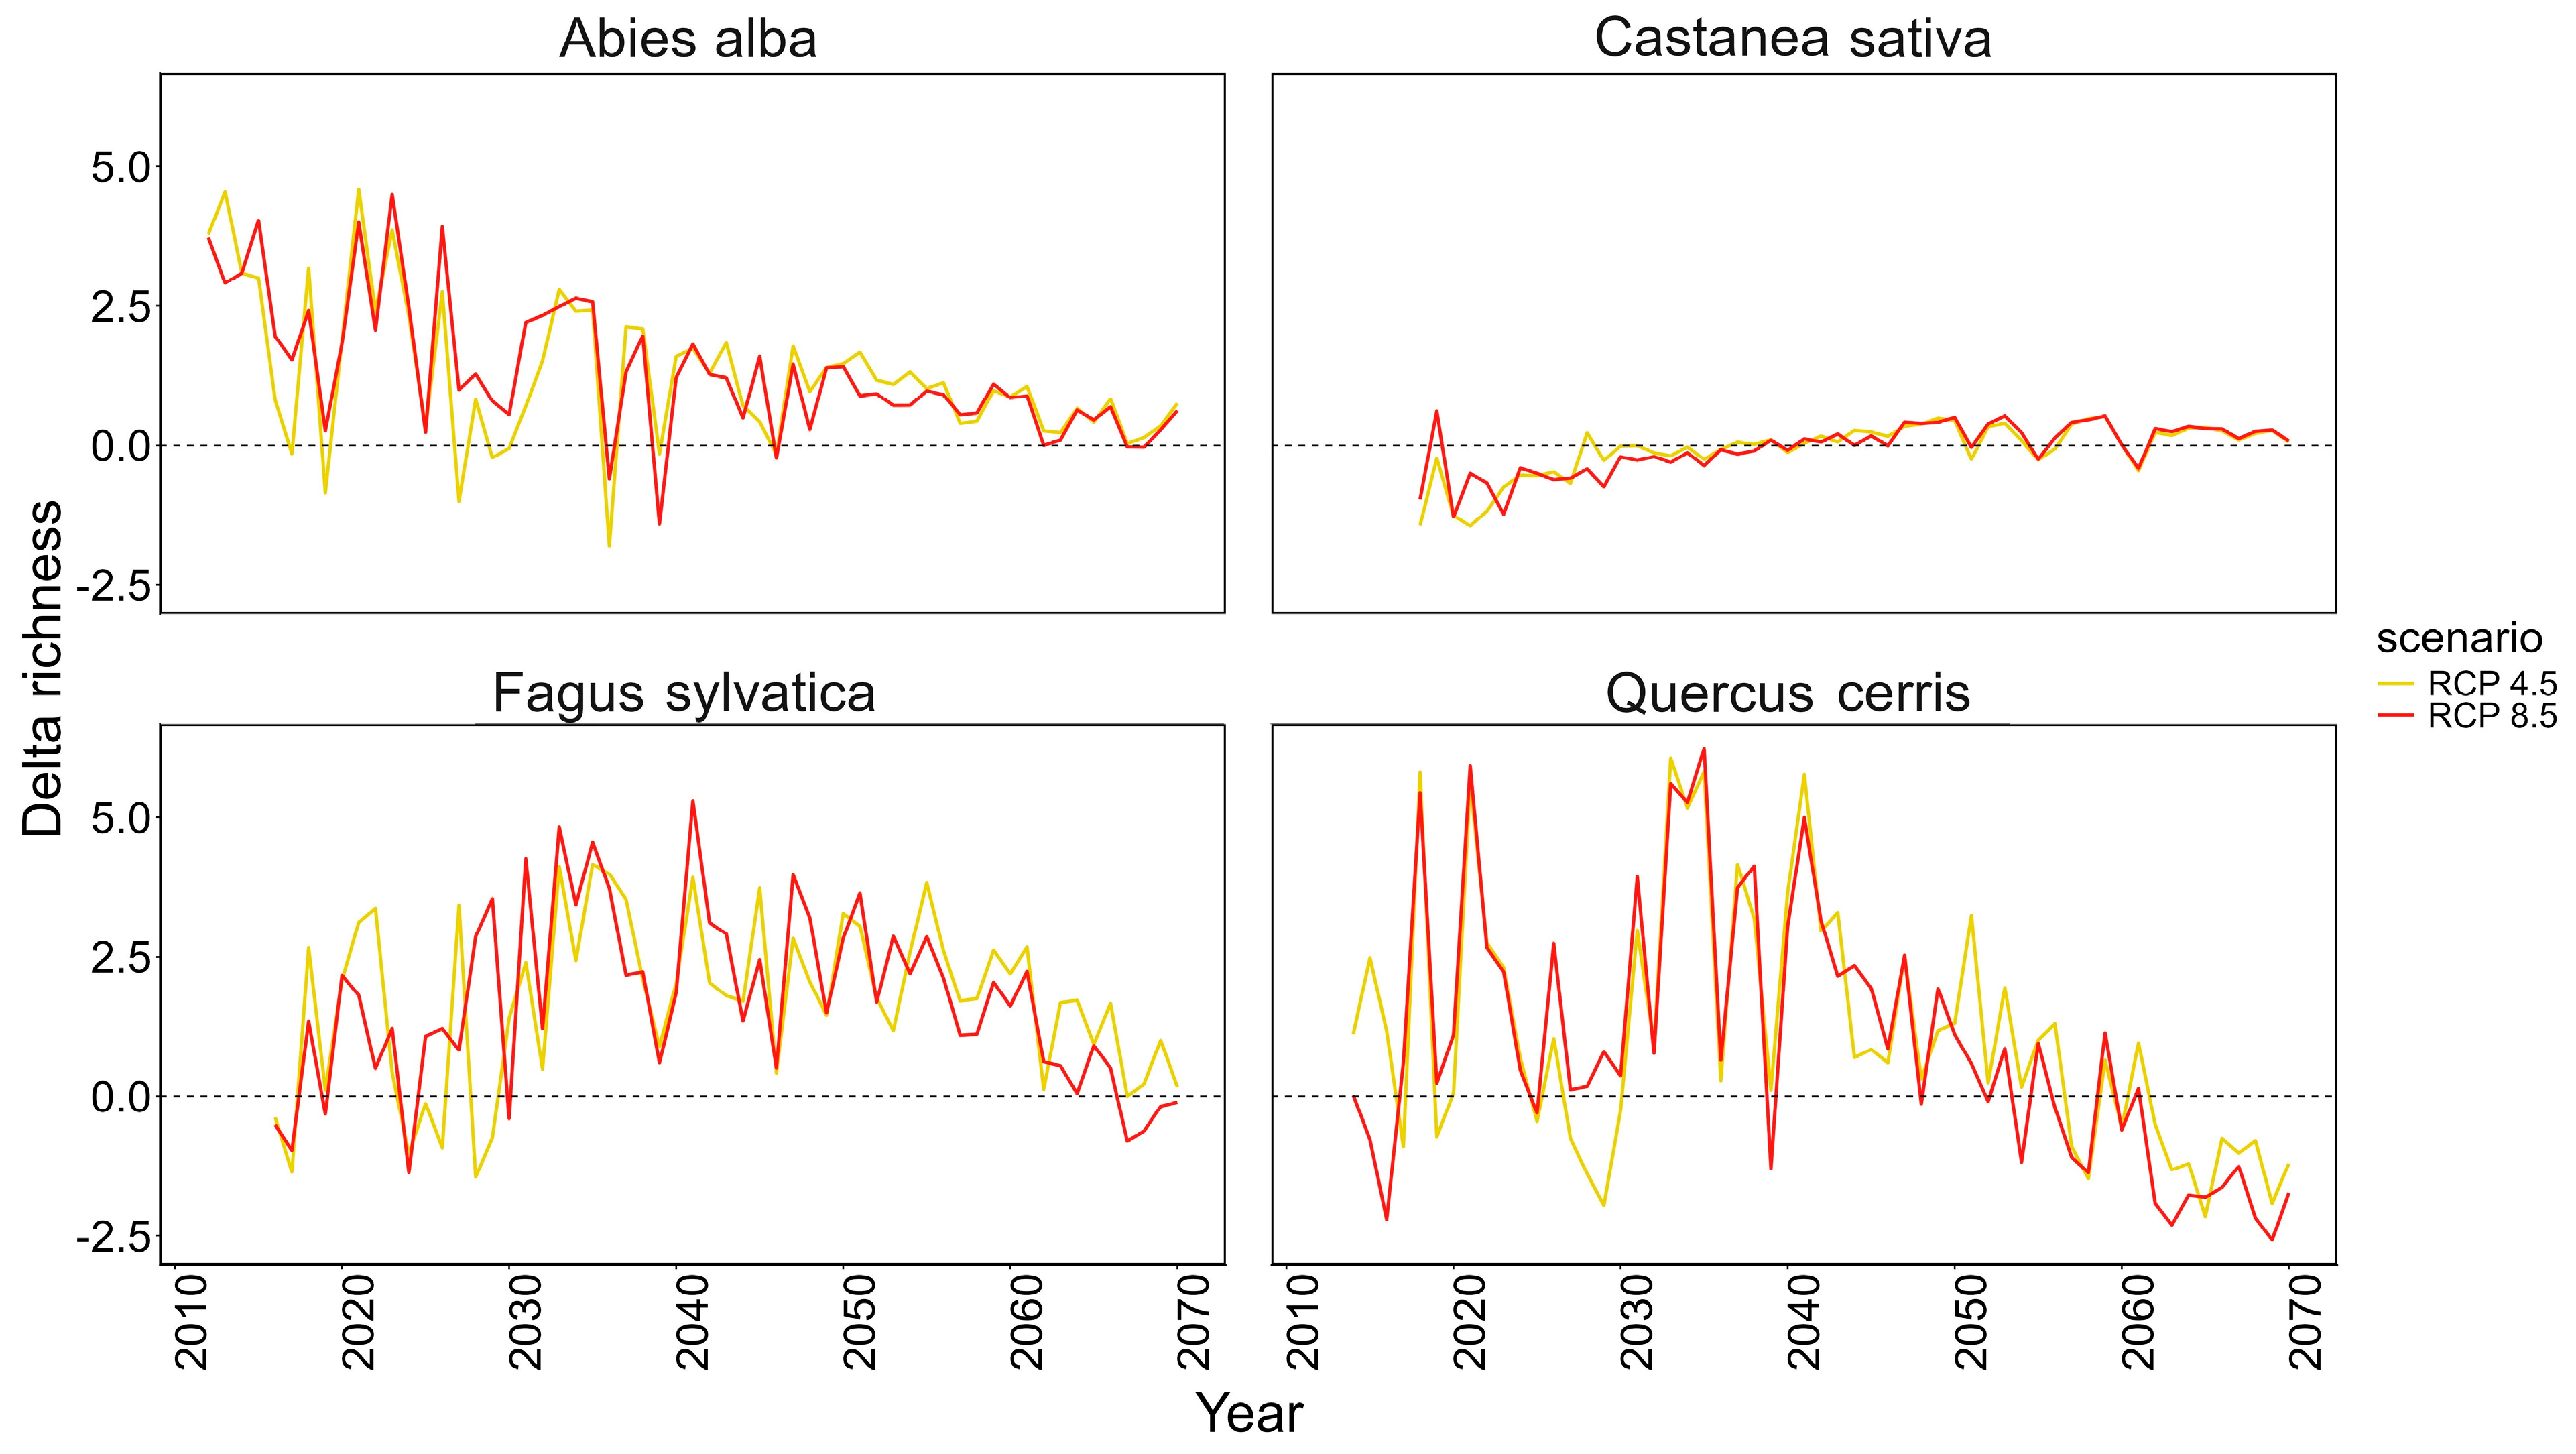
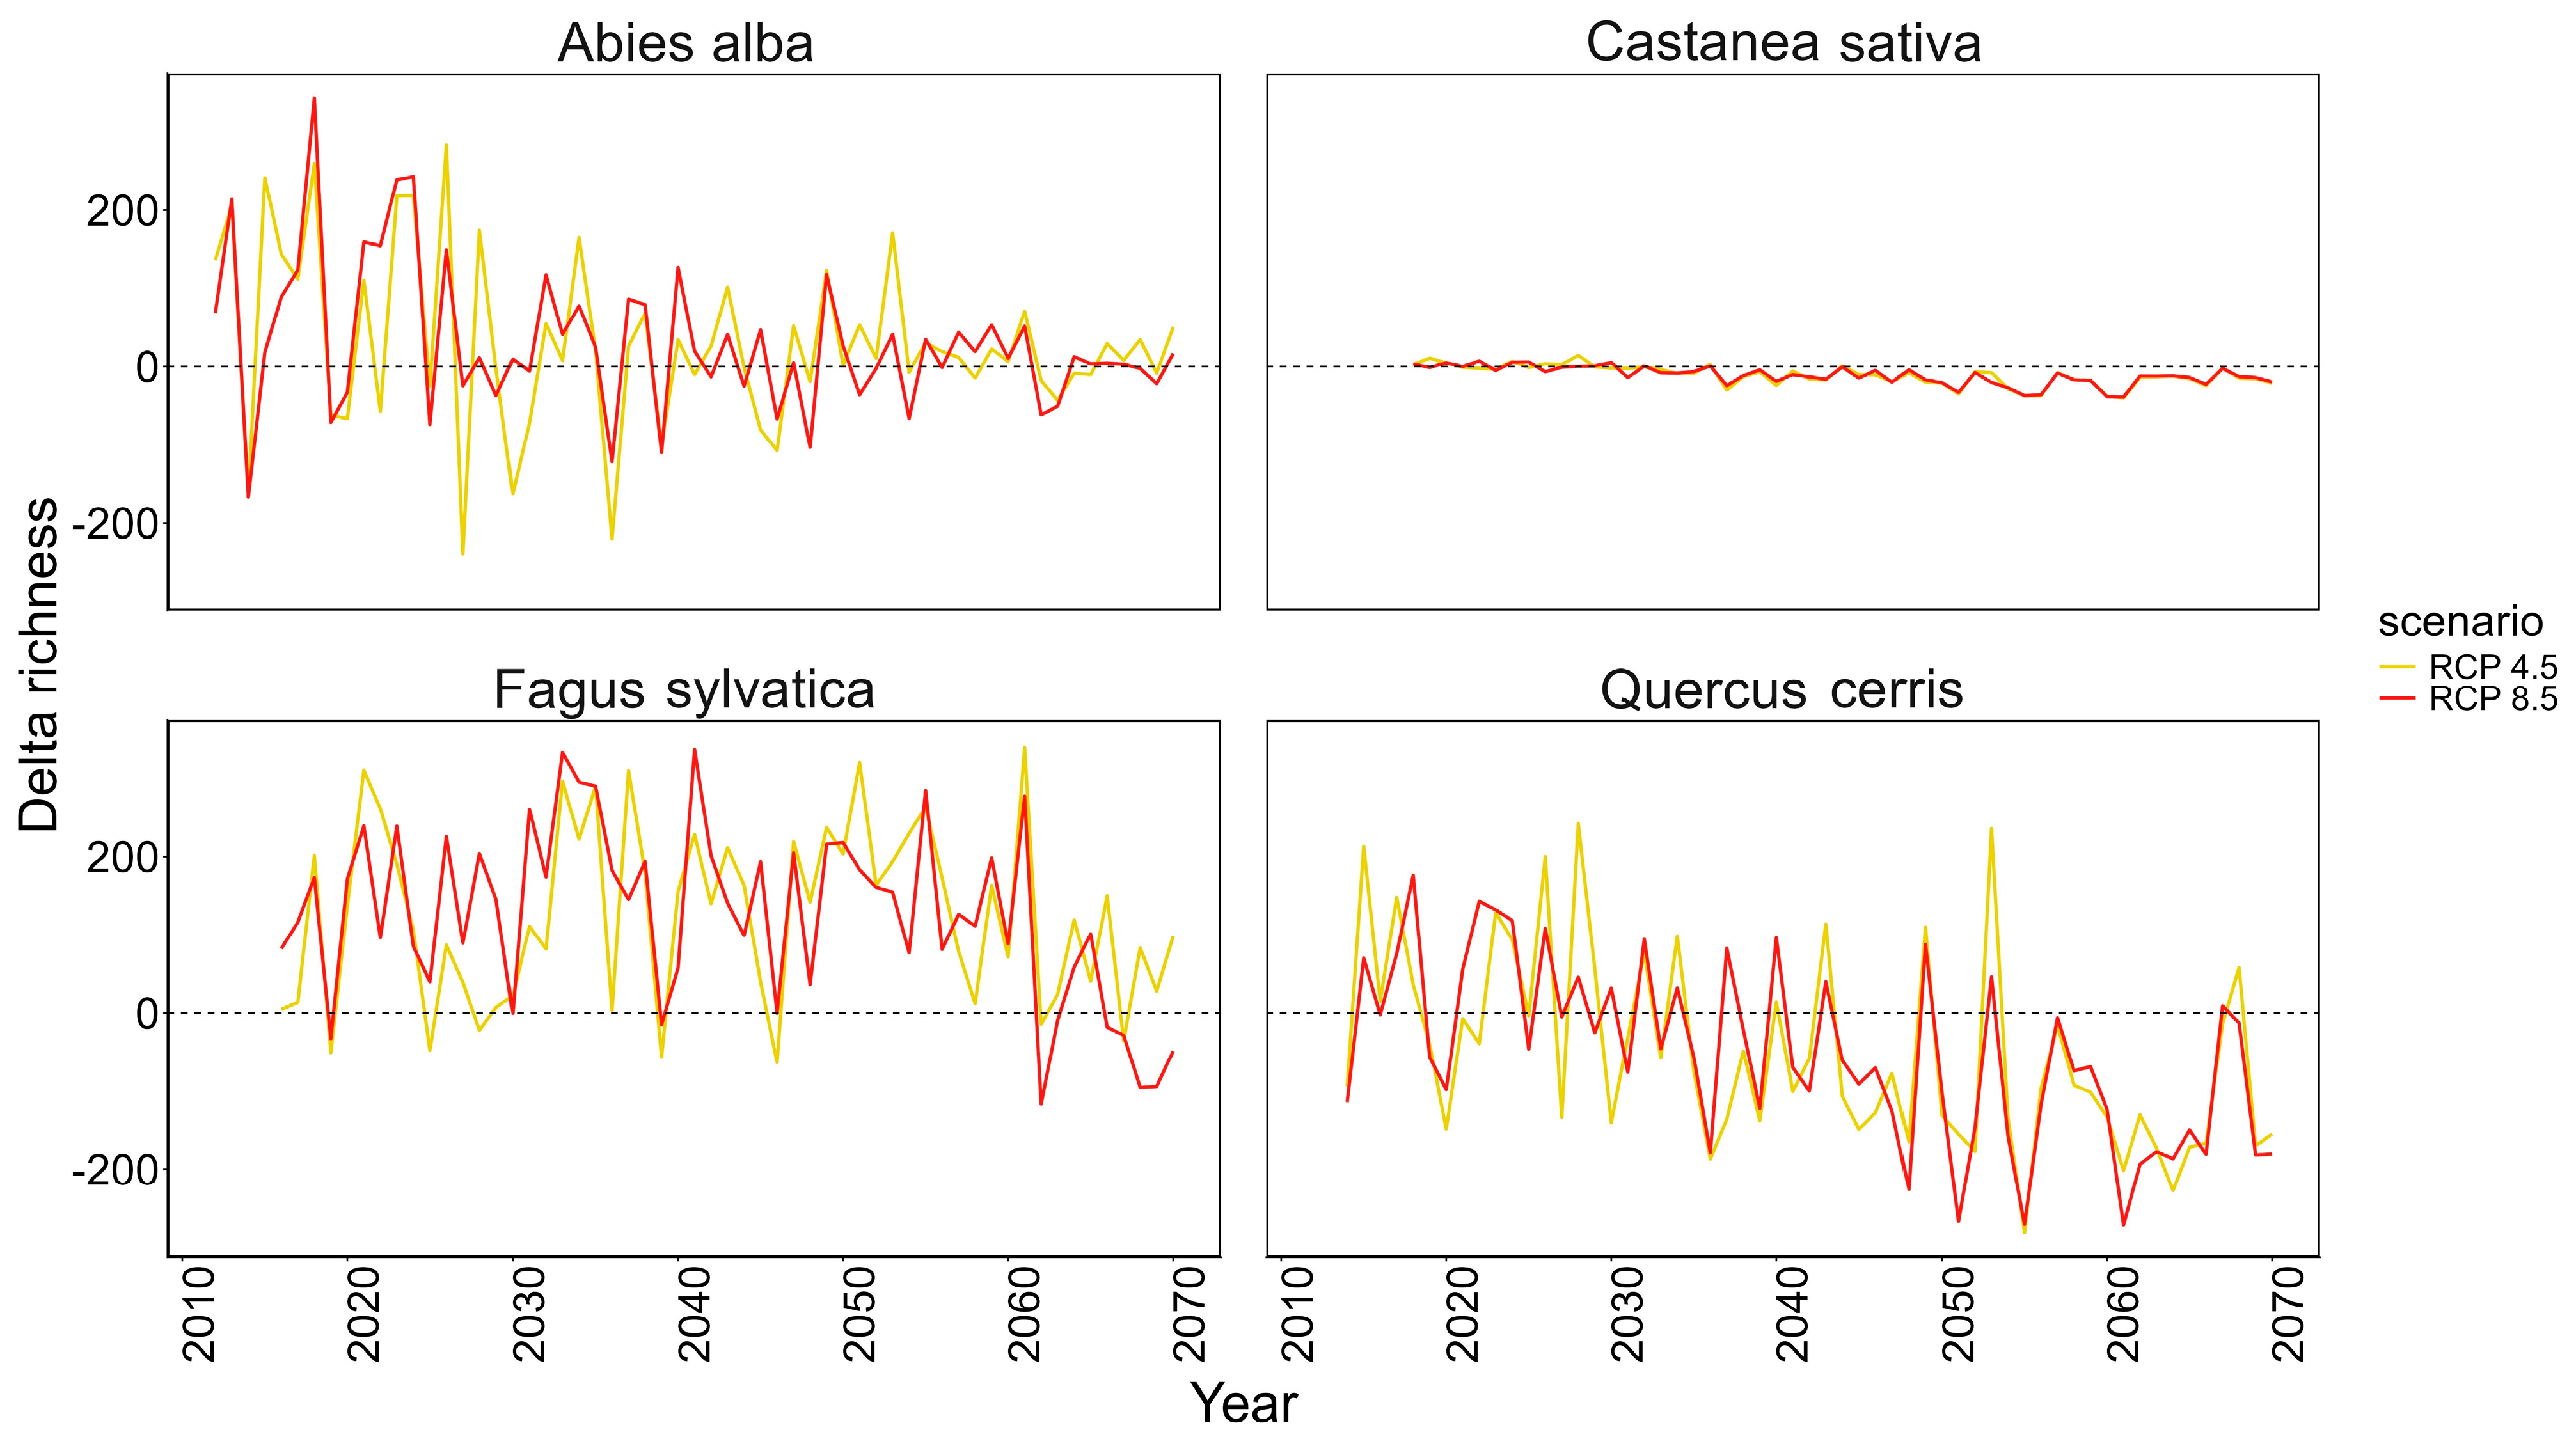
The long-term trend in beetle richness was similar across all climate scenarios, with notable differences among tree species (Figure 4). In silver fir-dominated stands, beetle richness is expected to increase through around 2030 across all scenarios, then decline by 2050 and stabilize for the rest of the simulation at a level below the starting point. The mean difference in richness across the whole simulation between RCP scenarios and CCS was 1.3 species for both RCP4.5 and RCP8.5, with a minimum of −1.8 and −1.4 and a maximum of 4.6 and 4.5, respectively. Differences among scenarios progressively narrow after the mid-century, converging toward similar richness levels by 2070, suggesting a long-term homogenization driven by structural and climatic constraints.
Chestnut stands show a relatively stable pattern, with an initial decrease in richness (−1.5 and −1.2 species for RCP4.5 and RCP8.5, respectively, relative to CCS) followed by stabilization across all scenarios (Figure 5). Scenario divergence is most pronounced in the near term, when CCS and RCP 4.5 maintain slightly higher richness than RCP 8.5, but these differences diminish over time until a trend reversal at the end of the simulation, in which the two climate change scenarios show a slight positive trend relative to CCS. This phenomenon, albeit slight, is present only in chestnut; for the other species, the trend at the end of the simulation under the RCP4.5 and RCP8.5 scenarios remains decreasing (Figure 6 and Figure S2). In contrast, beech forests show an overall increasing trend in beetle richness, particularly under RCP 4.5 (with an average of 1.7 and a maximum of 4.5 species more than CCS) and RCP 8.5 (with an average of 1.7 and a maximum of 5.3 species more than CCS), where richness values exceed those projected under CCS for much of the simulation period. However, at the end of the simulation in both climate change scenarios, the richness level declines to the CCS level. This pattern suggests that future climatic conditions, combined with simulated changes in forest structure, may enhance habitat suitability for beetles in beech-dominated stands up to a threshold.
Turkey oak stands exhibit the highest interannual variability among the species, with richness generally remaining higher under RCP 4.5 and RCP 8.5 in the early decades (up to 2050). Toward the end of the period, projections converge across climate change scenarios, down to the levels present in the CCS in the last twenty years of simulation (ending up with an average richness level lower by 1.2 and 1.7 species, in RCP4.5 and RCP8.5, respectively), although variability among sites remains higher than the other species.
Figure 6 shows the projected trends of TreM richness for all species and scenarios. Overall, TreM richness exhibits pronounced interspecific differences and high temporal variability. In silver fir stands, TreM richness is initially high, with mean values of approximately 450–600 microhabitats per plot in the early decades, followed by a consistent decline across all scenarios. By 2070, richness converges toward ~250–300 microhabitats, with relatively small differences among scenarios (Figure 7). Scenario separation is more evident in the first half of the simulation, where RCP 4.5 and RCP 8.5 tend to maintain higher values (an average of + 30 more TreM than in CCS, with peaks of + 284 and + 344 for RCP 4.5 and RCP 8.5, respectively).
Chestnut forests show the lowest variability and the most stable trajectory among species. TreM richness remains within a narrow range of ~200–300 TreM throughout the period, with a weak upward trend across all scenarios. Differences among CCS, RCP 4.5, and RCP 8.5 are minimal, generally below ± 20 microhabitats, indicating limited sensitivity of TreM development to future climatic forcing in chestnut-dominated stands.
In contrast, beech stands display a marked increase in TreM richness over time, particularly under future climate scenarios. Values rise from 350–450 microhabitats in the 2010s up to 600 TreM by the mid-century under RCP 4.5 and RCP 8.5, while CCS remains lower, typically by an average of 125 TreM. After 2050, TreM richness stabilizes or slightly declines, yet remains consistently higher under RCP scenarios than under CCS.
In Turkey oak stands, a high interannual variability and different long-term dynamics among scenarios were observed. Under the CCS, TreM richness ranges from 136 to 525, with an average of 345 microhabitats, higher than under RCP 4.5 (mean of 293) and RCP 8.5 (mean of 292), particularly after the mid-century. By the end of the simulation, CCS exceeds RCP4.5 and RCP8.5 by 281 and 272 TreM, respectively, suggesting that stronger climate forcing may negatively affect microhabitat availability in Turkey oak stands.
Across all species, interspecific contrasts in TreM richness (ranging from 300 to 350 microhabitats) clearly exceed scenario-driven differences, which rarely exceed 100 microhabitats.

4. Discussion

4.1. Stand Structure and Host Tree Species as Dominant Drivers of Beetle Richness

By combining process-based forest simulations (i.e., 3D-CMCC-FEM) with ML models, this study demonstrates that future beetle richness in Apennine forests is driven primarily by host tree species and associated stand structural development rather than by climate scenario alone. Across CCS, RCP4.5, and RCP8.5, differences among climate pathways were generally small, rarely exceeding two species per plot, whereas contrasts among forest types reached four to five species at specific time points, suggesting long-term homogenization driven by structural and tree-species-specific constraints. Mean richness values after the first simulation year (20–27 species per plot) further highlight substantial baseline variability linked to forest type and stand characteristics.
The low extrapolation distance observed during the forecasting phase (ED = 0.13–0.19 across scenarios) indicates that simulated future conditions remained within the calibration domain, supporting the robustness of the projected trends and suggesting that the observed dominance of stand structure over climate scenarios is not an artefact of strong model extrapolation.
Overall, these results are consistent with previous studies showing that climate effects on beetle communities are often mediated by habitat structure, host availability, and stand dynamics rather than acting as direct drivers of changes in richness [37,70,71]. Trait–habitat interactions can strongly influence species responses to environmental change, and variation in stand structure has been shown to modulate climate-related impacts on beetle assemblages at regional scales [71]. Similarly, fine-scale environmental heterogeneity, including local moisture conditions and topographic complexity, can buffer the effects of warming and reduce climate sensitivity in forest insect communities [72].
Several studies have documented strong declines in beetle abundance and diversity associated with recent climate warming [73,74]. Our results do not contradict these findings; rather, they indicate that at the stand scale, climate forcing influences beetle richness primarily indirectly, through its effects on forest development processes. Climate-driven changes in tree growth, mortality, and disturbance regimes affect canopy cover and deadwood availability and continuity, which are key determinants of beetle richness and can either amplify or buffer the effects of climate change at local scales [36,37].
Consequently, differences among climate scenarios were often small relative to contrasts among forest types, and richness trajectories diverged markedly across stand types. These patterns suggest that climate-induced changes in beetle richness cannot be interpreted independently of stand structural dynamics and host species composition, which mediate species responses by shaping habitat availability and microclimatic conditions [70,71].

4.2. Forest-Type-Specific Richness Trajectories

Richness trajectories differed substantially among silver fir, chestnut, beech, and Turkey oak stands, indicating forest-type-specific responses to climate forcing. In silver fir stands, beetle richness increased until approximately 2030, then declined through the mid-century and stabilized at levels below the initial baseline, with limited long-term separation among climate scenarios. Chestnut forests exhibited comparatively stable richness dynamics, characterized by minor early declines under RCP scenarios and a prolonged plateau thereafter.
Beech stands showed consistently higher richness under RCP4.5 and RCP8.5 for much of the simulation period, with differences of up to four to five species compared with CCS, although this advantage gradually diminished toward the end of the century. In Turkey oak stands, richness showed pronounced interannual variability, with higher values under RCP scenarios in the first decades of the simulation, then converging toward slightly lower richness than under CCS in later periods. These non-linear and forest-type-specific trajectories are consistent with growing evidence that beetle richness often peaks under intermediate environmental conditions and does not respond monotonically to increasing temperatures [75]. Empirical and theoretical studies have shown that species richness often exhibits hump-shaped or other non-monotonic responses along environmental and resource gradients, reflecting trade-offs among resource availability, physiological limits, and biotic interactions [36,76,77].
Moreover, the contrasting responses observed among forest types are also consistent with studies showing that climate effects on beetle diversity are mediated by vegetation characteristics, resource availability, and host plant diversity, rather than by temperature alone [78]. This suggests that differences in dominant tree species may modulate the effects of future climate change on beetle assemblages by altering habitat structure and resource quality.
However, we acknowledge the lack of sufficient scientific research on how beetle richness responds to tree species composition under future climate change scenarios.

4.3. Tree-Related Microhabitats as a Structural Mechanism

TreMs closely mirrored those observed for beetle richness, reinforcing the central role of forest structural complexity in shaping saproxylic biodiversity. Differences in TreM richness among forest types (approximately 300–350 microhabitats) clearly exceeded differences among climate scenarios, which rarely exceeded about 100 microhabitats. This pattern suggests that climate acts primarily through its influence on stand structure rather than directly on TreM formation. Forest management is widely recognized as the principal driver of TreM availability because it determines stand age, tree size distribution, retention of habitat trees, deadwood abundance, and structural heterogeneity [79]. Within these management-defined structural conditions, tree species identity further modulates TreM development through species-specific differences in longevity, growth architecture, decay dynamics, bark characteristics, and susceptibility to biotic agents such as fungi and insects [23,80]. Consequently, the observed differences among forest types likely reflect the interaction between management history and species-specific ecological traits rather than species identity alone [23,81].
The contrasting trajectories among forest types further illustrate this interaction. Silver fir stands exhibited a consistent decline in TreM richness across all scenarios, whereas chestnut forests remained comparatively stable, indicating limited climate sensitivity under the simulated management conditions. Beech stands initially accumulated TreMs, particularly under RCP8.5, before declining toward the end of the century, while Turkey oak experienced a marked reduction under stronger climate forcing. These species-specific responses are likely associated with differences in growth dynamics, longevity, mortality, and disturbance susceptibility, but their expression depends on the structural conditions established by forest management [82]. Climate therefore influences saproxylic biodiversity mainly by modifying the rates of TreM formation, persistence, and turnover within stands, rather than by overriding the effects of stand structure and management [81].

4.4. Implications for Forest Management

Although we did not explicitly simulate forest management, differences among forest types and stand structures consistently exceeded differences among climate scenarios, suggesting that forest management actions, by affecting tree species composition and structural heterogeneity, are likely to play a key role in shaping future beetle richness [36,37]. Retention of large living trees, deadwood, and microhabitat-rich elements remains essential for maintaining saproxylic habitats across all climate pathways [23,51].
In forest types projected to decline in beetles’ richness (e.g., silver fir) or to lose TreMs under strong climate forcing (e.g., silver fir and turkey oak), prioritizing the retention of microhabitat-bearing trees and ensuring deadwood continuity may help counteract climate-driven structural simplification and associated biodiversity losses [83]. In beech forests, where mid-century increases in beetle richness and TreM availability are projected, management practices that avoid the premature removal of senescent trees and dead elements may help sustain saproxylic biodiversity over longer time horizons [37,84].
At the landscape scale, maintaining connectivity among structurally complex stands is critical to supporting dispersal and recolonization processes, particularly for saproxylic species with limited dispersal capacity [85,86,87]. Finally, integrating explicit TreM and deadwood targets into forest management guidelines and certification schemes provides a practical and evidence-based framework for translating these findings into effective conservation and management actions [23,79].

4.5. Challenges and Future Research

In this study, we did not consider the indirect impacts of climate change—such as shifts in disturbance regimes or the occurrence of extreme events (e.g., fires, insect outbreaks, storms)—except where these effects were already embedded in the applied climate scenarios. Furthermore, this study focuses on richness patterns and therefore does not capture potential changes in species composition, functional diversity, or colonization dynamics that may emerge under rapid climate change and disturbance regimes. Previous research has shown that richness alone can mask substantial turnover in species identity and functional traits, particularly for insect communities responding to climate and land-use change [88,89,90]. Moreover, fine-scale microclimatic buffering, stochastic disturbances, and spatially explicit deadwood distributions are difficult to represent at the plot scale and may locally alter biodiversity responses, potentially modifying the trends reported here [37,91]. Although the low extrapolation distances observed in this study indicate limited model extrapolation, considerable uncertainty remains regarding future interactions among climate change, disturbance regimes, and forest management practices [92].
Future research combining long-term beetle and TreMs monitoring with high-resolution remote sensing approaches, such as LiDAR and hyperspectral data, would help validate the structural mechanisms identified here and improve projections under alternative management scenarios [76,83]. Integrating such data streams would enable a more explicit representation of forest structural complexity, disturbance legacies, and habitat continuity, thereby strengthening inferences about climate–structure–biodiversity interactions. Finally, although the network of 336 plots spans a wide range of latitudes, altitudes, and management practices across the Italian Apennines, it does not fully capture the ecological and silvicultural diversity of the four key forest types. In particular, local variations in management intensity, disturbance history, and microclimatic buffering may not be entirely represented. Nevertheless, this dataset remains a comprehensive and standardized long-term sampling framework available for saproxylic beetles and TreMs in the region, providing a strong empirical foundation for process-based and machine learning approaches.

5. Conclusions

By integrating process-based forest simulations with machine-learning models, this study shows that future patterns of beetle richness in Apennine forests are more strongly associated with forest type, stand structural development, and TreM availability than with differences among the investigated climate scenarios. Forest types exhibited distinct richness trajectories, with beech stands showing temporary increases, chestnut forests remaining comparatively stable, and silver fir and Turkey oak stands displaying long-term declines or convergence toward lower richness levels.
The close correspondence between projected beetle and TreM richness highlights the major role of forest structural dynamics and microhabitat availability in shaping biodiversity responses under future climatic conditions. While our results suggest that climate change may influence beetle richness largely through its effects on forest development and habitat dynamics, direct climatic effects on beetles cannot be excluded and should be interpreted with caution, as they were not explicitly assessed in this study.
Overall, these findings support the importance of climate-adaptive forest management strategies that maintain structural complexity, deadwood continuity, and tree-related microhabitats to enhance the long-term conservation of forest biodiversity under changing environmental conditions.

Supplementary Materials

The following supporting information can be downloaded at: https://www.mdpi.com/article/10.3390/f17080896/s1, Figure S1: Climatic trends under different scenarios; Figure S2: Scatterplot of predicted vs. observed values for beetle richness for interpolation validation; Figure S3: Scatterplot of predicted vs. observed values for TreM richness for interpolation validation; Table S1: List of sites, with Province/Region location, year of data collection, protection status, elevation, number of traps and counts in the year, classification according to the European Environmental Agency classification, and forest status and management information; Table S2: List of species of saproxylic and non-saproxylic beetles and number of specimens collected.

Author Contributions

Conceived and designed the experiment: E.V. and F.P.; data and samples in the field: F.P.; Processed samples in the lab: E.V.; Analyzed the data and wrote the manuscript: E.V. and F.P.; Resources; Roles/Writing—original draft; Writing—review and editing, G.D., S.F., C.B., A.C., D.D., M.M., G.C. and D.T. All authors have read and agreed to the published version of the manuscript.

Funding

This research received no external funding.

Data Availability Statement

The climate data are freely available from their original sources. All other data, images and codes will be made available via request to the corresponding author.

Acknowledgments

The authors thank the specialists of the various taxonomic groups: Paolo Audisio (Nitidulidae), Enzo Colonnelli (Curculionidae), Davide Vallotto (Curculionidae Scolytinae), Gianluca Magnani (Buprestidae); Gianfranco Liberti (Melyridae), Giuseppe Platia (Elateridae), Fabrizio Fanti (Cantharidae, Lampyridae); Emanuele Piattella (Scarabaeidae); Pierpaolo Rapuzzi (Cerambycidae (pars)), Enrico Ruzzier (Scraptiidae, Mordellidae), Gianfranco Salvato (Biphyllidae, Mycetophagidae (pars), Zopheridae (pars)), Adriano Zanetti (Staphylinidae (pars)). E.V. acknowledges NextGenCarbon H2020 project funded by the European Commission, number 101184989 call HORIZON-CL5-2024-D1-01-07 and the Space It Up! project funded by the Italian Space Agency, ASI, and the Ministry of University and Research, MUR, under contract n. 2024-5-E.0—CUP n. I53D24000060005. D.D., A.C. and F.P. acknowledge the project funded under the National Recovery and Resilience Plan (NRRP), Mission 4 Component 2 Investment 1.4—Call for tender No. 3138 of 16 December 2021, rectified by Decree n. 3175 of 18 December 2021 of Italian Ministry of University and Research funded by the European Union—NextGenerationEU under award Number: Project code CN_00000033, Concession Decree No. 1034 of 17 June 2022 adopted by the Italian Ministry of University and Research, CUP B83C22002930006, Project title “National Biodiversity Future Centre—NBFC and the project FORESTNAVIGATOR Horizon Europe research and innovation program under grant agreement No. 101056875.

Conflicts of Interest

The authors declare no competing interests.

References

  1. Fischer, J.; Lindenmayer, D.B. Landscape Modification and Habitat Fragmentation: A Synthesis. Glob. Ecol. Biogeogr. 2007, 16, 265–280. [Google Scholar] [CrossRef] [Scilit]
  2. Heller, N.E.; Zavaleta, E.S. Biodiversity Management in the Face of Climate Change: A Review of 22 Years of Recommendations. Biol. Conserv. 2009, 142, 14–32. [Google Scholar] [CrossRef] [Scilit]
  3. Hannah, L.; Midgley, G.; Andelman, S.; Araújo, M.; Hughes, G.; Martinez-Meyer, E.; Pearson, R.; Williams, P. Protected Area Needs in a Changing Climate. Front. Ecol. Environ. 2007, 5, 131–138. [Google Scholar] [CrossRef] [Scilit]
  4. Devictor, V.; Julliard, R.; Couvet, D.; Jiguet, F. Birds Are Tracking Climate Warming, but Not Fast Enough. Proc. R. Soc. B 2008, 275, 2743–2748. [Google Scholar] [CrossRef] [Scilit] [PubMed]
  5. Parmesan, C. Ecological and Evolutionary Responses to Recent Climate Change. Annu. Rev. Ecol. Evol. Syst. 2006, 37, 637–669. [Google Scholar] [CrossRef] [Scilit]
  6. Hitch, A.T.; Leberg, P.L. Breeding Distributions of North American Bird Species Moving North as a Result of Climate Change. Conserv. Biol. 2007, 21, 534–539. [Google Scholar] [CrossRef] [Scilit] [PubMed]
  7. Hoyle, M.; James, M. Global Warming, Human Population Pressure, and Viability of the World’s Smallest Butterfly. Conserv. Biol. 2005, 19, 1113–1124. [Google Scholar] [CrossRef] [Scilit]
  8. Fischlin, A.; Midgley, G.F.; Price, J.T.; Leemans, R.; Gopal, B.; Turley, C.; Rounsevell, M.D.A.; Dube, O.P.; Tarazona, J.; Velichko, A.A. Ecosystems, Their Properties, Goods and Services. In Climate Change 2007: Impacts, Adaptation and Vulnerability. Contribution of Working Group II to the Fourth Assessment Report of the Intergovernmental Panel on Climate Change; Cambridge University Press: Cambridge, UK, 2007; pp. 211–272. [Google Scholar]
  9. Naughton-Treves, L.; Buck Holland, M.; Brandon, K.E. The Role of Protected Areas in Conserving Biodiversity and Sustaining Local Livelihoods. Annu. Rev. Environ. Resour. 2005, 30, 219–252. [Google Scholar] [CrossRef] [Scilit]
  10. Pacifici, M.; Foden, W.B.; Visconti, P.; Watson, J.E.M.; Butchart, S.H.M.; Kovacs, K.M.; Scheffers, B.R.; Hole, D.G.; Martin, T.G.; Akçakaya, H.R. Assessing Species Vulnerability to Climate Change. Nat. Clim. Change 2015, 5, 215–224. [Google Scholar] [CrossRef] [Scilit]
  11. Williams, J.W.; Kharouba, H.M.; Veloz, S.; Vellend, M.; McLachlan, J.; Liu, Z.; Otto-Bliesner, B.; He, F. The Ice Age Ecologist: Testing Methods for Reserve Prioritization during the Last Global Warming. Glob. Ecol. Biogeogr. 2013, 22, 289–301. [Google Scholar] [CrossRef] [Scilit]
  12. Thomas, J.A.; Telfer, M.G.; Roy, D.B.; Preston, C.D.; Greenwood, J.J.D.; Asher, J.; Fox, R.; Clarke, R.T.; Lawton, J.H. Comparative Losses of British Butterflies, Birds, and Plants. Science 2004, 303, 1879–1881. [Google Scholar] [CrossRef] [Scilit] [PubMed]
  13. Conrad, K.F.; Warren, M.S.; Fox, R.; Parsons, M.S.; Woiwod, I.P. Rapid Declines of Common, Widespread British Moths Provide Evidence of an Insect Biodiversity Crisis. Biol. Conserv. 2006, 132, 279–291. [Google Scholar] [CrossRef] [Scilit]
  14. Hallmann, C.A.; Sorg, M.; Jongejans, E.; Siepel, H.; Hofland, N.; Schwan, H.; Stenmans, W.; Müller, A.; Sumser, H.; Hörren, T. More than 75 Percent Decline over 27 Years in Total Flying Insect Biomass in Protected Areas. PLoS ONE 2017, 12, e0185809. [Google Scholar] [CrossRef] [Scilit] [PubMed]
  15. van Klink, R.; Bowler, D.E.; Gongalsky, K.B.; Swengel, A.B.; Gentile, A.; Chase, J.M. Meta-Analysis Reveals Declines in Terrestrial but Increases in Freshwater Insect Abundances. Science 2020, 368, 417–420. [Google Scholar] [CrossRef] [Scilit] [PubMed]
  16. Wagner, D.L.; Fox, R.; Salcido, D.M.; Dyer, L.A. A Window to the World of Global Insect Declines. Proc. Natl. Acad. Sci. USA 2021, 118, e2002549117. [Google Scholar] [CrossRef] [Scilit] [PubMed]
  17. Lenzi, A.; Quinto, J.; Bajocco, S.; Martínez-Pérez, S.; Gisondi, S.; Padilla, A.; Sánchez-Almodóvar, E.; Campanaro, A.; Micó, E. Temperature Drives Trait-Dependent Responses of Saproxylic Insect Phenology. Biodivers. Conserv. 2026, 35, 17. [Google Scholar] [CrossRef] [Scilit]
  18. Speight, M.C.D. Saproxylic Invertebrates and Their Conservation; Council of Europe: Strasbourg, France, 1989; ISBN 9287116792. [Google Scholar]
  19. Lachat, T.; Wermelinger, B.; Gossner, M.M.; Bussler, H.; Isacsson, G.; Müller, J. Saproxylic Beetles as Indicator Species. Ecol. Indic. 2012, 23, 323–331. [Google Scholar] [CrossRef] [Scilit]
  20. Ulyshen, M.D.; Šobotník, J. An Introduction to the Diversity, Ecology, and Conservation of Saproxylic Insects. In Saproxylic Insects; Ulyshen, M.D., Ed.; Springer: Cham, Switzerland, 2018. [Google Scholar]
  21. Hanula, J.L.; Engstrom, R.T. Comparison of Red-Cockaded Woodpecker (Picoides borealis) Nestling Diet in Old-Growth and Old-Field Longleaf Pine (Pinus palustris) Habitats. Am. Midl. Nat. 2000, 144, 370–376. [Google Scholar] [CrossRef] [Scilit]
  22. Bunnell, F.L.; Houde, I.; Johnston, B.; Wind, E. How Dead Trees Sustain Live Organisms in Western Forests. In Proceedings of the Symposium on the Ecology and Management of Dead Wood in Western Forests; Laudenslayer, W.F., Jr., Shea, P.J., Valentine, B.E., Weatherspoon, C.P., Lisle, T.E., Eds.; Technical Coordinators; General Technical Report PSW-GTR-181; Pacific Southwest Research St: Albany, CA, USA, 2002; pp. 291–318. [Google Scholar] [CrossRef] [Scilit]
  23. Larrieu, L.; Paillet, Y.; Winter, S.; Bütler, R.; Kraus, D.; Krumm, F.; Lachat, T.; Michel, A.K.; Regnery, B.; Vandekerkhove, K. Tree Related Microhabitats Typology. Ecol. Indic. 2018, 84, 194–207. [Google Scholar] [CrossRef] [Scilit]
  24. Micó, E. Saproxylic Insects in Tree Hollows. In Saproxylic Insects: Diversity, Ecology and Conservation; Ulyshen, M.D., Ed.; Springer: Cham, Switzerland, 2018; pp. 693–727. [Google Scholar] [CrossRef] [Scilit]
  25. Parisi, F.; Innangi, M.; Tognetti, R.; Lombardi, F.; Chirici, G.; Marchetti, M. Forest Stand Structure and Coarse Woody Debris Determine the Biodiversity of Beetle Communities in Mediterranean Mountain Beech Forests. Glob. Ecol. Conserv. 2021, 28, e01637. [Google Scholar] [CrossRef] [Scilit]
  26. Böhm, R.; Auer, I.; Brunetti, M.; Maugeri, M.; Nanni, T.; Schöner, W. Regional Temperature Variability in the European Alps: 1760–1998 from Homogenized Instrumental Time Series. Int. J. Clim. 2001, 21, 1779–1801. [Google Scholar] [CrossRef] [Scilit]
  27. Gasner, M.R.; Jankowski, J.E.; Ciecka, A.L.; Kyle, K.O.; Rabenold, K.N. Projecting the Local Impacts of Climate Change on a Central American Montane Avian Community. Biol. Conserv. 2010, 143, 1250–1258. [Google Scholar] [CrossRef] [Scilit]
  28. Forister, M.L.; McCall, A.C.; Sanders, N.J.; Fordyce, J.A.; Thorne, J.H.; O’Brien, J.; Waetjen, D.P.; Shapiro, A.M. Compounded Effects of Climate Change and Habitat Alteration Shift Patterns of Butterfly Diversity. Proc. Natl. Acad. Sci. USA 2010, 107, 2088–2092. [Google Scholar] [CrossRef] [Scilit] [PubMed]
  29. Carpaneto, G.M.; Baviera, C.; Biscaccianti, A.B.; Brandmayr, P.; Mazzei, A.; Mason, F.; Battistoni, A.; Teofili, C.; Rondinini, C.; Fattorini, S.; et al. A Red List of Italian Saproxylic Beetles: Taxonomic Overview, Ecological Features and Conservation Issues (Coleoptera). Fragm. Entomol. 2015, 47, 53. [Google Scholar] [CrossRef] [Scilit]
  30. Winter, S.; Möller, G.C. Microhabitats in Lowland Beech Forests as Monitoring Tool for Nature Conservation. For. Ecol. Manag. 2008, 255, 1251–1261. [Google Scholar] [CrossRef] [Scilit]
  31. Martin, M.; Paillet, Y.; Larrieu, L.; Kern, C.C.; Raymond, P.; Drapeau, P.; Fenton, N.J.; Basile, M. Tree-Related Microhabitats Are Promising Yet Underused Tools for Biodiversity and Nature Conservation: A Systematic Review for International Perspectives. Front. For. Glob. Change 2022, 5, 818474. [Google Scholar] [CrossRef] [Scilit]
  32. Regnery, B.; Couvet, D.; Kubarek, L.; Julien, J.-F.; Kerbiriou, C. Tree Microhabitats as Indicators of Bird and Bat Communities in Mediterranean Forests. Ecol. Indic. 2013, 34, 221–230. [Google Scholar] [CrossRef] [Scilit]
  33. Larrieu, L.; Cabanettes, A. Species, Live Status, and Diameter Are Important Tree Features for Diversity and Abundance of Tree Microhabitats in Subnatural Montane Beech–Fir Forests 1 This Article Is One of a Selection of Papers from the International Symposium on Dynamics and Ecolog. Can. J. For. Res. 2012, 42, 1433–1445. [Google Scholar] [CrossRef] [Scilit]
  34. Müller, J.; Jarzabek-Müller, A.; Bussler, H.; Gossner, M. Hollow Beech Trees Identified as Keystone Structures for Saproxylic Beetles by Analyses of Functional and Phylogenetic Diversity. Anim. Conserv. 2014, 17, 154–162. [Google Scholar] [CrossRef] [Scilit]
  35. Micó, E.; Ramilo, P.; Thorn, S.; Müller, J.; Galante, E.; Carmona, C.P. Contrasting Functional Structure of Saproxylic Beetle Assemblages Associated to Different Microhabitats. Sci. Rep. 2020, 10, 1520. [Google Scholar] [CrossRef] [Scilit] [PubMed]
  36. Müller, J.; Brustel, H.; Brin, A.; Bussler, H.; Bouget, C.; Obermaier, E.; Heidinger, I.M.M.; Lachat, T.; Förster, B.; Horák, J. Increasing Temperature May Compensate for Lower Amounts of Dead Wood in Driving Richness of Saproxylic Beetles. Ecography 2015, 38, 499–509. [Google Scholar] [CrossRef] [Scilit]
  37. Seibold, S.; Bässler, C.; Brandl, R.; Büche, B.; Szallies, A.; Thorn, S.; Ulyshen, M.D.; Müller, J. Microclimate and Habitat Heterogeneity as the Major Drivers of Beetle Diversity in Dead Wood. J. Appl. Ecol. 2016, 53, 934–943. [Google Scholar] [CrossRef] [Scilit]
  38. Paillet, Y.; Bergès, L.; Hjältén, J.; Ódor, P.; Avon, C.; Bernhardt-römermann, M.; Bijlsma, R.; De Bruyn, L.; Fuhr, M.; Grandin, U.; et al. Biodiversity Differences between Managed and Unmanaged Forests: Meta-Analysis of Species Richness in Europe. Conserv. Biol. 2010, 24, 101–112. [Google Scholar] [CrossRef] [Scilit] [PubMed]
  39. Dutta, T.; Larrieu, L.; Schuck, A. Who Is Using Tree-Related Microhabitats (TreMs)? Biol. Conserv. 2025, 307, 111180. [Google Scholar] [CrossRef] [Scilit]
  40. Gough, L.A.; Sverdrup-Thygeson, A.; Milberg, P.; Pilskog, H.E.; Jansson, N.; Jonsell, M.; Birkemoe, T. Specialists in Ancient Trees Are More Affected by Climate than Generalists. Ecol. Evol. 2015, 5, 5632–5641. [Google Scholar] [CrossRef] [Scilit] [PubMed]
  41. Diffenbaugh, N.S.; Pal, J.S.; Giorgi, F.; Gao, X. Heat Stress Intensification in the Mediterranean Climate Change Hotspot. Geophys. Res. Lett. 2007, 34, L11706. [Google Scholar] [CrossRef] [Scilit]
  42. Granata, F.; Zhu, S.; Di Nunno, F. Hydrological Extremes in the Mediterranean Basin: Interactions, Impacts, and Adaptation in the Face of Climate Change. Reg. Environ. Change 2025, 25, 100. [Google Scholar] [CrossRef] [Scilit]
  43. Buckley, L.B. Temperature-Sensitive Development Shapes Insect Phenological Responses to Climate Change. Curr. Opin. Insect Sci. 2022, 52, 100897. [Google Scholar] [CrossRef] [Scilit] [PubMed]
  44. Araújo, M.B.; Alagador, D.; Cabeza, M.; Nogués-Bravo, D.; Thuiller, W. Climate Change Threatens European Conservation Areas. Ecol. Lett. 2011, 14, 484–492. [Google Scholar] [CrossRef] [Scilit] [PubMed]
  45. Della Rocca, F.; Bogliani, G.; Breiner, F.T.; Milanesi, P. Identifying Hotspots for Rare Species under Climate Change Scenarios. Biodivers. Conserv. 2019, 28, 433–449. [Google Scholar] [CrossRef] [Scilit]
  46. Collalti, A.; Biondo, C.; Buttafuoco, G.; Maesano, M.; Caloiero, T.; Lucà, F.; Pellicone, G.; Ricca, N.; Salvati, R.; Veltri, A. Simulation, Calibration and Validation Protocols for the Model 3D-CMCC-CNR-FEM: A Case Study in the Bonis’ Watershed (Calabria), Italy. iForest 2017, 14, 247–256. [Google Scholar] [CrossRef] [Scilit]
  47. Parisi, F.; Francini, S.; Borghi, C.; Chirici, G. An Open and Georeferenced Dataset of Forest Structural Attributes and Micro-Habitats in Central and Southern Apennines (Italy). Data Br. 2022, 43, 108445. [Google Scholar] [CrossRef] [Scilit] [PubMed]
  48. Parisi, F.; D’Amico, G.; Vangi, E.; Chirici, G.; Francini, S.; Cocozza, C.; Giannetti, F.; Londi, G.; Nocentini, S.; Borghi, C.; et al. Tree-Related Microhabitats and Multi-Taxon Biodiversity Quantification Exploiting ALS Data. Forests 2024, 15, 660. [Google Scholar] [CrossRef] [Scilit]
  49. Parisi, F.; Mazziotta, A.; Travaglini, D. Trees, Deadwood and Tree-Related Microhabitats Explain Patterns of Alpha and Beta Saproxylic Beetle Diversity in Silver Fir-Beech Forests in Central Italy. Forests 2025, 16, 1715. [Google Scholar] [CrossRef] [Scilit]
  50. Hunter, M.L., Jr. Wildlife, Forests, and Forestry. Principles of Managing Forests for Biological Diversity; Prentice Hall: Englewood Cliffs, NJ, USA, 1990; ISBN 0139594795. [Google Scholar]
  51. Grove, S.J. Saproxylic Insect Ecology and the Sustainable Management of Forests. Annu. Rev. Ecol. Syst. 2002, 33, 1–23. [Google Scholar] [CrossRef] [Scilit]
  52. Bouget, C.; Brustel, H.; Brin, A.; Noblecourt, T.; Bouget, C.; Brustel, H.; Noblecourt, T.; Brin, A.; Noblecourt, T. Sampling Saproxylic Beetles with Window Flight Traps: Methodological Insights. Rev. d’Écologie 2008, 10, 21–32. [Google Scholar] [CrossRef] [Scilit]
  53. Mazzei, A.; Bonacci, T.; Horák, J.; Brandmayr, P. The Role of Topography, Stand and Habitat Features for Management and Biodiversity of a Prominent Forest Hotspot of the Mediterranean Basin: Saproxylic Beetles as Possible Indicators. For. Ecol. Manag. 2018, 410, 66–75. [Google Scholar] [CrossRef] [Scilit]
  54. Pérez-Sánchez, D.; Galante, E.; Micó, E. Functional and Taxonomic Beta Diversity of Saproxylic Beetles in Mediterranean Forests: On What Factors Do They Depend? Environ. Entomol. 2020, 49, 615–626. [Google Scholar] [CrossRef] [Scilit] [PubMed]
  55. Balestriero, R.; Pesenti, J.; LeCun, Y. Learning in High Dimension Always Amounts to Extrapolation. arXiv 2021, arXiv:2110.09485. [Google Scholar]
  56. Yu, M.; Zhou, Y.N.; Wang, Q.; Yan, F. Extrapolation Validation (EV): A Universal Validation Method for Mitigating Machine Learning Extrapolation Risk. Digit. Discov. 2024, 3, 105. [Google Scholar] [CrossRef] [Scilit]
  57. Kuhn, M. Caret: Classification and Regression Training, R Package Version 6.0-93. Available online: https://CRAN.R-project.org/package=caret (accessed on 2 March 2026).
  58. Collalti, A.; Dalmonech, D.; Vangi, E.; Marano, G.; Puchi, P.F.; Morichetti, M.; Saponaro, V.; Orrico, M.R.; Grieco, E. Monitoring and Predicting Forest Growth and Dynamics; CNR Edizioni: Rome, Italy, 2024. [Google Scholar]
  59. Farquhar, G.D.; von Caemmerer, S.; Berry, J.A. A Biochemical Model of Photosynthetic CO2 Assimilation in Leaves of C3 Species. Planta 1980, 149, 78–90. [Google Scholar] [CrossRef] [Scilit] [PubMed]
  60. Vangi, E.; Dalmonech, D.; Morichetti, M.; Grieco, E.; Giannetti, F.; D’Amico, G.; Nakhavali, M.; Chirici, G.; Collalti, A. Stand Age and Climate Change Effects on Carbon Increments and Stock Dynamics. Forests 2024, 15, 1120. [Google Scholar] [CrossRef] [Scilit]
  61. Bernacchi, C.J.; Calfapietra, C.; Davey, P.A.; Wittig, V.E.; Scarascia-Mugnozza, G.E.; Raines, C.A.; Long, S.P. Photosynthesis and Stomatal Conductance Responses of Poplars to Free-Air CO2 Enrichment (PopFACE) during the First Growth Cycle and Immediately Following Coppice. New Phytol. 2003, 159, 609–621. [Google Scholar] [CrossRef] [Scilit] [PubMed]
  62. de Pury, D.G.G.; Farquhar, G.D. Simple Scaling of Photosynthesis from Leaves to Canopies without the Errors of Big-Leaf Models. Plant Cell Environ. 1997, 20, 537–557. [Google Scholar] [CrossRef] [Scilit]
  63. Medlyn, B.; Barrett, D.; Landsberg, J.; Sands, P.; Clement, R. Conversion of Canopy Intercepted Radiation to Photosynthate: Review of Modelling Approaches for Regional Scales. Funct. Plant Biol. 2003, 30, 153–169. [Google Scholar] [CrossRef] [Scilit] [PubMed]
  64. McDowell, N.G.; Sevanto, S. The Mechanisms of Carbon Starvation: How, When, or Does It Even Occur at All? New Phytol. 2010, 186, 264–266. [Google Scholar] [CrossRef] [Scilit] [PubMed]
  65. Rowland, L.; da Costa, A.C.L.; Galbraith, D.R.; Oliveira, R.S.; Binks, O.J.; Oliveira, A.A.R.; Pullen, A.M.; Doughty, C.E.; Metcalfe, D.B.; Vasconcelos, S.S. Death from Drought in Tropical Forests Is Triggered by Hydraulics Not Carbon Starvation. Nature 2015, 528, 119–122. [Google Scholar] [CrossRef] [Scilit] [PubMed]
  66. Vangi, E.; Dalmonech, D.; D’Amico, G.; Grieco, E.; Morichetti, M.; Puchi, P.F.; Francini, S.; Fares, S.; Giannetti, F.; Corona, P.; et al. Monitoring Forest Attributes, C-Fluxes, and C-Stocks Using the Process-Based Model 3D-CMCC-FEM at the National Level. Ecol. Inform. 2025, 92, 103489. [Google Scholar] [CrossRef] [Scilit]
  67. Bennett, N.D.; Croke, B.F.W.; Guariso, G.; Guillaume, J.H.A.; Hamilton, S.H.; Jakeman, A.J.; Marsili-Libelli, S.; Newham, L.T.H.; Norton, J.P.; Perrin, C.; et al. Characterising Performance of Environmental Models. Environ. Model. Softw. 2013, 40, 1–20. [Google Scholar] [CrossRef] [Scilit]
  68. Raffa, M.; Reder, A.; Marras, G.F.; Mancini, M.; Scipione, G.; Santini, M.; Mercogliano, P. VHR-REA_IT Dataset: Very High Resolution Dynamical Downscaling of ERA5 Reanalysis over Italy by COSMO-CLM. Data 2021, 6, 88. [Google Scholar] [CrossRef] [Scilit]
  69. Costantini, E.A.C.; Dazzi, C. The Soils of Italy; Springer: Dordrecht, The Netherlands, 2013. [Google Scholar]
  70. Qiu, T.; Bell, A.J.; Swenson, J.J.; Clark, J.S. Habitat–Trait Interactions That Control Response to Climate Change: North American Ground Beetles (Carabidae). Glob. Ecol. Biogeogr. 2023, 32, 987–1001. [Google Scholar] [CrossRef] [Scilit]
  71. Edelmann, P.; Ambarlı, D.; Gossner, M.M.; Schall, P.; Ammer, C.; Wende, B.; Schulze, E.-D.; Weisser, W.W.; Seibold, S. Forest Management Affects Saproxylic Beetles through Tree Species Composition and Canopy Cover. For. Ecol. Manag. 2022, 524, 120532. [Google Scholar] [CrossRef] [Scilit]
  72. Staunton, K.M.; Robson, S.K.A.; Burwell, C.J.; Reside, A.E.; Williams, S.E. Projected Distributions and Diversity of Flightless Ground Beetles within the Australian Wet Tropics. PLoS ONE 2014, 9, e88635. [Google Scholar] [CrossRef] [Scilit] [PubMed]
  73. Harris, J.E.; Rodenhouse, N.L.; Holmes, R.T. Decline in Beetle Abundance and Diversity in an Intact Temperate Forest Linked to Climate Warming. Biol. Conserv. 2019, 240, 108219. [Google Scholar] [CrossRef] [Scilit]
  74. Ernst, C.M.; Buddle, C.M. Drivers and Patterns of Ground-Dwelling Beetle Biodiversity across Northern Canada. PLoS ONE 2015, 10, e0122163. [Google Scholar] [CrossRef] [Scilit] [PubMed]
  75. Yu, X.-D.; Lü, L.; Luo, T.-H.; Zhou, H.-Z. Elevational Gradient in Species Richness Pattern of Epigaeic Beetles and Underlying Mechanisms at East Slope of Balang Mountain in Southwestern China. PLoS ONE 2013, 8, e69177. [Google Scholar] [CrossRef] [Scilit] [PubMed]
  76. Parisi, F.; Mazziotta, A.; Vangi, E.; Tognetti, R.; Travaglini, D.; Marchetti, M.; D’Amico, G.; Francini, S.; Borghi, C.; Chirici, G. Exposure Elevation and Forest Structure Predict the Abundance of Saproxylic Beetles’ Communities in Mountain Managed Beech Forests. iForest-Biogeosci. For. 2023, 16, 155–164. [Google Scholar] [CrossRef] [Scilit]
  77. Carrara, R.; Vázquez, D.P.; Scollo, A.M.; Flores, G.E. Predictions and Test of Multiple Climate-Species Richness Hypotheses to Explain the Spatial Distribution of Tenebrionid Beetles in Mountain Environments. An. Acad. Bras. Ciênc 2023, 95, e20210439. [Google Scholar] [CrossRef] [Scilit] [PubMed]
  78. Njovu, H.K.; Steffan-Dewenter, I.; Gebert, F.; Schellenberger Costa, D.; Kleyer, M.; Wagner, T.; Peters, M.K. Plant Traits Mediate the Effects of Climate on Phytophagous Beetle Diversity on Mt. Kilimanjaro. Ecology 2021, 102, e03521. [Google Scholar] [CrossRef] [Scilit] [PubMed]
  79. Asbeck, T.; Großmann, J.; Paillet, Y.; Winiger, N.; Bauhus, J. The Use of Tree-Related Microhabitats as Forest Biodiversity Indicators and to Guide Integrated Forest Management. Curr. For. Rep. 2021, 7, 59–68. [Google Scholar] [CrossRef] [Scilit]
  80. Larrieu, L.; Courbaud, B.; Drénou, C.; Goulard, M.; Bütler, R.; Kozák, D.; Kraus, D.; Krumm, F.; Lachat, T.; Müller, J.; et al. Key Factors Determining the Presence of Tree-Related Microhabitats: A Synthesis of Potential Factors at Site, Stand and Tree Scales, with Perspectives for Further Research. For. Ecol. Manag. 2022, 515, 120235. [Google Scholar] [CrossRef] [Scilit]
  81. Courbaud, B.; Larrieu, L.; Kozak, D.; Kraus, D.; Lachat, T.; Ladet, S.; Müller, J.; Paillet, Y.; Sagheb-Talebi, K.; Schuck, A.; et al. Factors Influencing the Rate of Formation of Tree-related Microhabitats and Implications for Biodiversity Conservation and Forest Management. J. Appl. Ecol. 2022, 59, 492–503. [Google Scholar] [CrossRef] [Scilit]
  82. Itter, M.S.; Finley, A.O.; D’Amato, A.W.; Foster, J.R.; Bradford, J.B. Variable Effects of Climate on Forest Growth in Relation to Climate Extremes, Disturbance, and Forest Dynamics. Ecol. Appl. 2017, 27, 1082–1095. [Google Scholar] [CrossRef] [Scilit] [PubMed]
  83. Müller, J.; Bussler, H.; Brin, A.; Brustel, H.; Bouget, C.; Deconchat, M.; Thorn, S. Forest Age, Tree Species and Climate Effects on Tree Microhabitat Occurrence. For. Ecol. Manag. 2019, 432, 559–569. [Google Scholar] [CrossRef] [Scilit]
  84. Larrieu, L.; Cabanettes, A.; Gonin, P.; Lachat, T.; Paillet, Y.; Winter, S.; Bouget, C.; Bütler, R.; Deconchat, M.; Duchâteau, R. Deadwood and Tree Microhabitat Dynamics. For. Ecol. Manag. 2014, 334, 163–173. [Google Scholar] [CrossRef] [Scilit]
  85. Komonen, A.; Müller, J. Dispersal Ecology of Deadwood Organisms and Connectivity Conservation. Conserv. Biol. 2018, 32, 535–545. [Google Scholar] [CrossRef] [Scilit] [PubMed]
  86. Spînu, A.P.; Asbeck, T.; Bauhus, J. Combined Retention of Large Living and Dead Trees Can Improve Provision of Tree-Related Microhabitats in Central European Montane Forests. Eur. J. For. Res. 2022, 141, 1105–1120. [Google Scholar] [CrossRef] [Scilit]
  87. D’Amen, M.; Bombi, P.; Campanaro, A.; Zapponi, L.; Bologna, M.A.; Mason, F. Protected Areas and Insect Conservation: Questioning the Effectiveness of Natura 2000 Network for Saproxylic Beetles in Italy. Anim. Conserv. 2013, 16, 370–378. [Google Scholar] [CrossRef] [Scilit]
  88. Marta, S.; Brunetti, M.; Manenti, R. Climate and Land-Use Changes Drive Biodiversity Turnover in Arthropod Assemblages over 150 Years. Nat. Ecol. Evol. 2021, 5, 1291–1300. [Google Scholar] [CrossRef] [Scilit] [PubMed]
  89. Pinsky, M.L.; Hillebrand, H.; Chase, J.M. Warming and Cooling Catalyse Widespread Temporal Turnover in Biodiversity. Nature 2025, 638, 995–999. [Google Scholar] [CrossRef] [Scilit] [PubMed]
  90. Seibold, S.; Gossner, M.M.; Simons, N.K.; Blüthgen, N.; Müller, J.; Ambarlı, D. Arthropod Decline in Grasslands and Forests Is Associated with Landscape-Level Drivers. Nature 2019, 574, 671–674. [Google Scholar] [CrossRef] [Scilit] [PubMed]
  91. Lindman, L.; Öckinger, E.; Ranius, T. Microclimatic Conditions Mediate the Effect of Deadwood and Forest Characteristics on a Threatened Beetle Species, Tragosoma Depsarium. Oecologia 2022, 199, 737–752. [Google Scholar] [CrossRef] [Scilit] [PubMed]
  92. Seidl, R.; Thom, D.; Kautz, M.; Martin-Benito, D.; Peltoniemi, M.; Vacchiano, G.; Wild, J.; Ascoli, D.; Petr, M.; Honkaniemi, J.; et al. Forest Disturbances under Climate Change. Nat. Clim. Change 2017, 7, 395–402. [Google Scholar] [CrossRef] [Scilit] [PubMed]
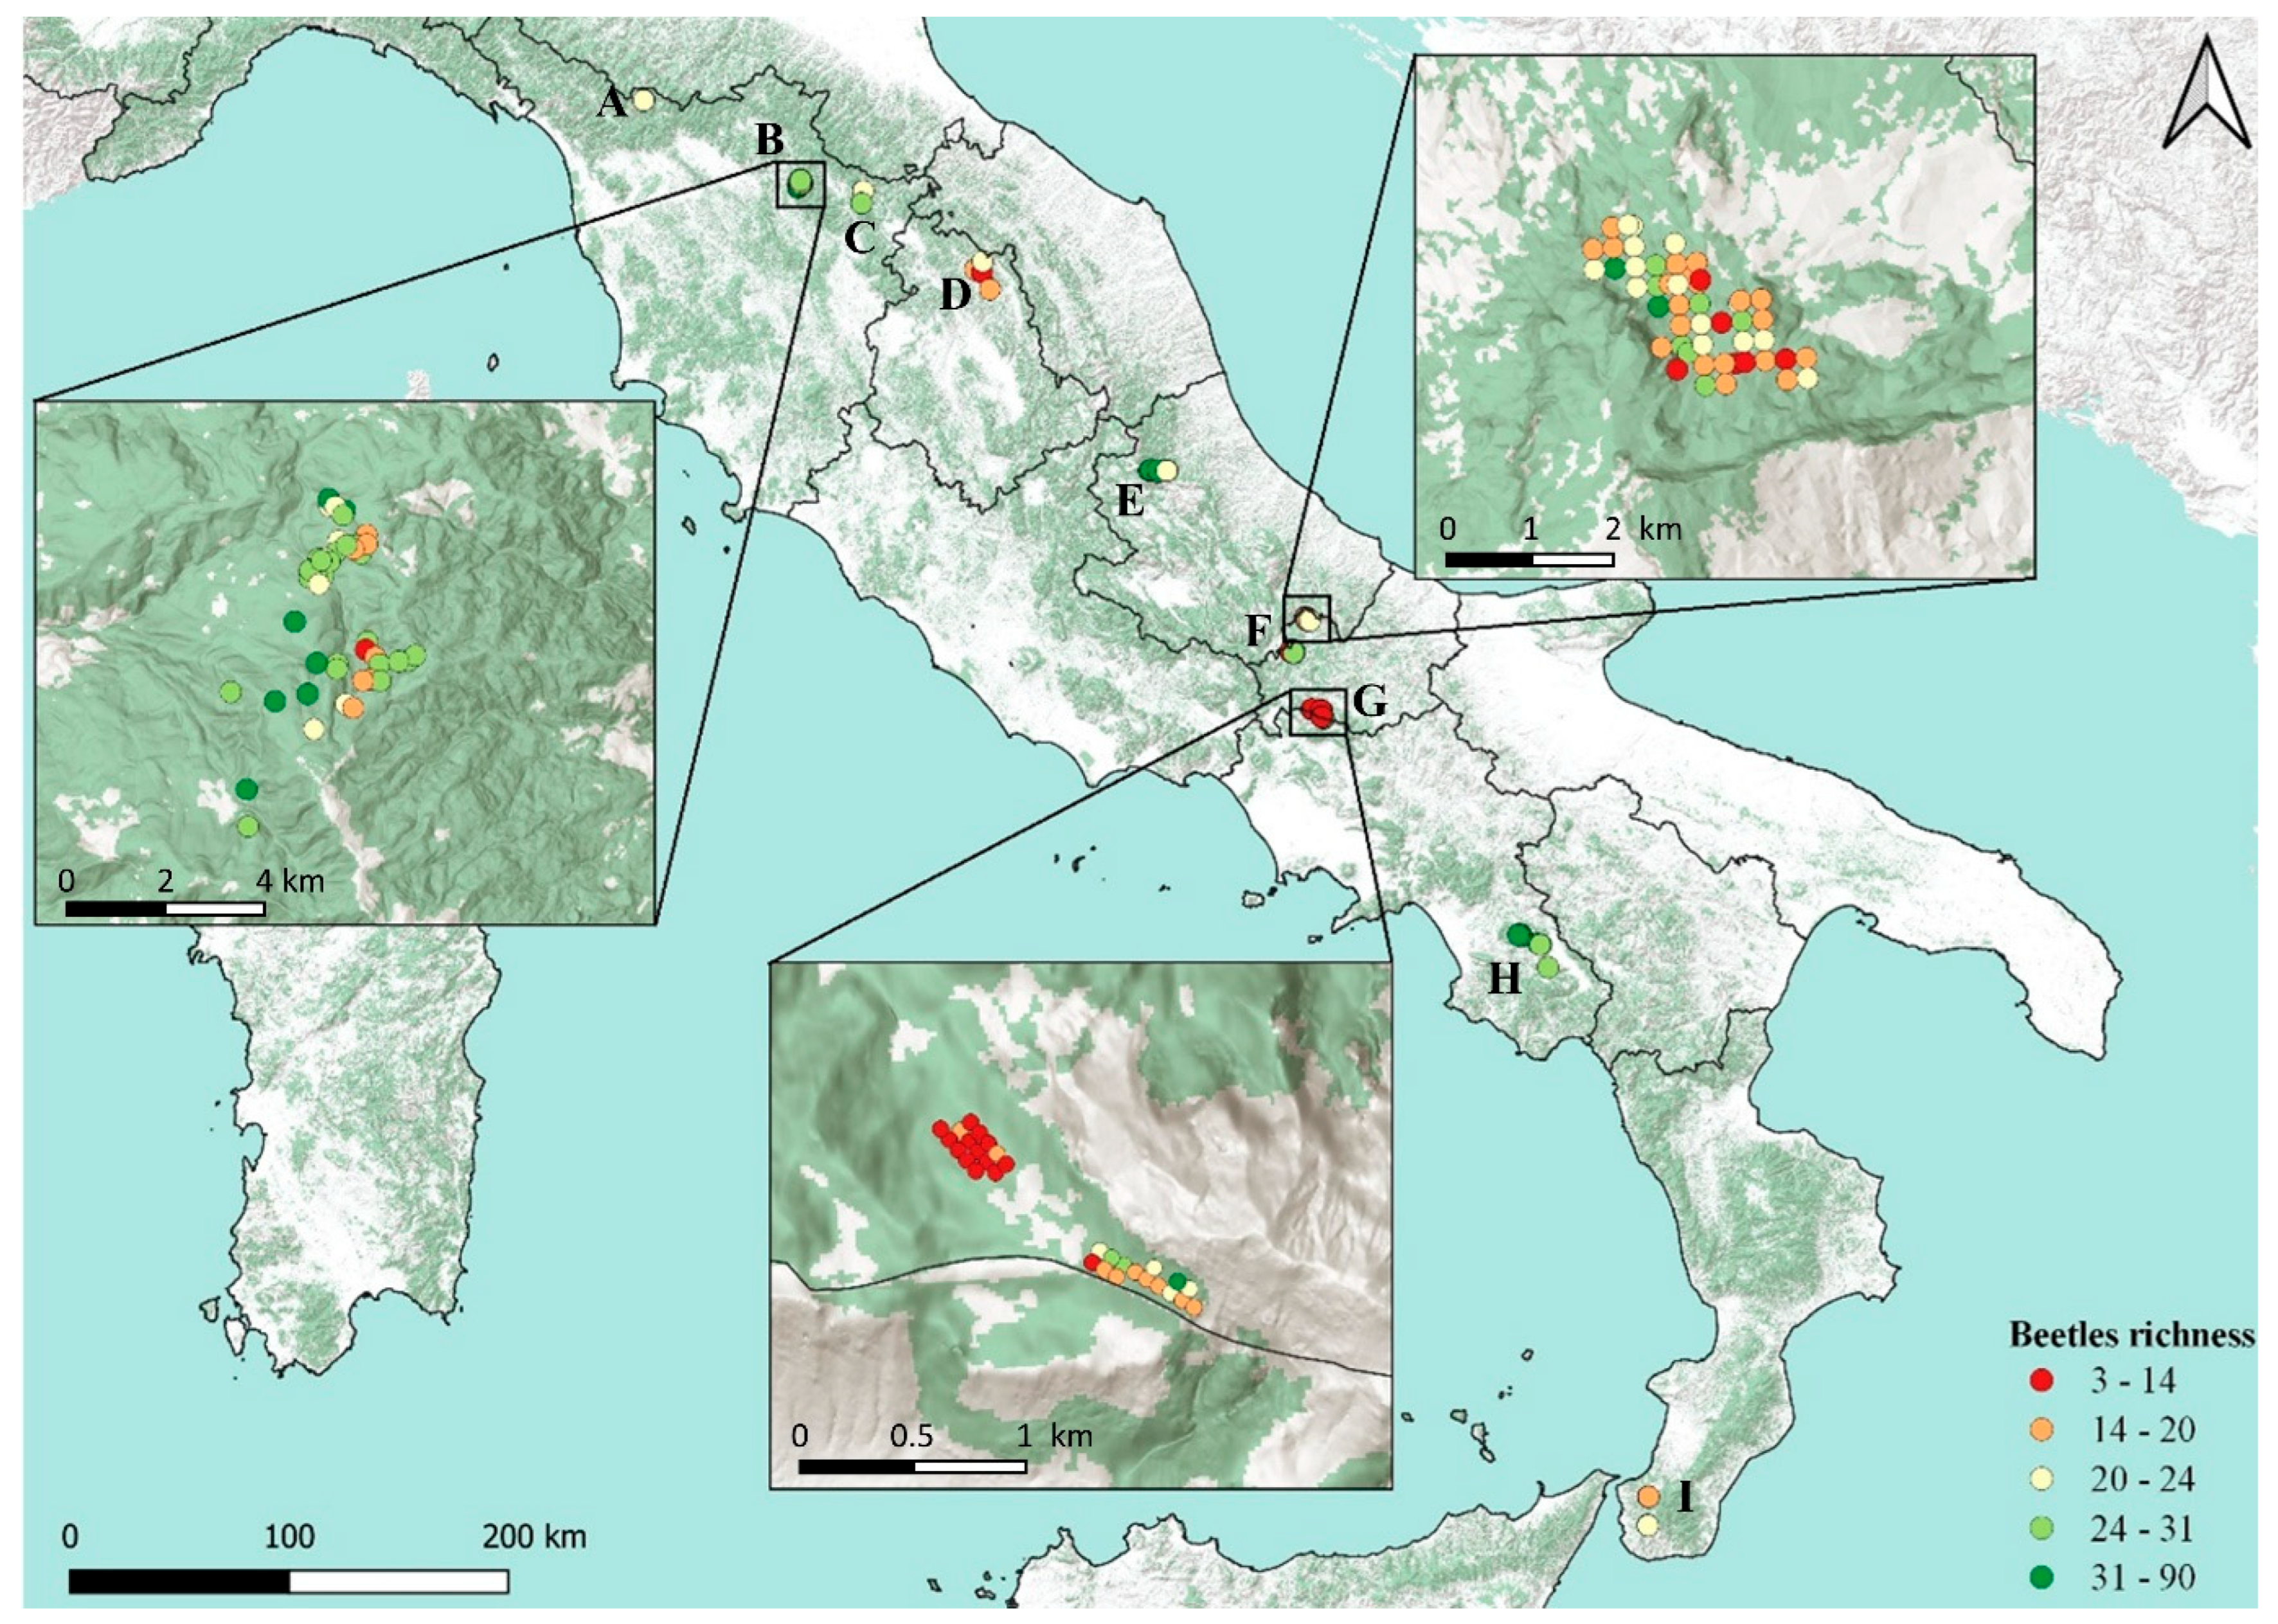
Figure 1. Spatial distribution of the plots used in the study. A. Pian degli Ontani and Baldo; B. Vallombrosa; C. Casentino 1, Casentino 2 and La Verna; D. Gubbio; E. Gran Sasso; F. Abeti Soprani and Bosco Pennataro; G. Matese; H. Cilento; I. Aspromonte. The zoomed areas show examples of the field plot distribution. Colors indicate the beetles’ richness, measured by the number of unique species.
Forests 17 00896 g001
Figure 2. Scatterplot of predicted vs. observed values for beetle richness for the nine tested ML models. The black line is the y = x line. In the panel titles, the acronyms are: Gaussian Process regression with linear (gaussLinear), polynomial (gaussPoly), and radial kernel function (gaussRadial), K-nearest neighbor (kknn), kernel-based regularized least squares (krlsRadial), multiple linear regression (lm), partial least squares (pls), polynomial partial least squares with generalized linear model (plsRglm), and Support Vector Machine with a radial kernel function (svmRadial).
Forests 17 00896 g002
Figure 3. Scatterplot of predicted vs. observed values for TreMs richness for the nine tested ML models. The black line is the y = x line. For the panel titles, refer to the caption of Figure 2.
Forests 17 00896 g003
Figure 4. Beetles’ richness prediction for each dominant species under the three future scenarios. The shaded area represents the standard deviation of richness across all plots.
Forests 17 00896 g004
Figure 5. Beetle richness differences relative to the CCS under climate change. The red lines represent RCP 8.5, while the yellow ones represent RCP 4.5.
Forests 17 00896 g005
Figure 6. TreM richness prediction for each species under the three future scenarios. The shaded area represents the standard deviation of richness across all plots.
Forests 17 00896 g006
Figure 7. Beetle richness differences relative to the CCS under climate change. The red lines represent RCP 8.5, while the yellow ones represent RCP 4.5.
Forests 17 00896 g007
Table 1. Summary information of the field plots per species. The survey year denotes the period during which the field survey was conducted. “SD” refers to standard deviation.
Beetles RichnessTree-Related Microhabitats
SpecieN PlotsSurvey YearElevationDBHHeightMeanSDMeanSD
Abies alba1002012–2021117628.619.422.96.86519514
Castanea sativa402018106241.817.727.517.729702881
Fagus sylvatica1272016–2021132324.418.321.410.6238206
Quercus cerris652014–202193521.214.322.410.7267190
Disclaimer/Publisher’s Note: The statements, opinions and data contained in all publications are solely those of the individual author(s) and contributor(s) and not of MDPI and/or the editor(s). MDPI and/or the editor(s) disclaim responsibility for any injury to people or property resulting from any ideas, methods, instructions or products referred to in the content.