Article

Network Structure Explained the Differences in the Response of Soil Bacterial Community Structure and Functional Structure to Afforestation Types


College of Forestry Engineering, Shandong Agriculture and Engineering University, Jinan 250100, China
*
Author to whom correspondence should be addressed.
Forests 2026, 17(6), 702; https://doi.org/10.3390/f17060702
Submission received: 10 May 2026 / Revised: 12 June 2026 / Accepted: 14 June 2026 / Published: 16 June 2026
(This article belongs to the Section Forest Soil)

Abstract

This study used 16S rDNA high-throughput sequencing and Faprotax functional prediction to analyze the effects of different artificial forests (coniferous forest, conifer–broad-leaved mixed forest, broad-leaved forest) in the Fanggan ecological restoration area of North China on soil bacterial community composition and functional characteristics and, based on network topology features, analyzed the potential influencing pathways. Planting broad-leaved forests significantly increased soil bacterial α-diversity indices (ACE, Chao1, Shannon) and induced the greatest heterogeneity in both community and functional composition. Soil bacteria exhibit significant differences in taxonomic structure across forest types but not in functional structure. The classification network and functional network of broad-leaved forests are more complex than those of coniferous and mixed forests, with the former having more nodes and edges, as well as higher weighted degree and betweenness centrality. Zi-Pi analysis indicates that high-abundance taxa involved in carbon and nitrogen cycles dominate the keystone taxa of the taxonomic network, while low-abundance pathogenic, urea-decomposing, and trace element metabolism functional groups dominate the keystone groups of the functional network. Redundancy analysis further revealed that soil available potassium concentration, pH, and tree species composition (importance values of Pinus tabulaeformis and Populus davidiana) were the principal determinants of bacterial functional structure. Collectively, broad-leaved forests achieve higher network robustness via elevated network complexity and functional redundancy, whereas coniferous forests might rely on functional convergence and modular integration to cope with resource limitation. These results indicate that network traits mediate the distinct responses of bacterial communities and their functional potentials, offering practical references for vegetation restoration in limestone mountain areas.

1. Introduction

Artificial forests are pivotal in alleviating the ecological crisis precipitated by large-scale natural forest degradation. On poor soils, planting suitable tree species boosts biodiversity and maintains ecosystem functions. In afforestation practices, local areas usually plant coniferous, broad-leaved and mixed forests. Empirical evidence indicates that these forest types generate distinct aboveground–belowground linkages between plant assemblages and soil ecosystems [1]. Microbial communities exhibit divergent structural and functional responses to such forest-type modifications.
Bacteria generally constitute more than half of the microbial biomass in most terrestrial soils [2], whereas fungi dominate biomass (60%–80%) in acidic forest soils. Their community assembly is governed by the joint action of deterministic and stochastic processes [3,4,5]. To explore microbial functions, the 16S rRNA-based FAPROTAX database is widely used to match microbial groups with ecological functions such as carbon, nitrogen and trace element cycling [6]. Nevertheless, FAPROTAX yields only putative functional annotations from cultured prokaryotes and cannot detect in situ functional genes or metabolic pathways of uncultured soil microbes. Due to functional redundancy, functional structures are less affected by random changes in rare species than community structure [7], thereby resulting in a weaker response of functional structure to environmental changes than community structure [2]. For instance, soil pH strongly shapes microbial community composition but has little effect on redundant functional pathways [8]. When resource shortages or lack of alternative species lower redundancy, environmental filtering strengthens, and functional distribution becomes consistent with community structure.
Network analysis is widely used to explore species co-occurrence in ecosystems [9]. It uses taxa as nodes and their relationships as edges to quantify microbial co-abundance patterns. Correlation-based networks cannot reflect direct biological interactions between taxa [10,11]. In soil microbiome research, 16S rRNA-based co-occurrence networks emerge as the integrated outcome of environmental filtering, dispersal limitation, biotic interactions, and stochastic processes [12,13]. Comparing these co-occurrence networks with functional (trait or gene) networks allows explicit testing of whether species that share functional attributes also form cohesive co-occurrence modules [14] and clarifies why community structure and functional abundance may respond differently to changes in forest stand type [15,16,17]. This ‘co-occurrence vs. functional’ comparison has been embedded within modular network theory to provide a systematic assessment of community assembly mechanisms [18]. Topological indices—including betweenness centrality, network density, and average nearest-neighbor degree—quantify both the stability and complexity of microbial networks [19,20] and facilitate the identification of keystone taxa that are essential for efficient resource use and network persistence [21]. Keystone taxa sustain network stability and facilitate soil resource cycling [22], and, similarly, network structure has a significant impact on ecosystem multifunctionality [23]. Analyzing the network positions of rare species clarifies how rare functional traits affect species coexistence [24,25,26]. In soil systems, microbial co-occurrence networks are governed primarily by niche overlap, differentiation, and competitive interactions [21]. Afforestation increases nutrient supply and improves microhabitats, thus strengthening interactions among microbes [27]. Combining co-occurrence networks with functional data can reveal the roles and interactions of soil bacteria and support biodiversity conservation and ecological restoration [28,29,30].
The original forests in Shandong Province have historically suffered severe deforestation and destruction, leaving only barren mountains and bare rocks. Most areas are limestone-derived, leading to infertile soil and weak natural vegetation recovery. In the Fanggan Ecological Restoration Area, situated north of Mount Tai, villagers initiated large-scale restoration in 1970 by importing exogenous topsoil and planting more than 3 million trees, thereby establishing coniferous, broad-leaved, and mixed coniferous–broad-leaved forests. All forest stands had consistent soil conditions before afforestation. Previous work has documented the influence of plantation type on soil physicochemical properties, bacterial diversity, and community structure and has attributed community shifts to habitat specialization and abundance distributions [31,32]. Nevertheless, the response of soil bacterial functional structure to afforestation remains poorly resolved. Few studies have explored how network topology regulates the distinct responses of bacterial communities and potential functions across forest types in North China’s limestone mountains. Considering the limitation that FAPROTAX cannot reflect the real metabolic activity of uncultured microbes, we combined 16S rRNA data and FAPROTAX functional profiles to explore three questions: (1) How do plantation types alter soil bacterial community composition and putative functional potential? (2) How do topological features and keystone taxa differ between taxonomic co-occurrence networks and networks based on predicted functional profiles? (3) Can network characteristics explain the divergent responses of community composition and putative functional structure to different plantation types? The results will clarify how different artificial forests affect soil bacterial communities and their predicted functions in limestone mountainous areas and provide reasonable mechanisms from the perspective of network characteristics.

2. Materials and Methods

The Fanggan Ecological Restoration Area is located in the northern Shandong Central Mountain Range, China (117°24′45″–117°28′5″ E, 36°24′23″–36°26′44″ N), with a total basin area of 4.01 km2. The landscape is dominated by rugged mountainous and hilly topography, with the highest summit at 860 m a.s.l. and more than 30 peaks exceeding 400 m a.s.l. A continental monsoon climate prevails, featuring a mean annual air temperature of 12.4 °C and an absolute minimum of −22.5 °C. Mean annual precipitation surpasses 830 mm, approximately 70% of which is concentrated between July and September. Mountain brown soils prevail, supporting an average litter layer thickness of 4 cm. Vegetation exhibits a distinct vertical stratification but comparatively low α-diversity. The arboreal layer is dominated by Pinus densiflora, P. tabulaeformis, Populus davidiana, Robinia pseudoacacia, and Diospyros lotus. The shrub stratum is primarily composed of Vitex negundo var. heterophylla, Ziziphus jujuba var. spinosa, and Grewia biloba, together with abundant regeneration of overstorey species. The herbaceous layer is dominated by members of the Poaceae, Cyperaceae, and Asteraceae. All forest stands were artificially afforested between 1975 and 1985, yielding a relatively homogeneous stand age structure.
Based on a comprehensive literature review and preliminary field reconnaissance, the restored forest stands within the study area are predominantly distributed between 300 and 750 m a.s.l. Consequently, vegetation surveys were restricted to closed-canopy forest patches located within this elevational belt. A total of 24 survey plots (10 m × 10 m each) were systematically established, spanning three afforestation types: 6 plots for coniferous forest (CF), 6 plots for mixed coniferous–broad-leaved forest (MF), and 12 plots for broad-leaved forest (BF). The number of sample plots was set to be consistent with the actual area distribution ratio of each forest stand, and the sampling quantity and area reflected the actual situation of each forest stand in the restoration area. To minimize topographical confounding effects, plot placement was standardized to ensure maximal homogeneity in slope, aspect, and local landform. All plots were spatially separated with a minimum distance of >500 m without nested distribution within a single forest patch. For every plot, geographic coordinates (latitude and longitude), elevation, slope aspect, and slope gradient were precisely recorded using a high-precision global navigation satellite system (GNSS) receiver and an integrated electronic clinometer.

2.1. Vegetation Community Survey and Soil Physicochemical Property Analysis

All trees with DBH ≥ 3 cm were surveyed. Vegetation α-diversity metrics, such as species richness plus five evenness and diversity formulas (Equations (1)–(5)), were subsequently computed.
Shannon - Winner   diversity   index = i = 1 m P i l n P i
Simpson   diversity   index = 1 i = 1 m P i ( P i 1 ) N ( N 1 )
Shannon   evenness   index = S h a n n o n w i n n e r   d i v e r s i t y   i n d e x l o g ( m )
Simpson   evenness   index = S i m p s o n   d i v e r s i t y   i n d e x l o g ( m )
Pielou   evenness   index = i = 1 m P i l o g P i l o g ( m )
In each 10 m × 10 m plot, the 0–10 cm mineral topsoil layer was sampled using a five-point composite design: one sampling point was positioned at the plot centroid, and the remaining four were located 3 m inward from each corner vertex along the diagonal. Soil cores (Ø 5 cm) collected at the five positions were homogenized in situ to form a single composite sample per plot, yielding 24 composite samples (6 for coniferous forest, 6 for mixed forests and 12 for broad-leaved forest). Each composite was immediately split into two subsamples under sterile conditions. The first subsample (~10 g) was flash-frozen in liquid nitrogen (−196 °C) for subsequent DNA extraction and high-throughput molecular analyses; the second subsample (~500 g) was placed in pre-labeled polyethylene bags, transported to the laboratory on ice within 4 h, and stored at 4 °C until physicochemical characterization.
Soil pH was determined by the potentiometric method with a 2.5:1 water–soil ratio. Organic carbon content (SOC) was determined by potassium dichromate oxidation spectrophotometry [33], and available phosphorus (AP) was determined by molybdenum-antimony anti-color spectrophotometry [34]. Ammonium nitrogen (NH4+-N) was quantified via KCl extraction coupled with UV spectrophotometry, and the content of rapid-acting potassium (SK; available potassium represents plant-accessible soil potassium, including water-soluble and exchangeable forms) was determined using the ammonium acetate extraction and flame photometric method.

2.2. DNA Extraction, PCR Amplification and ASV Clustering

Total genomic DNA was extracted from 24 soil samples using the TGuide S96 Magnetic Soil/Stool DNA Kit (Tiangen Biotech, Beijing, China) following the manufacturer’s instructions. DNA integrity was assessed by 1.8% agarose gel electrophoresis, and concentration and purity (A260/A280 and A260/A230) were determined with a NanoDrop 2000 UV-Vis spectrophotometer (Thermo Scientific, Wilmington, NC, USA). Full-length bacterial 16S rRNA genes were amplified with the primer pair 27F (5′-AGRGTTTGATYNTGGCTCAG-3′) and 1492R (5′-TASGGHTACCTTGTTASGACTT-3′). Forward and reverse primers were appended with sample-specific PacBio barcodes to enable multiplexed sequencing; this single-step barcoding approach was chosen to reduce chimera formation relative to a two-step PCR protocol. Amplification was performed using KOD One PCR Master Mix (TOYOBO Life Science, TOYOBO Co., Ltd., Osaka, Japan) in 25 cycles: initial denaturation at 95 °C for 2 min, followed by 25 cycles of 98 °C for 10 s, 55 °C for 30 s, and 72 °C for 90 s, with a final extension at 72 °C for 2 min. Amplicons were purified with VAHTS DNA Clean Beads (Vazyme, Nanjing, China), quantified using the Qubit dsDNA HS Assay Kit and Qubit 3.0 Fluorometer (Invitrogen, Thermo Fisher Scientific, Waltham, MA, USA), and pooled at equimolar concentrations. SMRTbell libraries were prepared from the pooled amplicons with the SMRTbell Express Template Prep Kit 2.0 (Pacific Biosciences, Menlo Park, CA, USA), according to the manufacturer’s instructions and sequenced on a PacBio Sequel II platform (Beijing Biomarker Technologies Co., Ltd., Beijing, China) using the Sequel II Binding Kit 2.0. High-quality circular consensus sequences were processed with DADA2 [35] to generate amplicon sequence variants (ASVs), and ASVs represented by <2 reads across all samples were discarded. Taxonomic classification was performed in QIIME2 [36] using the Naïve Bayes classifier against the SILVA database (release 138.1) with a confidence threshold of 70% [37].

2.3. Functional Prediction with FAPROTAX

FAPROTAX is a manually curated functional annotation database that links prokaryotic taxa to metabolic or ecological traits documented in the literature for culturable bacteria. Its Python 3.8 script transforms ASV tables into putative functional profiles, drawing on >7600 literature-based annotations distributed among >80 functional groups. The database concentrates on carbon, nitrogen, hydrogen, phosphorus, and sulfur cycling, and—because it relies on experimentally verified phenotypes—FAPROTAX serves as a cost-effective preliminary functional prediction tool complementary to genome-resolved functional annotation [6,38]. The prepared 16S-derived ASV tables (annotated with GreenGenes or SILVA taxonomy) were processed against FAPROTAX (http://www.zoology.ubc.ca/louca/FAPROTAX/, accessed 7 April 2021). The original output contained redundant metabolic assignments; these were consolidated as follows: ‘Aerobic chemoheterotrophy’ was reclassified as Chemo-1 (principal aerobic heterotrophic pathways), whereas ‘chemoheterotrophy’ was designated Chemo-2 (containing recalcitrant substrate degradation of lignin, chitin, xylan, and cellulose). ‘Methylotrophy’ (methanol oxidation, methanotrophy) and ‘aromatic compound degradation’ (aromatic hydrocarbon catabolism) were retained without modification. With regard to nitrogen transformation, nitrite ammonification, including DNRA-related nitrate ammonification, was uniformly categorized as ammonification in this study, which refers to dissimilatory nitrate reduction to ammonium (DNRA) [39]. The deduplicated matrix comprises 11 carbon cycle and 7 nitrogen cycle functional categories. Notably, all functional profiles obtained here are in silico predictions rather than measurements of in situ microbial metabolic activity, and the results should be interpreted strictly within this constraint.

2.4. Network Structure Construction and Analysis of Topological Parameters and Key Nodes

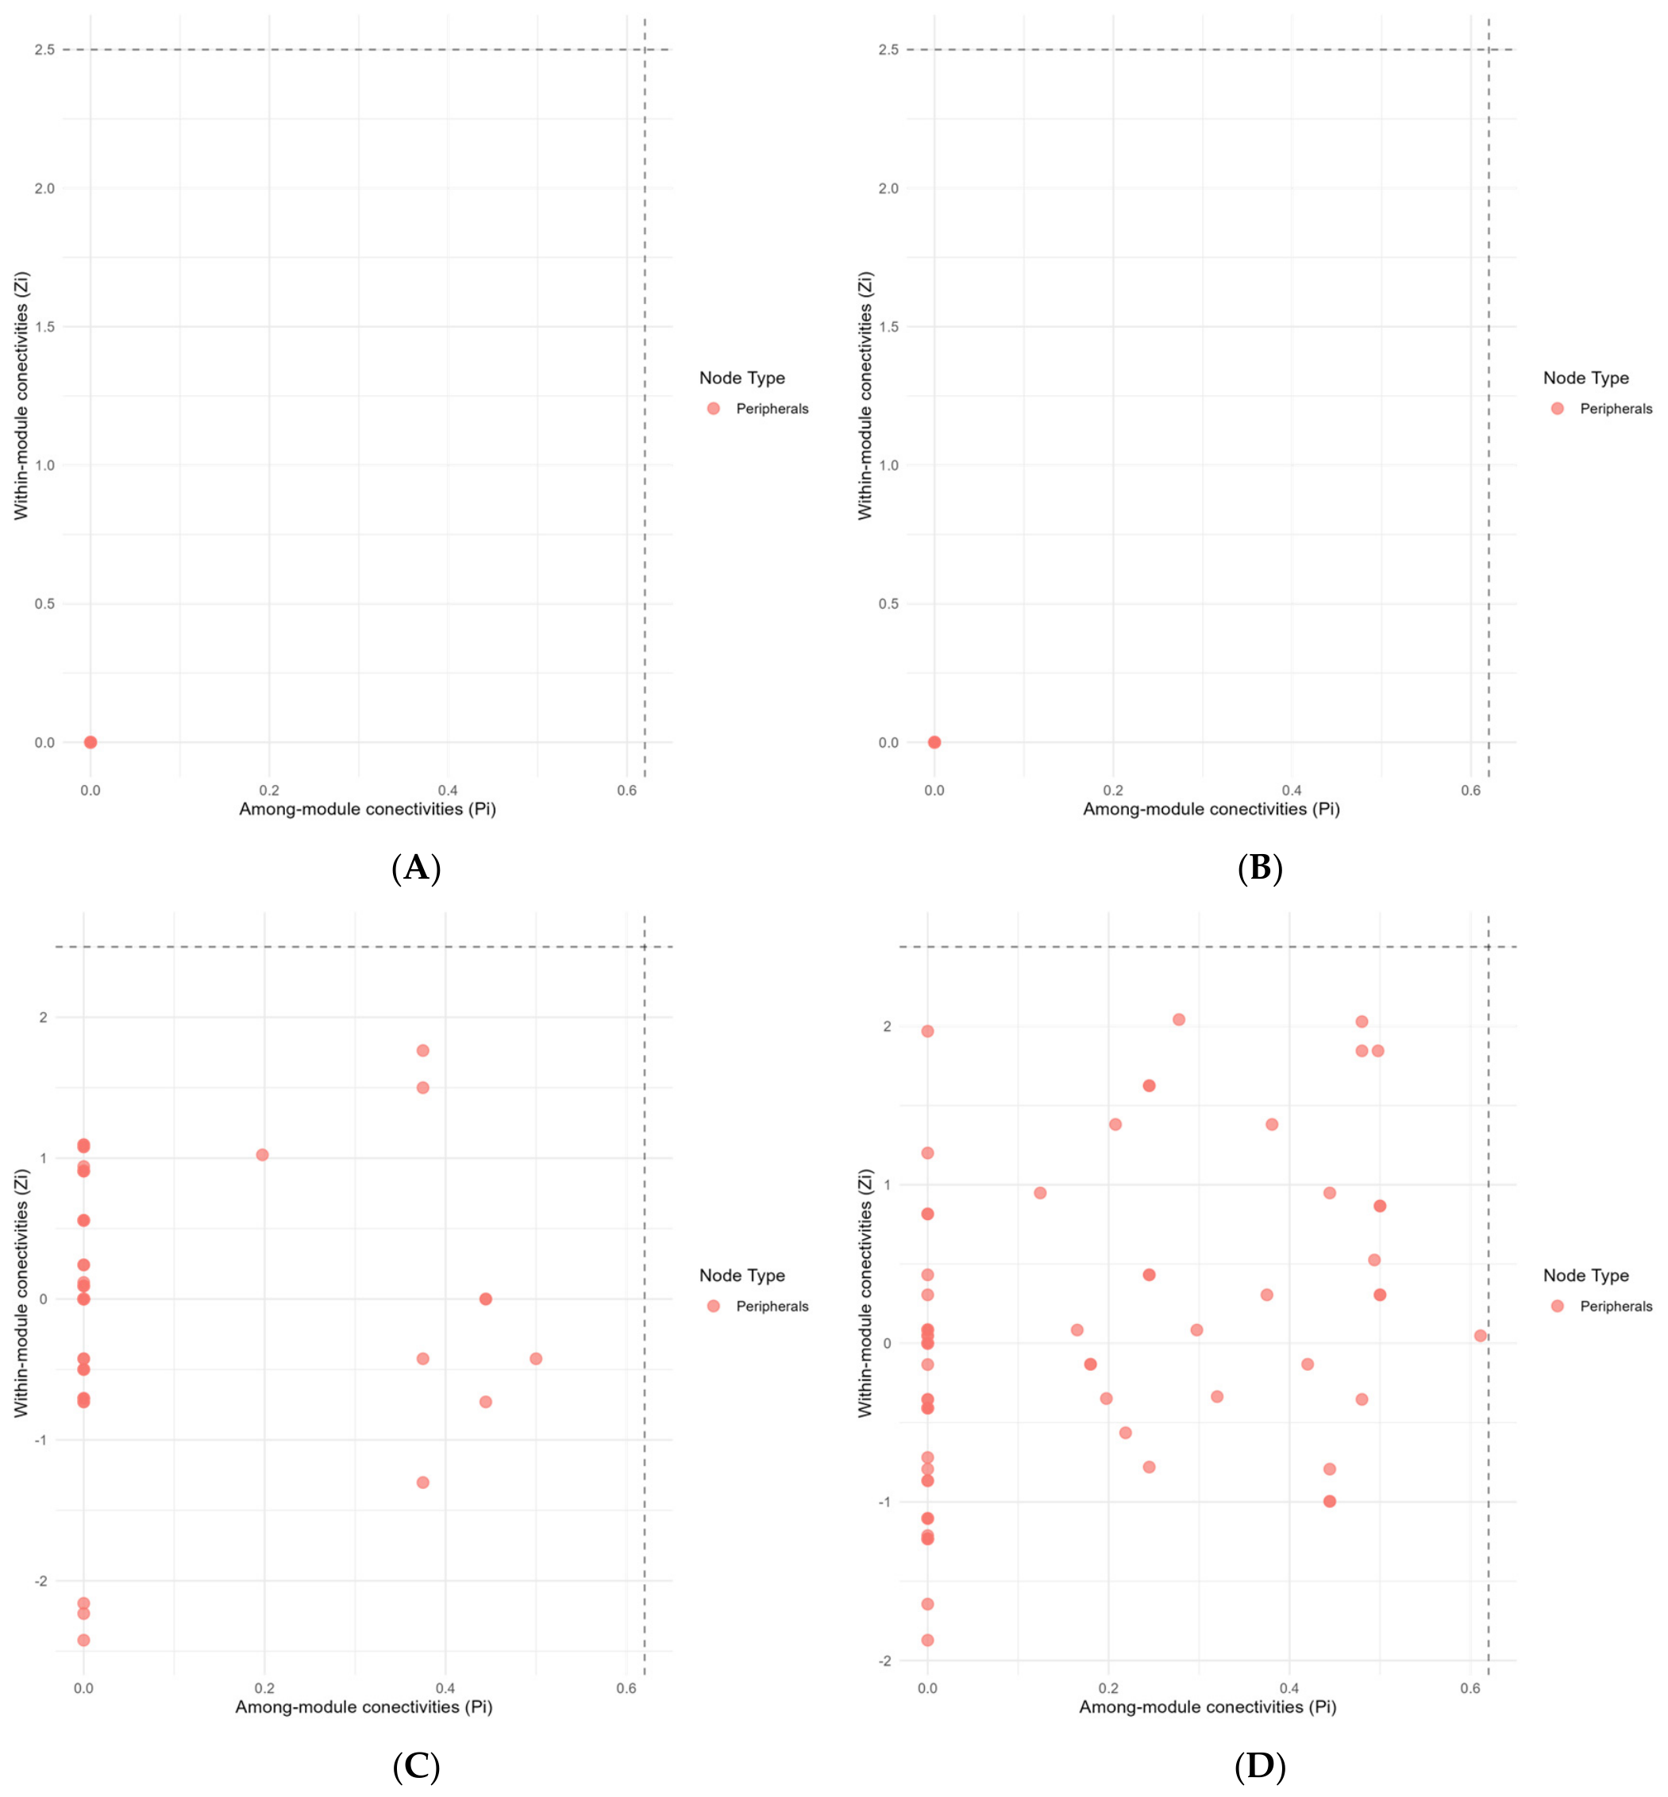
Co-occurrence and functional networks were inferred from the quadrat–species-level abundance matrices and quadrat–functional abundance matrices, respectively, via Spearman rank correlations implemented with the Hmisc package in R (|r| > 0.7, p < 0.05). The determination of the correlation coefficient r underwent robustness analysis across five thresholds: r = 0.5, 0.6, 0.7, 0.8, and 0.9. Ultimately, the correlation threshold for network analysis was established as 0.7 (Figure S1). In response to the fact that the number of broad-leaved forest plots is twice that of other forest types, we calculated network metrics based on topological averages from 500 independent rarefaction resamplings of sequencing reads. Null model simulations (n = 100) were implemented to distinguish non-random network architecture from random assembly; metrics beyond the 95% null confidence interval represented deterministic co-occurrence. Different generation algorithms (simple/VL) were selected according to network sparsity across forest types. Network topology was characterized using the igraph package (v. 1.3.0) [40] and visualized in Gephi 0.9. Topological indices were extracted for each stand and compared between co-occurrence and functional networks. Within-module connectivity (Zi) and among-module connectivity (Pi) were calculated with igraph to classify ASVs into four roles: network hubs (Zi ≥ 2.5, Pi ≥ 0.62), module hubs (Zi ≥ 2.5, Pi < 0.62), connectors (Zi < 2.5, Pi ≥ 0.62), and peripherals (Zi < 2.5, Pi < 0.62). Nodes other than peripherals were designated key nodes [41], which are considered critical for preserving network stability [42,43]. The key nodes of the taxonomic network are functionally predicted on the FAP platform at www.cloud.biomicroclass.com/CloudPlatform/SoftPage/FAP accessed on 10 April 2025. Zi-Pi classification results are sensitive to network construction parameters and module partitioning algorithms, which may introduce analytical uncertainty.

2.5. Data Analysis

One-way ANOVA was used to compare the significant differences in soil physicochemical properties and abundances at the phylum and genus levels. Pairwise comparisons of α-diversity across different forest types were conducted using Student’s t-test. To avoid Type I errors in statistics, the Bonferroni method was used to correct the p-values of significant differences. The significant differences in total carbon cycle abundance, total nitrogen cycle abundance, 11 annotated carbon cycle functions, and 7 annotated nitrogen cycle functions, as well as the total abundance of other element metabolism among afforestation types, were compared. Community structure and functional abundance structure were constructed based on the relative abundance matrix of plot–ASVs and the plot–functional abundance matrix, respectively. Principal Coordinates Analysis (PCoA) was used for analysis based on the Bray–Curtis distance matrix of the relative abundance of plots–species-level and functional relative abundance matrix, and plots were created with the ggplot2 package of R. Meanwhile, we reported the R2 and p-values of community structure differences using PERMANOVA analysis. Pearson correlation coefficient analysis was conducted to examine the correlation between environmental factors (including soil physicochemical properties, plant diversity, and tree layer composition) and functional abundance. Redundancy analysis (RDA) was then used to explain the contribution of environmental factors to the variation in Faprotax-predicted functional structure. The significance of the RDA model was tested by ANOVA, and the Monte Carlo permutation test was used to analyze the significance of the influencing factors of each explanatory variable in the RDA model (by the anova.cca and envfit functions in the vegan package of R software 4.0.0, permutations = 999), Plotting was done using the R 4.0.0 basic program package and the ‘ggplot2’ package.

3. Results and Analysis

3.1. Characteristics of Plant Community Structure and Soil Properties of Different Afforestation Types

The field survey results indicated that within the plant community quadrats of the Fanggan Ecological Restoration Area, there are a total of 22 species belonging to 19 genera and 17 families of woody plants, including nine species in eight genera and eight families of trees, and 12 species in 12 genera and 12 families of shrubs. The main tree species in the tree layer included P. davidiana, Robinia pseudoacacia, Morus alba, and Pinus. tabulaeformis; the main shrub species in the shrub layer included Vitex negundo var. heterophylla, Quercus acutissima, and Diospyros lotus. The dominant species were: coniferous forest—P. tabulaeformis, broad-leaved forest—Populus davidiana, and mixed forest—Robinia pseudoacacia.
The differences in soil physicochemical properties among different forest types indicated that establishing broad-leaved forests significantly increased soil pH and available potassium content (p < 0.05) compared to other forest types. Both mixed forests and broad-leaved forests can enhance soil available phosphorus content. Conversely, ammonium nitrogen content was significantly higher in coniferous forests and mixed forests than in broad-leaved forests (p < 0.05). The impact of different forest types on soil organic carbon content was not significant (Table 1).

3.2. Impact of Afforestation Types on Soil Bacterial Abundance and Diversity

3.2.1. Soil Bacterial Abundance Characteristics at the Phylum and Genus Levels

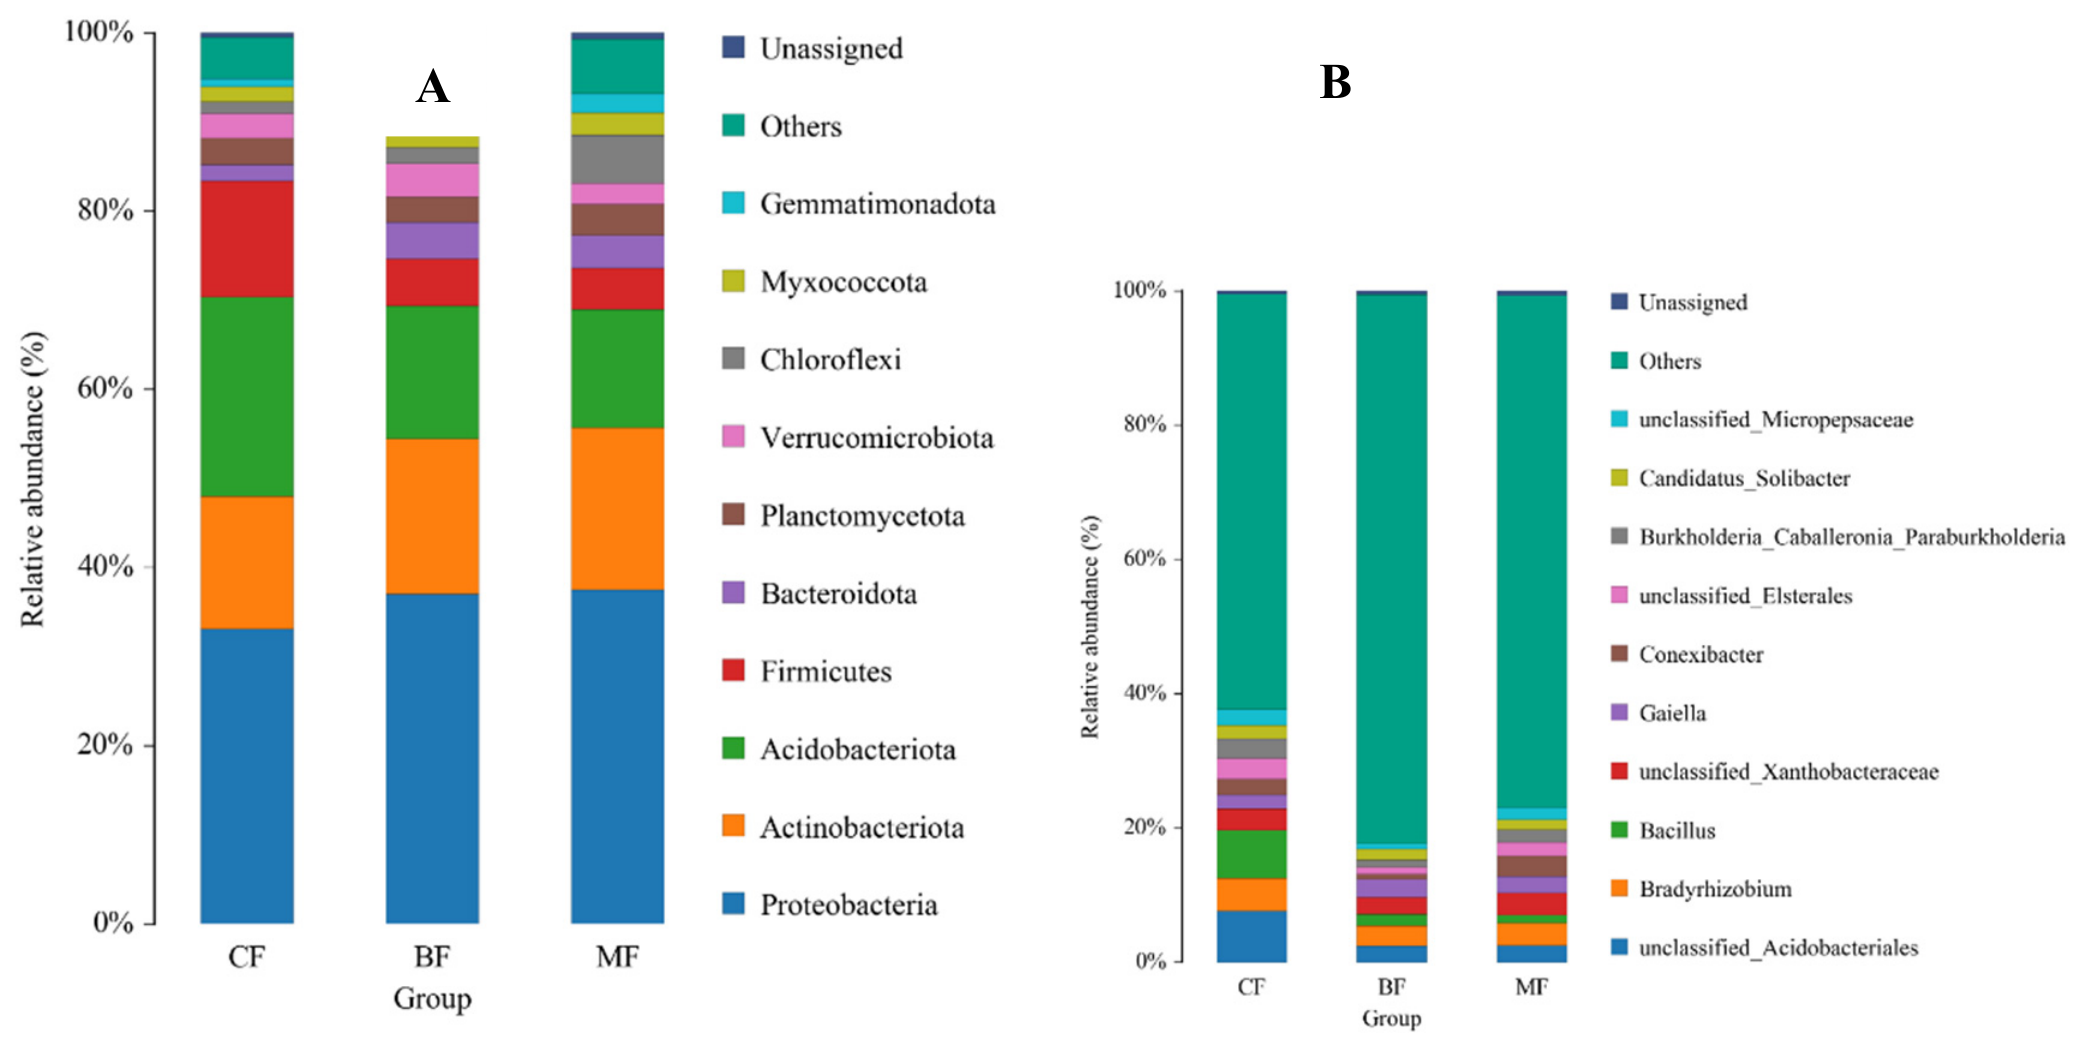
The effective CCS (Circular Consensus Sequencing) range obtained from sequencing was 41,123–65,181, and the sequence number range was 35,492–62,929. Each sample’s ASVs were annotated to a range of 27–34 phylum levels and 493–910 genus levels. At the phylum level, Proteobacteria, Actinobacteria, Acidobacteria and Firmicutes consisted of the four most abundant phyla in each forest stand, with Proteobacteria and Actinobacteria abundances significantly higher in broad-leaved forests and mixed forests compared to coniferous forests, while Acidobacteria and Firmicutes abundances were significantly higher in coniferous forests compared to other forest stands (Figure 1A). At the genus level, unclassified_Acidobacterales, Bradyrhizobium and Bacillus were the most abundant genera among soil bacteria, and their relative abundances were significantly higher in coniferous forests compared to the other forest stands (Figure 1B).

3.2.2. Alpha Diversity Characteristics

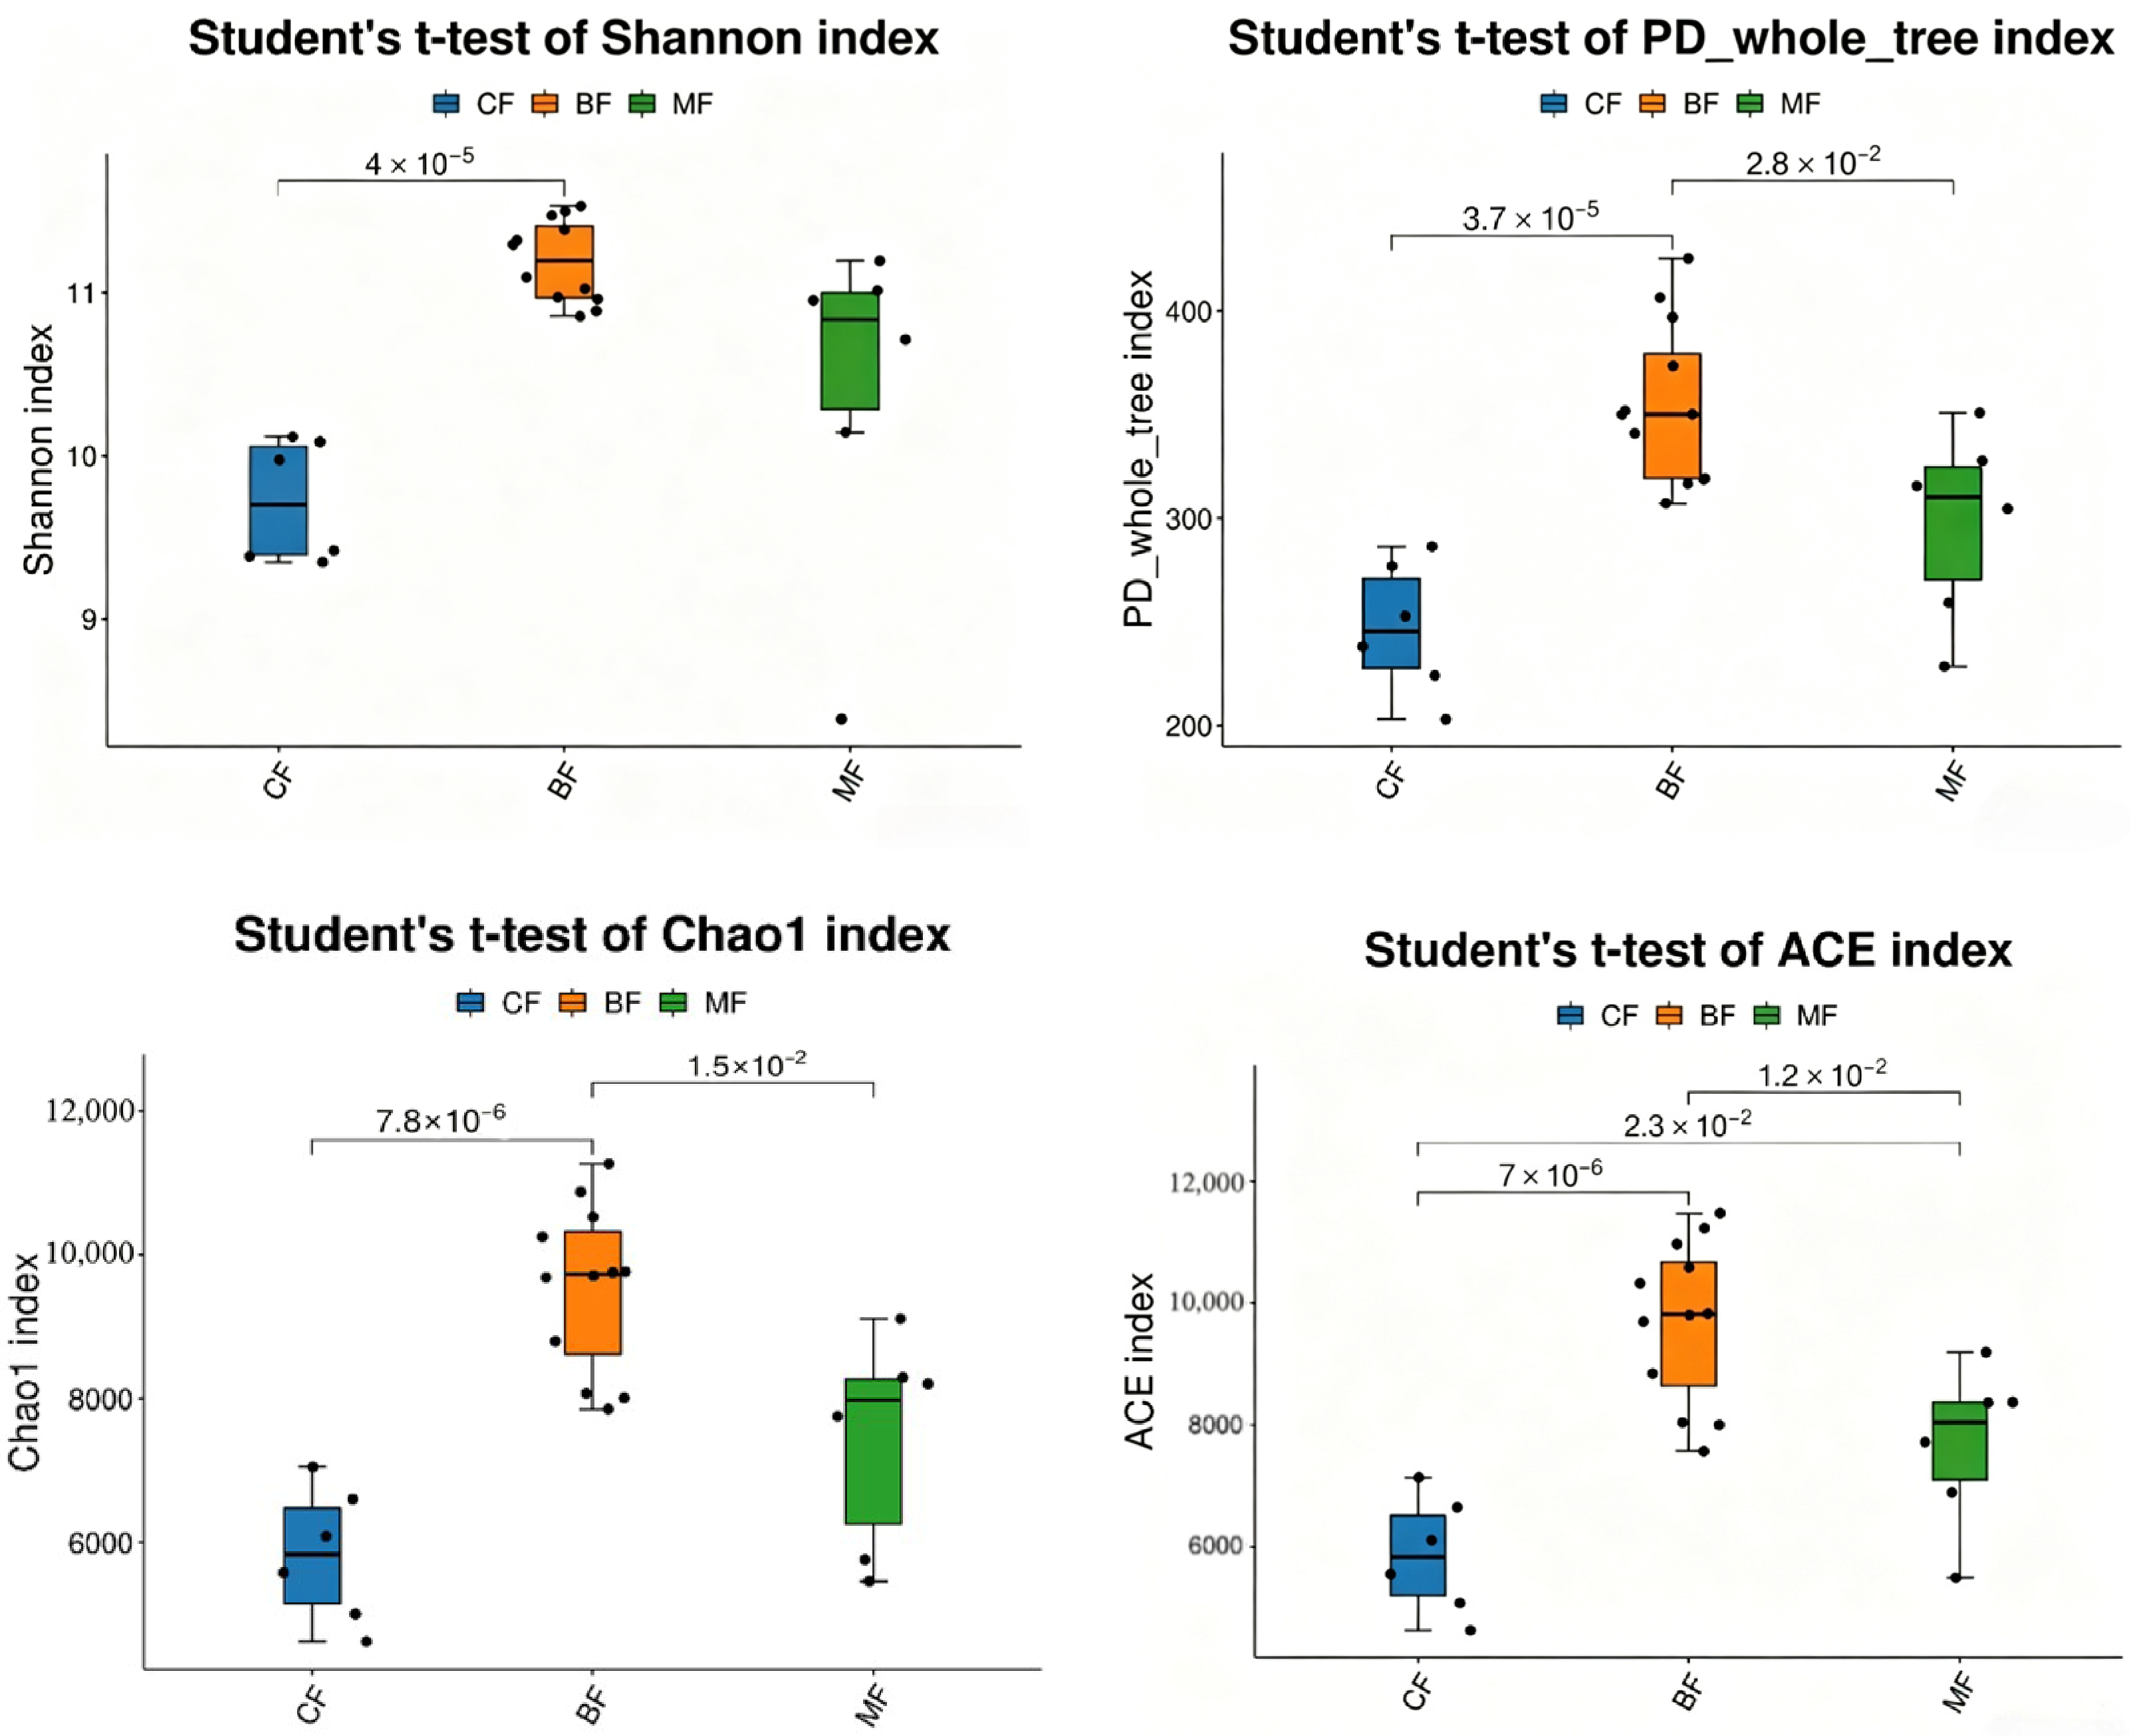
Soil bacterial α-diversity indices showed a trend of BF > MF > CF. Among them, the ACE index showed significant differences between each pair of forest types. The PD whole tree index and Chao1 index of broad-leaved forests were significantly higher than those of coniferous forests and mixed forests. The Shannon index only showed that broad-leaved forests were significantly higher than coniferous forests (Figure 2).

3.2.3. Community Structural (β-Diversity) Characteristics

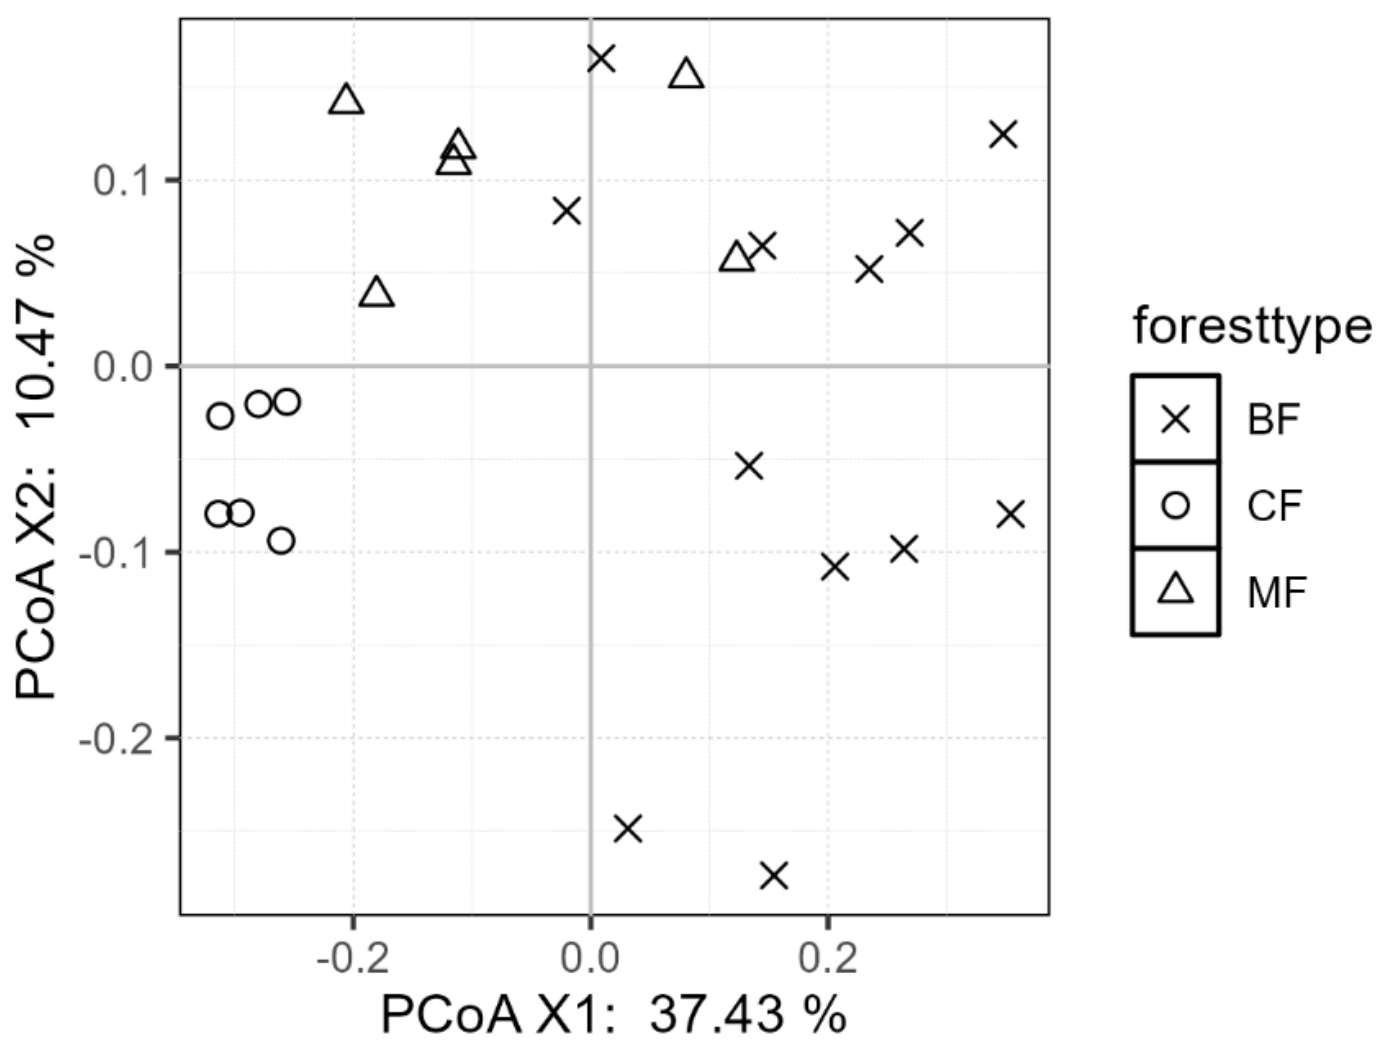
The community structure of soil bacteria at the genus level showed significant differences among the three types of forest stands and could reflect the characteristics of the forest stands. The first two axes of the PCoA plot explained 47.9% of the total variation. The coordinate points for coniferous forests and broad-leaved forests show clear differences along the PCoA1 axis, while the coordinate points for mixed forests are precisely located between those of coniferous and broad-leaved forests and intersect with both (Figure 3). The PERMANOVA test showed that the differences in community structure among all forest types and between any two were all significant (Table 2).

3.3. The Impact of Afforestation Types on Soil Bacterial Function

3.3.1. FAPROTAX-Predicted Functional Abundance of Soil Bacteria

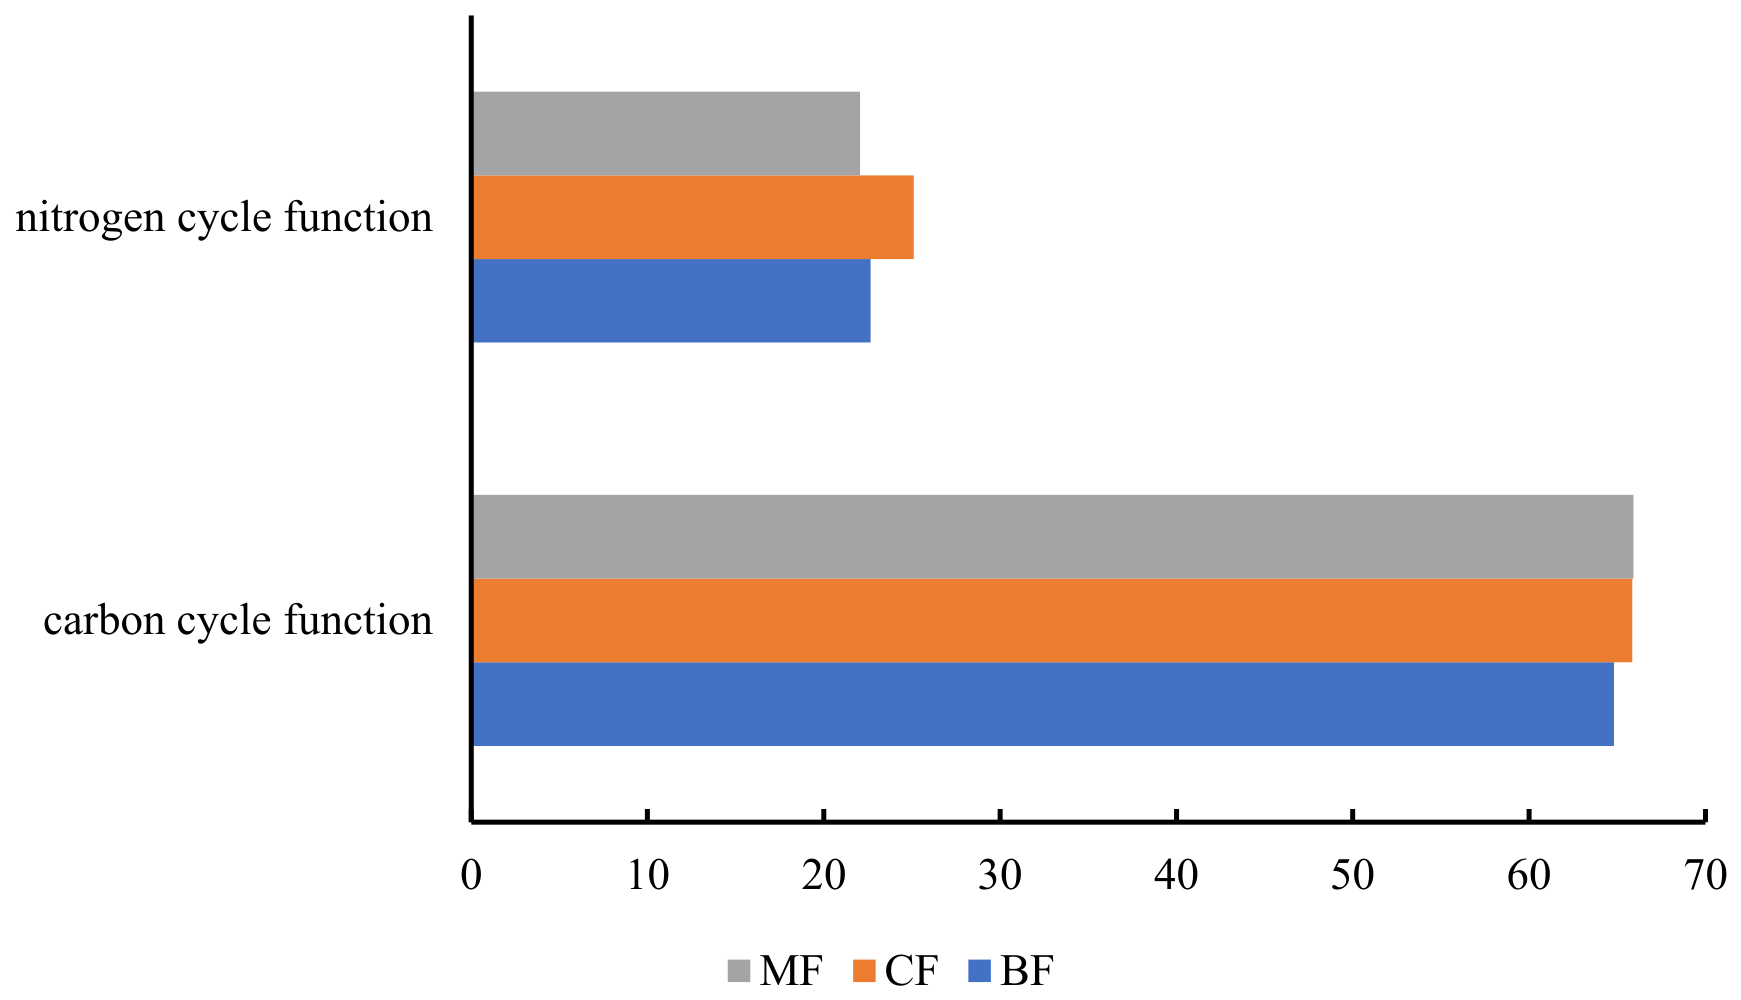
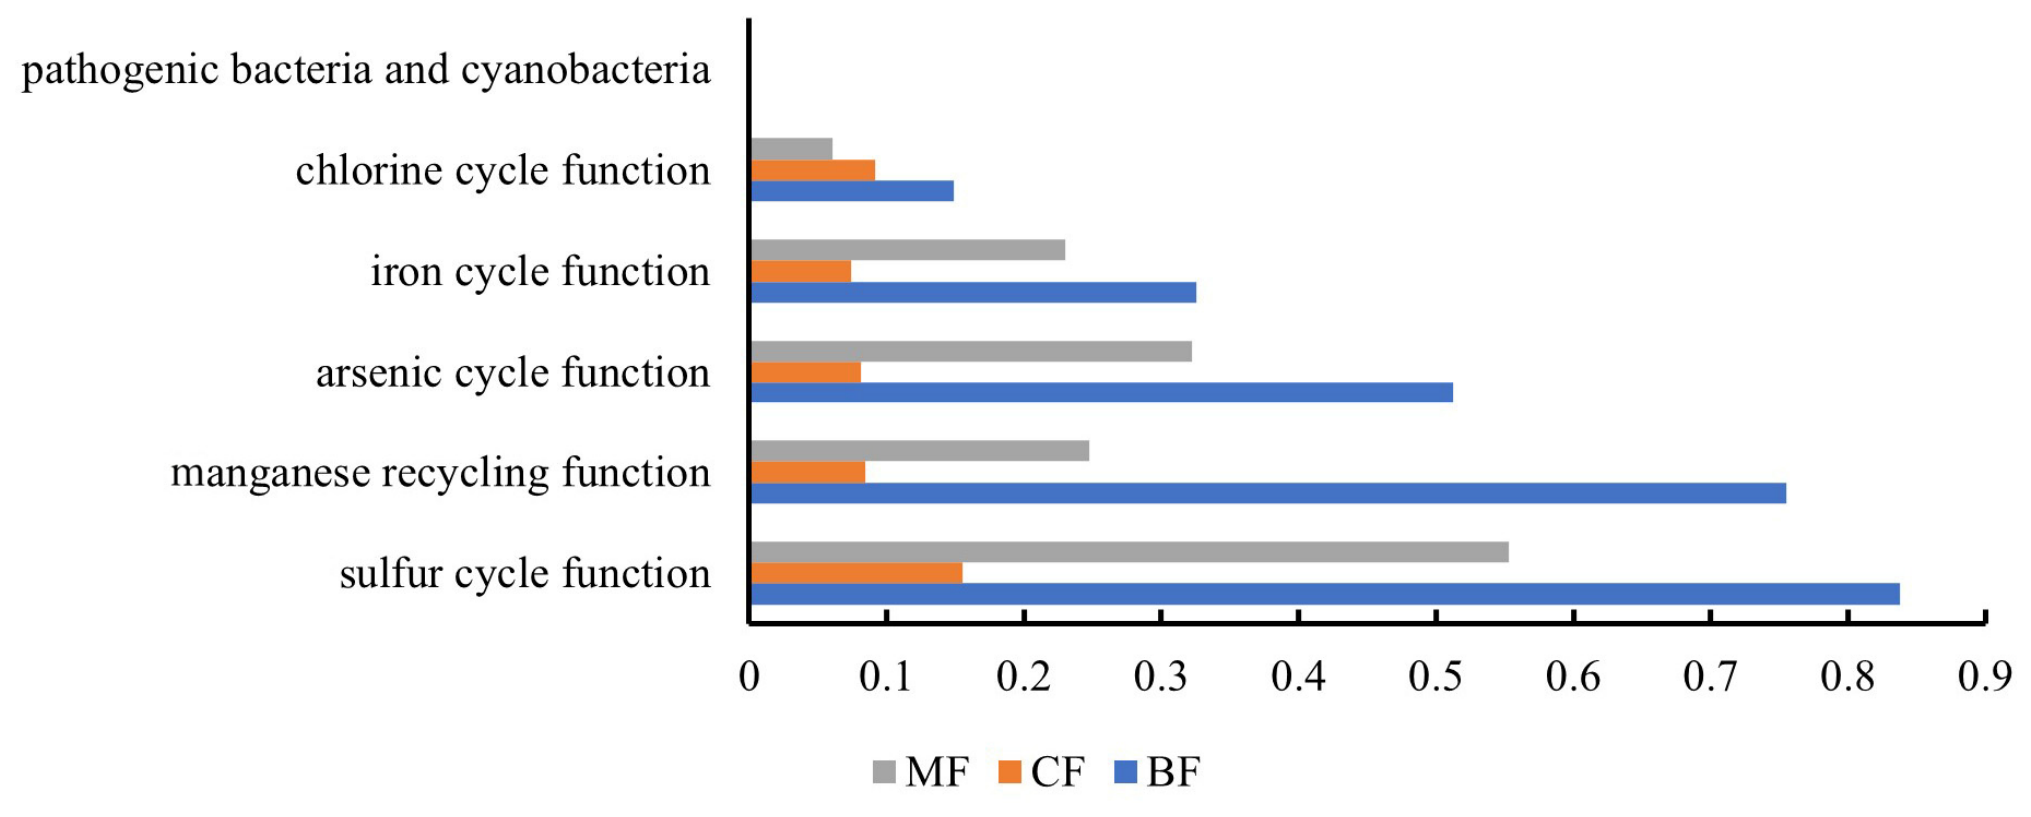
Overall, the functional abundance of the carbon cycle was the highest, with mixed forests and coniferous forests slightly higher than broad-leaved forests but without significant differences. The functional abundance of the nitrogen cycle was lower than that of the carbon cycle and was the highest in coniferous forests (Figure 4). The functional abundance of other element metabolism was much lower than that of carbon and nitrogen metabolism, and the abundance of various other element metabolism functions in broad-leaved forests was higher than that in mixed forests, which, in turn, was significantly higher than in coniferous forests (Figure 5). Among them, there was a significant difference in the functional abundance of the sulfur cycle between coniferous forests and broad-leaved forests (p < 0.05) and a significant difference in the functional abundance of the manganese cycle among various forest types (p < 0.05). The significance of differences in functional abundance among stands is shown in Table 3.
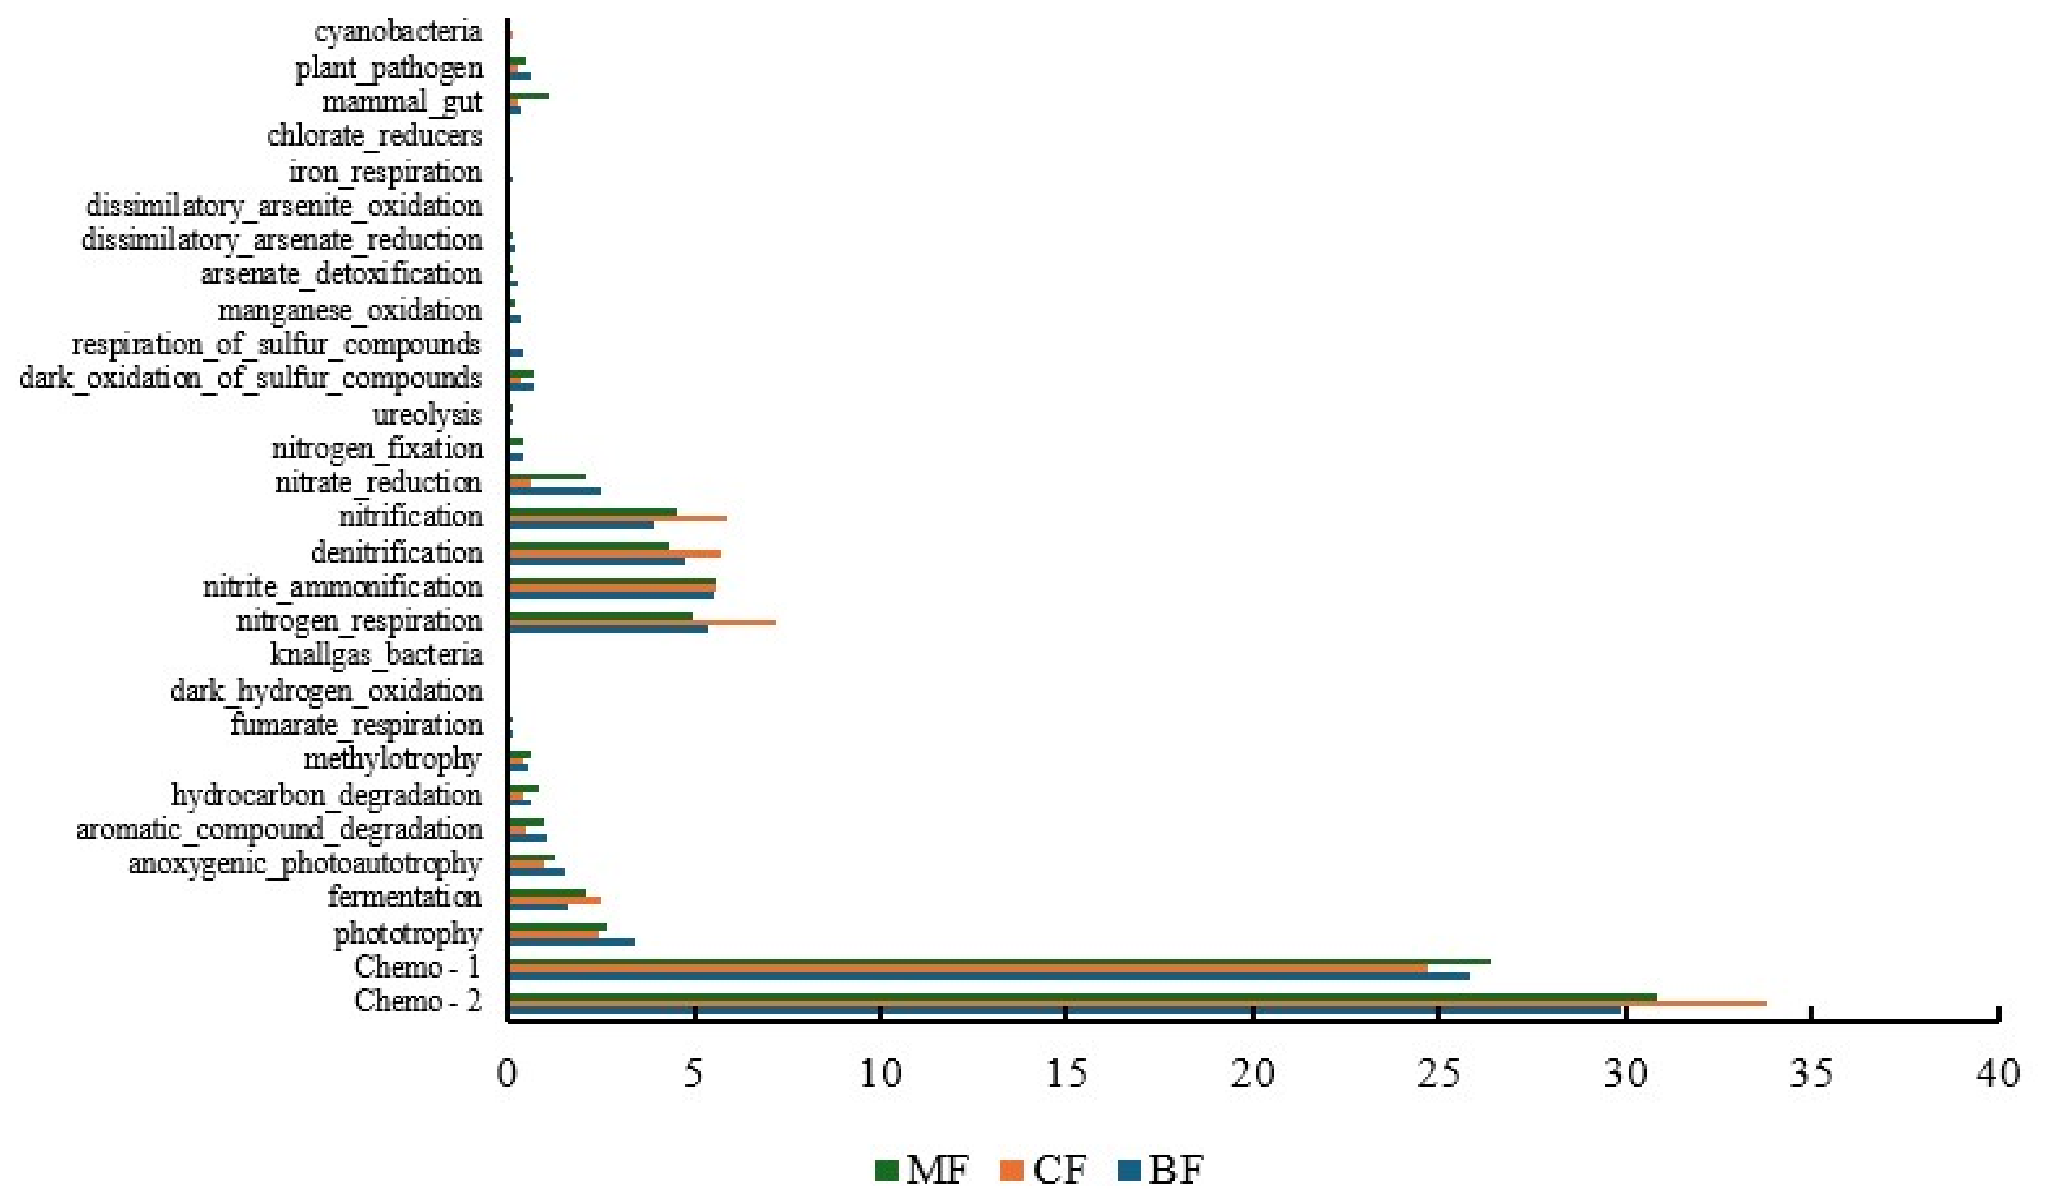
In the carbon cycle functions, the abundance of Chemo-2 and Chemo-1 groups was the highest and significantly higher than that of other functional groups. The abundance of the Chemo-2 group was the highest in coniferous forests, while the abundance of the Chemo-1 group was the lowest in coniferous forests. The abundance of phototrophic functions and fermentation functions showed opposite differences among forest stands, with the former being highest in broad-leaved forests and lowest in coniferous forests. The overall abundance of various subfunctions in the nitrogen cycle was similar, and the abundance of nitrate respiration, nitrite ammonification, denitrification, and nitrification functions was the highest in coniferous forests, while the abundance of nitrate degradation, nitrogen fixation, and urea decomposition functions was the lowest in coniferous forests. Additionally, human pathogens and plant pathogens also occupied certain abundances in each forest stand (Figure 6). The significance of differences in functional abundance among stands is also shown in Table 3.

3.3.2. FAPROTAX-Predicted Functional Structure Features

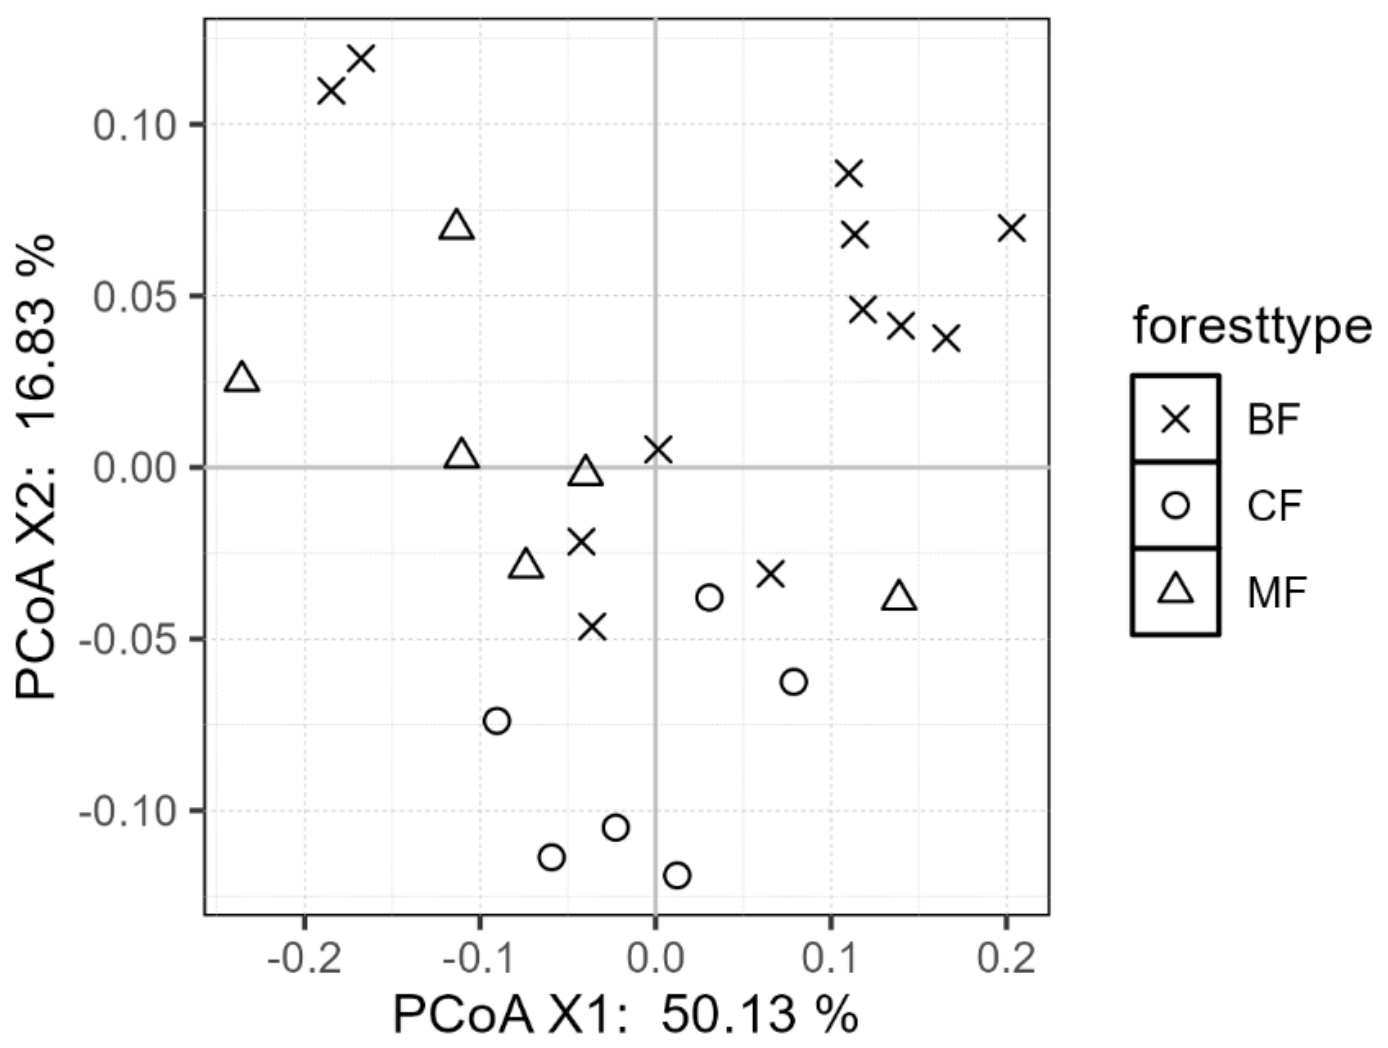
The predicted functional structure of soil bacteria by FAPROTAX did not show significant differences among the three forest types. The first two axes of the PCoA two-dimensional plot explained 66.76% of the total variation. The coordinates of the three forest types mainly showed some differentiation on the second axis of the PCoA, with values gradually increasing from coniferous forests to mixed forests and then to broad-leaved forests. The range of coordinate points for each forest type indicates that the predicted functional structure gradually diverges as the proportion of broad-leaved trees within the community increases, suggesting an increase in the degree of community structure variation (Figure 7). The PERMANOVA test showed that the differences in predicted functional structure predicted by Faprotax between the overall stand and between any two stands did not reach a significant level (Table 3).

3.3.3. Environmental Driving Mechanisms of Faprotax-Predicted Functional Structure

  • Correlation between Environmental factors and FAPROTAX-predicted functional abundance.
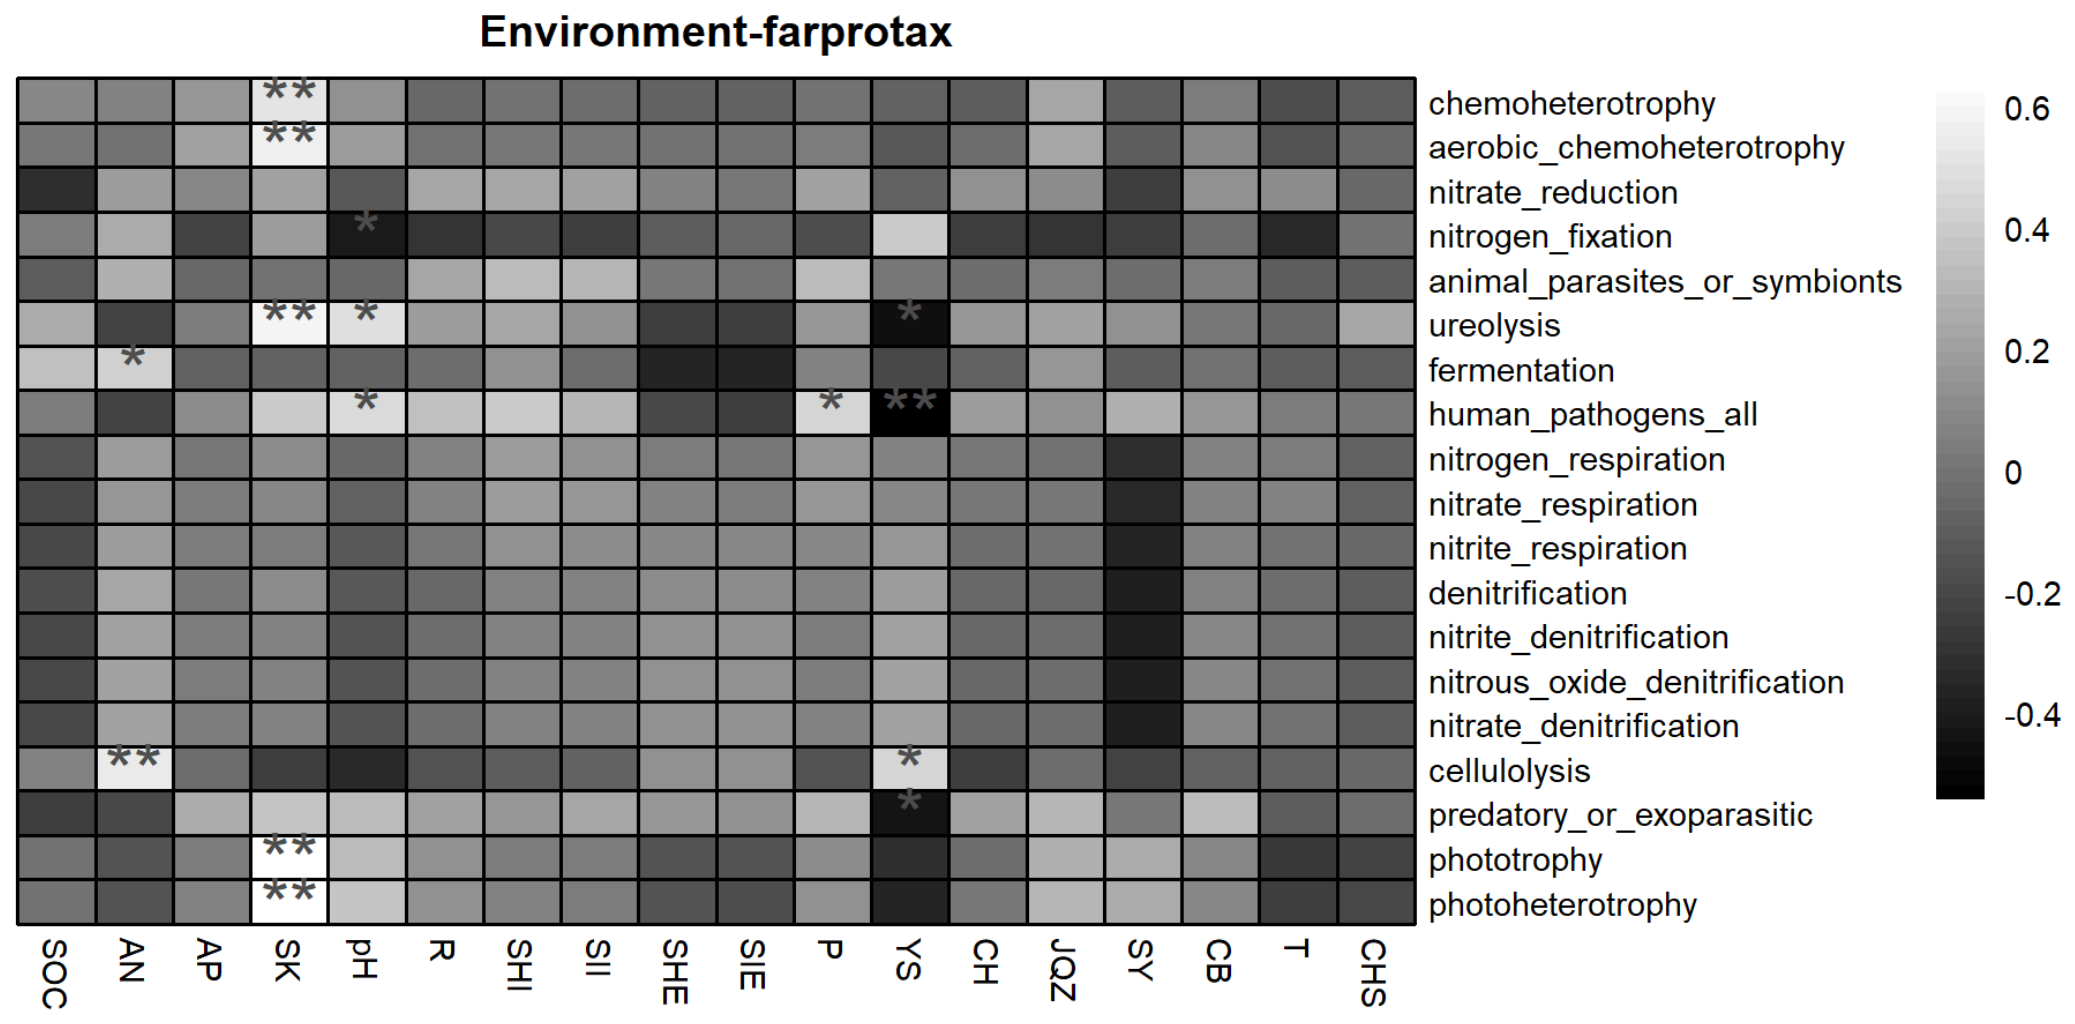
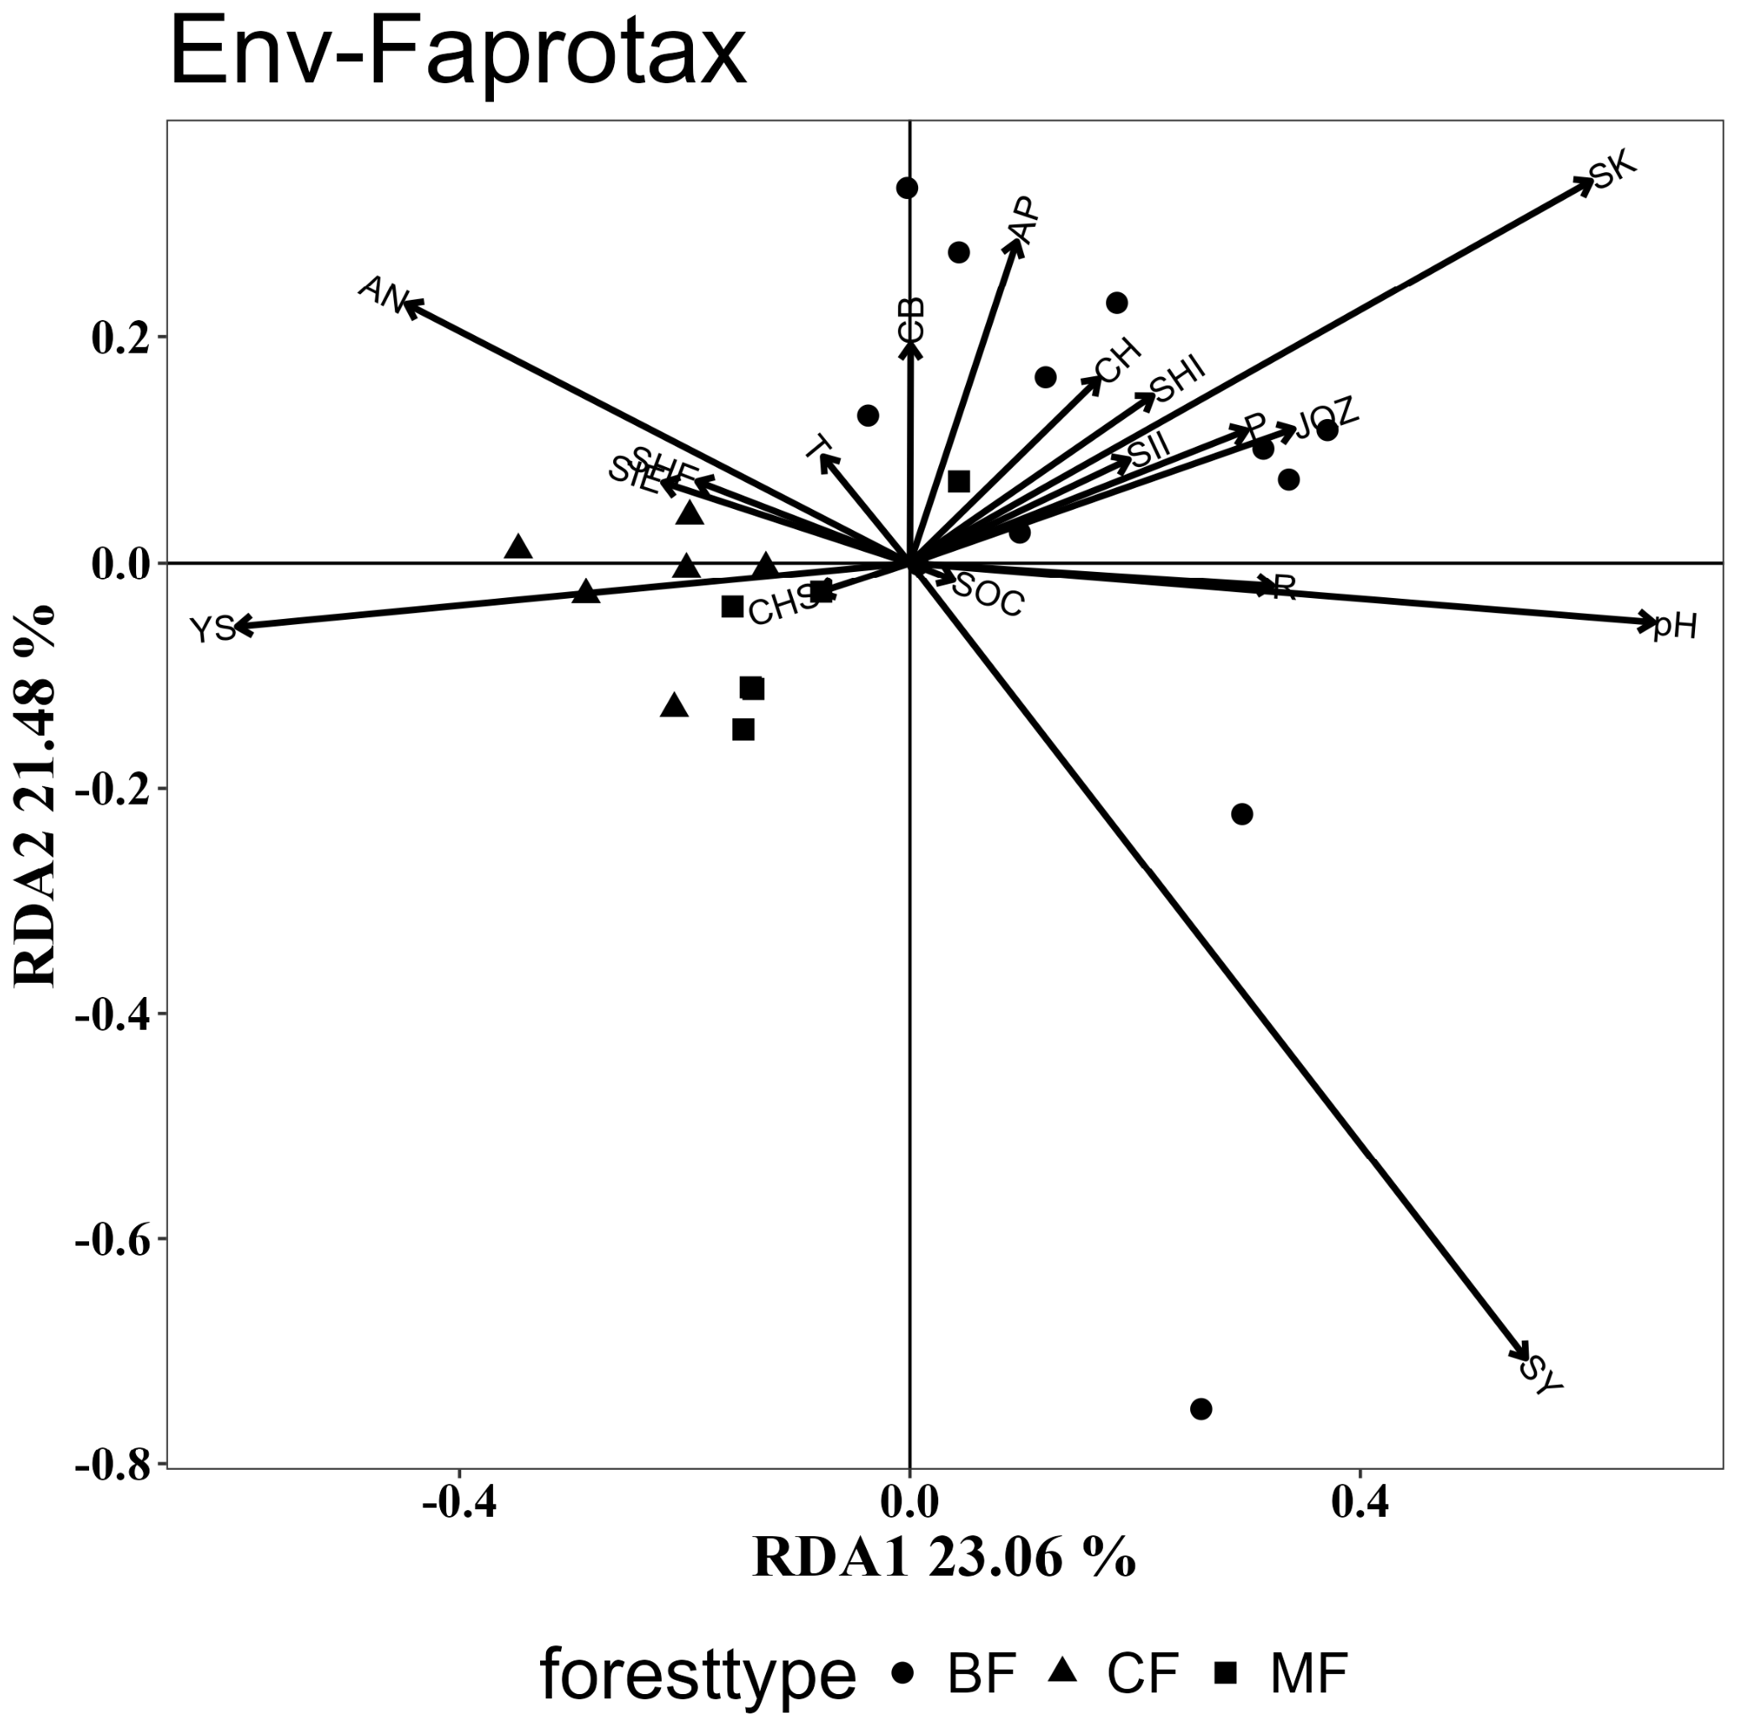
Soil physicochemical property indicators were most highly correlated with FAPROTAX functional abundance. The content of SK was significantly positively correlated with several FAPROTAX functional categories, including chemoheterotrophy, aerobic chemoheterotrophy, ureolysis, phototrophy and photoheterotrophy. Additionally, the contents of NH4+-N and pH were significantly correlated with the abundance of some functional categories. The content of ammonium nitrogen was significantly positively correlated with ureolysis, consistent with ammonia being a product of urea decomposition. Plant diversity was not significantly correlated with the abundance of various FAPROTAX functional categories. In terms of species composition, P. tabulaeformis showed a significant negative correlation with ureolysis, human pathogens and predatory or exoparasitic (Figure 8).
  • RDA of environmental factors on the Faprotax-predicted functional structure.
The redundancy analysis (RDA) of the soil bacterial Faprotax-predicted functional structure predicted by FAPROTAX and environmental factors showed that the overall model explained a significant level (p = 0.013), with the RDA1 and RDA2 axes explaining 23.06% and 21.48% of the variation in the Faprotax-predicted functional structure, respectively. From coniferous forests (CFs) to mixed forests (MFs) and then to broad-leaved forests (BFs), the sample coordinates exhibited a trend of moving from the negative axis to the positive axis of RDA1, indicating that forest type is a key factor driving the differentiation of the soil bacterial Faprotax-predicted functional structure. Environmental factors with a strong influence on the Faprotax-predicted functional structure included available potassium (SK), ammonium nitrogen (AN) content, and pH value, as well as the importance value of Populus davidiana (SY) and Pinus tabulaeformis (YS). Among these, the increase in available potassium content, pH value, and importance value of Populus davidiana was consistent with the Faprotax-predicted functional structure change trend corresponding to coniferous forest→mixed forest→broad-leaved forest, whereas the increase in ammonium nitrogen content and importance value of Pinus tabulaeformis was opposite to the Faprotax-predicted functional structure change trend under this forest sequence (Figure 9). The Monte Carlo test results indicated that the explanatory power of the Pinus tabulaeformis importance value, Populus davidiana importance value, available potassium content, and pH for the Faprotax-predicted functional structure all reached a significant level (p < 0.05) (Table 4).

3.4. Impact of Afforestation Types on Soil Bacterial Networks

3.4.1. Differences in Topological Parameters Between Taxonomic and Functional Networks Across Afforestation Types

Null model verification confirmed that the clustering coefficient and average path length significantly departed from random expectation in most networks. Diagrams of taxonomic network structure and functional network structure are shown in Figure S2. Network analysis indicated that the number of nodes and edges in both taxonomic networks and functional networks showed a trend of broad-leaved forests and mixed forests more than coniferous forests. Both network structures were dominated by positive correlation edges, with the proportion of positive correlation edges in the functional network significantly higher than that in the taxonomic network. The proportion of positive correlation edges in mixed forests and broad-leaved forests was notably higher than in coniferous forests (Table 5, Figure S2).
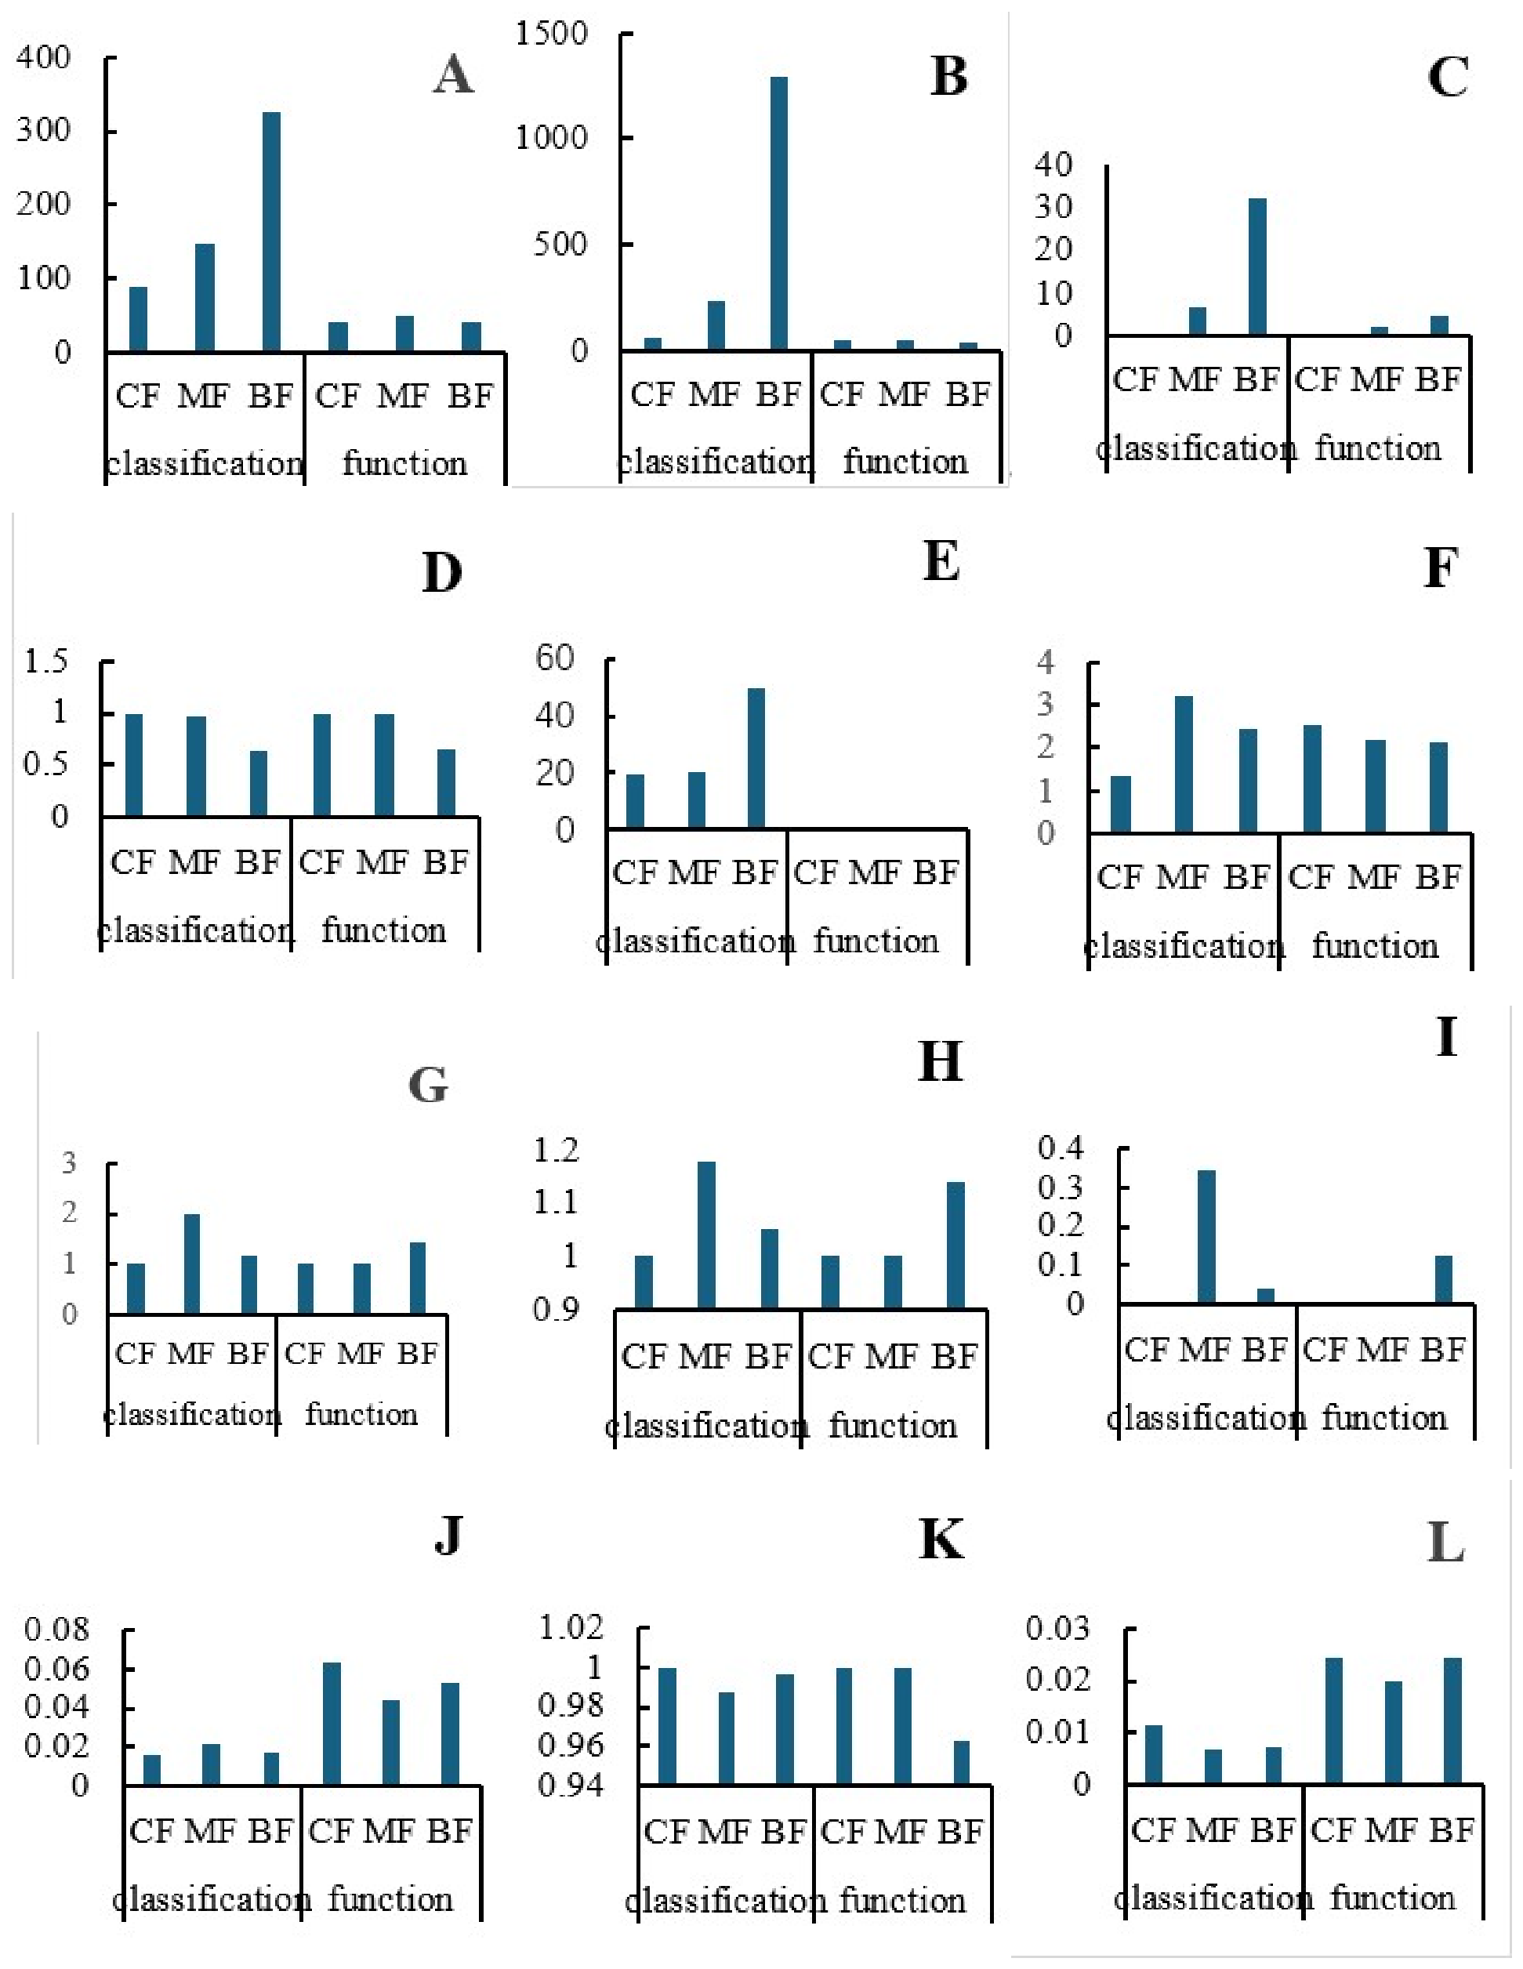
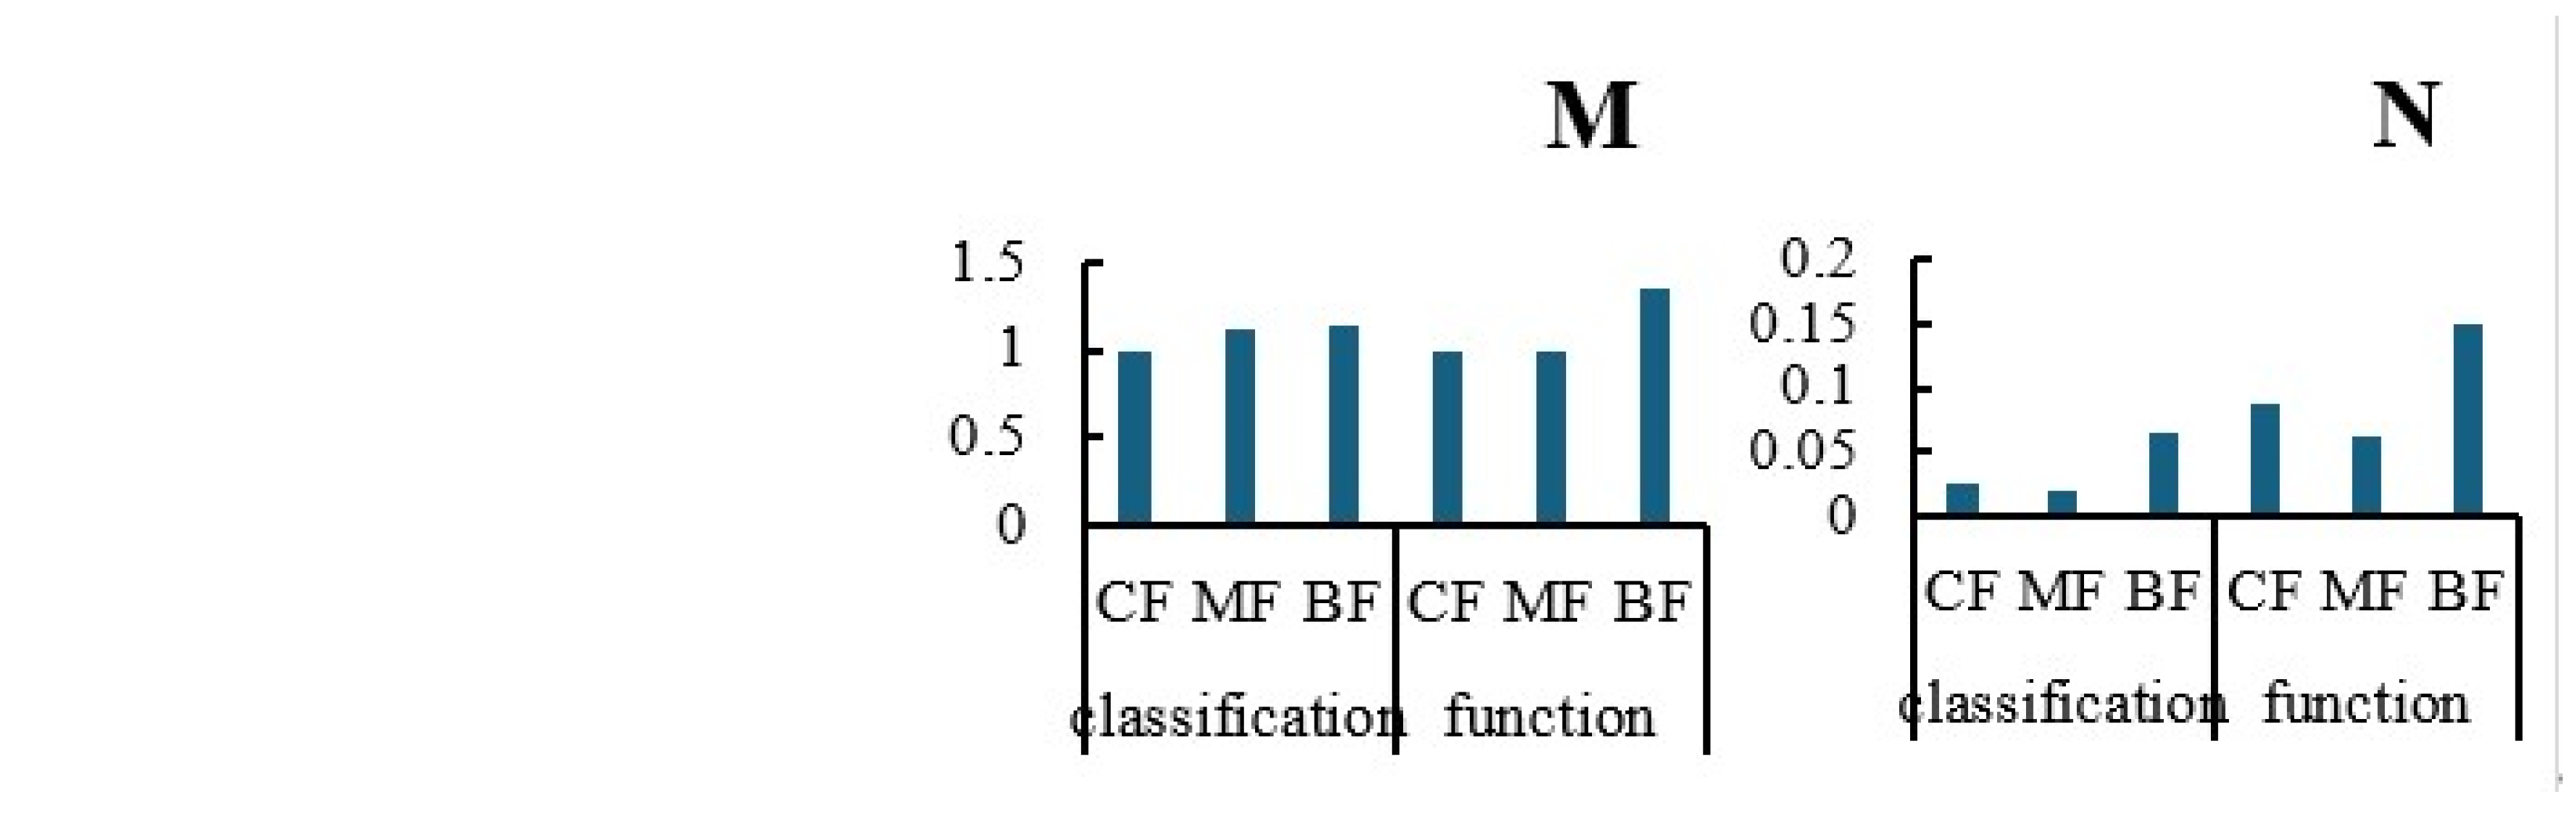
The results indicate that in classification networks, the number of nodes (Figure 10A), edges (Figure 10B), triangles (Figure 10C), closeness centrality (Figure 10D), and component number (Figure 10E) exhibited an increasing trend from CFs to MFs to BFs; weighted degree (Figure 10F), network diameter (Figure 10G), average path length (Figure 10H), betweenness centrality (Figure 10I), and graph density (Figure 10J) display peak characteristics in mixed forests, whereas the average clustering coefficient (Figure 10K) and page rank (Figure 10L) showed the opposite, with low peak characteristics in mixed forests. In functional networks, network diameter (Figure 10G), average path length (Figure 10H), number of triangles (Figure 10C), betweenness centrality (Figure 10I), and eccentricity (Figure 10M) exhibited an increasing trend from CFs to MFs to BFs; weighted degree (Figure 10F), closeness centrality (Figure 10D), and component number (Figure 10E) showed a decreasing trend from CFs to MFs to BFs; and the number of nodes (Figure 10A) and edges (Figure 10B) reached peak values in mixed forests, while hub (Figure 10N) count and graph density (Figure 10J) reached low peak values in mixed forests. When comparing the two network structures, the number of triangles and eccentricity both exhibited an increasing trend from CFs to MFs to BFs in both classification and functional networks. Hub count also showed a first-decrease-then-increase trend, with the lowest value in mixed forests and the highest value in coniferous forests in both network types. In the two network structures, component number and graph density showed completely opposite trends of change.
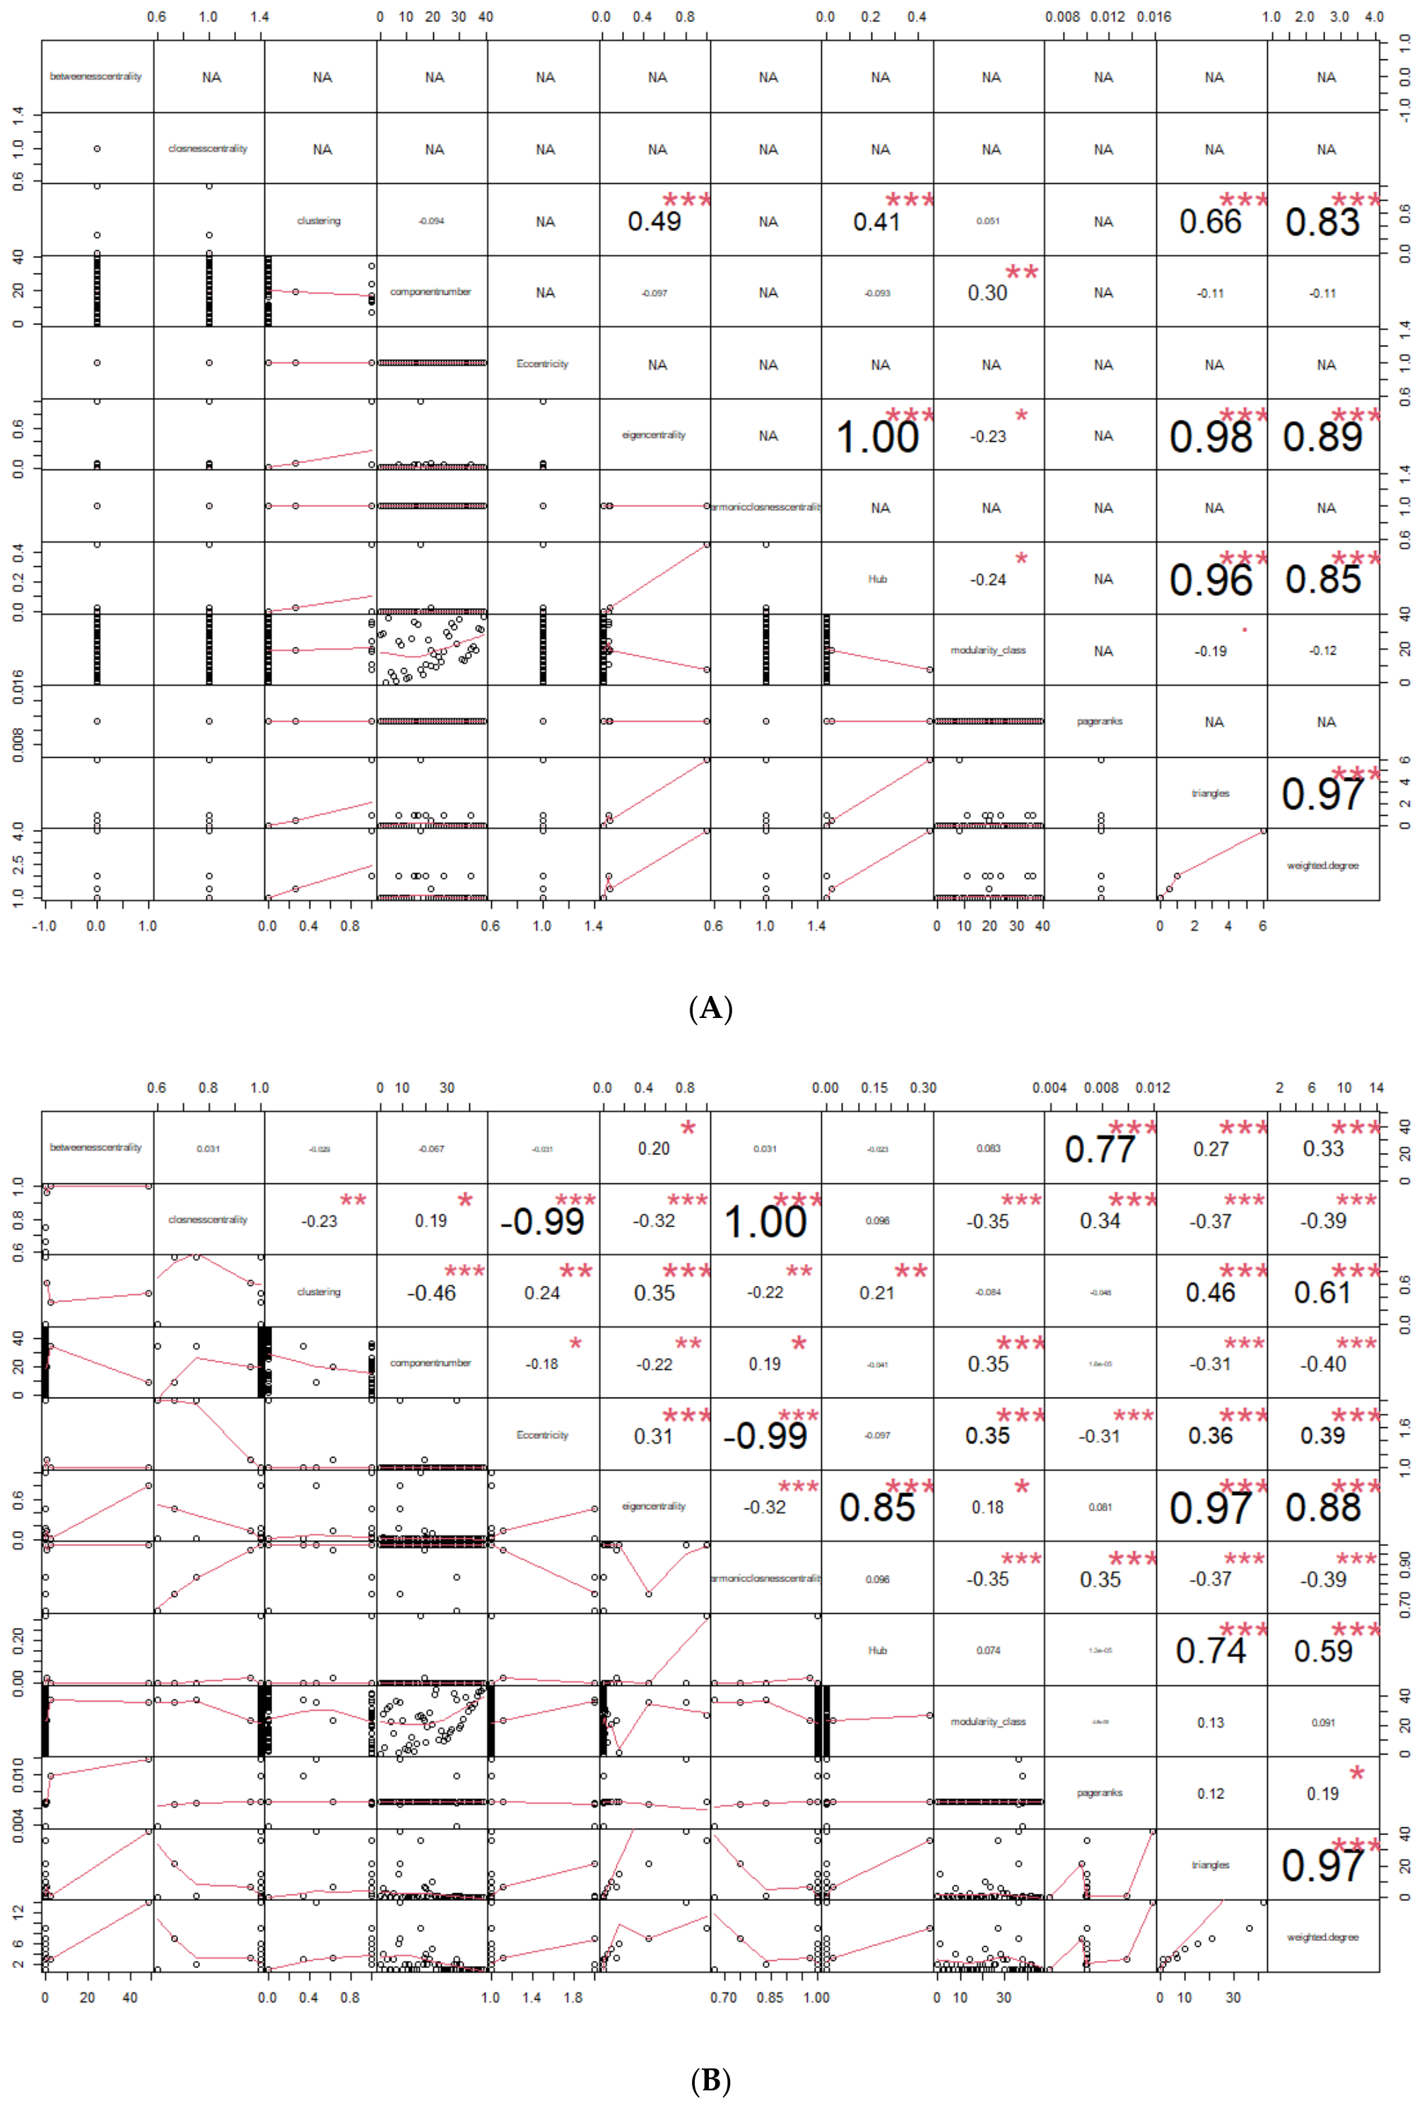
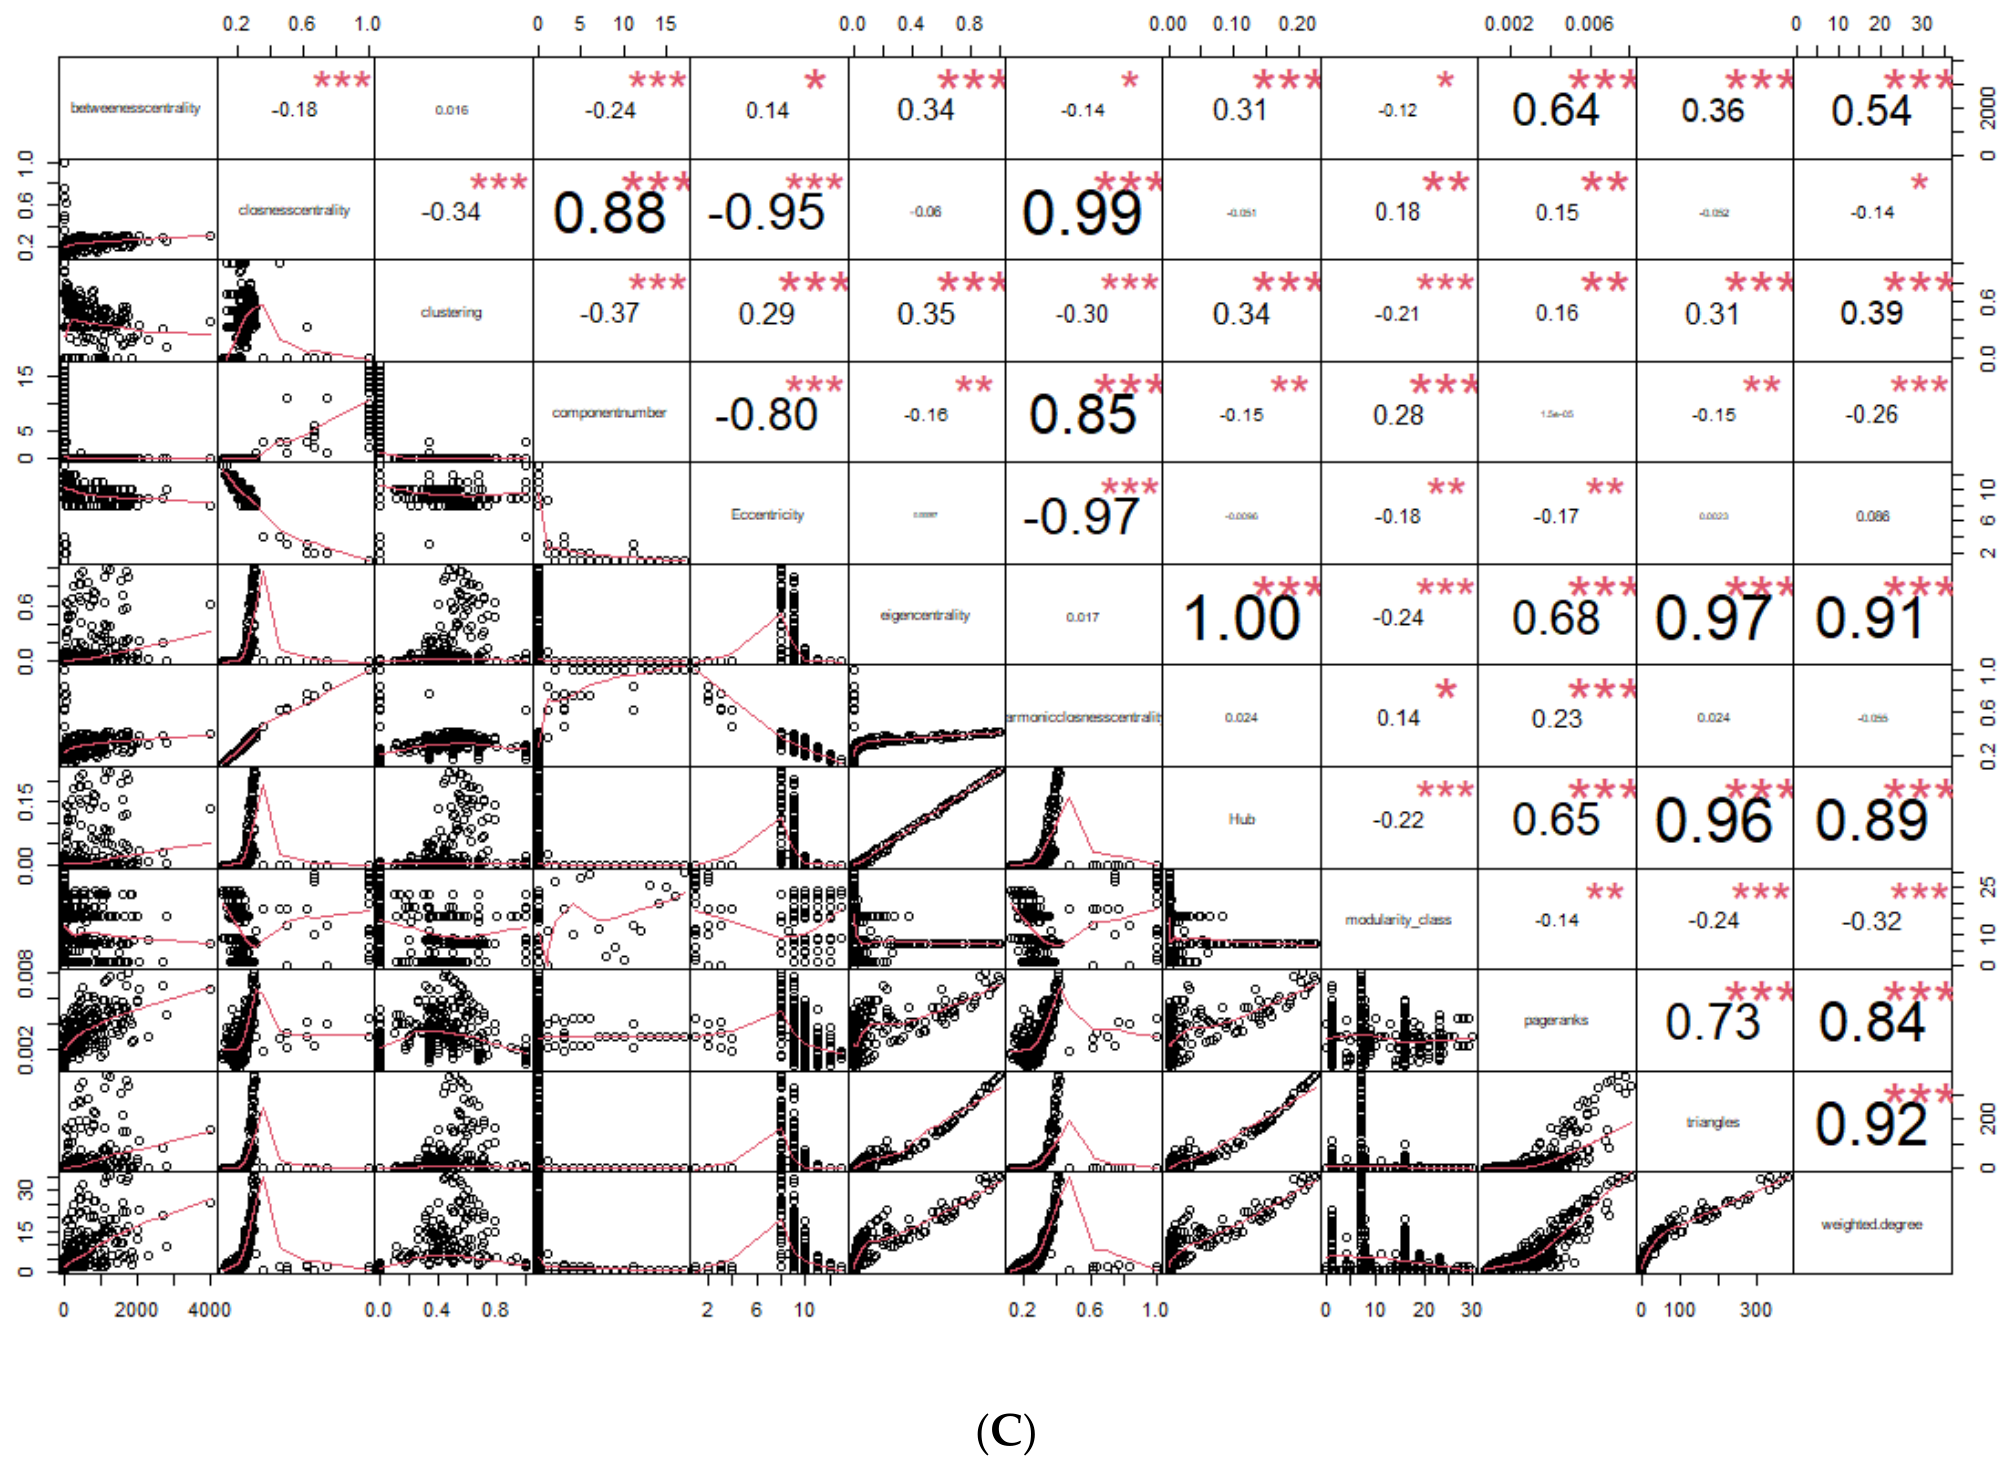
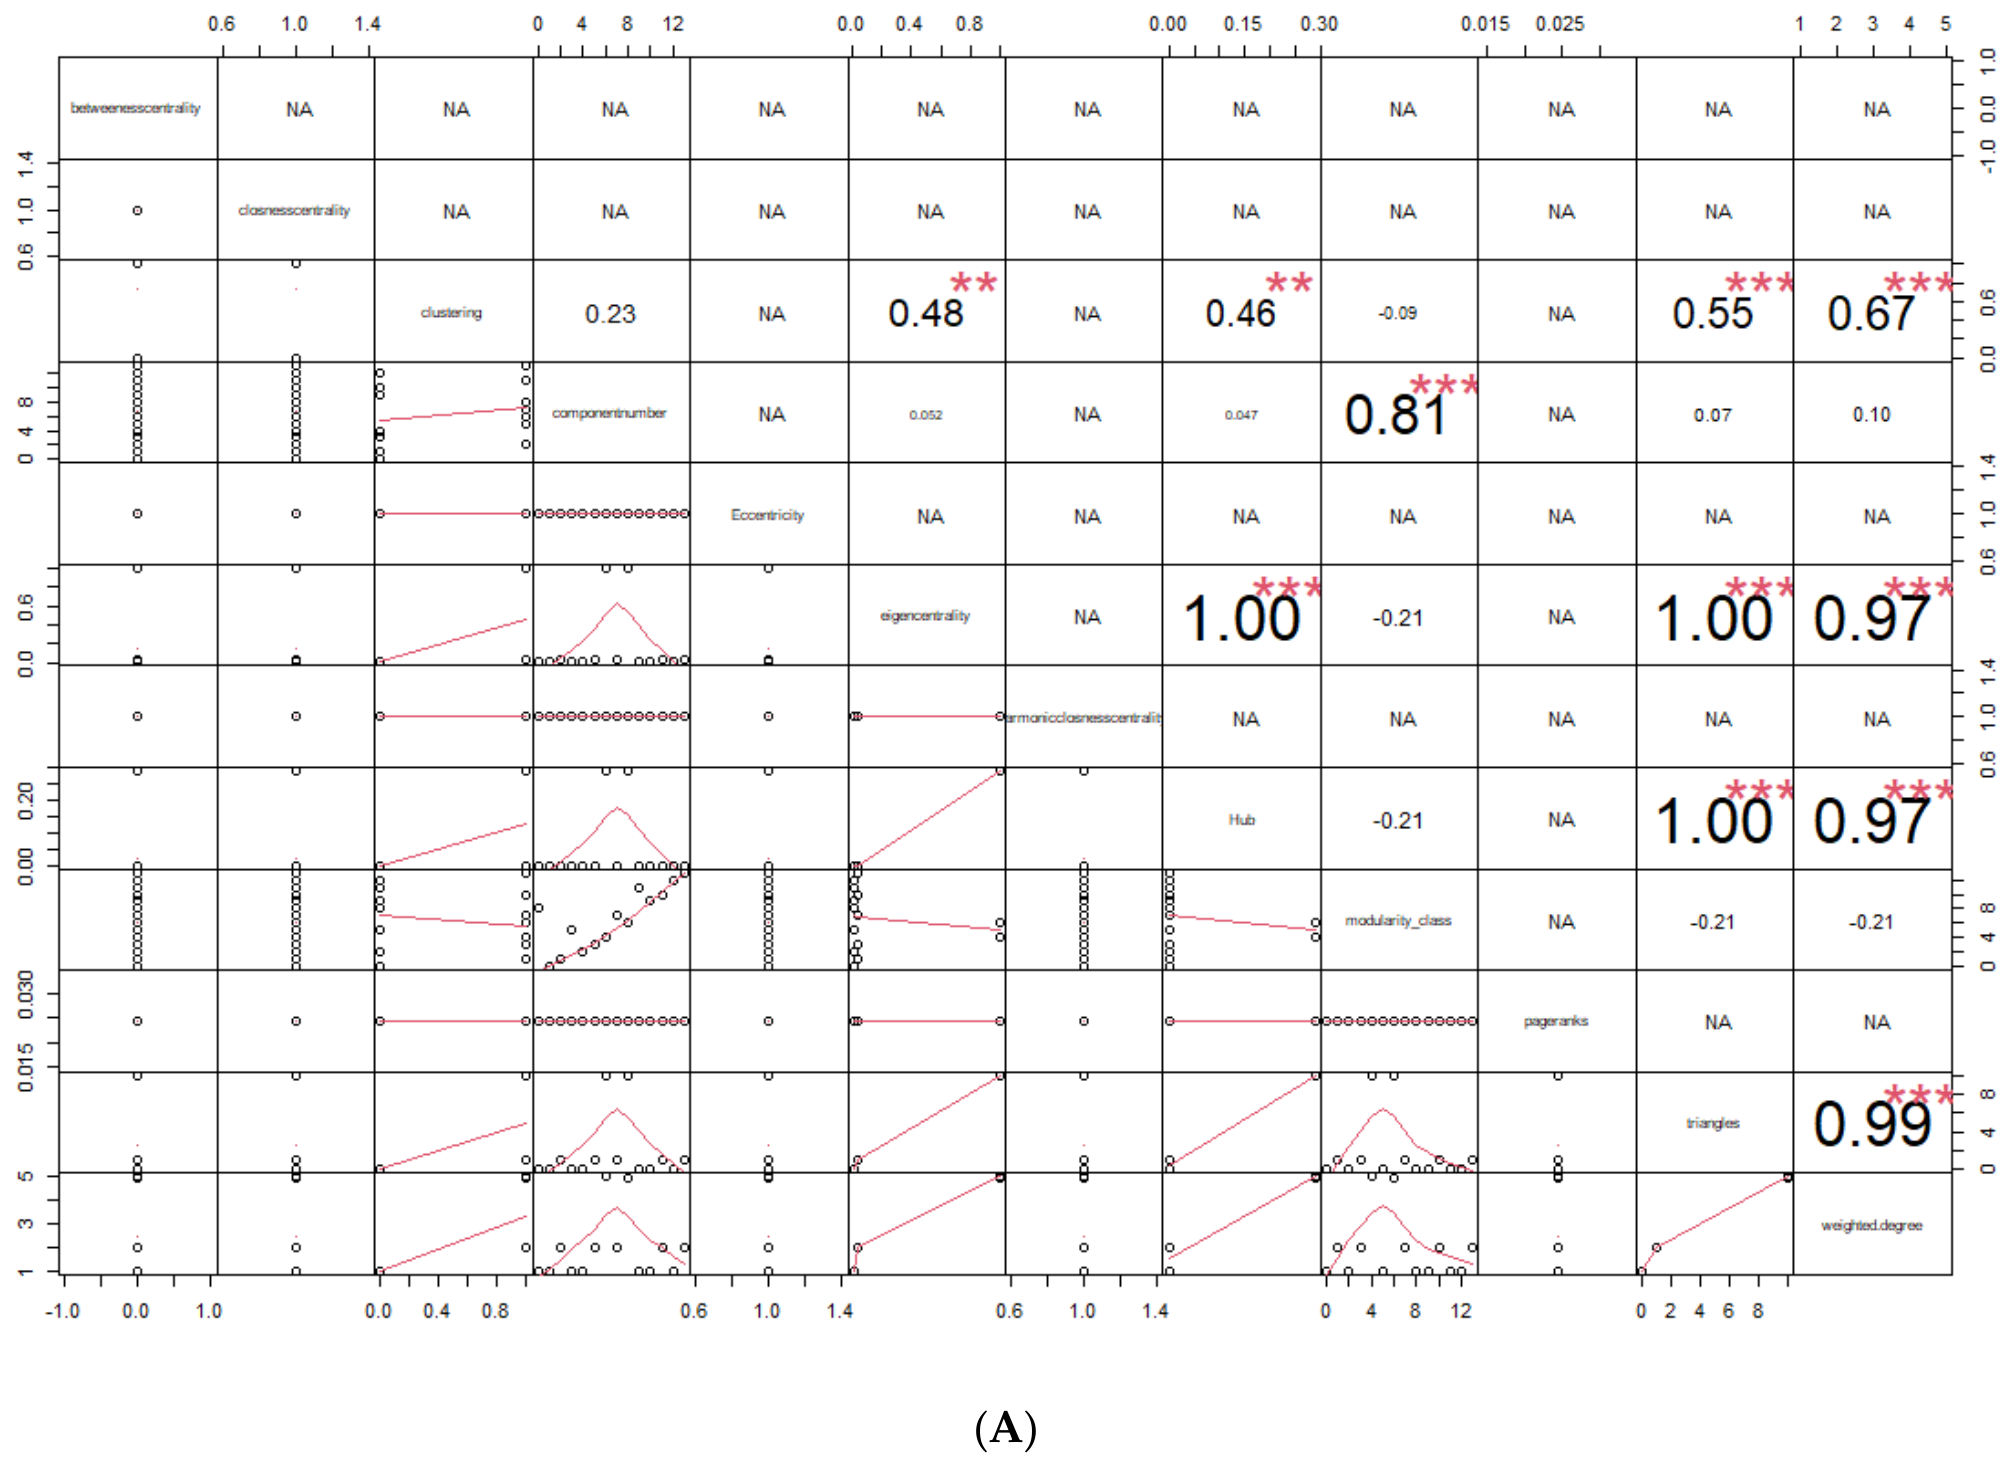
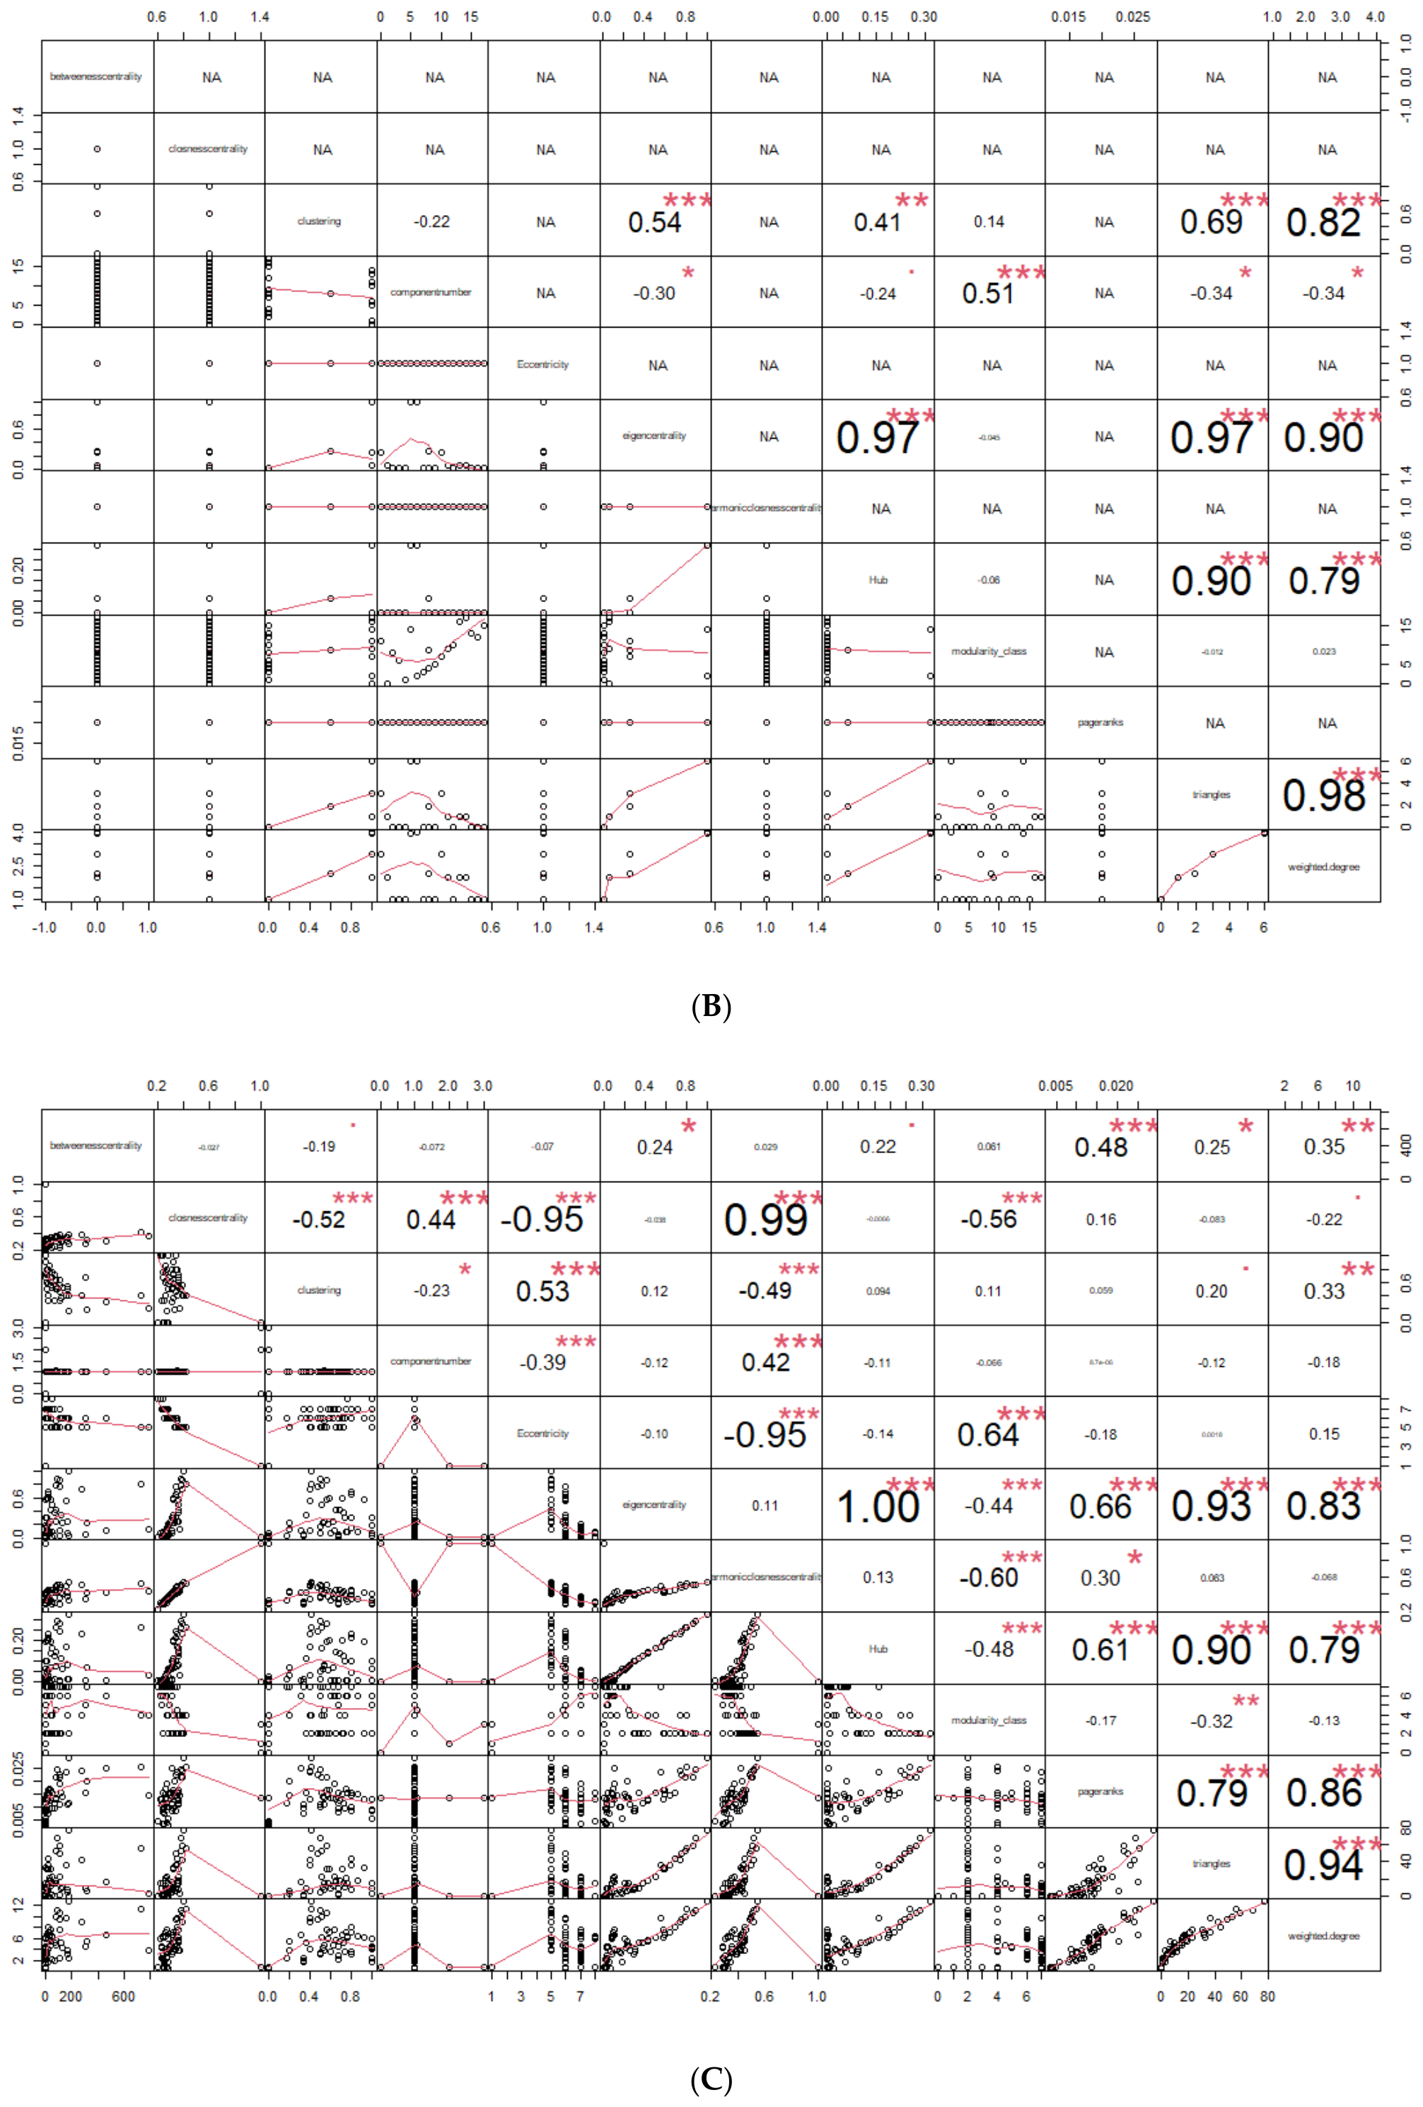
Taxonomic network structure topology parameters often exhibited significant and high-level positive correlations, and the number of significantly correlated indicators showed a trend of broad-leaved forest > mixed forest > coniferous forest (Figure 11A–C). Notably, in mixed forests and broad-leaved forests, eccentricity showed a highly significant negative correlation with closeness centrality (Figure 11B,C). From coniferous forests to mixed forests and then to broad-leaved forests, the correlation between clustering coefficient and eigenvector centrality, triadic closure structure, and weighted degree decreased appreciably, and the correlation between component number and harmonic closeness centrality, as well as between PageRank and triadic closure structure and weighted degree, increased appreciably (Figure 11A–C). The degree of correlation among functional network topological parameters was lower than that of the taxonomic network (Figure 12), particularly evident in mixed forests and broad-leaved forests (Figure 12B,C), with almost no negative correlations. From coniferous forests to mixed forests and then to broad-leaved forests, the correlation between the number of hubs and clustering coefficient and weighted degree, as well as between component number and modularity index, decreased, and the correlation between clustering coefficient and eigenvector centrality increased appreciably (Figure 12A–C).

3.4.2. Differences in Key Nodes Between Taxonomic and Functional Networks

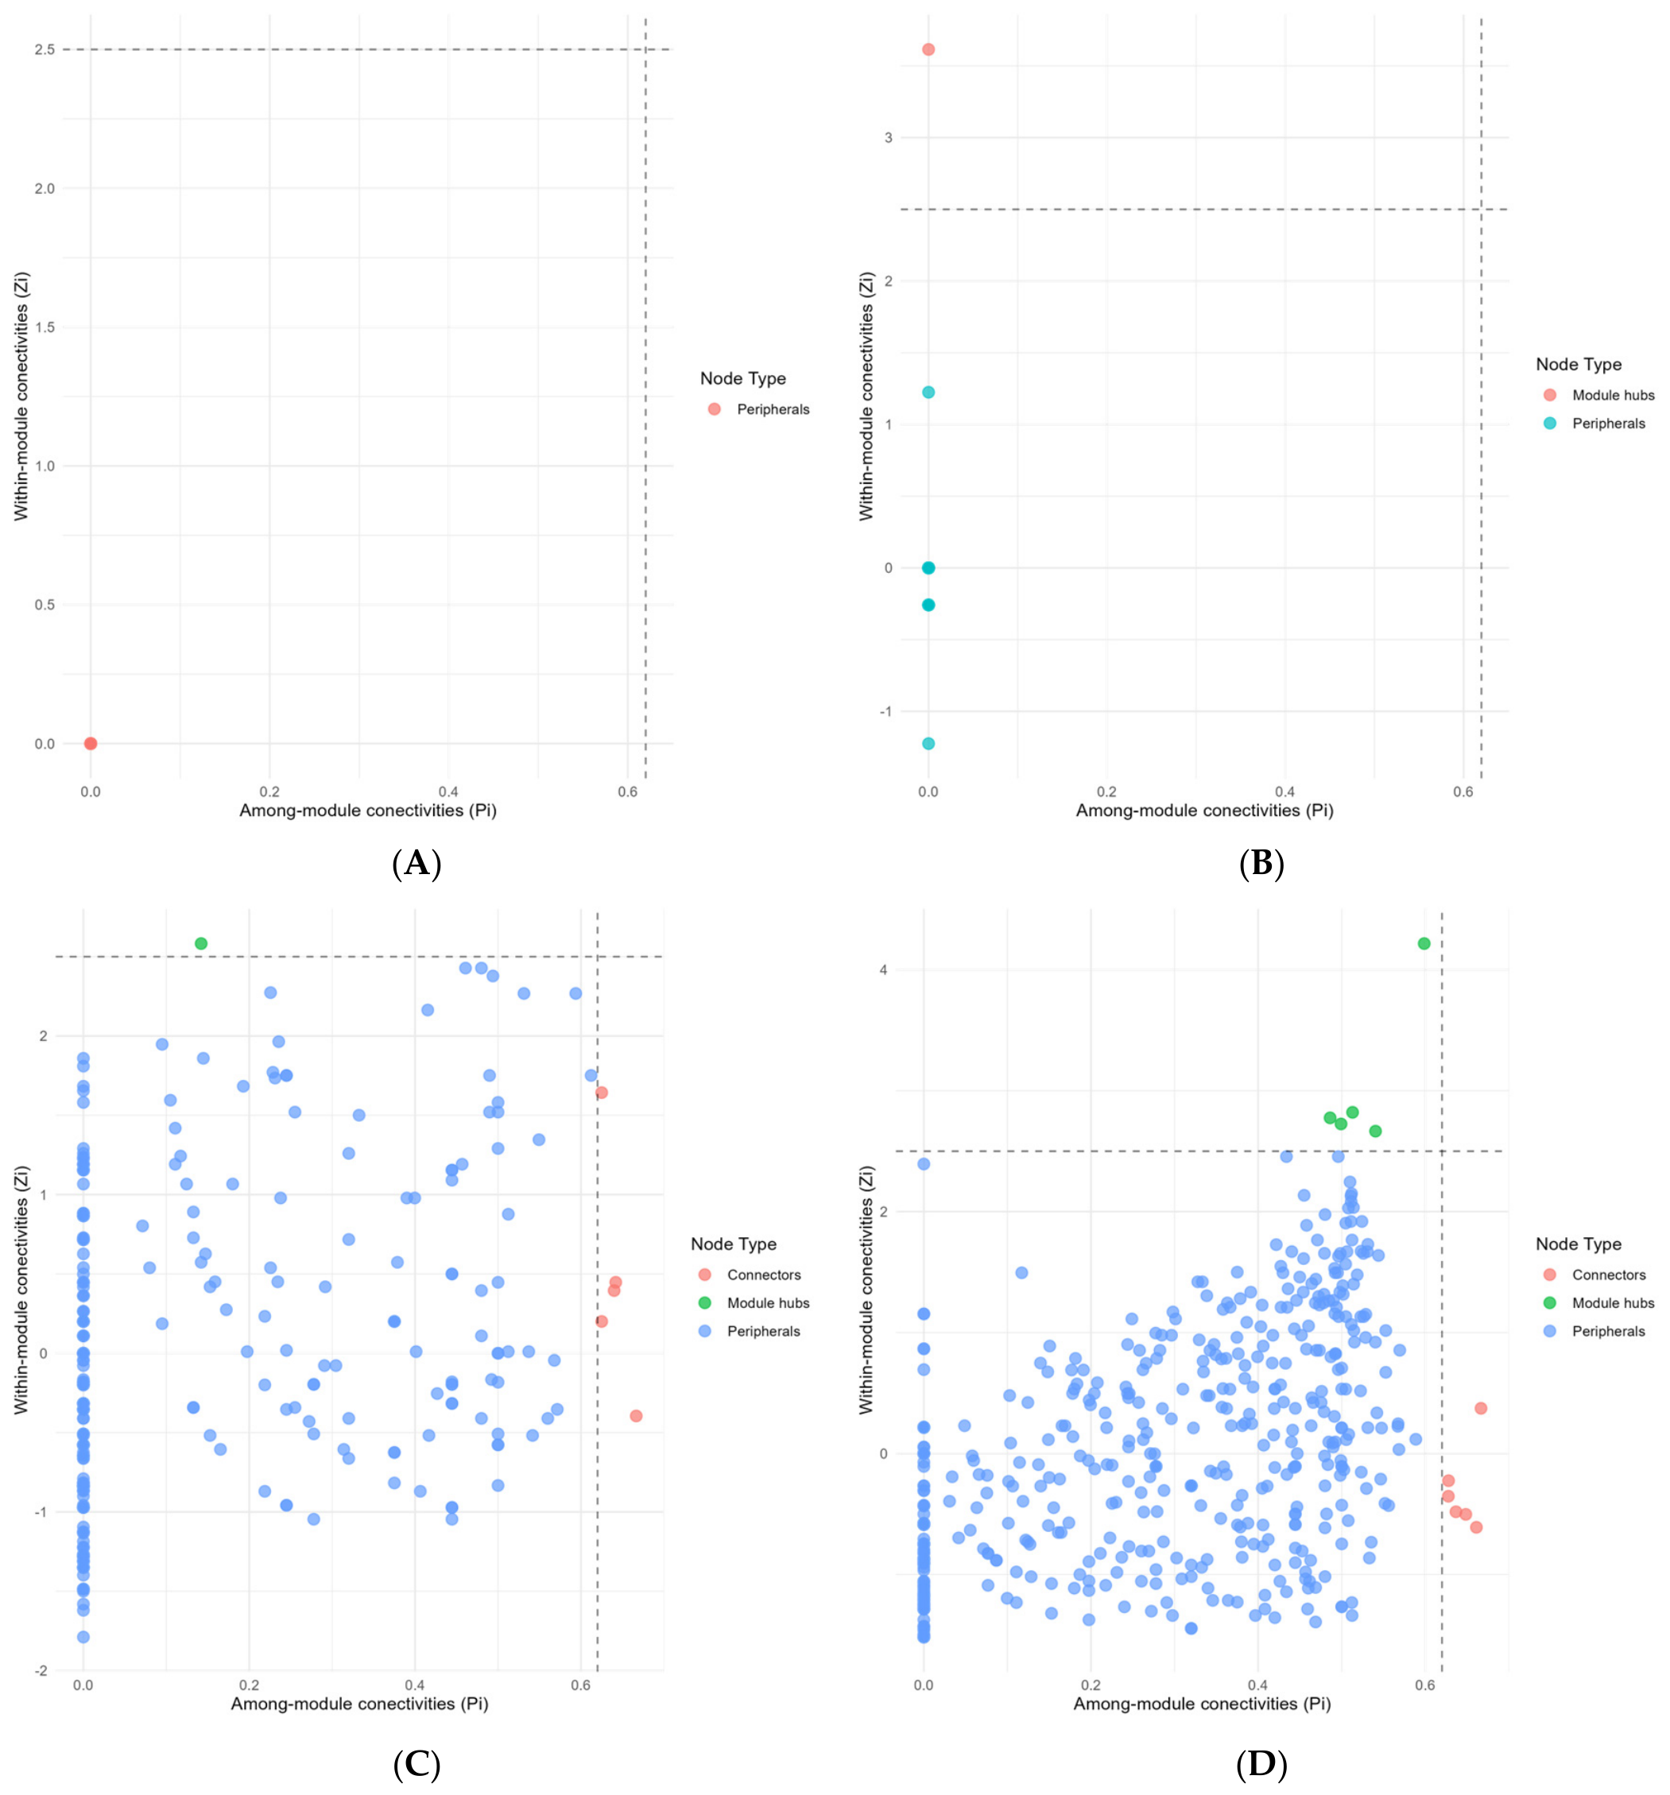
The research results indicated that bacterial groups performing high-abundance functions such as aerobic heterotrophy, chemoheterotrophy, and nitrogen metabolism occupied the Zi-Pi key nodes in the taxonomic network, while the key nodes in the functional network were predominantly composed of non-high-abundance functional groups such as plant pathogens, urea decomposition, and trace substance metabolism (Figure 13 and Figure 14).
In the taxonomy network, the number of high-value Zi-Pi was as follows: broad-leaved forest > mixed forest > coniferous forest (Figure 13A–C). In coniferous forests, both the Zi and Pi values were zero (Figure 13A), whereas in mixed forests, nodes with Zi > 0 significantly increased. A module hub, Arenimicrobium_luteum, appeared, which performs high-abundance functions, such as aerobic heterotrophy, and was also associated with lignin degradation and symbiotic functions (Figure 13B). The number of high-value nodes continued to increase in the broad-leaved forest, where the module hubs include proteobacterium_Ellin139, which performs highly abundant functions such as aerobic heterotrophy, chemotrophy, and nitrate reduction (Figure 13C). Additionally, it carries out aerobic ammonia oxidation, xylan decomposition, and fermentation functions. The results indicated that the module hubs of mixed forests and broad-leaved forests were related to chemoheterotrophy and the decomposition of recalcitrant polysaccharides, indicating that these functions play an important role in connecting the taxonomic network modules within mixed forests and broad-leaved forests. Five connectors were found in broad-leaved forests (Figure 13C), including Arthrobacter humicola, which corresponds to aerobic heterotrophy, chemoheterotrophy, and nitrate degradation; Candidatus Nitrospira nitrosa, which corresponds to nitrite oxidation; Conexibacter stalactiti, Sphingosinicella sp.; and an uncultured delta proteobacterium, none of which had corresponding functions in the database. Additionally, there were some nodes with values that were high but did not reach the Zi-Pi critical value, which also predominantly perform high-abundance functions such as chemoheterotrophy and nitrogen metabolism. Over all forest types, module hubs Skermanella_aerolata corresponded to functions of aerobic heterotrophy, chemoheterotrophy, and fermentation. unclassified_OM27_clade corresponded to functions of predation or ectoparasitism. Connector nodes Massilia_violaceinigra corresponded to functions of aerobic heterotrophy, aromatic compound degradation, nitrate degradation, urea decomposition, animal parasites or symbionts. ADurb.Bin063_1_bacterium_Ellin515 corresponded to functions of chemoheterotrophy, nitrate degradation, fermentation, and manganese oxidation. Beta_proteobacterium_HJX14 corresponded to urea decomposition, while unclassified_Comamonadaceae corresponded to nitrate degradation, plant pathogens, and various human and animal pathogenic bacteria (Figure 13D). Clearly, these key nodes in the overall network structure of the forest stand were also executors of high-abundance functions. Additionally, it could be observed that functions of plant, animal, and human pathogens in the soil often occupied key node positions.
For the functional network, the nodes of each stand and the overall stands did not reach the critical value of key nodes (Figure 14). For coniferous forests and mixed forests, the Zi-Pi value was 0 (Figure 14A,B), while the proportion of high-value Zi-Pi was significantly increased in broad-leaved forests and the overall stands (Figure 14C,D). In broad-leaved forests, high-value Zi-Pi nodes performed manganese respiration, sulfur respiration, and plant pathogen functions. Only nodes with high intra-module connectivity were associated with human pathogens and lignin hydrolysis functions, while only nodes with high inter-module connectivity were related to aromatic hydrocarbon degradation and urea decomposition functions. Overall, high-value Zi-Pi nodes in the stands were associated with urea decomposition, manganese oxidation, and human pathogen functions. Only nodes with high intra-module connectivity were linked to sulfur respiration, fumarate respiration, arsenate detoxification, and arsenite reduction functions. Therefore, the Zi-Pi of the functional network mainly indicated nodes with pathogen, urea decomposition, and trace metabolic functions, which are not high-abundance functions.

4. Discussion

4.1. The Impact of Afforestation Types on the Community Structure and Faprotax-Predicted Functional Structure of Soil Bacteria

This study showed that establishing broad-leaved forests in limestone mountainous areas can better improve the soil bacterial α-diversity index compared to mixed forests and coniferous forests. Our conclusions are supported by previous studies [44,45,46] showing that broad-leaved forests harbored more complex bacterial networks, which coincided with higher microbial diversity [47,48]. Different types of artificial forests had a significant impact on the community structure of soil bacteria, which was also strongly supported by relevant research [49]. Coniferous forests showed the strongest convergence in community structure, while mixed and broad-leaved forests exhibited increased heterogeneity within the forest stand.
In terms of functionality, FAPROTAX predicted the highest total abundance of carbon cycling, with no significant differences among forest types. However, the abundance of the Chemo-1 group was the lowest and the abundance of the Chemo-2 group was the highest in coniferous forests. Multiple studies on forest soil microorganisms have shown the highest proportion of carbon cycling functional abundance [50,51]. The Faprotax-predicted functional abundance structure showed increased within-stand heterogeneity with higher proportions of broad-leaved trees, which reduced differences in the functional richness structure among stands. Related studies have shown that the main functional groups of carbon cycling in coniferous forests are replaced by other functional groups in mixed forests and broad-leaved forests, thus forming a specific Faprotax-predicted functional structure initially in coniferous forests, but not in mixed forests and broad-leaved forests, consistent with the conclusions of this paper [46]. Soil available potassium content was significantly positively correlated with the abundance of multiple functions related to carbon and nitrogen metabolism. The RDA also indicated that soil available potassium was a significant factor affecting the Faprotax-predicted functional abundance structure. Ammonium nitrogen content [52] and pH [53] were also significantly correlated with some functional abundances, consistent with the conclusion of the RDA that they were significant influencing factors of community structure. These correlations indicated that the transition from coniferous forests to mixed forests and broad-leaved forests was accompanied by accelerated nutrient cycling, and many soil properties were significantly correlated with bacterial Faprotax-predicted functional structures, highlighting the importance of environmental factors in shaping microbial community structure. The importance value of P. tabulaeformis in the community was significantly negatively correlated with pathogen functions and urease decomposition functions, and the RDA also showed that P. tabulaeformis was a significant factor affecting community structure. Previous studies have demonstrated that tree species composition can alter soil bacterial communities via litter inputs [54], but other studies have also shown that mixed forests’ litter could lead to consistent soil bacterial community structure among different tree species [55].

4.2. Differences in the Responses of Taxonomic Network and Functional Abundance Network Characteristics to Forest Stand Changes

It should be noted that correlation-based co-occurrence networks are affected by compositional bias and shared environmental filtering; thus, observed association edges cannot be interpreted as real biological interactions. In this context, the positive-dominated edges in both taxonomic and functional networks mainly reflect similar environmental preference rather than direct symbiosis or competition. This suggests high ecological redundancy and functional stability, with functional networks exhibiting even greater redundancy [56]. For example, in our research, we found that Arthrobacter humicola was annotated to nitrate reduction, chemoheterotrophy, and aerobic chemoheterotrophy functions; Phenylobacterium muchangponense was annotated to aerobic chemoheterotrophy and chemoheterotrophy functions; proteobacterium_Ellin139 was annotated to aerobic ammonia oxidation, aerobic chemoheterotrophy, chemoheterotrophy, fermentation, nitrate reduction, plant pathogen, and xylanolysis functions; and Arenimicrobium luteum was annotated to aerobic chemoheterotrophy, animal parasites_or_symbionts, chemoheterotrophy, and ligninolysis functions. However, a high proportion of positive correlations could reduce the stability of functional networks [57,58]. Coniferous forests had the lowest proportion of positive correlations, with a relatively higher frequency of negative associations [59,60]. In terms of network structure, broad-leaved forests exhibited higher node number, edge number, weighted degree, diameter, average path length, betweenness centrality, and eccentricity compared to coniferous and mixed forests. Similarly, studies have shown that multi-species broad-leaved forests have higher connectivity, clustering coefficients, and centrality than pure forests, suggesting that environmental diversity leads to more complex communities, niche differentiation, reduced negative co-occurrence, and enhanced network stability [61,62,63]. Studies have shown that coniferous forests have the shortest average path length [64], which is consistent with the conclusion of this study and may reflect the situation of nutrient transport in highly competitive environments with resource scarcity. The higher graph density in broad-leaf forests may be due to habitat richness and high species diversity, which form complex coexistence relationships; the lower graph density in coniferous forests may result from functional dependence on a few strongly connected nodes, which could form efficient and stable functional pathways [21,65]. As forest complexity increased, high Zi-Pi nodes became more prevalent [1,21]. Mixed forests and broad-leaved forests contain module hubs and connectors, which may significantly improve the taxonomic and functional connectivity of soil microorganisms by reshaping networks and functions, consistent with the conclusion that broad-leaved forest soils contain higher levels of various nutrients than coniferous forests.
In the taxonomy network, the eccentricity and closeness centrality of mixed forests and broad-leaf forests were highly significantly negatively correlated, indicating that edge nodes closely connected to core nodes [66,67] allow for rapid exchange of matter and energy between them, thereby enhancing network stability and robustness [68]. Once core nodes were disturbed, edge nodes could partially buffer their impact [69,70]. The clustering coefficient and eigenvector centrality of coniferous forests were most closely related to ternary closure structures and weighted degree, indicating a simple community structure with tight connections and a single ecological niche. As the forest transitioned to multiple tree species, environmental diversity increased, the community became more complex, and parameter correlations decreased [71]. The number of connected components and harmonic closeness centrality were positively correlated, indicating that the community divides into more modules, with enhanced internal module connections and weakened inter-module connections. Mixed forests and broad-leaf forests, due to complex environments and heterogeneous resources, promoted the formation of multi-connected component-specific network structures in bacteria [72]. The correlation of functional network topological parameters was generally lower, reflecting rich functional diversity in soil bacteria, where different functions were both independent and exhibited complex synergistic or antagonistic relationships, with limited niche differentiation at the functional level. The decline in the number of hub nodes and the reduced correlation with clustering coefficients and weighted degrees indicated a weakened connectivity and aggregation capacity of core functional nodes. This led to a more complex Faprotax-predicted functional structure of the community. The concentration of coniferous forest resources forms a simple Faprotax-predicted functional structure where a few core nodes are relied upon by surrounding nodes. In contrast, mixed and broad-leaved forest functional networks have higher modularity, enhanced inter-node connectivity, and reduced dependence on core nodes, thereby forming more diverse Faprotax-predicted functional structures.

4.3. The Network Structural Characteristics Explain the Corresponding Differences in Community Structure and Functional Structure in Response to Changes in Forest Stands

The community structure responded more strongly to changes in forest stands than the Faprotax-predicted functional structure [73]. Coexistence networks had fewer positive correlations and greater intensity differences, with significant competitive exclusion, making species coexistence susceptible to environmental reshaping [74]. Higher positive correlations were observed in functional networks, indicating strong functional redundancy, thus weakening forest stand differences. Coniferous forest communities and functional networks both exhibited high convergence: lacking high-connectivity hubs, functions were shared by numerous mid- to low-abundance groups, with small individual fluctuations, maintaining community and Faprotax-predicted functional structure stability through high centrality and clustering strength. Broad-leaved forest communities showed aggregated structural networks with high taxonomic network density, attributed to soil heterogeneity promoting species coexistence and stable key nodes. Faprotax-predicted functional structures were more divergent, with key nodes being low-abundance functional groups responsive to heterogeneity, reduced centrality and clustering strength to accommodate differences, and buffered functional fluctuations through redundancy. Hub core nodes showed significant changes in taxonomic networks but minor changes in functional networks [75,76]. Although we selected plots with uniform bedrock and stand age to minimize confounding effects from microtopography, land-use history and stand heterogeneity, our single snapshot cross-sectional sampling without in situ disturbance trials or long-term monitoring prevents robust confirmation of true ecosystem stability, representing an inherent limitation of this observational field study. Accordingly, we only interpret variations in network structural robustness in the present work.

5. Conclusions

This study demonstrated that afforestation type significantly shapes the taxonomic structure of soil bacterial communities in limestone mountain areas, with broad-leaved forests supporting higher diversity and more complex co-occurrence networks than coniferous forests. Despite differences in community composition, functional profiles remained stable across forest types, indicating strong functional redundancy. Soil chemical properties, rather than plant diversity, were the primary drivers of bacterial Faprotax-predicted functional structure. Our findings highlight the importance of considering both community composition and network topology when evaluating the ecological effects of vegetation restoration and suggest that broad-leaved plantations supported higher soil bacterial diversity and stronger functional redundancy in limestone mountain restored lands.

Supplementary Materials

The following supporting information can be downloaded at: https://www.mdpi.com/article/10.3390/f17060702/s1, Figure S1: Changes in co-occurrence network topological indices under different Spearman correlation coefficient thresholds (|r|); Figure S2: Soil bacterial taxonomic and functional structure diagrams of different artificial forest types.

Author Contributions

Conceptualization, Z.Q. and J.S.; methodology, Z.Q.; formal analysis, J.L., H.G., S.D., W.K. and J.S.; investigation, Z.Q., J.L., H.G., S.D. and W.K.; data curation, Z.Q. and H.G.; writing—original draft preparation, Z.Q. and J.S.; writing—review and editing, Z.Q., J.L. and J.S.; funding acquisition, J.S. and Z.Q.; investigation, data curation, X.Z. All authors have read and agreed to the published version of the manuscript.

Funding

This research was funded by [Shandong Agriculture and Engineering University Start-Up fund for Talented Scholars] grant number [2024GCCZR-12] and [Shandong Provincial Colleges and Universities Youth Innovation Technology Program]. The APC was funded by [Shandong Agriculture and Engineering University Start-Up fund for Talented Scholars: 2024GCCZR-12].

Data Availability Statement

The raw sequencing data for soil bacterial sequencing can be found at https://www.ncbi.nlm.nih.gov/sra/PRJNA1444196.

Conflicts of Interest

The authors declare no conflicts of interest.

References

  1. Ge, Z.; Zhang, X.; Liu, C.; Li, M.; Wang, R.; Zhang, Y.; Zhang, Z. Microbial determinants of soil quality in mixed larch and birch forests: Network structure and keystone taxa abundances. Front. Plant Sci. 2025, 16, 1491038. [Google Scholar] [CrossRef] [Scilit] [PubMed]
  2. Jiao, S.; Chen, W.; Wei, G. Core microbiota drive functional stability of soil microbiome in reforestation ecosystems. Glob. Change Biol. 2021, 28, 1038–1047. [Google Scholar] [CrossRef] [Scilit]
  3. Yang, Y.; Li, T.; Wang, Y.; Cheng, H.; Chang, S.X.; Liang, C.; An, S. Negative effects of multiple global change factors on soil microbial diversity. Soil Biol. Biochem. 2021, 156, 108229. [Google Scholar] [CrossRef] [Scilit]
  4. Riddley, M.; Hepp, S.; Hardeep, F.; Nayak, A.; Liu, M.; Xing, X.; Zhang, H.; Liao, J. Differential roles of deterministic and stochastic processes in structuring soil bacterial ecotypes across terrestrial ecosystems. Nat. Commun. 2025, 16, 2337. [Google Scholar] [CrossRef] [Scilit] [PubMed]
  5. Liu, Z.X.; Lyu, Y.M.; Liu, Y.; Wang, Y.; Xiong, M.; Tang, Y.; LI, X.; Sun, H.; Xu, J. Differential spatial responses and assembly mechanisms of soil microbial communities across region-scale Taiga ecosystems. J. Environ. Manag. 2024, 370, 122653. [Google Scholar] [CrossRef] [Scilit] [PubMed]
  6. Louca, S.; Parfrey, L.; Doebeli, M. Decoupling function and taxonomy in the global ocean microbiome. Science 2016, 353, 1272–1277. [Google Scholar] [CrossRef] [Scilit] [PubMed]
  7. Ortiz, A.; Zapata, F.; Tfaily, M. Stochastic assembly and metabolic network reorganization drive microbial resilience in arid soils. Commun. Earth Environ. 2025, 6, 647. [Google Scholar] [CrossRef] [Scilit]
  8. Zhou, X.; Tahvanainen, T.; Malard, L.; Chen, L.; Pérez-Pérez, J.; Berninger, F. Global analysis of soil bacterial genera and diversity in response to pH. Soil Biol. Biochem. 2024, 198, 109552. [Google Scholar] [CrossRef] [Scilit]
  9. Tylianakis, J.M.; Morris, R.J. Ecological networks across environmental gradients. Annu. Rev. Ecol. Evol. Syst. 2017, 48, 25–48. [Google Scholar] [CrossRef] [Scilit]
  10. Woodward, G.; Benstead, J.; Beveridge, O.; Blanchard, J.; Brey, T.; Brown, L.; Cross, W.; Friberg, N.L.; Ings, T.; Jacob, U.; et al. Ecological networks in a changing climate. Adv. Ecol. Res. 2010, 42, 71–138. [Google Scholar] [CrossRef] [Scilit]
  11. Blanchet, F.; Cazelles, K.; Gravel, D. Co-occurrence is not evidence of ecological interactions. Ecol. Lett. 2020, 23, 1050–1063. [Google Scholar] [CrossRef] [Scilit] [PubMed]
  12. Faust, K. Open challenges for microbial network construction and analysis. ISME J. 2021, 15, 3111–3118. [Google Scholar] [CrossRef] [Scilit] [PubMed]
  13. Barner, A.; Coblentz, K.; Hacker, S.; Menge, B. Fundamental contradictions among observational and experimental estimates of non-trophic species interactions. Ecology 2018, 99, 557–566. [Google Scholar] [CrossRef] [Scilit] [PubMed]
  14. Morueta-Holme, N.; Blonder, B.; Sandel, B.; McGill, B.; Peet, R.; Ott, J.; Violle, C.; Enquist, B.; Jørgensen, P.; Svennin, J.; et al. A network approach for inferring species associations from co-occurrence data. Ecography 2016, 39, 1139–1150. [Google Scholar] [CrossRef] [Scilit]
  15. Mason, N.; Lanoiselée, C.; Mouillot, D.; Lrz, P.; Argillier, C. Functional characters combined with null models reveal inconsistency in mechanisms of species turnover in lacustrine fish communities. Oecologia 2007, 153, 441–452. [Google Scholar] [CrossRef] [Scilit] [PubMed]
  16. Macarthur, R.; Levins, R. The limiting similarity, convergence, and divergence of coexisting species. Am. Nat. 1967, 101, 377–385. [Google Scholar] [CrossRef] [Scilit]
  17. Veech, J.A. Significance testing in ecological null models. Theor. Ecol. 2012, 5, 611–616. [Google Scholar] [CrossRef] [Scilit]
  18. Legras, G.; Loiseau, N.; Gaertner, J.C.; Plggiale, J.C.; Ienco, D.; Mazouni, N.; Mérigot, B. Assessment of congruence between co-occurrence and functional networks: A new framework for revealing community assembly rules. Sci. Rep. 2019, 9, 19996. [Google Scholar] [CrossRef] [Scilit] [PubMed]
  19. Yuan, M.; Guo, X.; Wu, L.; Zhang, Y.; Xiao, N.; Ning, D.; Shi, Z.; Wu, L.; Yang, Y.; Tiedje, J.; et al. Climate warming enhances microbial network complexity and stability. Nat. Clim. Change 2021, 11, 343–348. [Google Scholar] [CrossRef] [Scilit]
  20. Pellissier, L.; Albouy, C.; Bascompte, J.; Farwin, N.; Graham, C.; Loreau, M.; Maglianesi, M.; Melián, C.; Pitteloud, C.; Roslin, T.; et al. Comparing species interaction networks along environmental gradients. Biol. Rev. 2018, 93, 785–800. [Google Scholar] [CrossRef] [Scilit] [PubMed]
  21. Banerjee, S.; Schlaeppi, K.; van der Heijden, M. Keystone taxa as drivers of microbiome structure and functioning. Nat. Rev. Microbiol. 2018, 16, 567–576. [Google Scholar] [CrossRef] [Scilit] [PubMed]
  22. Hernandez, D.J.; David, A.S.; Mengens, E.; Searcy, C.; Afkhami, M. Environmental stress destabilizes microbial networks. ISME J. 2021, 15, 1722–1734. [Google Scholar] [CrossRef] [Scilit] [PubMed]
  23. Qiu, L.; Zhang, Q.; Zhu, H.; Reich, P.; Banejee, S.; van der Heijden, M.G.; Sadowsky, M.; Ishii, S.; Jia, X.; Shao, M.; et al. Erosion reduces soil microbial diversity, network complexity and multifunctionality. ISME J. 2021, 15, 2474–2489. [Google Scholar] [CrossRef] [Scilit] [PubMed]
  24. Violle, C.; Thuiller, W.; Mouquet, N.; Munoz, F.; Kraft, N.J.B.; Cadotte, M.W.; Livingstone, S.W.; Grenie, M.; Mouillot, D. A Common Toolbox to Understand, Monitor or Manage Rarity? A Response to Carmona et al. Trends Ecol. Evol. 2017, 32, 891–893. [Google Scholar] [CrossRef] [Scilit] [PubMed]
  25. Borthagaray, A.I.; Pinelli, V.; Berazategui, M.; Rodríguez-Tricot, L.; Arim, M. Effects of metacommunity networks on local community structures: From theoretical predictions to empirical evaluations. In Aquatic Functional Biodiversity: An Ecological and Evolutionary Perspective; Academic Press: Cambridge, UK, 2015; pp. 75–111. [Google Scholar] [CrossRef] [Scilit]
  26. Laughlin, D.C.; Strahan, R.T.; Huffman, D.W. Using trait-based ecology to restore resilient ecosystems: Historical conditions and the future of montane forests in western North America. Restor. Ecol. 2016, 25, S135–S146. [Google Scholar] [CrossRef] [Scilit]
  27. Wang, K.; Zhang, Y.; Tang, Z.; Shangguan, Z.; Chan, F.; Jia, F.; Chen, Y.; He, X.; Shi, W.; Deng, L. Effects of grassland afforestation on structure and function of soil bacterial and fungal communities. Sci. Total Environ. 2019, 676, 396–406. [Google Scholar] [CrossRef] [Scilit] [PubMed]
  28. Di Martino, C.; Torino, V.; Minotti, P.; Pietrantonio, L.; Del Grosso, C.; Palmieri, D.; Palumbo, G.; Crawford, T.W., Jr.; Carfagna, S. Mycorrhized Wheat Plants and Nitrogen Assimilation in Coexistence and Antagonism with Spontaneous Colonization of Pathogenic and Saprophytic Fungi in a Soil of Low Fertility. Plants 2022, 11, 924. [Google Scholar] [CrossRef] [Scilit]
  29. Goberna, M.; Verdu, M. Cautionary notes on the use of co-occurrence networks in soil ecology. Soil Biol. Biochem. 2022, 166, 108534. [Google Scholar] [CrossRef] [Scilit]
  30. Collyer, G.; Perkins, D.M.; Petsch, D.K.; Siqueira, T.; SaitoV. Land-use intensification systematically alters the size structure of aquatic communities in the Neotropics. Glob. Change Biol. 2023, 29, 4094–4106. [Google Scholar] [CrossRef] [Scilit] [PubMed]
  31. Qiu, Z.; Shi, C.; Zhao, M.; Wang, K.; Zhang, M.; Wang, T.; Shi, F. Improving Effects of Afforestation with Different Forest Types on Soil Nutrients and Bacterial Community in Barren Hills of North China. Sustainability 2022, 14, 1202. [Google Scholar] [CrossRef] [Scilit]
  32. Qiu, Z.; Li, J.; Wang, P.; Wang, D.; Han, L.; Gao, X.; Shu, J. Response of soil bacteria on habitat-specialization and abundance gradient to different afforestation types. Sci. Rep. 2023, 13, 18181. [Google Scholar] [CrossRef] [Scilit] [PubMed]
  33. HJ615-2011; Soil Determination of Organic Carbon-Potassium Dichromate Oxidation Spectro Photometric Method. Ministry of Environmental Protection PRC: Beijing, China, 2011. (In Chinese)
  34. NY/T 1121; Soil Testing-Method for Determination of Available Phosphorus in Soil. Ministry of Agriculture PRC: Beijing, China, 2012. (In Chinese)
  35. Callahan, B.; McMurdie, P.; Rosen, M.; Han, A.; Johnson, A.; Holmes, S. DADA2: High-resolution sample inference from Illumina amplicon data. Nat. Methods 2016, 13, 581–583. [Google Scholar] [CrossRef] [Scilit] [PubMed]
  36. Bolyen, E.; Rideout, J.; Dillon, M.; Bokulich, N.; Abnet, C.; AI-Ghalith, G.; Alexander, H.; Alm, E.; Arumugam, M.; Asnicar, F. Reproducible, interactive, scalable and extensible microbiome data science using QIIME 2. Nat. Biotechnol. 2019, 37, 852–857. [Google Scholar] [CrossRef] [Scilit] [PubMed]
  37. Quast, C.; Pruesse, E.; Yilmaz, P.; Gerken, J.; Schweer, T.; Yarza, P.; Peplies, J.; Glöckner, F.O. The SILVA ribosomal RNA gene database project: Improved data processing and web-based tools. Nucleic Acids Res. 2012, 41, D590–D596. [Google Scholar] [CrossRef] [Scilit] [PubMed]
  38. Kumar, A.; Ng, D.H.P.; Wu, Y.; Cao, B. Microbial community composition and putative biogeochemical functions in the sediment and water of tropical granite quarry lakes. Microb. Ecol. 2019, 77, 1–11. [Google Scholar] [CrossRef] [Scilit] [PubMed]
  39. Shi, P.; Wang, H.; Feng, M.; Cheng, H.; Yang, Q.; Yan, Y.; Xu, J.; Zhang, M. Bacterial Metabolic Potential in Response to Climate Warming Alters the Decomposition Process of Aquatic Plant Litter—In Shallow Lake Mesocosms. Microorganisms 2022, 10, 1327. [Google Scholar] [CrossRef] [Scilit] [PubMed]
  40. Csardi, M.G. Network Analysis and Visualization. 2024. Available online: https://igraph.org/ (accessed on 15 April 2025).
  41. Deng, Y.; Jiang, Y.; Yang, Y.; He, Z.; Luo, F.; Zhou, J. Molecular ecological network analyses. BMC Bioinform. 2012, 13, 113. [Google Scholar] [CrossRef] [Scilit] [PubMed]
  42. Shi, Z.; He, Z.; Zhou, J.; Shi, S.; Nuccio, E.; Firestone, M. The interconnected rhizosphere: High network complexity dominates rhizosphere assemblages. Ecol. Lett. 2016, 19, 926–936. [Google Scholar] [CrossRef] [Scilit] [PubMed]
  43. Hu, H.; Wei, X.-Y.; Liu, L.; Wang, Y.; Bu, L.; Jia, H.; Pei, D. Biogeographic patterns of meio-and micro-eukaryotic communities in dam-induced river-reservoir systems. Appl. Microbiol. Biotechnol. 2024, 108, 130. [Google Scholar] [CrossRef] [Scilit] [PubMed]
  44. Liang, Z.; Qin, J.; He, J.; Liu, H.; Wang, T.; Tan, L. Dissimilarity of Soil Bacterial Community Structure and Diversity between Typical Native Broadleaf Plantation and Primary Secondary Forest in South Subtropical China. Chin. J. Soil Sci. 2024, 55, 1060–1070. (In Chinese) [Google Scholar] [CrossRef]
  45. Deng, J.; Yin, Y.; Zhu, W.; Zhou, Y. Variations in Soil Bacterial Community Diversity and Structures Among Different Revegetation Types in the Baishilazi Nature Reserve. Front. Microbiol. 2018, 9, 2874. [Google Scholar] [CrossRef] [Scilit] [PubMed]
  46. Qu, Z.; Liu, B.; Ma, Y.; Xu, J.; Sun, H. The response of the soil bacterial community and function to forest succession caused by forest disease. Funct. Ecol. 2020, 34, 2548–2559. [Google Scholar] [CrossRef] [Scilit]
  47. Guan, H.; Huang, R.; Zhu, L.; Wang, J.; Ji, S.; Lin, L. Differences in soil microbial communities in different ecological restoration forests in red soil regions. J. For. Environ. 2023, 43, 177–184. [Google Scholar] [CrossRef]
  48. Liu, C.; Zuo, W.; Zhao, Z.; Qiu, L. Bacterial diversity of different successional stage forest soils in Dinghushan. Acta Microbiol. Sin. 2012, 52, 1489–1496. (In Chinese) [Google Scholar] [PubMed]
  49. Liu, Y.X.; Li, J.; Feng, J.N.; Chen, Q.Y.; Chen, S.Y.; Fu, R.Y.; Guo, X.W.; Du, Y.G.; Dai, L.C. Conversion of tropical secondary forests into rubber plantations reduces network complexity and diversity of soil bacterial community. J. Plant Ecol. 2025, 18, rtaf115. [Google Scholar] [CrossRef] [Scilit]
  50. Li, Y.; Compson, Z.G.; Kuang, X.; Yu, L.; Song, Q.; Liu, J.; Huang, D.; Zhou, H.; Huang, S.; Li, T.; et al. Increased stability of a subtropic bamboo forest soil bacterial communities through integration of water and fertilizer management compared to conventional management. BMC Plant Biol. 2024, 24, 1072. [Google Scholar] [CrossRef] [Scilit] [PubMed]
  51. Zhang, T.; Dong, X.; Yang, J.; Li, Z.; Zhu, J. Effects of Near-Natural Forest Management on Soil Microbial Communities in the Temperate–Subtropical Transition Zone of China. Microorganisms 2025, 13, 1906. [Google Scholar] [CrossRef] [Scilit] [PubMed]
  52. Fu, S.; Gao, H.; Song, S.; Wang, L.; Li, H.; Liu, Y.; Zhang, L.; Li, H.; You, C.; Liu, S.; et al. Effects of the Conversion of Subalpine Spruce Natural Forest to Plantation on Soil Bacterial Communities and Function in Western Sichuan, China. Chin. J. Appl. Environ. Biol. 2024, 30, 504–513. (In Chinese) [Google Scholar] [CrossRef]
  53. Jeanbille, M.; Buée, M.; Bach, C.; Cébron, A.; Frey-Klett, P.; Turpault, M.P.; Uroz, S. Soil parameters drive the structure, diversity and metabolic potentials of the bacterial communities acrosstemperate beech forest soil sequences. Microb. Ecol. 2016, 71, 482–493. [Google Scholar] [CrossRef] [Scilit] [PubMed]
  54. Cong, J.; Yang, Y.; Liu, X.; Lu, H.; Liu, X.; Zhou, J.; Li, D.; Yin, H.; Ding, J.; Zhang, Y. Analyses of soil microbial community compositions and functional genes reveal potential consequences of natural forest succession. Sci. Rep. 2015, 5, 10007. [Google Scholar] [CrossRef] [Scilit] [PubMed]
  55. Wang, W.; Zhang, Q.; Sun, X.; Chen, D.; Insam, H.; Koide, R.; Zhang, S. Effects of mixed-species litter on bacterial and fungal lignocellulose degradation functions during litter decomposition. Soil Biol. Biochem. 2020, 14, 107690. [Google Scholar] [CrossRef] [Scilit]
  56. Araujo, A.; Miranda, A.; Sousa, R.; Mendes, L.; Antunes, J.; Oliveira, L.; Araujo, F.; Melo, V.; Figueiredo, M. Bacterial community associated with rhizosphere of maize and cowpea in a subsequent cultivation. Appl. Soil Ecol. 2019, 143, 26–34. [Google Scholar] [CrossRef] [Scilit]
  57. Herren, C.M.; McMahon, K.D. Cohesion: A method for quantifying the connectivity of microbial communities. ISME J. 2017, 11, 2426–2438. [Google Scholar] [CrossRef] [Scilit] [PubMed]
  58. Cheng, M.; Song, J.; Li, W.; Zhao, Y.; Zhang, G.; Chen, Y.; Gao, H. Potentilla parvifolia strongly influenced soil microbial community and environmental effect along an altitudinal gradient in central Qilian Mountains in western China. Ecol. Evol. 2023, 13, e10685. [Google Scholar] [CrossRef] [Scilit] [PubMed]
  59. Yang, W.; Jing, X.; Guan, Y.; Zhai, C.; Wang, T.; Shi, D.; Sun, W.; Gu, S. Response of Fungal Communities and Co-occurrence Network Patterns to Compost Amendment in Black Soil of Northeast China. Front. Microbiol. 2019, 10, 1562. [Google Scholar] [CrossRef] [Scilit] [PubMed]
  60. Lin, W.; Lu, J.; Yao, H.; Lu, Z.; He, Y.; Mu, C.; Wang, C.; Shi, C.; Ye, Y. Elevated pCO2 alters the interaction patterns and functional potentials of rearing seawater microbiota. Environ. Pollut. 2021, 287, 117615. [Google Scholar] [CrossRef] [Scilit] [PubMed]
  61. de Vries, F.; Griffiths, R.; Bailey, M.; Craig, H.; Girlanda, M.; Gweon, H.; Hallin, S.; Kaisermann, A.; Keith, A.M.; Kretzschmar, M.; et al. Soil bacterial networks are less stable under drought than fungal networks. Nat. Commun. 2018, 9, 3033. [Google Scholar] [CrossRef] [Scilit] [PubMed]
  62. Wang, M.; Sui, X.; Wang, X.; Zhang, X.; Zeng, X. Soil Fungal Community Differences in Manual Plantation Larch Forest and Natural Larch Forest in Northeast China. Microorganisms 2024, 12, 1322. [Google Scholar] [CrossRef] [Scilit] [PubMed]
  63. Banerjee, S.; Walder, F.; Büchi, L.; Meyer, M.; Held, A.; Gattinger, A.; Keller, T.; Charles, R.; van der Heijden, M. Agricultural Intensification Reduces Microbial Network Complexity and the Abundance of Keystone Taxa in Roots. ISME J. 2019, 13, 1722–1736. [Google Scholar] [CrossRef] [Scilit]
  64. Ma, L.; Zhang, J.; Li, Z.; Xin, X.; Guo, Z.; Wang, D.; Li, D.; Zhao, B. Long-term phosphorus deficiency decreased bacterial fungal network complexity and efficiency across three soil types in China as revealed by network analysis. Appl. Soil Ecol. 2020, 148, 103506. [Google Scholar] [CrossRef] [Scilit]
  65. Yang, B.; Wu, L.; Yang, Z.; Zhang, Z.; Feng, W.; Zheng, W.; Xu, C. The Patterns and Environmental Factors of Diversity, Co-Occurrence Networks, and Assembly Processes of Protistan Communities in Bulk Soils of Forests. Microorganisms 2025, 13, 1249. [Google Scholar] [CrossRef] [Scilit] [PubMed]
  66. Freeman, L.C. Centrality in social networks conceptual clarification. Soc. Netw. 1978, 1, 215–239. [Google Scholar] [CrossRef] [Scilit]
  67. Hage, P.; Harary, F. Eccentricity and centrality in networks. Soc. Netw. 1995, 17, 57–63. [Google Scholar] [CrossRef] [Scilit]
  68. Zhang, M.; Wang, K.; Shi, C.; Li, X.; Qiu, Z.; Shi, F. Responses of Fungal Assembly and Co-Occurrence Network of Rhizosphere Soil to Amaranthus palmeri Invasion in Northern China. J. Fungi 2023, 9, 509. [Google Scholar] [CrossRef] [Scilit] [PubMed]
  69. Du, Y.; Zhang, L.; Yang, Y.; Cheng, K.; Li, K.; Zhou, Y.; Li, L.; Jin, Y.; He, X. Assembly, network and functional compensation of specialists and generalists in poplar rhizosphere under salt stress. npj Biofilms Microbiomes 2025, 11, 28. [Google Scholar] [CrossRef] [Scilit] [PubMed]
  70. Yang, F.; Chen, Q.; Zhang, Q.; Long, C.; Jia, W.; Cheng, X. Keystone species affect the relationship between soil microbial diversity and ecosystem function under land use change in subtropical China. Funct. Ecol. 2021, 35, 1159–1170. [Google Scholar] [CrossRef] [Scilit]
  71. Wang, H.; Tian, D.; Cao, J.; Ren, S.; Zhu, Y.; Wang, H.; Wu, L.; Chen, L. Eucalyptus and Native Broadleaf Mixed Cultures Boost Soil Multifunctionality by Regulating Soil Fertility and Fungal Community Dynamics. J. Fungi 2024, 10, 709. [Google Scholar] [CrossRef] [Scilit] [PubMed]
  72. Zhang, G.L.; Bai, J.H.; Tebbe, C.C.; Huang, L.; Jia, J.; Wang, W.; Wang, X.; Yu, L.; Zhao, Q.Q. Spartina alterniflora invasions reduce soil fungal diversity and simplify co-occurrence networks in a salt marsh ecosystem. Sci. Total Environ. 2020, 758, 143667. [Google Scholar] [CrossRef] [Scilit] [PubMed]
  73. Luan, X.; Zhang, H.; Tian, Z.; Yang, M.; Wen, X.; Zhang, Y. Microbial community functional structure in an aerobic biofilm reactor: Impact of streptomycin and recovery. Chemosphere 2020, 255, 127032. [Google Scholar] [CrossRef] [Scilit] [PubMed]
  74. Li, Y.; Yang, Y.; Wu, T.; Zhang, H.; Li, Z. Rhizosphere bacterial and fungal spatial distribution and network pattern of Astragalus mongholicus in representative planting sites differ the bulk soil. Appl. Soil Ecol. 2021, 168, 104–114. [Google Scholar] [CrossRef] [Scilit]
  75. Schloter, M.; Nannipieri, P.; Sørensen, S.; Elsas, J. Microbial indicators for soil quality. Biol. Fertil. Soils 2018, 54, 1–10. [Google Scholar] [CrossRef] [Scilit]
  76. Huang, X.; Zhou, X.; Zhang, J.; Cai, Z. Highly connected taxa located in the microbial network are prevalent in the rhizosphere soil of healthy plant. Biol. Fertil. Soils 2019, 55, 299–312. [Google Scholar] [CrossRef] [Scilit]
Figure 1. Comparison of bacterial abundance differences in different afforestation soils ((A): phylum level; (B): genus level).
Forests 17 00702 g001
Figure 2. Changes in α-diversity of soil bacteria in different afforestation types (CF: coniferous forest, BF: broad-leaved forest, MF: mixed forest).
Forests 17 00702 g002
Figure 3. Comparison of soil bacterial community structure among different afforestation types (BF: broad-leaved forest, CF: coniferous forest, MF: mixed forest).
Forests 17 00702 g003
Figure 4. Comparison of functional abundance of carbon and nitrogen cycles among different afforestation types (CF: coniferous forest, BF: broad-leaved forest, MF: mixed forest).
Forests 17 00702 g004
Figure 5. Comparison of the abundance of other metabolic functions between different afforestation types (CF: coniferous forest, BF: broad-leaved forest, MF: mixed forest).
Forests 17 00702 g005
Figure 6. Comparison of specific functional abundances of carbon and nitrogen cycles in different afforestation types (CF: coniferous forest, BF: broad-leaved forest, MF: mixed forest).
Forests 17 00702 g006
Figure 7. Comparison of soil bacterial functional structure among different afforestation types (BF: broad-leaved forest, CF: coniferous forest, MF: mixed forest).
Forests 17 00702 g007
Figure 8. Correlations between environmental factors and the predicted functional abundance by FAPROTAX. (SOC: organic carbon content; AN: NH4+-N; AP: available phosphorus; SK: rapid-acting potassium; R: species richness; SHI: Shannon–Winner Index; SII: Simpson Index; SHE: Shannon Evenness Index; SIE: Simpson Evenness Index; P: Pielou Evenness Index; YS: Pinus tabulaeformis; CH: Robinia pseudoacacia; JQZ: Diospyros lotus; SY: Populus davidiana; CB: Platycladus orientalis; T: Prunus persica; CHS: Pinus densiflora). (* indicates a significant level of correlation, p < 0.05; ** indicates an extremely significant level of correlation, p < 0.01).
Forests 17 00702 g008
Figure 9. RDA of the impact of environmental factors, including plant diversity indices, plant composition and soil properties, on the structure of each habitat specialization group (CF: coniferous forest; MF: mixed forest; BF: broad-leaved forest) (SOC: organic carbon content; AN: NH4+-N; AP: available phosphorus; SK: rapid-acting potassium; R: species richness; SHI: Shannon–Winner Index; SII: Simpson Index; SHE: Shannon Evenness Index; SIE: Simpson Evenness Index; P: Pielou Evenness Index; YS: Pinus tabulaeformis; CH: Robinia pseudoacacia; JQZ: Diospyros lotus; SY: Populus davidiana; CB: Platycladus orientalis; T: Prunus persica; CHS: Pinus densiflora).
Forests 17 00702 g009
Figure 10. Comparison of topological parameters of taxonomic networks and functional networks among different forest types (CF: coniferous forest; MF: mixed forest; BF: broad-leaved forest) ((A): nodes; (B): edges; (C): triangles; (D): closeness centrality; (E): component number; (F): weighted degree; (G): network diameter; (H): average path length; (I): betweenness centrality; (J): graph density; (K): average clustering coefficient; (L): page ranks; (M): eccentricity; (N): hub).
Forests 17 00702 g010aForests 17 00702 g010b
Figure 11. (A): Correlation between topology parameters of the taxonomic network in coniferous forests. (B): Correlation between topology parameters of the taxonomic network in mixed forests. (C): Correlation between topology parameters of the taxonomic network in broad-leaved forests. (* indicates a significant level of correlation, p < 0.05; ** indicates an extremely significant level of correlation, p < 0.01; *** indicates a extremely significant level of correlation, p < 0.001).
Forests 17 00702 g011aForests 17 00702 g011b
Figure 12. (A) Correlation between topology parameters of the functional abundance network in coniferous forests. (B) Correlation between topology parameters of the functional abundance network in mixed forests. (C) Correlation between topology parameters of the functional abundance network in broad-leaved forests. (* indicates a significant level of correlation, p < 0.05; ** indicates an extremely significant level of correlation, p < 0.01; *** indicates a extremely significant level of correlation, p < 0.001).
Forests 17 00702 g012aForests 17 00702 g012b
Figure 13. Zi-Pi characteristics of taxonomic network ((A): coniferous forest; (B): mixed forest; (C): broad-leaved forest; (D): overall; Zi: within-module connectivity; Pi: among-module connectivity).
Forests 17 00702 g013
Figure 14. Zi-Pi characteristics of functional network ((A): coniferous forest; (B): mixed forest; (C): broad-leaved forest; (D): overall; Zi: within-module connectivity; Pi: among-module connectivity).
Forests 17 00702 g014
Table 1. Results of soil physical and chemical properties of different types of plantation forests (CF: coniferous forest, BF: broad-leaved forest, MF: mixed forest).
Index
Stands
SOC
g·kg−1
NH4+-N
mg·kg−1
Available Phosphorus mg·kg−1Rapid-Acting Potassium
mg·kg−1
pH
CF5.59 ± 3.22 a12.74 ± 4.23 a15.75 ± 13.29 a88.21 ± 50.82 b5.1 ± 0.27 b
MF4.91 ± 2.42 a11.80 ± 2.69 a28.67 ± 19.62 a53.53 ± 95.93 b5.2 ± 0.72 b
BF5.38 ± 0.77 a9.35 ± 5.29 b28.39 ± 23.35 a199.87 ± 22.82 a6.3 ± 0.38 a
Table 2. PERMANOVA test results of significant differences in soil bacterial community structure and Faprotax-predicted functional structure among forest types. (Bold indicates significant differences at the p = 0.05 level).
Community StructureFunctional Structure
R2p-AdjR2p-Adj
All forest types0.1190.0090.0530.255
CF-BF0.3220.0030.1450.114
CF-MF0.3470.0090.1630.179
MF-BF0.1440.0090.0450.479
Table 3. Statistical significance of differences in carbon and nitrogen cycle functions and other metabolic function abundances among forest stands (CF: coniferous forest, BF: broad-leaved forest, MF: mixed forest; bold indicates significant differences between stands, p-adj < 0.05).
FunctionCF-MFCF-BFMF-BF
Carbon Cycle0.865 1.000 0.198
Nitrogen Cycle0.811 1.000 0.135
Sulfur Cycle0.759 0.002 0.102
Manganese Cycle0.459 0.002 0.231
Arsenic Cycle0.157 0.002 0.788
Iron Cycle0.951 1.000 1.000
Chlorine Cycle0.951 1.000 1.000
Chemo-20.574 0.008 0.394
Chemo-11.000 0.635 0.283
Phototrophy1.000 0.027 0.052
Fermentation1.000 1.000 0.585
Anoxygenic Photoautotrophy1.000 0.027 0.135
Aromatic Compound Degradation0.574 0.574 0.394
Hydrocarbon Degradation0.708 0.584 1.000
Methylotrophy1.000 0.159 1.000
Fumrate Respiration1.000 0.966 1.000
Dark Hydrogen Oxidation1.000 0.175 0.555
Knallgas Bacteria1.000 0.077 0.077
Nitrogen Respiration0.165 1.000 0.312
Nitrite Ammonification1.000 0.536 1.000
Denitrification0.136 1.000 0.136
Nitrification0.024 0.001 1.000
Nitrate Reduction1.000 1.000 0.493
Nitrogen Fixation0.217 0.269 1.000
Ureolysis0.124 0.001 0.515
Dark Oxidation of Sulfur Compounds0.534 0.006 0.377
Respiration of Sulfur Compounds1.000 1.000 1.000
Manganese of Oxidation0.459 0.002 0.231
Arsenate Detoxification0.117 0.002 0.948
Dissimilatory Arsenate Reduction0.117 0.002 0.948
Dissimilatory Arsenate Oxidation0.269 0.010 0.982
Iron Respiration0.951 1.000 1.000
Chlorate Reducers1.000 0.309 1.000
Mammal Gut0.574 1.000 0.561
Plant Pathogen0.662 0.128 1.000
Cyanobacteria0.207 0.014 1.000
Table 4. Results of Monte Carlo test for RDA redundancy analysis of plant diversity, plant composition and soil properties on Faprotax-predicted functional structure. (Bold indicates significant differences at the p = 0.05 level).
IndexR2p-Adj
RDA Model 0.013
R0.101 0.363
SHI0.063 0.537
SII0.044 0.656
SHE0.040 0.613
SIE0.052 0.549
P0.098 0.384
YS0.350 0.015
CH0.050 0.612
JQZ0.124 0.180
SY0.746 0.002
CB0.033 0.711
T0.014 0.836
CHS0.007 0.920
SOC0.002 0.980
AN0.244 0.052
AP0.080 0.436
SK0.451 0.002
pH0.428 0.006
Table 5. Comparison of node and edge features between different forest types in taxonomic networks and functional networks.
Network TypeForest TypeNodesEdgesProportion of Positive Edges
Taxonomy networkCF896251.6%
MF14823667.4%
BF15020660.2%
Total51615,12264.0%
Functional abundance networkCF415294.25%
MF5054100%
BF464789.1%
Total7324489.8%
Disclaimer/Publisher’s Note: The statements, opinions and data contained in all publications are solely those of the individual author(s) and contributor(s) and not of MDPI and/or the editor(s). MDPI and/or the editor(s) disclaim responsibility for any injury to people or property resulting from any ideas, methods, instructions or products referred to in the content.