1. Introduction
Bark beetle infestations are endangering forest ecosystems, with coniferous forests worldwide among the most affected [
1,
2]. Bark beetle species cause substantial ecological and economic damage by weakening host trees, reducing growth, and ultimately leading to widespread mortality [
3,
4,
5]. Climate change, drought stress, and forest structure frequently intensify these impacts, collectively enhancing the host tree’s vulnerability and accelerating infestation dynamics [
6,
7].
Timely detection of bark beetle damage is critical for effective forest management. Standard field-monitoring methods take a lot of time and effort and often don’t cover much ground, especially in tough or hard-to-reach places. In this context, Remote Sensing (RS) technologies have emerged as efficient tools for monitoring forest health over vast areas, enabling the detection of vegetation stress and disturbance patterns through spectral responses [
8,
9]. Satellite observations, particularly from Landsat platforms, provide reliable, long-term, and spatially explicit data widely used to assess forest conditions and detect insect-induced disturbances [
10,
11]. RS is extensively employed in monitoring forest health [
12], evaluating beetle outbreaks across temporal and spatial dimensions [
13], identifying bark beetle outbreak zones through periodic data provision [
14,
15], tracking infestations and generating risk maps via infestation modeling [
16,
17,
18,
19], and serves as an effective approach for beetle outbreak investigations [
20].
Bark beetle infestations induce physiological alterations in trees that can be identified in spectral remote sensing data. Once the beetle infests the tree, it induces rapid desiccation of the phloem and xylem, a reduction in water content, and chlorophyll deterioration [
21,
22]. These alterations can be detected by near-infrared (NIR) reflectance and short-wave infrared (SWIR) measurements [
11,
23]. As red band reflectance rises due to chlorophyll depletion and pigment structural degradation, NDVI and NDMI values decline, whereas MSI and RGI values increase [
24,
25].
Vegetation indices derived from multispectral data are frequently used to quantify alterations in canopy structure, chlorophyll concentration, and moisture conditions associated with bark beetle infestations [
8,
11]. The Normalized Difference Vegetation Index (NDVI) is the most widely used index for measuring plant health and greenness. Other indices, such as the Normalized Difference Moisture Index (NDMI), Moisture Stress Index (MSI), Tasseled Cap Wetness (TCW), and Red-Green Index (RGI), provide additional information on plant water status and physiological stress [
11,
26,
27,
28]. Prior research has shown that bark beetle infestations result in quantifiable alterations in these spectral indices due to decreases in chlorophyll concentration, needle wetness, and canopy density.
Most remote sensing research on bark beetle damage has focused on spatial classification, which categorizes pixels or stands into damage classes using supervised or unsupervised classifiers, while neglecting the statistical discriminability of stand-level spectral indices. Support vector machines, random forests, and deep learning architectures enhance mapping precision but fail to identify which indices possess statistically significant discriminatory information or to quantify spectrum changes associated with infestation. Statistical discriminative frameworks, such as nonparametric group comparisons and multivariate analysis, directly assess whether index values differ significantly between damaged and undamaged stands, yielding interpretable and ecologically significant results. This distinction is essential: an index may contribute minimally to a classification ensemble while exhibiting significant univariate discrimination. Establishing a robust scientific basis for indicator selection in actual forest health monitoring necessitates addressing this methodological gap [
28,
29].
Although vegetation indices are commonly employed to identify bark beetle damage, most research has focused on delineating infestation zones or developing predictive models, often prioritizing classification precision at the pixel or landscape level. Nonetheless, the capacity of these indices to statistically distinguish between damaged and undamaged forest regions has been inadequately explored. Specifically, there is a lack of research evaluating whether spectral indices can effectively and consistently differentiate between damaged and unaffected areas, a crucial prerequisite for statistical discrimination.
In this context, it is crucial to assess the discriminatory efficacy of vegetation indices using field-based reference data to determine their ability to differentiate beetle-damaged forest regions from healthy ones. This method facilitates a more comprehensive knowledge of whether spectral differences are both observable and statistically significant, as well as operationally useful for forest management.
Consequently, this study examines the subsequent research question: Can vegetation indices obtained from Landsat 8 OLI images effectively discriminate between forest stands with and without Ips sexdentatus damage at the stand level? This study assesses the discriminatory efficacy of specific vegetation indices (NDVI, NDMI, MSI, TCW, and RGI) by (i) quantifying the spectral index value disparities between damaged and undamaged stands and (ii) evaluating the statistical significance and multivariate separability of these differences through nonparametric and multivariate statistical methods.
2. Materials and Methods
2.1. Study Area and Field Data
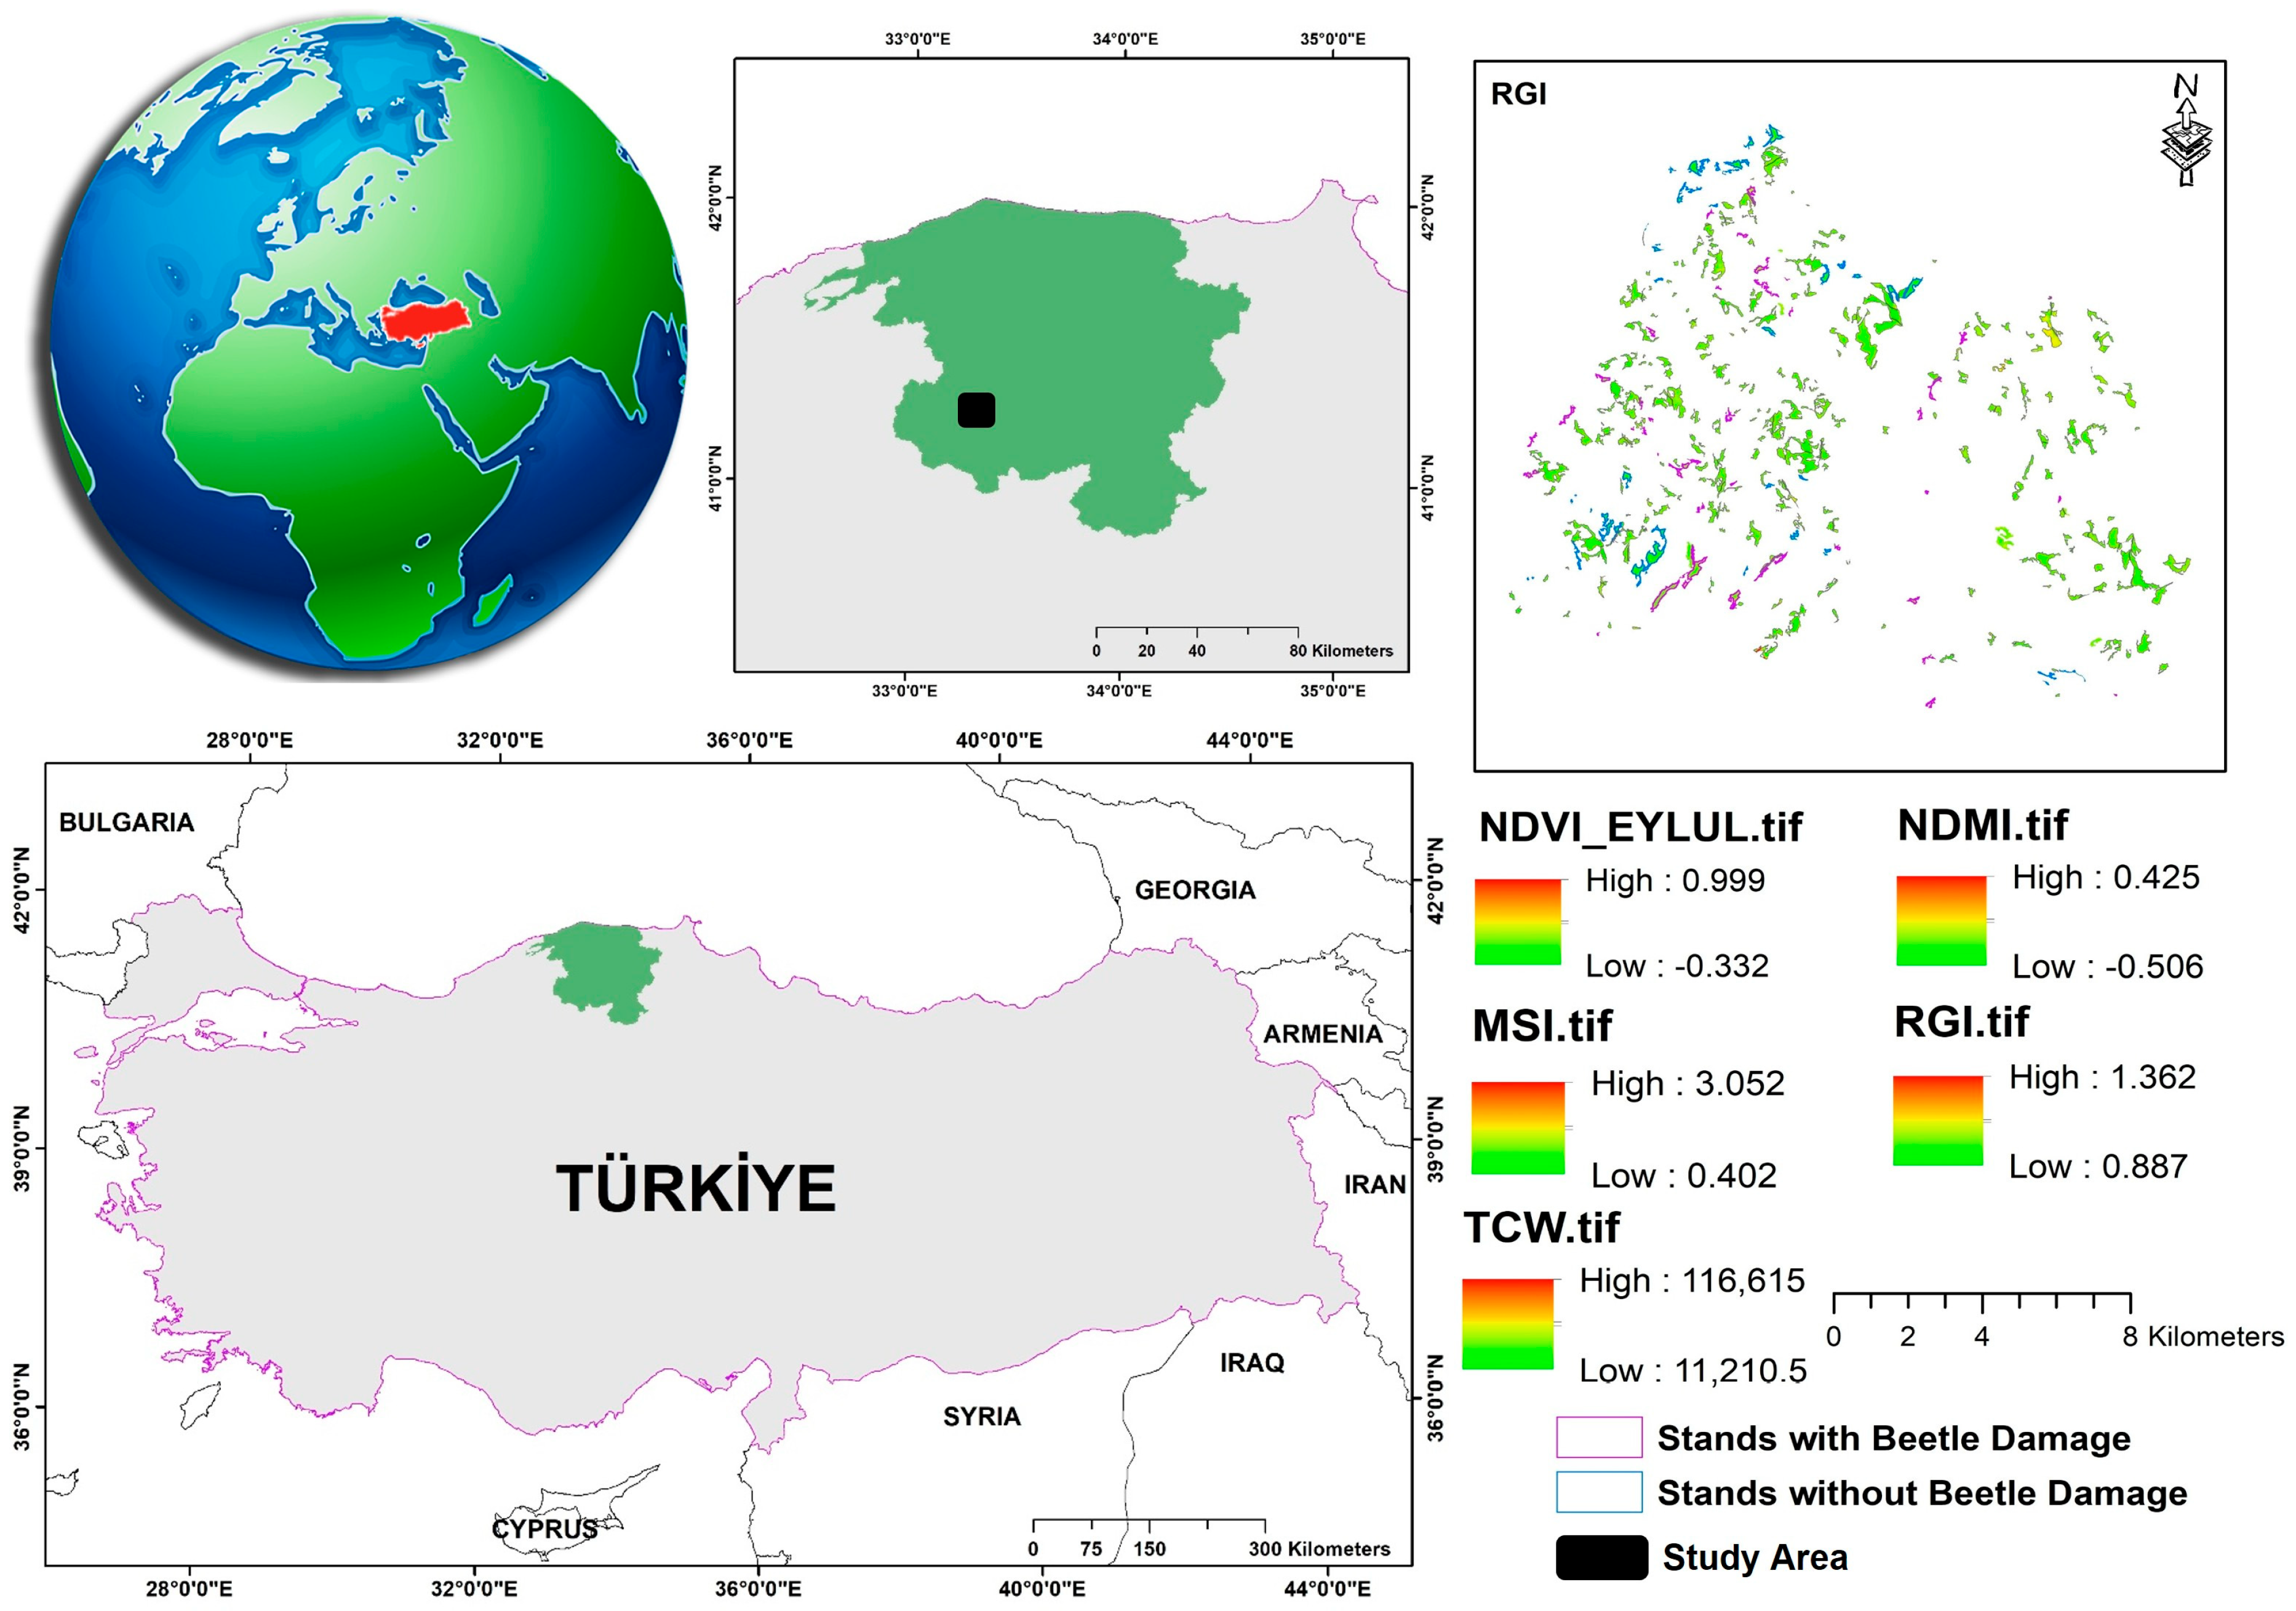
The study was conducted in 2023 at the Araç Forest Directorate (41°24′–41°36′ N, 33°18′–33°36′ E), located within the Kastamonu Regional Directorate of Forestry, Türkiye (
Figure 1). The study area is characterized by predominantly pure and overmature
Pinus nigra stands with moderate crown closure, where
Ips sexdentatus infestations are frequently observed. Monthly from May to November, two experienced forest engineers conducted field surveys to identify stands affected by bark beetle damage. In trees infested by
Ips sexdentatus, little entry holes are evident in the bark, accompanied by reddish brown boring dust and minimal resin exudation. Subsequently, the needles transition from bright green to yellow and ultimately to brown in the later phases and eventually die on old or weakened trees [
30]. Stands with trees displaying these symptoms were classified as damaged forest stands. GPS coordinates of the stand were recorded using a Garmin GPSMAP 66i device (Garmin International Inc., Olathe, KS, USA) (positional accuracy ± 3 m).
A total of 80 forest stands were selected for analysis, comprising 40 stands with confirmed I. sexdentatus damage and 40 stands without observable damage. To minimize potential confounding effects, stands were selected to be as homogeneous as possible in the same tree species (Pinus nigra), age class (mature), and canopy closure (40%–70%). After this phase, forest stands with and without I. sexdentatus damage was incorporated into the stand map within the ArcGIS environment.
2.2. Image Processing
Landsat 8 OLI satellite imagery was used to compute spectral vegetation indices, including NDVI, NDMI, MSI, TCW, and RGI, for stands with and without beetle damage. Cloud-free satellite images (cloud cover < 5%) acquired on 23 September 2023 were obtained at no cost from
https://earthexplorer.usgs.gov (accessed on 12 March 2025) (
Table 1). This date was selected because late-season imagery shows the greatest spectral contrast between healthy and infested trees, due to physiological damage, including chlorophyll depletion and needle desiccation. Alterations in canopy structure are most pronounced by late summer to early autumn following spring–summer beetle colonization, while affected trees retain their foliage.
Pre-processing steps were applied, including atmospheric correction (level-2 surface reflectance), radiometric calibration, and cloud masking with QGIS to prepare the Landsat 8 OLI satellite images for examination in the study. The imagery was provided in GeoTIFF format at 30 m resolution, georeferenced to UTM Zone 36N (WGS84), with a root-mean-square error (RMSE) of less than 0.5 pixels, thereby satisfying the conventional accuracy criteria for stand-level vegetation index extraction. The digital numbers of the bands designated for NDVI, NDMI, MSI, TCW, and RGI were converted to reflectance values. NDVI, NDMI, MSI, TCW, and RGI were computed from the acquired reflectance values. Pixel-based index values were extracted and averaged for each stand to obtain summary statistics (mean, minimum, and maximum), therefore minimizing within-stand variability and ensuring comparability among stands of different sizes.
2.3. Vegetation Indices
Spectral reflectance data from Landsat-8 images were used to compute primary vegetation indices to detect changes in plant photosynthetic activity and biochemical stress, as well as other types of vegetation stress [
31,
32]. Spectral vegetation indices contain optical vegetation canopy (greenness), which integrates foliar biochemical parameters (chlorophyll, nitrogen, and leaf water content) with additional canopy characteristics [
33].
Vegetation indices are widely used to detect and assess forest stands affected by bark beetle infestations. In this study, five vegetation indices (NDVI, NDMI, MSI, TCW, and RGI) were derived from Landsat imagery, as previous research has shown they effectively capture changes in forest condition and mortality [
34,
35] (
Table 2). These indices were chosen because bark beetle infestations are known to alter multiple physiological and structural properties of trees, including chlorophyll content, crown structure, and moisture levels [
11,
25,
36,
37]. By combining indices that respond to these different factors, a more comprehensive and reliable assessment of spectral changes associated with infestation can be achieved.
The mean, minimum, and maximum values for NDVI, NDMI, MSI, TCW, and RGI were computed for forest stands with and without beetle damage using ArcGIS 10.8, considering the varying area of each stand and the differing number of pixels associated with it.
2.4. Statistical Analysis
Descriptive statistical information, including mean, standard deviation, minimum, and maximum values for each vegetation index, was calculated according to groups. This analysis was performed to reveal the overall effect of beetle damage on spectral indicators.
Normality analysis (Kolmogorov–Smirnov) was performed to determine whether the vegetation index values (NDVI, NDMI, MSI, TCW, and RGI) met the assumptions of parametric tests. Since the data did not meet the normality assumptions, the Mann–Whitney U test, a nonparametric test, was used. The Mann–Whitney U test was used to assess differences in vegetation index values (minimum, maximum, and mean) between damaged and undamaged stands. Statistical significance was assessed at the 95% confidence level (
p < 0.05). Differences in vegetation indices between damaged and undamaged stands were evaluated using Mann–Whitney U tests. Effect sizes were calculated for Mann–Whitney U tests [
42,
43]. Effect size thresholds are 0.10 (small), 0.30 (medium), and 0.50 (large) [
44].
MANOVA was applied to determine multivariate differences between groups by analyzing vegetation indices together. In the analysis, all vegetative indices (minimum, maximum, and mean values of NDVI, NDMI, MSI, RGI, and TCW) were used as dependent variables, with group (stands with and without Ips sexdentatus damage) as the independent variable. The importance of the group effect was assessed utilizing the Pillai Trace statistic. Principal Component Analysis (PCA) was utilized to investigate the correlations among the variables in the dataset. The FactoMineR package in R was used to perform PCA on all 15 numeric variables, including the minimum, maximum, and mean values of the five vegetation indices (NDVI, NDMI, MSI, TCW, and RGI). Standardization was employed to ensure that each variable contributed equally to the analysis, regardless of its magnitude, since vegetation indices operate on distinct numerical scales. The correlation matrix of the standardized variables was eigendecomposed to transform intercorrelated vegetation index variables into orthogonal principal components and mitigate multicollinearity. Group membership (with and without beetle damage) was utilized to color-code observations following the projection of stand scores into the two-dimensional space defined by the first two principal components. Using the within-group covariance structure of the principal component scores, 95% concentration ellipses were constructed for each group to visually assess their separation.
False discovery rate (FDR) approach was employed to regulate the family-wise Type I error rate over the 15 pairwise comparisons for all
p-values [
45]. The FDR approach was favored over the Bonferroni correction due to its superior statistical power in exploratory ecological investigations, while effectively reducing the anticipated proportion of false positives among rejected hypotheses [
46]. All significance ratings presented in
Table 3 are derived from BH-adjusted
p-values.
All statistical analyses were conducted in R (version 4.5.3). Spatial data pre-processing was performed in QGIS (version 3.44) and ArcGIS (version 10.8). The normality assumption was evaluated using the Kolmogorov–Smirnov test [
47]. Group comparisons were conducted using the Mann–Whitney U test [
48]. MANOVA assessed multivariate group separation with Pillai’s Trace statistic [
49,
50].
3. Results
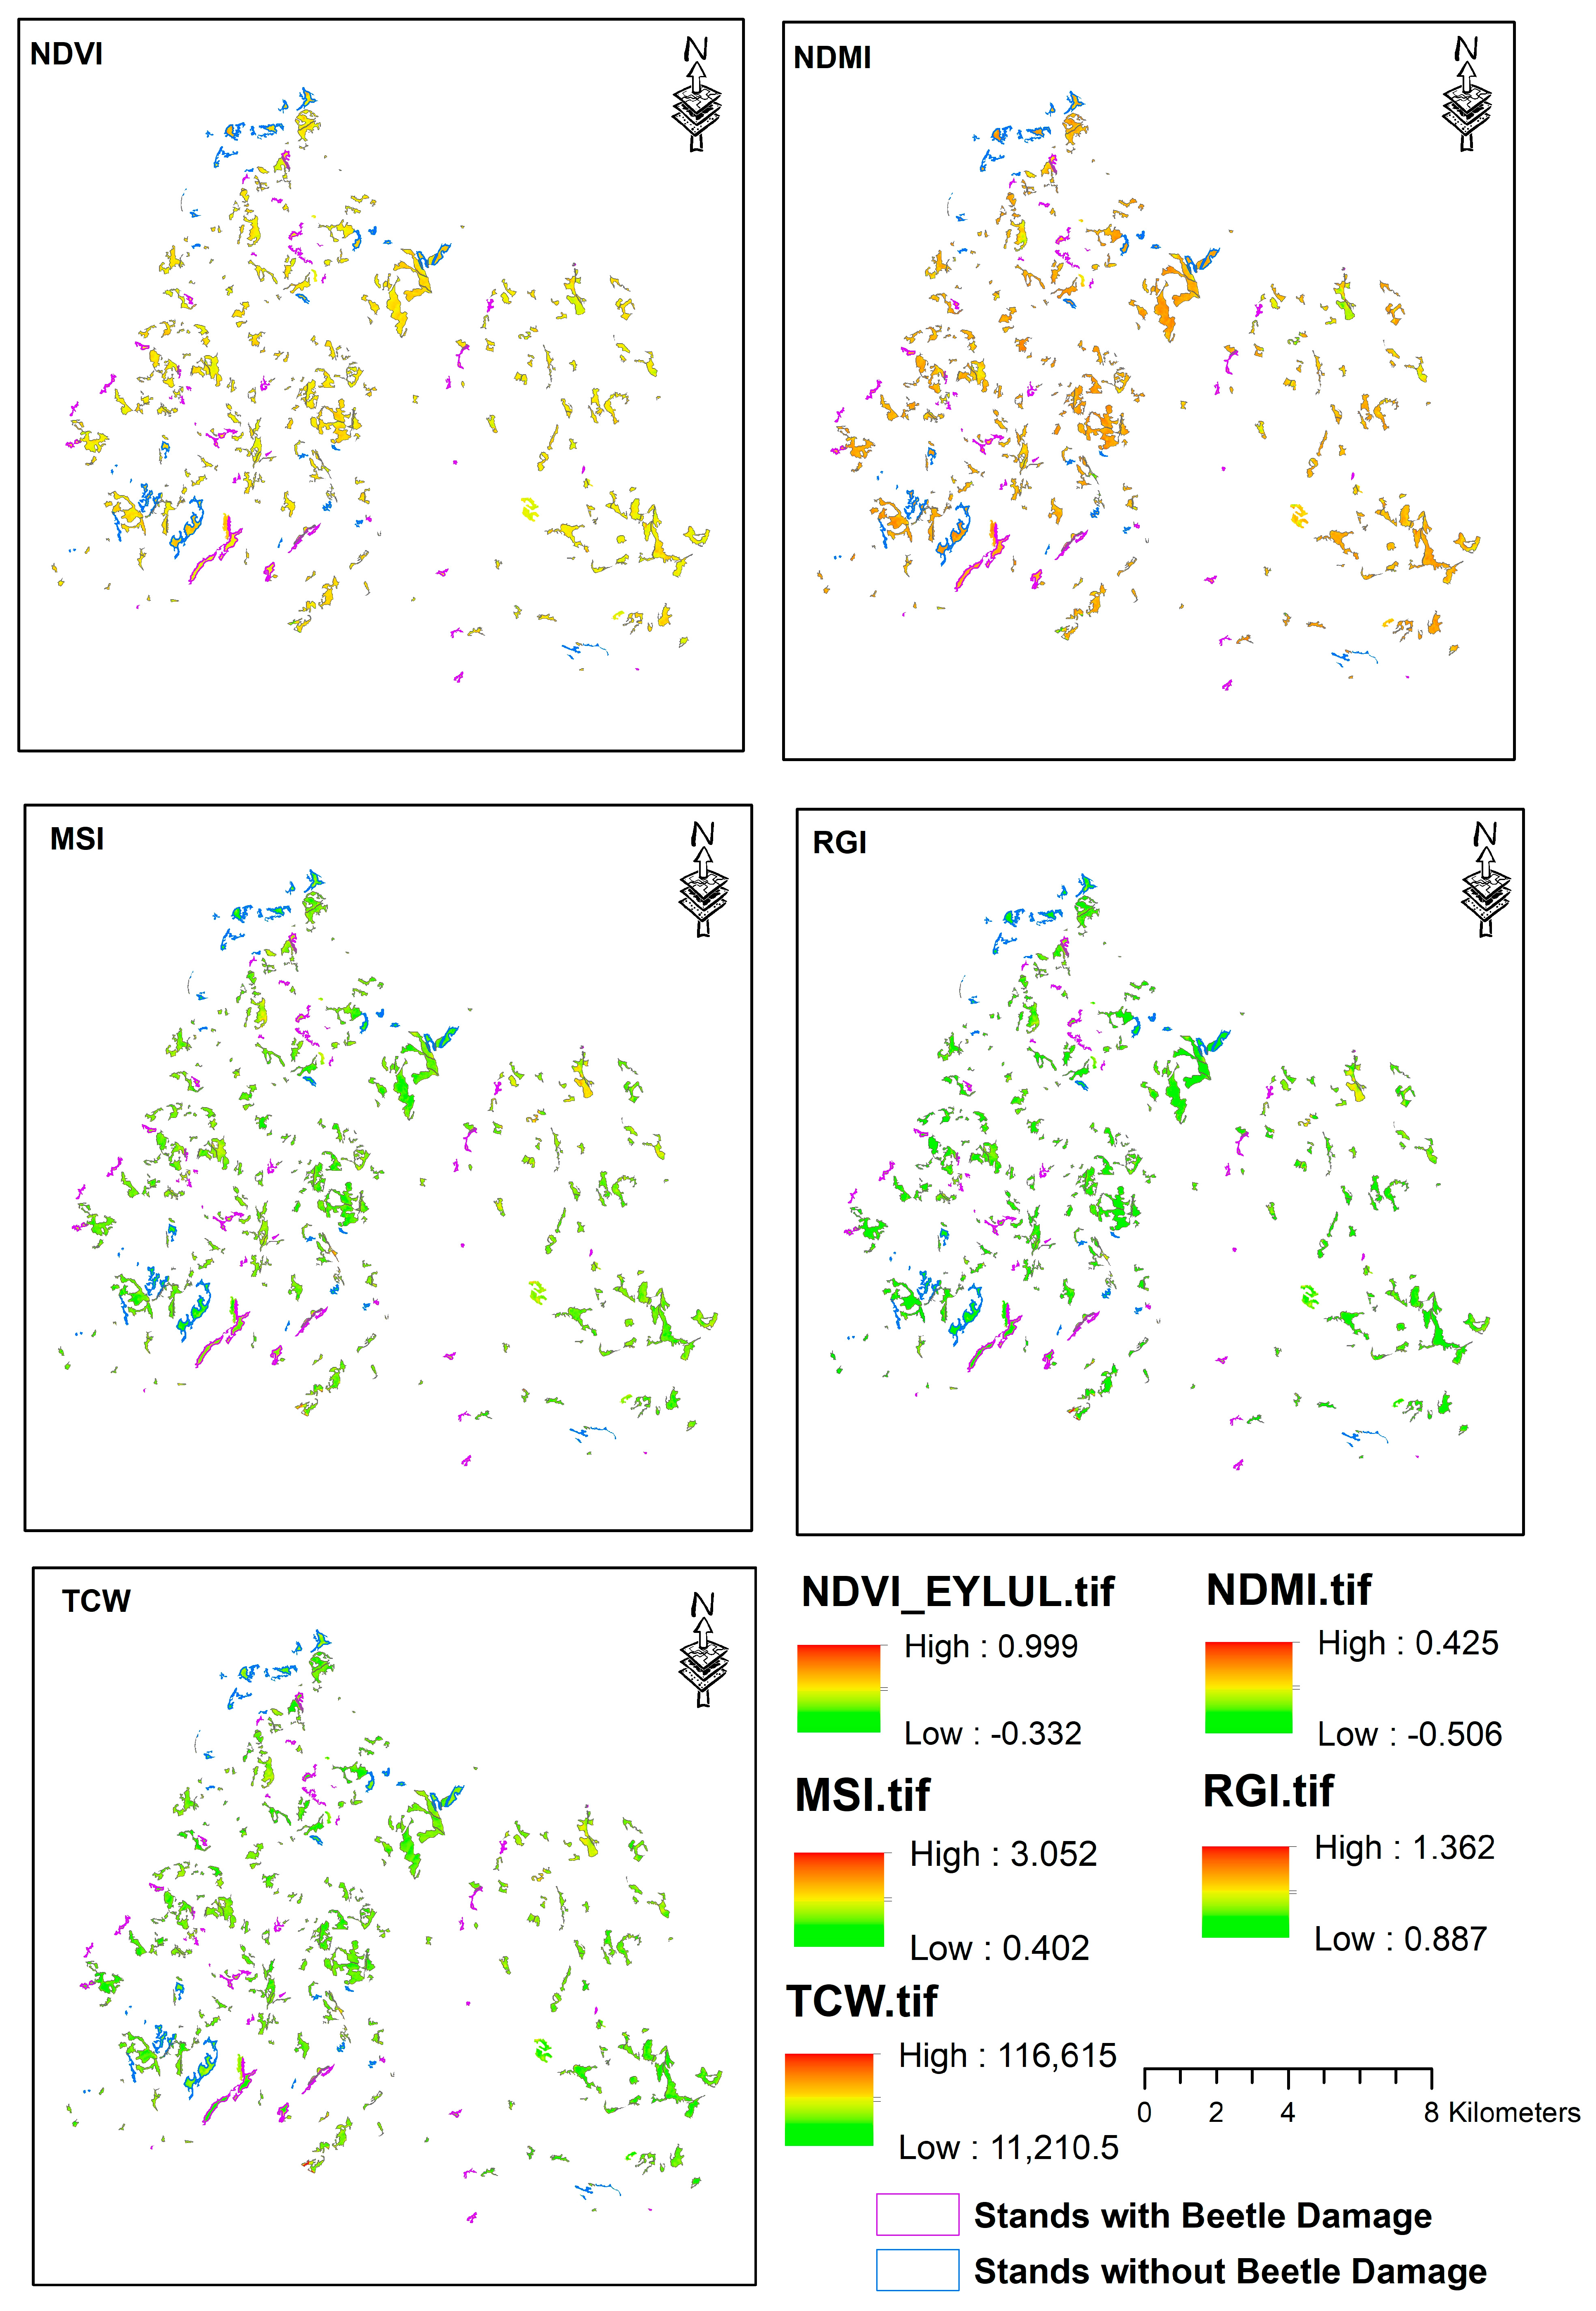
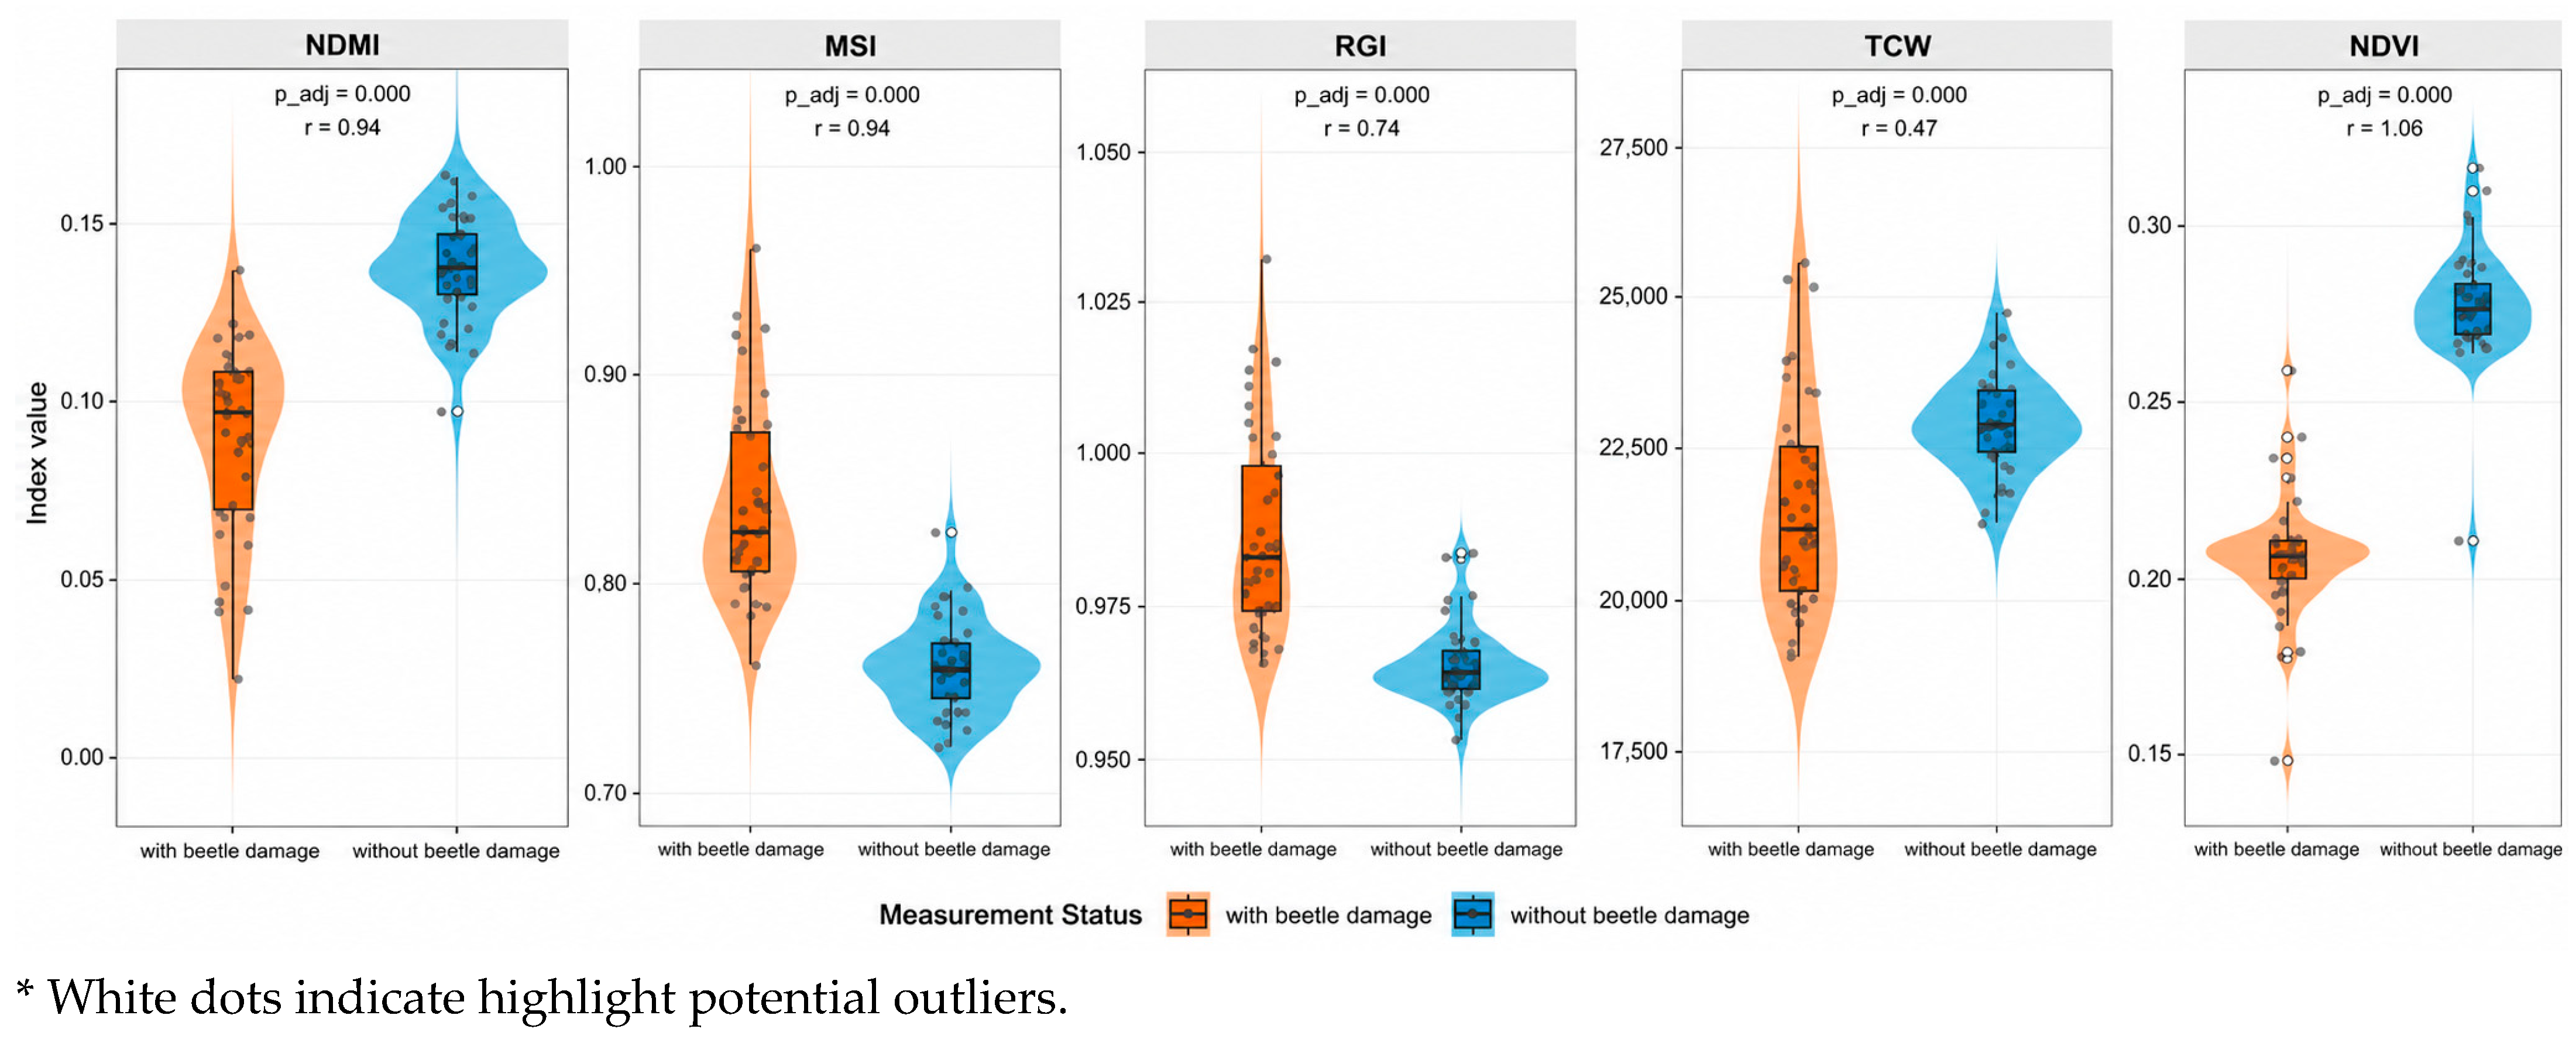
The minimum, maximum, and mean values of the NDVI, NDMI, MSI, TCW, and RGI indices for stands with and without beetle damage were assessed for normality using the Kolmogorov–Smirnov (K-S) test, which indicated non-normal distributions. The Mann–Whitney U test, a nonparametric statistical method, was used to assess differences in the minimum, maximum, and mean values of the NDVI, NDMI, MSI, TCW, and RGI indices between regions with and without beetle damage (
Figure 2,
Table 3).
Effect sizes for Mann–Whitney U tests were computed. The effect sizes for mean vegetation indices varied from r = 0.310 (TCW) to r = 1.064 (NDVI), signifying substantial to exceedingly substantial practical differences between groups. The MANOVA yielded a partial η2 of 0.87 (Pillai’s Trace = 0.870, F(16,63) = 26.35, p < 0.001), indicating a high multivariate effect (η2 > 0.14).
Figure 3 displays violin and box plots for all five vegetation indices (NDMI, MSI, RGI, TCW, NDVI), demonstrating distributional differences between damaged and undamaged stands. In all five indices, the two groups exhibit distinctly non-overlapping central tendencies, corroborated by the statistical test results. An r value for NDVI over 1.0 signifies near-perfect rank separation and should be considered as indicative of a substantial effect.
The results demonstrate statistically significant differences in vegetative indicators (NDVI, NDMI, MSI, TCW, and RGI) between stands both with and without beetle damage. Only the TCW(max.) index showed no statistically significant difference between stands with and without beetle damage. The decreased NDVI and NDMI values, along with increased MSI values in stands affected by beetle damage, emphasize the impact of such damage on plant physiology. This indicates diminished photosynthetic activity, lowered chlorophyll levels, and increased water stress in compromised trees. The substantial Mann–Whitney U test results at the p < 0.001 threshold indicate that vegetation indices exhibit considerable sensitivity in discriminating between beetle-damaged and undamaged vegetation. The enhanced discrimination offered by average values such as NDVI(mean) and NDMI(mean) indicates that these metrics more accurately reflect overall stand-level conditions by minimizing spectral noise.
The increased RGI indices in regions with beetle damage, as opposed to those without, can be attributed to alterations in pigment structure, particularly an increase in red band reflectance. In the TCW index, although the minimum and average values exhibit considerable disparities, the maximum values are statistically insignificant, suggesting that diverse pixel structures and outliers may influence this parameter.
The mean-rank analysis indicates that the employed vegetation indices are reliable and significant in discriminating between beetle-damaged and undamaged vegetation. NDVI and NDMI values were significantly elevated in stands without beetle damage, whereas MSI and RGI values were greater in stands affected by beetle damage. These divergent yet complementary findings indicate that vegetation indices reliably reflect plant health and stress levels across different perspectives.
MANOVA analysis revealed that when all vegetation indices were used as dependent variables, they provided a statistically significant and strong distinction between the groups (Pillai’s Trace = 0.870, F = 28.528, p < 0.001, partial η2 = 0.87, indicating a very large multivariate effect size). The high Pillai Trace value suggests that both stands, with and without damage, account for a substantial percentage of the multivariate variation, indicating a strong discriminatory capability of this variable combination. This indicates that vegetation indices, when evaluated together rather than in isolation, more thoroughly reflect structural and physiological disparities in stand health. The results indicate that vegetation indices derived from Landsat 8 OLI data are a dependable and efficient tool for the early identification and surveillance of beetle damage in forest ecosystems.
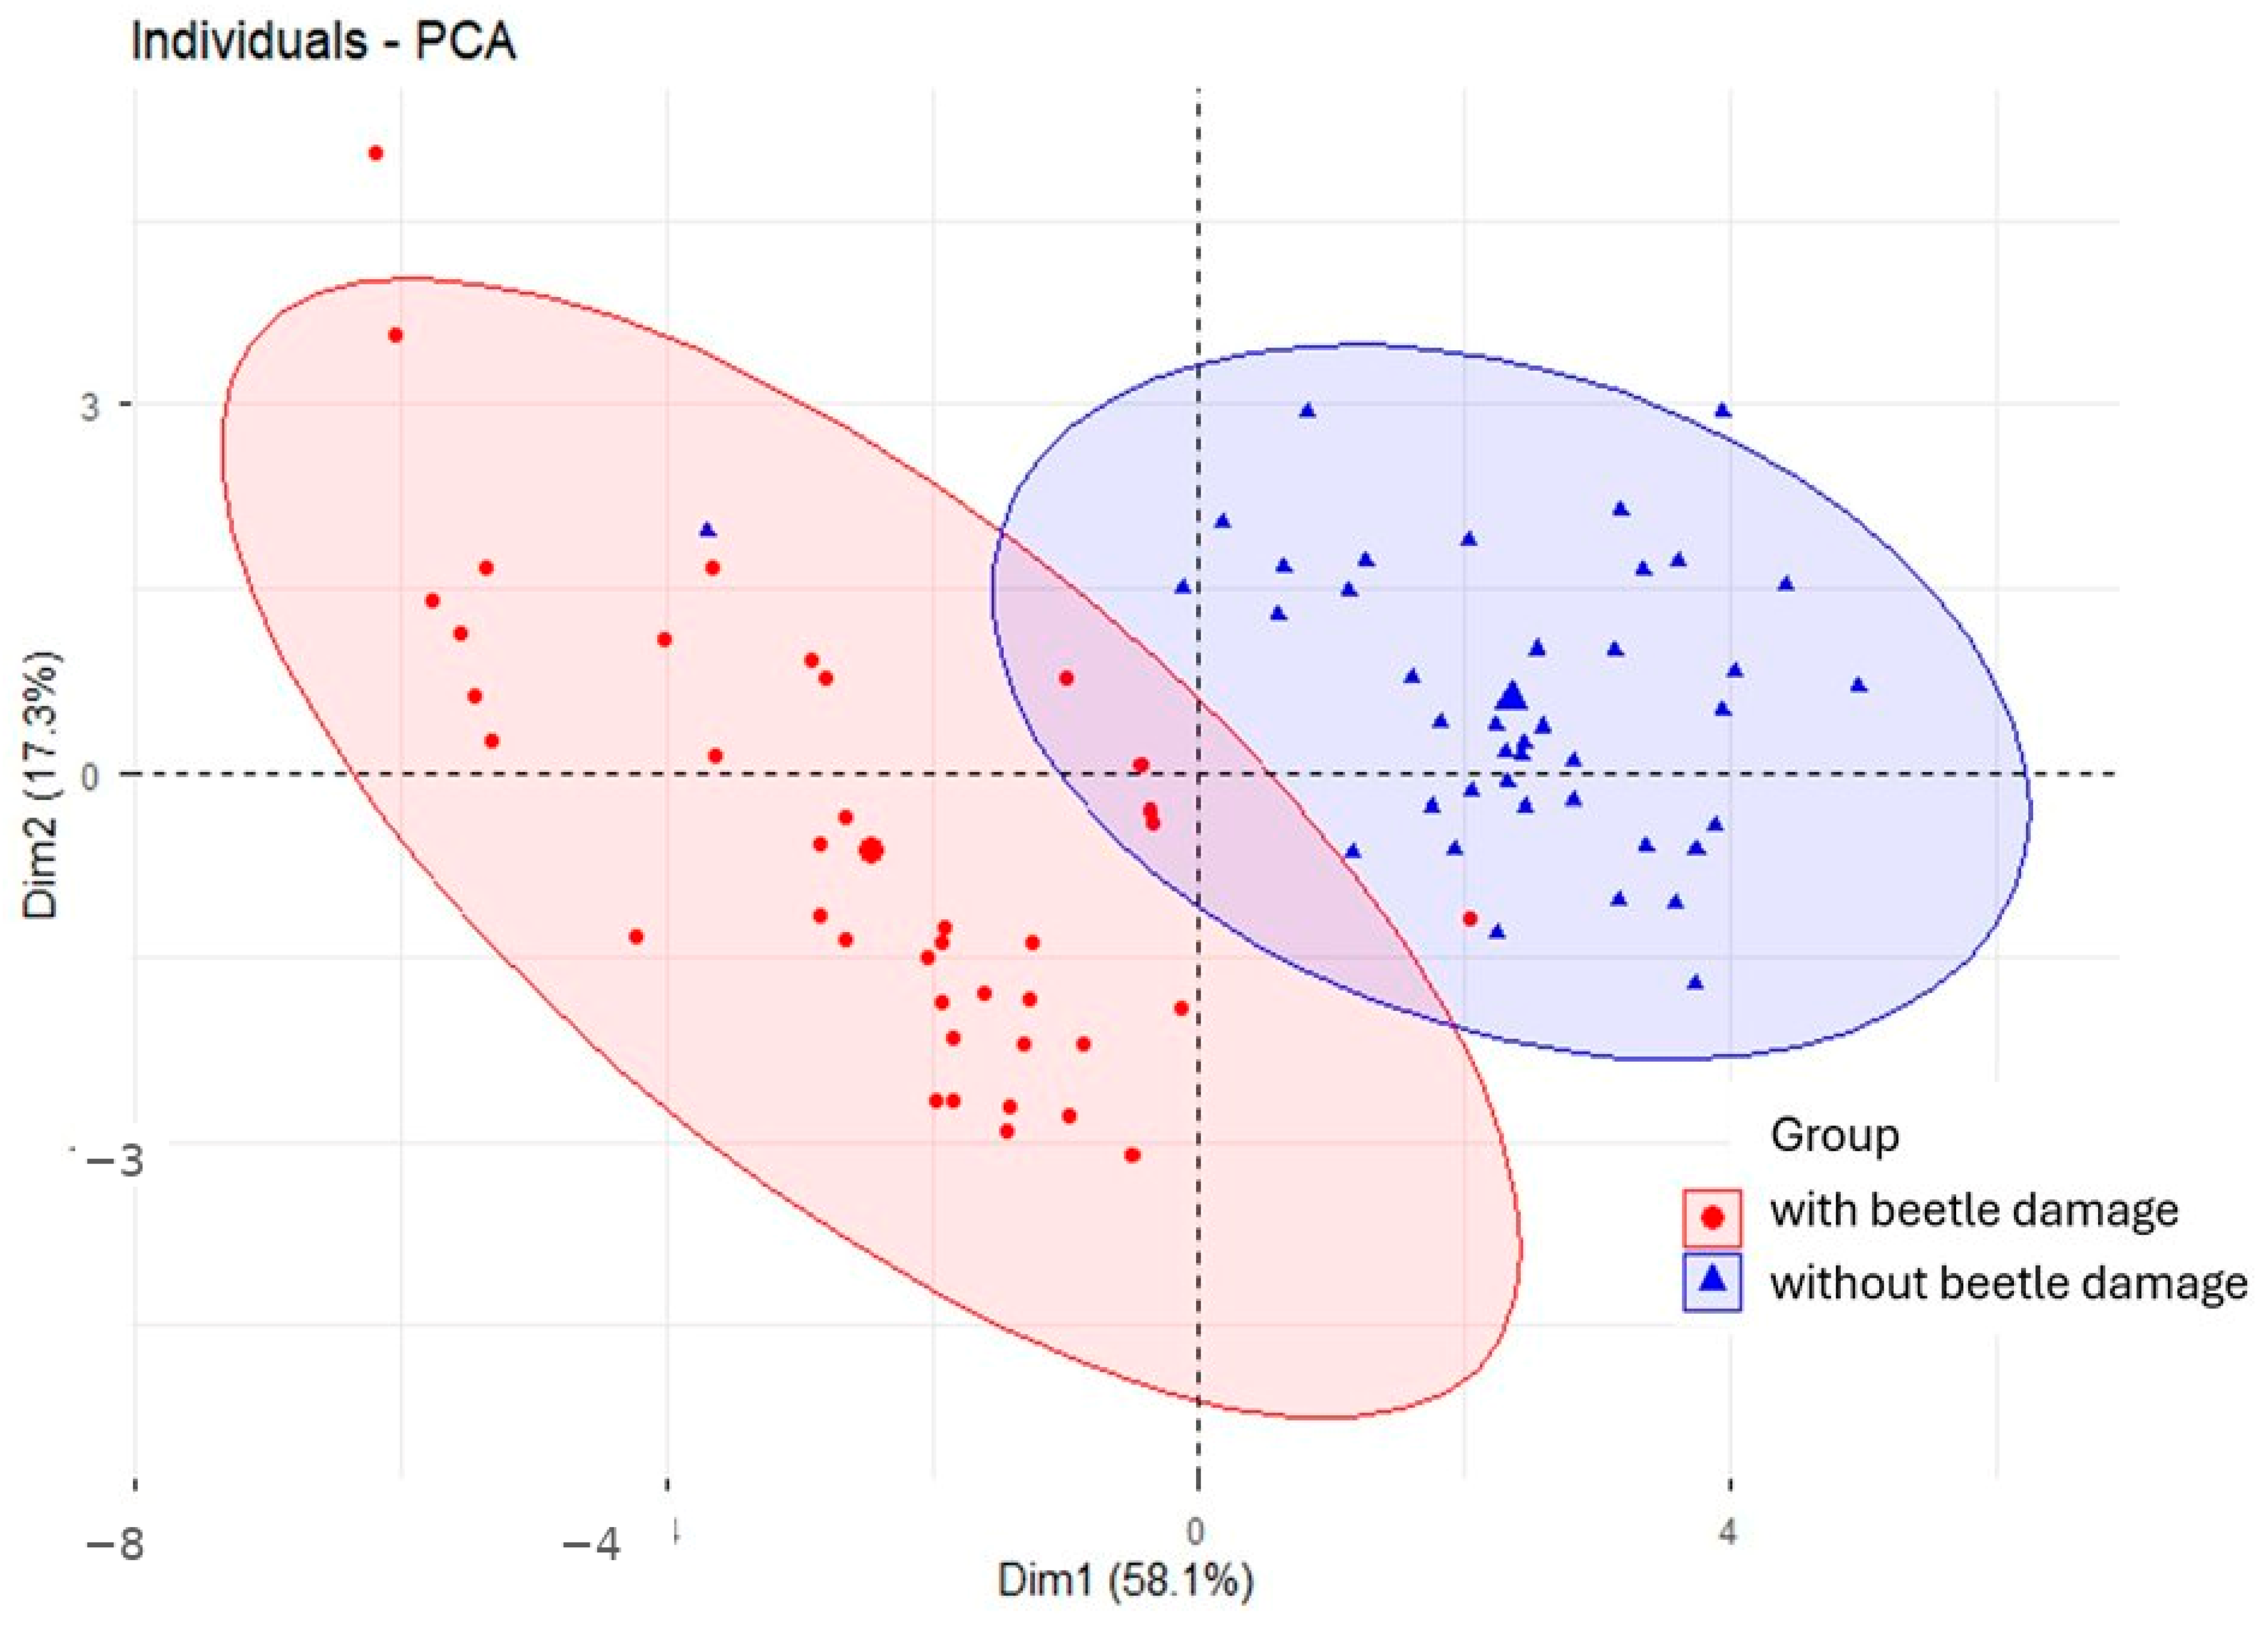
The principal component analysis (PCA) results indicate that two primary components (Dim1 = 58.1% and Dim2 = 17.3%) account for roughly 75.4% of the overall variance (
Figure 4). The result shows distinct separation between stands with and without damage in multidimensional space. This indicates that spectral variables collectively possess significant categorization capability.
The results indicate that vegetation indices (NDVI, NDMI, MSI, RGI, and TCW) may effectively differentiate between stands with and without damage. The low NDVI and NDMI values in beetle-damaged stands, along with the elevated MSI and RGI values, underscore the impact of bark beetle damage on plant physiology. In summary, NDVI(mean), NDMI(mean), and MSI(mean) demonstrated the most robust discriminatory capability between damaged and undamaged stands. Damaged stands consistently exhibited reduced greenness and moisture-related index values, whereas stress-related indices considerably increased. Multivariate analyses further validated that the integrated application of vegetation indices significantly enhanced discrimination efficacy.
4. Discussion
Assessing the health of forest ecosystems is crucial for conserving biodiversity and developing effective pest management techniques [
51]. Remote sensing techniques have significant potential for monitoring bark beetle infestations, identifying damaged regions, and performing risk assessments [
8,
52], with their relevance in assessing bark beetle infestations on the rise [
53].
The results of this study clearly indicate that vegetation indices (NDVI, NDMI, MSI, RGI, and TCW) are highly effective in discriminating between stands affected by beetle damage and those that are not. The low NDVI and NDMI values in beetle-damaged stands, along with elevated MSI and RGI values, serve as robust indications of the impact of bark beetle damage on plant physiology. The results indicate that remote sensing data can effectively monitor processes such as reduced photosynthetic activity, chlorophyll degradation, and heightened water stress. These results align with the existing research. Hladky et al. [
54] showed that vegetation indices using SWIR bands (e.g., NDMI) offer superior predictions of vegetation changes resulting from beetle damage.
Elevated MSI values and statistically significant RGI values in stands impacted by beetle damage correlate with the degradation of plant pigment structure and an increase in red-band reflectance. Notable alterations in reflectance were detected in the red-edge and SWIR regions of spruce trees impacted by beetle infestation; these alterations were clearly evident in indices of chlorophyll content and leaf intercellular architecture. RGI’s foundation on red-band reflectance is physiologically coherent, as it directly quantifies the physiological deterioration process [
25]. The near-infrared (NIR) and short-wave infrared (SWIR) regions of the electromagnetic spectrum demonstrated excellent distinguishability between healthy and early-infected pixels [
23].
Studies indicate that NDVI and BNDVI had excellent efficacy in identifying infested trees, with sensitivities of up to 90%, and sensitivity increased notably with increasing time since bark beetle infestation [
53]. Jamali et al. [
55] conducted a study on the early detection of
Ips typographus bark beetle outbreaks using four distinct vegetation indicators, concluding that NDVI achieved the highest detection accuracy at 87.89%. This study demonstrated statistically significant differences in NDVI(min.), NDVI(max.), and NDVI(mean) values between stands with and without
Ips sexdentatus damage. Upon examination of NDVI(min.), NDVI(max.), and NDVI(mean) values, it was observed that the values in stands exhibiting beetle damage were inferior to those in stands devoid of beetle damage. This indicates that beetle damage diminishes the NDVI value. Healthy plants typically exhibit higher reflectance in the near-infrared spectrum than diseased or stressed plants, enabling differentiation across species. In coniferous trees infested by
Ips typographus,
Ips acuminatus, and
Ips sexdentatus, NDVI values were decreased compared to those in healthy forests [
46]. Research in Norway spruce forest revealed that
Ips typographus infestation decreased NDVI values by 0.20–0.25 [
56]. While most vegetation indices showed statistically significant differences, the degree of discrimination varied among them. NDVI (mean) and NDMI (mean) exhibited the most distinct and reliable differentiation among stand conditions, suggesting enhanced operational use for bark beetle monitoring.
The primary cause of the decreased reflectance values is the drying of tree foliage due to beetle infestation. Bark beetle infestations alter the spectral characteristics of trees and needles by modifying their biophysical and metabolic properties [
21]. These assaults result in reduced water content in trees, reduced chlorophyll levels in leaves, and structural alterations in the spongy mesophyll [
22]. These alterations enable the early detection of changes in forest health by remote sensing techniques [
57]. Determination of beetle outbreaks at the initial stage in hard-to-reach forested areas seems possible using NDVI maps [
58]. This study demonstrates the analysis and mapping of bark beetle damage with NDVI. Such applications will facilitate the planning of appropriate, timely adjustments to prevent adverse effects on forest ecosystems.
This research utilized a single satellite image (Landsat 8) from a certain date. This constrains the capacity to clarify the temporal dynamics of bark beetle infestations. Moreover, using average vegetation index values across stands may diminish sensitivity to beetle damage across varied environments, particularly because these averages can obscure the specific conditions that contribute to beetle infestations and their impacts on different vegetation types. Future research should focus on using multi-temporal, higher-resolution spatial data to detect beetle damage. The application of machine learning algorithms alongside vegetation indices for damage identification warrants evaluation.
5. Conclusions
The results indicate that the NDVI, NDMI, and MSI indices demonstrated statistically significant spectral differences between damaged and undamaged stands. Due to their consistently significant effect sizes and unambiguous group separation among damaged and undamaged stands, NDVI(mean) and NDMI(mean) were the most practicable discriminators. The TCW index, however, showed limited differentiation at its peak values. These findings underscore the efficacy of using remote-sensing-derived vegetation indices for detecting and monitoring forest pests. TCW(max) revealed little statistical separation, suggesting that within-stand variability and spectral heterogeneity may affect some moisture-related parameters. PCA explained 75.4% of the variation, while MANOVA showed significant multivariate separation (Pillai’s Trace = 0.870), confirming that integrated vegetation indices can distinguish damaged and undamaged stands.
Ongoing monitoring of high-risk regions using remote sensing techniques and assessing affected areas over time is essential for understanding beetle behavior. The results suggest that Landsat-derived vegetation indices may be a cost-effective and operationally feasible method for regional monitoring of bark beetle damage, especially in areas where field surveys are difficult or time-consuming. Consequently, extensive data collection across vast regions using cost-effective, labor-intensive techniques will inform the development of more efficient pest control strategies. The anticipated outcomes will help mitigate harm to forest resources and implement essential measures to sustain the forest ecosystem. The results are predominantly relevant to the ecological and spectral conditions in the study area and require validation across diverse forest ecosystems before broader application.
Author Contributions
Conceptualization, F.S., G.E.Ö., K.E. and F.L.; methodology, F.S., G.E.Ö., K.E., F.L., L.P. and I.M.; validation, F.S., G.E.Ö., K.E., F.L., L.P. and I.M.; formal analysis, F.S., G.E.Ö. and K.E.; investigation, F.S., G.E.Ö., K.E., F.L., L.P. and I.M.; resources, F.S., G.E.Ö., K.E., F.L., L.P. and I.M.; data curation, F.S., G.E.Ö., K.E., F.L., L.P. and I.M.; writing—original draft preparation, F.S., G.E.Ö., K.E., F.L., L.P. and I.M.; writing—review and editing, F.S., G.E.Ö., K.E., F.L., L.P. and I.M.; visualization, F.S., G.E.Ö., K.E., F.L., L.P. and I.M.; supervision, F.S., G.E.Ö., K.E., F.L., L.P. and I.M. All authors have read and agreed to the published version of the manuscript.
Funding
This study was supported by the TÜBİTAK (Project ID 122N293).
Data Availability Statement
Data will be made available upon request.
Acknowledgments
We would like to express our gratitude to the personnel of the Kastamonu Regional Directorate of Forestry for their support for the study.
Conflicts of Interest
The authors declare no conflicts of interest.
References
- Müller, J.; Bußler, H.; Goßner, M.; Rettelbach, T.; Duelli, P. The European spruce bark beetle Ips typographus in a national park: From pest to keystone species. Biodiv. Conserv. 2008, 17, 2979–3001. [Google Scholar] [CrossRef]
- Hernandez, A.J.; Saborio, J.; Ramsey, R.D.; Rivera, S. Likelihood of occurrence of bark beetle attacks on conifer forests in Honduras under normal and climate change scenarios. Geocarto Int. 2012, 27, 581–592. [Google Scholar] [CrossRef]
- Modlinger, R.; Pešková, V.; Zelený, J.; Macháčová, M.; Leiner, M.; Tyšer, D.; Nakládal, O.; Zumr, V.; Surový, P. Ectomycorrhizal response to bark beetle attack: A comparison of dead and surviving trees. Front. For. Glob. Change 2025, 8, 1492622. [Google Scholar] [CrossRef]
- Jian, S.; Han, Y.; Kasanen, R.; Honkaniemi, J.; Junttila, S.; Asiegbu, F.O. Implications for the distributional range of the European bark beetles under future climate change. Sci. Rep. 2025, 15, 29556. [Google Scholar] [CrossRef] [PubMed]
- Trigubenko, A.; Lopez Caceres, M.L.; Shimizu, H.; Shestakova, T.A.; Bukin, V.; Kojima, N. Assessment of Physiological Stress and Bark Beetle-Induced Mortality in Fir Trees, Zao Mountains, Japan. EGUsphere 2026, 1–31. [Google Scholar] [CrossRef]
- Singh, V.V.; Naseer, A.; Mogilicherla, K.; Trubin, A.; Zabihi, K.; Roy, A.; Jakuš, R.; Erbilgin, N. Understanding bark beetle outbreaks: Exploring the impact of changing temperature regimes, droughts, forest structure, and prospects for future forest pest management. Rev. Environ. Sci. Biotechnol. 2024, 23, 257–290. [Google Scholar] [CrossRef]
- Das, A.K.; Baldo, M.; Dobor, L.; Seidl, R.; Rammer, W.; Modlinger, R.; Washaya, P.; Merganičová, K.; Hlásny, T. The increasing role of drought as an inciting factor of bark beetle outbreaks can cause large-scale transformation of Central European forests. Landsc. Ecol. 2025, 40, 108. [Google Scholar] [CrossRef] [PubMed]
- Senf, C.; Seidl, R.; Hostert, P. Remote sensing of forest insect disturbances: Current state and future directions. Int. J. Appl. Earth Obs. Geoinf. 2017, 60, 49–60. [Google Scholar] [CrossRef]
- Kozhoridze, G.; Korolyova, N.; Jakuš, R. Norway spruce susceptibility to bark beetles is associated with increased canopy surface temperature in a year prior disturbance. For. Ecol. Manag. 2023, 547, 121400. [Google Scholar] [CrossRef]
- Franklin, J.F.; Spies, T.A.; Van Pelt, R.; Carey, A.B.; Thornburgh, D.A.; Berg, D.R.; Lindenmayer, D.B.; Harmon, M.E.; Keeton, W.S.; Shaw, D.C.; et al. Effectiveness of pheromone traps for the European spruce bark beetle: A comparative study of four commercial products and two new models. Cent. Eur. For. J. 2016, 62, 207–215. [Google Scholar] [CrossRef]
- Meddens, A.J.; Hicke, J.A.; Vierling, L.A.; Hudak, A.T. Evaluating methods to detect bark beetle-caused tree mortality using single-date and multi-date Landsat imagery. Remote Sens. Environ. 2013, 132, 49–58. [Google Scholar]
- Honkavaara, E.; Näsi, R.; Oliveira, R.; Viljanen, N.; Suomalainen, J.; Khoramshahi, E.; Hakala, T.; Nevalainen, O.; Markelin, L.; Vuorinen, M.; et al. Using multitemporal hyper-and multispectral UAV imaging for detecting bark beetle infestation on norway spruce. Int. Arch. Photogramm. Remote Sens. Spat. Inf. Sci. 2020, 43, 429–434. [Google Scholar]
- McDowell, N.G.; Coops, N.C.; Beck, P.S.; Chambers, J.Q.; Gangodagamage, C.; Hicke, J.A.; Huang, C.; Kennedy, R.; Krofcheck, D.J.; Litvak, M.; et al. Global satellite monitoring of climate-induced vegetation disturbances. Trends Plant Sci. 2015, 20, 114–123. [Google Scholar] [CrossRef]
- Schlyter, F.; Birgersson, G.; Byers, J.A.; Löfqvist, J.; Bergström, G. Field response of spruce bark beetle, Ips typographus, to aggregation pheromone candidates. J. Chem. Ecol. 1987, 13, 701–716. [Google Scholar] [CrossRef]
- Hall, R.J.; Castilla, G.; White, J.C.; Cooke, B.J.; Skakun, R.S. Remote sensing of forest pest damage: A review and lessons learned from a Canadian perspective. Can. Entomol. 2016, 148, S296–S356. [Google Scholar] [CrossRef]
- Havašová, M.; Bucha, T.; Ferenčík, J.; Jakuš, R. Applicability of a vegetation indices-based method to map bark beetle outbreaks in the High Tatra Mountains. Ann. For. Res. 2015, 58, 295–310. [Google Scholar] [CrossRef]
- Özcan, G.E.; Sivrikaya, F.; Sakici, O.E.; Enez, K. Determination of some factors leading to the infestation of Ips sexdentatus in crimean pine stands. For. Ecol. Manag. 2022, 519, 120316. [Google Scholar] [CrossRef]
- Sivrikaya, F.; Özcan, G.E.; Enez, K.; Sakici, O.E. Comparative study of the analytical hierarchy process, frequency ratio, and logistic regression models for predicting the susceptibility to Ips sexdentatus in crimean pine forests. Ecol. Inform. 2022, 71, 101811. [Google Scholar] [CrossRef]
- Stereńczak, K.; Mielcarek, M.; Kamińska, A.; Kraszewski, B.; Piasecka, Ż.; Miścicki, S.; Heurich, M. Influence of selected habitat and stand factors on bark beetle Ips typographus (L.) outbreak in the Białowieża Forest. For. Ecol. Manag. 2020, 459, 117826. [Google Scholar] [CrossRef]
- Näsi, R.; Honkavaara, E.; Lyytikäinen-Saarenmaa, P.; Blomqvist, M.; Litkey, P.; Hakala, T.; Vilijanen, N.; Kantola, T.; Tanhuanpää, T.; Holopainen, M. Using UAV-based photogrammetry and hyperspectral imaging for mapping bark beetle damage at tree-level. Remote Sens. 2015, 7, 15467–15493. [Google Scholar]
- Abdullah, H.; Darvishzadeh, R.; Skidmore, A.K.; Groen, T.A.; Heurich, M. European spruce bark beetle (Ips typographus, L.) green attack affects foliar reflectance and biochemical properties. Int. J. Appl. Earth Obs. Geoinf. 2018, 64, 199–209. [Google Scholar] [CrossRef]
- Zabihi, K.; Surovy, P.; Trubin, A.; Singh, V.V.; Jakuš, R. A review of major factors influencing the accuracy of mapping green-attack stage of bark beetle infestations using satellite imagery: Prospects to avoid data redundancy. Remote Sens. Appl. Soc. Environ. 2021, 24, 100638. [Google Scholar] [CrossRef]
- Mandl, L.; Lang, S. Uncovering early traces of bark beetle induced forest stress via semantically enriched Sentinel-2 data and spectral indices. PFG—J. Photogramm. Remote Sens. Geoinf. Sci. 2023, 91, 211–231. [Google Scholar] [CrossRef]
- Candotti, A.; De Giglio, M.; Dubbini, M.; Tomelleri, E. A Sentinel-2 based multi-temporal monitoring framework for wind and bark beetle detection and damage mapping. Remote Sens. 2022, 14, 6105. [Google Scholar] [CrossRef]
- Coops, N.C.; Johnson, M.; Wulder, M.A.; White, J.C. Assessment of QuickBird high spatial resolution imagery to detect red attack damage due to mountain pine beetle infestation. Remote Sens. Environ. 2006, 103, 67–80. [Google Scholar] [CrossRef]
- Rullan-Silva, C.D.; Olthoff, A.E.; Delgado de la Mata, J.A.; Pajares-Alonso, J.A. Remote monitoring of forest insect defoliation. A review. For. Syst. 2013, 22, 377–391. [Google Scholar] [CrossRef]
- Abdullah, H.; Skidmore, A.K.; Darvishzadeh, R.; Heurich, M.; Heiden, U. Sensitivity of Landsat-8 OLI and TIRS data to foliar properties of early stage bark beetle infestation. Remote Sens. 2019, 11, 398. [Google Scholar] [CrossRef]
- Huang, S.; Tang, L.; Hupy, J.P.; Wang, Y.; Shao, G. A commentary review on the use of normalized difference vegetation index (NDVI) in the era of popular remote sensing. J. For. Res. 2021, 32, 1–6. [Google Scholar] [CrossRef]
- Marvasti-Zadeh, S.M.; Goodsman, D.; Ray, N.; Erbilgin, N. Early detection of bark beetle attack using remote sensing and machine learning: A review. ACM Comput. Surv. 2023, 56, 1–40. [Google Scholar] [CrossRef]
- Özcan, G.; Enez, K.; Sivrikaya, F. Kabuk böceği duyarlılığının kalan meşcere üzerine etkilerinin araştırılması. Turk. J. For. Sci. 2023, 7, 35–46. [Google Scholar] [CrossRef]
- Abdullah, H.J. Remote Sensing of European Spruce (Ips typographus, L.) Bark Beetle Green Attack. Ph.D. Thesis, University of Twente, Faculty of Geo-Information Science and Earth Observation (ITC), Enschede, The Netherlands, 2019. [Google Scholar] [CrossRef]
- Eitel, J.U.; Gessler, P.E.; Smith, A.M.; Robberecht, R. Suitability of existing and novel spectral indices to remotely detect water stress in Populus spp. For. Ecol. Manag. 2006, 229, 170–182. [Google Scholar] [CrossRef]
- Jiang, Z.; Huete, A.R.; Didan, K.; Miura, T. Development of a two-band enhanced vegetation index without a blue band. Remote Sens. Environ. 2008, 112, 3833–3845. [Google Scholar] [CrossRef]
- Collins, J.B.; Woodcock, C.E. An assessment of several linear change detection techniques for mapping forest mortality using multitemporal Landsat TM Data. Remote Sens. Environ. 1996, 77, 66–77. [Google Scholar] [CrossRef]
- Vogelmann, J.E.; Tolk, B.; Zhu, Z. Monitoring forest changes in the southwestern United States using multitemporal Landsat data. Remote Sens. Environ. 2009, 113, 1739–1748. [Google Scholar] [CrossRef]
- Meddens, A.J.H.; Hudak, A.T.; Evans, J.S.; Gould, W.A.; Gonzalez, G. Characterizing forest fragments in boreal, temperate, and tropical ecosystems. Ambio 2008, 37, 569–576. [Google Scholar] [CrossRef]
- Wilson, E.H.; Sader, S.A. Detection of forest harvest type using multiple dates of Landsat TM imagery. Remote Sens. Environ. 2002, 80, 385–396. [Google Scholar] [CrossRef]
- Rouse, J.W.; Haas, R.H.; Deering, D.W.; Schell, J.A. Monitoring the Vernal Advancement and Retrogradation (Greenwave Effect) of Natural Vegetation; Goddar Space Fligh Center: Greenbelt, MD, USA, 1973; 87p. [Google Scholar]
- Jin, S.; Sader, S.A. Comparison of time series tasseled cap wetness and the normalized difference moisture index in detecting forest disturbances. Remote Sens. Environ. 2005, 94, 364–372. [Google Scholar] [CrossRef]
- Vogelmann, J.E. Comparison between two vegetation indices for measuring different types of forest damage in the north-eastern United States. Int. J. Remote Sens. 1990, 11, 2281–2297. [Google Scholar] [CrossRef]
- Baig, M.H.A.; Zhang, L.; Shuai, T.; Tong, Q. Derivation of a Tasselled Cap Transformation Based on Landsat 8 At-Satellite Reflectance. Remote Sens. Lett. 2014, 5, 423–431. [Google Scholar] [CrossRef]
- Field, A. Discovering Statistics Using SPSS, 3rd ed.; SAGE Publications Ltd.: London, UK, 2009. [Google Scholar]
- Fritz, C.O.; Morris, P.E.; Richler, J.J. Effect size estimates: Current use, calculations, and interpretation. J. Exp. Psychol. Gen. 2012, 141, 2–18. [Google Scholar] [CrossRef] [PubMed]
- Cohen, J. Statistical Power Analysis for the Behavioral Sciences, 2nd ed.; Lawrence Erlbaum Associates: Hillsdale, NJ, USA, 1988. [Google Scholar]
- Benjamini, Y.; Hochberg, Y. Controlling the false discovery rate: A practical and powerful approach to multiple testing. J. R. Stat. Soc. Ser. B Methodol. 1995, 57, 289–300. [Google Scholar] [CrossRef]
- Verhoeven, K.J.F.; Simonsen, K.L.; McIntyre, L.M. Implementing false discovery rate control: Increasing your power. Oikos 2005, 108, 643–647. [Google Scholar] [CrossRef]
- Massey, F.J., Jr. The Kolmogorov-Smirnov test for goodness of fit. J. Am. Stat. Assoc. 1951, 46, 68–78. [Google Scholar] [CrossRef]
- Mann, H.B.; Whitney, D.R. On a test of whether one of two random variables is stochastically larger than the other. Ann. Math. Stat. 1947, 18, 50–60. [Google Scholar] [CrossRef]
- Pillai, K.C.S. Some new test criteria in multivariate analysis. Ann. Math. Stat. 1955, 26, 117–121. [Google Scholar] [CrossRef]
- Hair, J.F.; Black, W.C.; Babin, B.J.; Anderson, R.E. Multivariate Data Analysis, 8th ed.; Cengage Learning: Boston, MA, USA, 2019. [Google Scholar]
- Georgiev, G.; Georgieva, M.; Dimitrov, S.; Iliev, M.; Trenkin, V.; Mirchev, P.; Belilov, S. Remote sensing assessment of the expansion of Ips typographus attacks in the Chuprene Reserve Western Balkan Range. Forests 2022, 13, 39. [Google Scholar] [CrossRef]
- Stoyanova, M.; Kandilarov, A.; Koutev, V.; Nitcheva, O.; Dobreva, P. Potential of multispectral imaging technology for assessment coniferous forests bitten by a bark beetle in Central Bulgaria. MATEC Web Conf. 2018, 145, 01005. [Google Scholar] [CrossRef][Green Version]
- Klouček, T.; Modlinger, R.; Zikmundová, M.; Kycko, M.; Komárek, J. Early detection of bark beetle infestation using UAV-borne multispectral imagery: A case study on the spruce forest in the Czech Republic. Front. For. Glob. Change 2024, 7, 1215734. [Google Scholar] [CrossRef]
- Hladky, R.; Lastovicka, J.; Holman, L.; Stych, P. Evaluation of the influence of disturbances on forest vegetation using Landsat time series; a case study of the Low Tatras National Park. Eur. J. Remote Sens. 2020, 53, 40–66. [Google Scholar] [CrossRef]
- Jamali, S.; Olsson, P.O.; Müller, M.; Ghorbanian, A. Kernel-based early detection of forest bark beetle attack using vegetation indices time series of sentinel-2. IEEE J. Sel. Top. Appl. Earth Obs. Remote Sens. 2024, 17, 12868–12877. [Google Scholar] [CrossRef]
- Bryk, M.; Kołodziej, B.; Pliszka, R. Changes of Norway spruce health in the Białowieża forest (CE Europe) in 2013–2019 during a bark beetle infestation, studied with Landsat imagery. Forests 2020, 12, 34. [Google Scholar] [CrossRef]
- Lausch, A.; Heurich, M.; Gordalla, D.; Dobner, H.J.; Gwillym-Margianto, S.; Salbach, C. Forecasting potential bark beetle outbreaks based on spruce forest vitality using hyperspectral remote-sensing techniques at different scales. For. Ecol. Manag. 2013, 308, 76–89. [Google Scholar] [CrossRef]
- Kondur, Y.; Bilgili, B.C.; Şımşek, Z.; Öner, N. Monitoring the epidemic of bark beetles determined in Uludag fir stands in Ilgaz (Derbent and Doruk) via Landsat satellite images. Kastamonu Univ. J. For. Fac. 2012, 12, 86–90. [Google Scholar]
| Disclaimer/Publisher’s Note: The statements, opinions and data contained in all publications are solely those of the individual author(s) and contributor(s) and not of MDPI and/or the editor(s). MDPI and/or the editor(s) disclaim responsibility for any injury to people or property resulting from any ideas, methods, instructions or products referred to in the content. |



 ,
,