3.1. Taxonomic Composition and Ecological Dominance
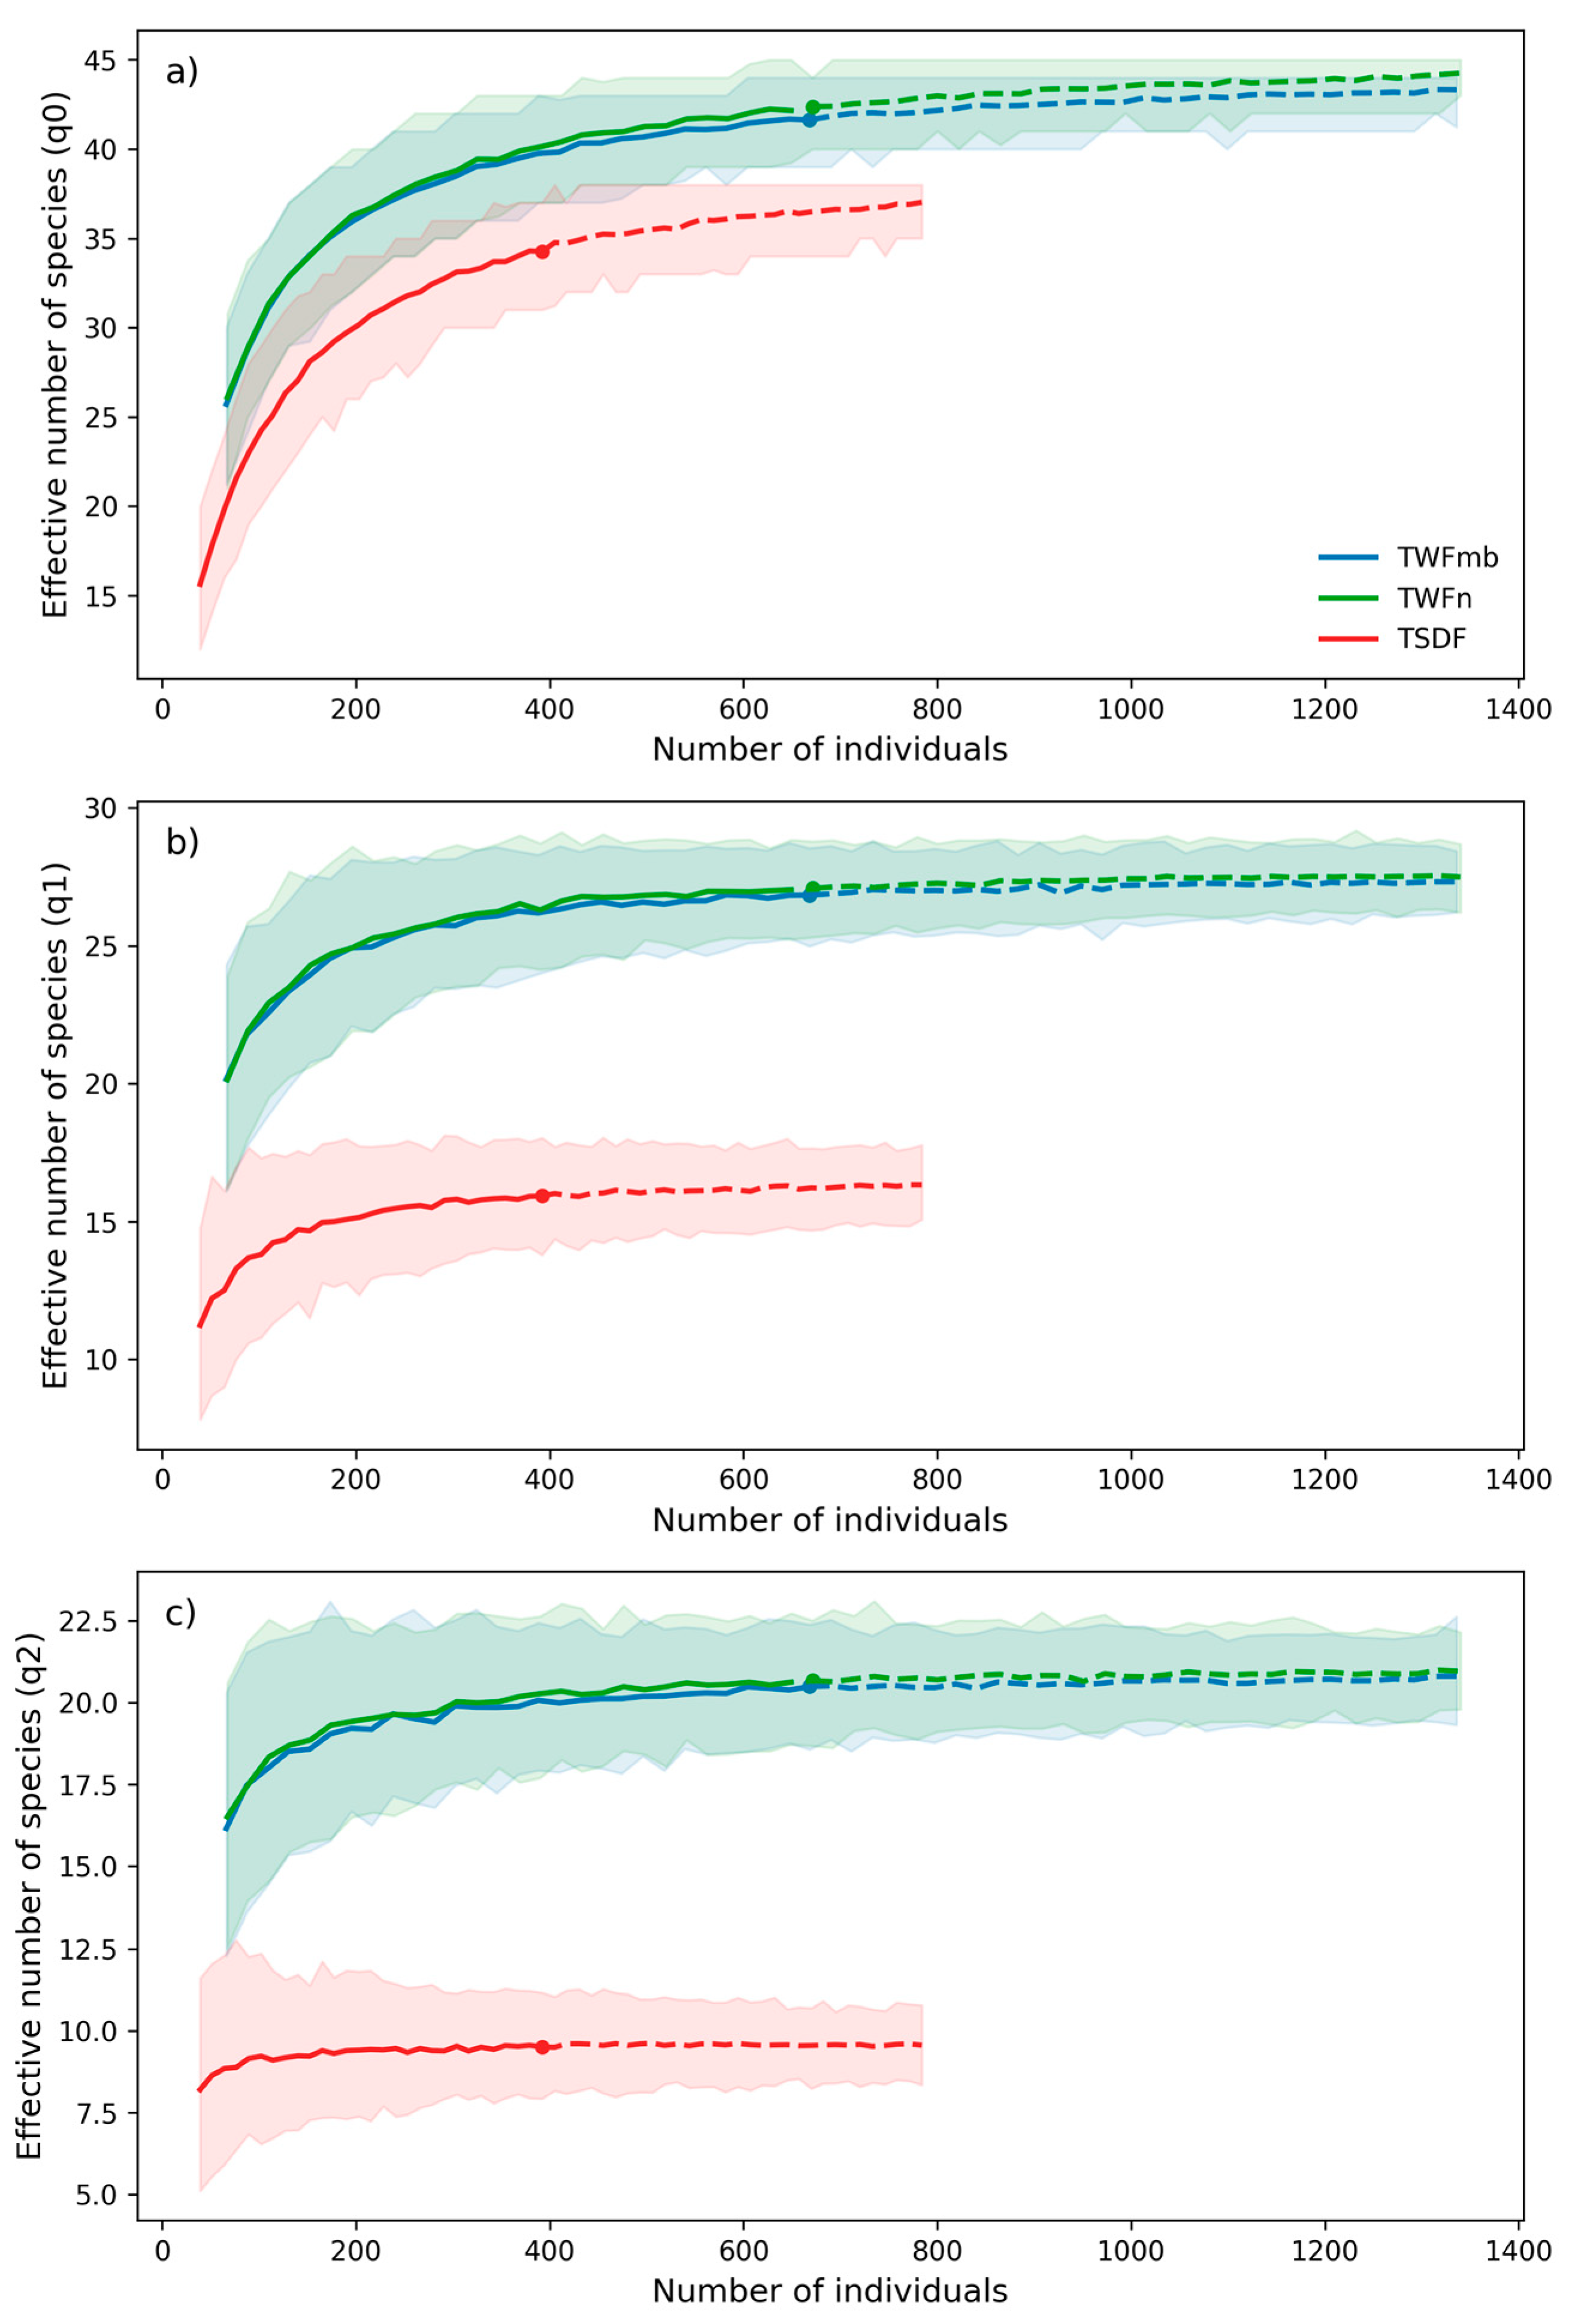
Taxonomic composition varied among the three forests. Both wet forests contained a larger number of recorded species than TSDF, while the diversity curves also showed a clear separation between the humid and seasonal systems. In
Figure 2, TWFmb and TWFn maintained higher values of q0, q1, and q2 across the observed and extrapolated sample sizes, whereas TSDF consistently showed lower effective diversity. This pattern was especially evident for q1 and q2, indicating that the lower diversity in TSDF was not only related to species richness, but also to a stronger concentration of individuals in a smaller set of dominant taxa.
The family-level analysis revealed contrasting patterns of ecological dominance among forests. In TWFmb and TWFn, structural importance was distributed among several major lineages, including Fabaceae, Moraceae, Malvaceae, Myristicaceae, Sapotaceae, and Lecythidaceae, indicating a broader family-level contribution to stand organization. By contrast, TSDF was more unevenly structured, with Euphorbiaceae clearly exceeding all other families in density, basal area, and F-IVI, followed at a considerable distance by Malvaceae, Fabaceae, Bignoniaceae, and Fagaceae. This contrast indicates that family-level dominance was more broadly distributed in the two wet forests, whereas in TSDF it was concentrated more strongly in a reduced number of lineages (
Table 1 and
Table S1).
At the species level, the same contrast was evident. In TWFmb, the highest IVI values corresponded to
Chrysophyllum cainito L.,
Pithecellobium foreroi C.Barbosa,
Brosimum utile (Kunth) Oken,
Virola sebifera Aubl., and
Eschweilera sclerophylla Cuatrec. In TWFn, the most important species were
Pouteria caimito Radlk.,
Chrysophyllum cainito L.,
Licania micrantha Miq.,
Brosimum utile (Kunth) Oken, and
Virola reidii Little. In TSDF, dominance was more strongly concentrated in
Hura polyandra Baill., followed by
Sapium appendiculatum Pax & K.Hoffm.,
Tabebuia rosea (Bertol.) DC.,
Guazuma ulmifolia Lam., and
Quercus glaucescens Bonpl. (
Table 2 and
Table S2). Taken together, these results indicate that TWFmb and TWFn were characterized by broader taxonomic representation and a more even distribution of structural importance among families and species, whereas TSDF showed lower effective diversity and a more concentrated pattern of ecological dominance. In TSDF, the Euphorbiaceae pattern was supported mainly by
Hura polyandra and
Sapium appendiculatum, while family-level dominance was completed by two additional species recorded in the forest (
Table 1,
Table 2 and
Table S2).
3.2. Structural Variation Across Contrasting Tropical Forests
Dendrometric structure differed among forests, although this contrast was not expressed uniformly across all attributes. Tree density, basal area, mean height, and standing volume varied significantly among forests, whereas mean DBH did not differ significantly (
p = 0.705). In all significant variables, TWFmb and TWFn remained statistically similar to each other, while TSDF differed from both wet forests. Relative to TWFmb and TWFn, TSDF showed reductions of approximately 41% in stem density, 52% in basal area, 18% in mean height, and 56% in standing volume, indicating a structurally less developed stand condition despite the absence of significant differences in mean DBH (
Table 3). This apparent contrast is explained by the fact that stand-level basal area reflects not only mean DBH, but also stem density and the distribution of individuals across diameter classes, particularly the reduced representation of intermediate and large trees in TSDF.
The diameter structure also showed a clear separation among forests. In TWFmb and TWFn, the greatest concentration of stems occurred in the 20–29.9 cm class, which represented 31.3% of all individuals in both forests, followed by the 10–19.9 cm and 30–39.9 cm classes, each contributing about one fifth of the total inventory. In TSDF, by contrast, nearly half of all stems (48.7%) were concentrated in the 10–19.9 cm class, while the relative contribution of intermediate classes declined sharply. This shift in stem distribution was reflected in significant differences from the 20–29.9 cm class onward, where TWFmb and TWFn consistently exceeded TSDF in stem density (
p ≤ 0.001 for the 20–29.9, 30–39.9, 40–49.9, 50–59.9, and 60–69.9 cm classes;
Table 4).
The strongest structural contrast was observed in the intermediate diameter range. In the 30–39.9 cm class, TWFmb and TWFn retained about 20% of their stems, whereas TSDF contained only 13.8%. The same pattern became more pronounced in the 40–49.9 cm class, which represented 16.2% and 16.1% of stems in TWFmb and TWFn, respectively, but only 5.9% in TSDF. Above 50 cm DBH, the proportional contribution of stems declined in all forests, although the reduction was steeper in TSDF, where the combined contribution of classes above 50 cm remained below 5% of the total inventory (
Table 4).
At the lower end of the distribution, no significant differences were detected in the 10–19.9 cm class (
p = 0.237), indicating that recruitment-sized and small stems were abundant in all three forests. However, the structural role of this class differed among systems. In TSDF, the concentration of nearly half of all stems in this class defined a narrower size structure and was accompanied by a marked reduction in the representation of intermediate and large trees. As a result, a substantial fraction of the stand remained concentrated in lower-size categories, which helps explain the lower basal area, standing volume, biomass, and carbon stocks observed in this forest relative to the two wet forests. In contrast, in TWFmb and TWFn this class represented only about one fifth of individuals, reflecting a broader distribution of stems across intermediate sizes and a more structurally developed stand profile, with greater contribution of these classes to woody accumulation. This difference in diameter allocation was consistent with the higher basal area and standing volume observed in the two wet forests (
Table 3 and
Table 4).
The contribution of taxonomic groups to standing volume differed significantly among forests, although the magnitude of these differences varied among families (
Table 5 and
Table S3). In TSDF, standing volume was strongly concentrated in Euphorbiaceae, which accounted for 36.2% of total standing volume and differed significantly from both wet forests (
p < 0.001). In contrast, TWFmb and TWFn distributed standing volume more broadly among several families, with no single lineage reaching such a disproportionate contribution.
Fabaceae was the principal volumetric component in TWFmb, where it represented 17.2% of total standing volume, whereas its contribution declined to 8.2% in TWFn and 12.2% in TSDF. This reduction was significant in TSDF relative to the two wet forests (p = 0.029). A similar pattern was observed for Malvaceae, whose contribution remained close to 10% in both wet forests but declined to 6.5% in TSDF (p = 0.006). Together, these results indicate that a substantial fraction of the standing volume in TWFmb and TWFn was supported by families that combined relatively high abundance with greater structural development.
Other families showed more restricted but still relevant contributions. Sapotaceae accounted for nearly 12% of total standing volume in both wet forests, but was absent from TSDF, resulting in a highly significant contrast among forests (p < 0.001). The same tendency was recorded for Myristicaceae and Lecythidaceae, both of which contributed appreciably to standing volume in TWFmb and TWFn but were not represented in TSDF (p < 0.001 in both cases). In TWFn, Chrysobalanaceae represented 8.8% of total standing volume and differed significantly from the other two forests (p < 0.001), reinforcing the distinctive volumetric composition of that forest.
Not all families showed statistical separation among forests. Moraceae contributed between 11.5% and 17.3% of total standing volume across the three systems and did not differ significantly among them (p = 0.903), despite its lower density in TSDF. Burseraceae also showed a relatively stable contribution, ranging from 2.9% to 3.9%, with no significant differences among forests (p = 0.059). In TSDF, Fagaceae represented 8.1% of total standing volume, but this contribution was not significantly different from the absence of this family in the two wet forests (p = 0.351).
Overall, standing volume in TWFmb and TWFn was distributed among a broader set of families, whereas TSDF showed a more concentrated volumetric pattern dominated by Euphorbiaceae. This contrast indicates that the higher standing volume observed in the wet forests was supported by a more even family-level contribution, while in TSDF a substantial fraction of the total volume was concentrated in a smaller number of dominant lineages.
3.3. Biomass Allocation and Carbon Storage
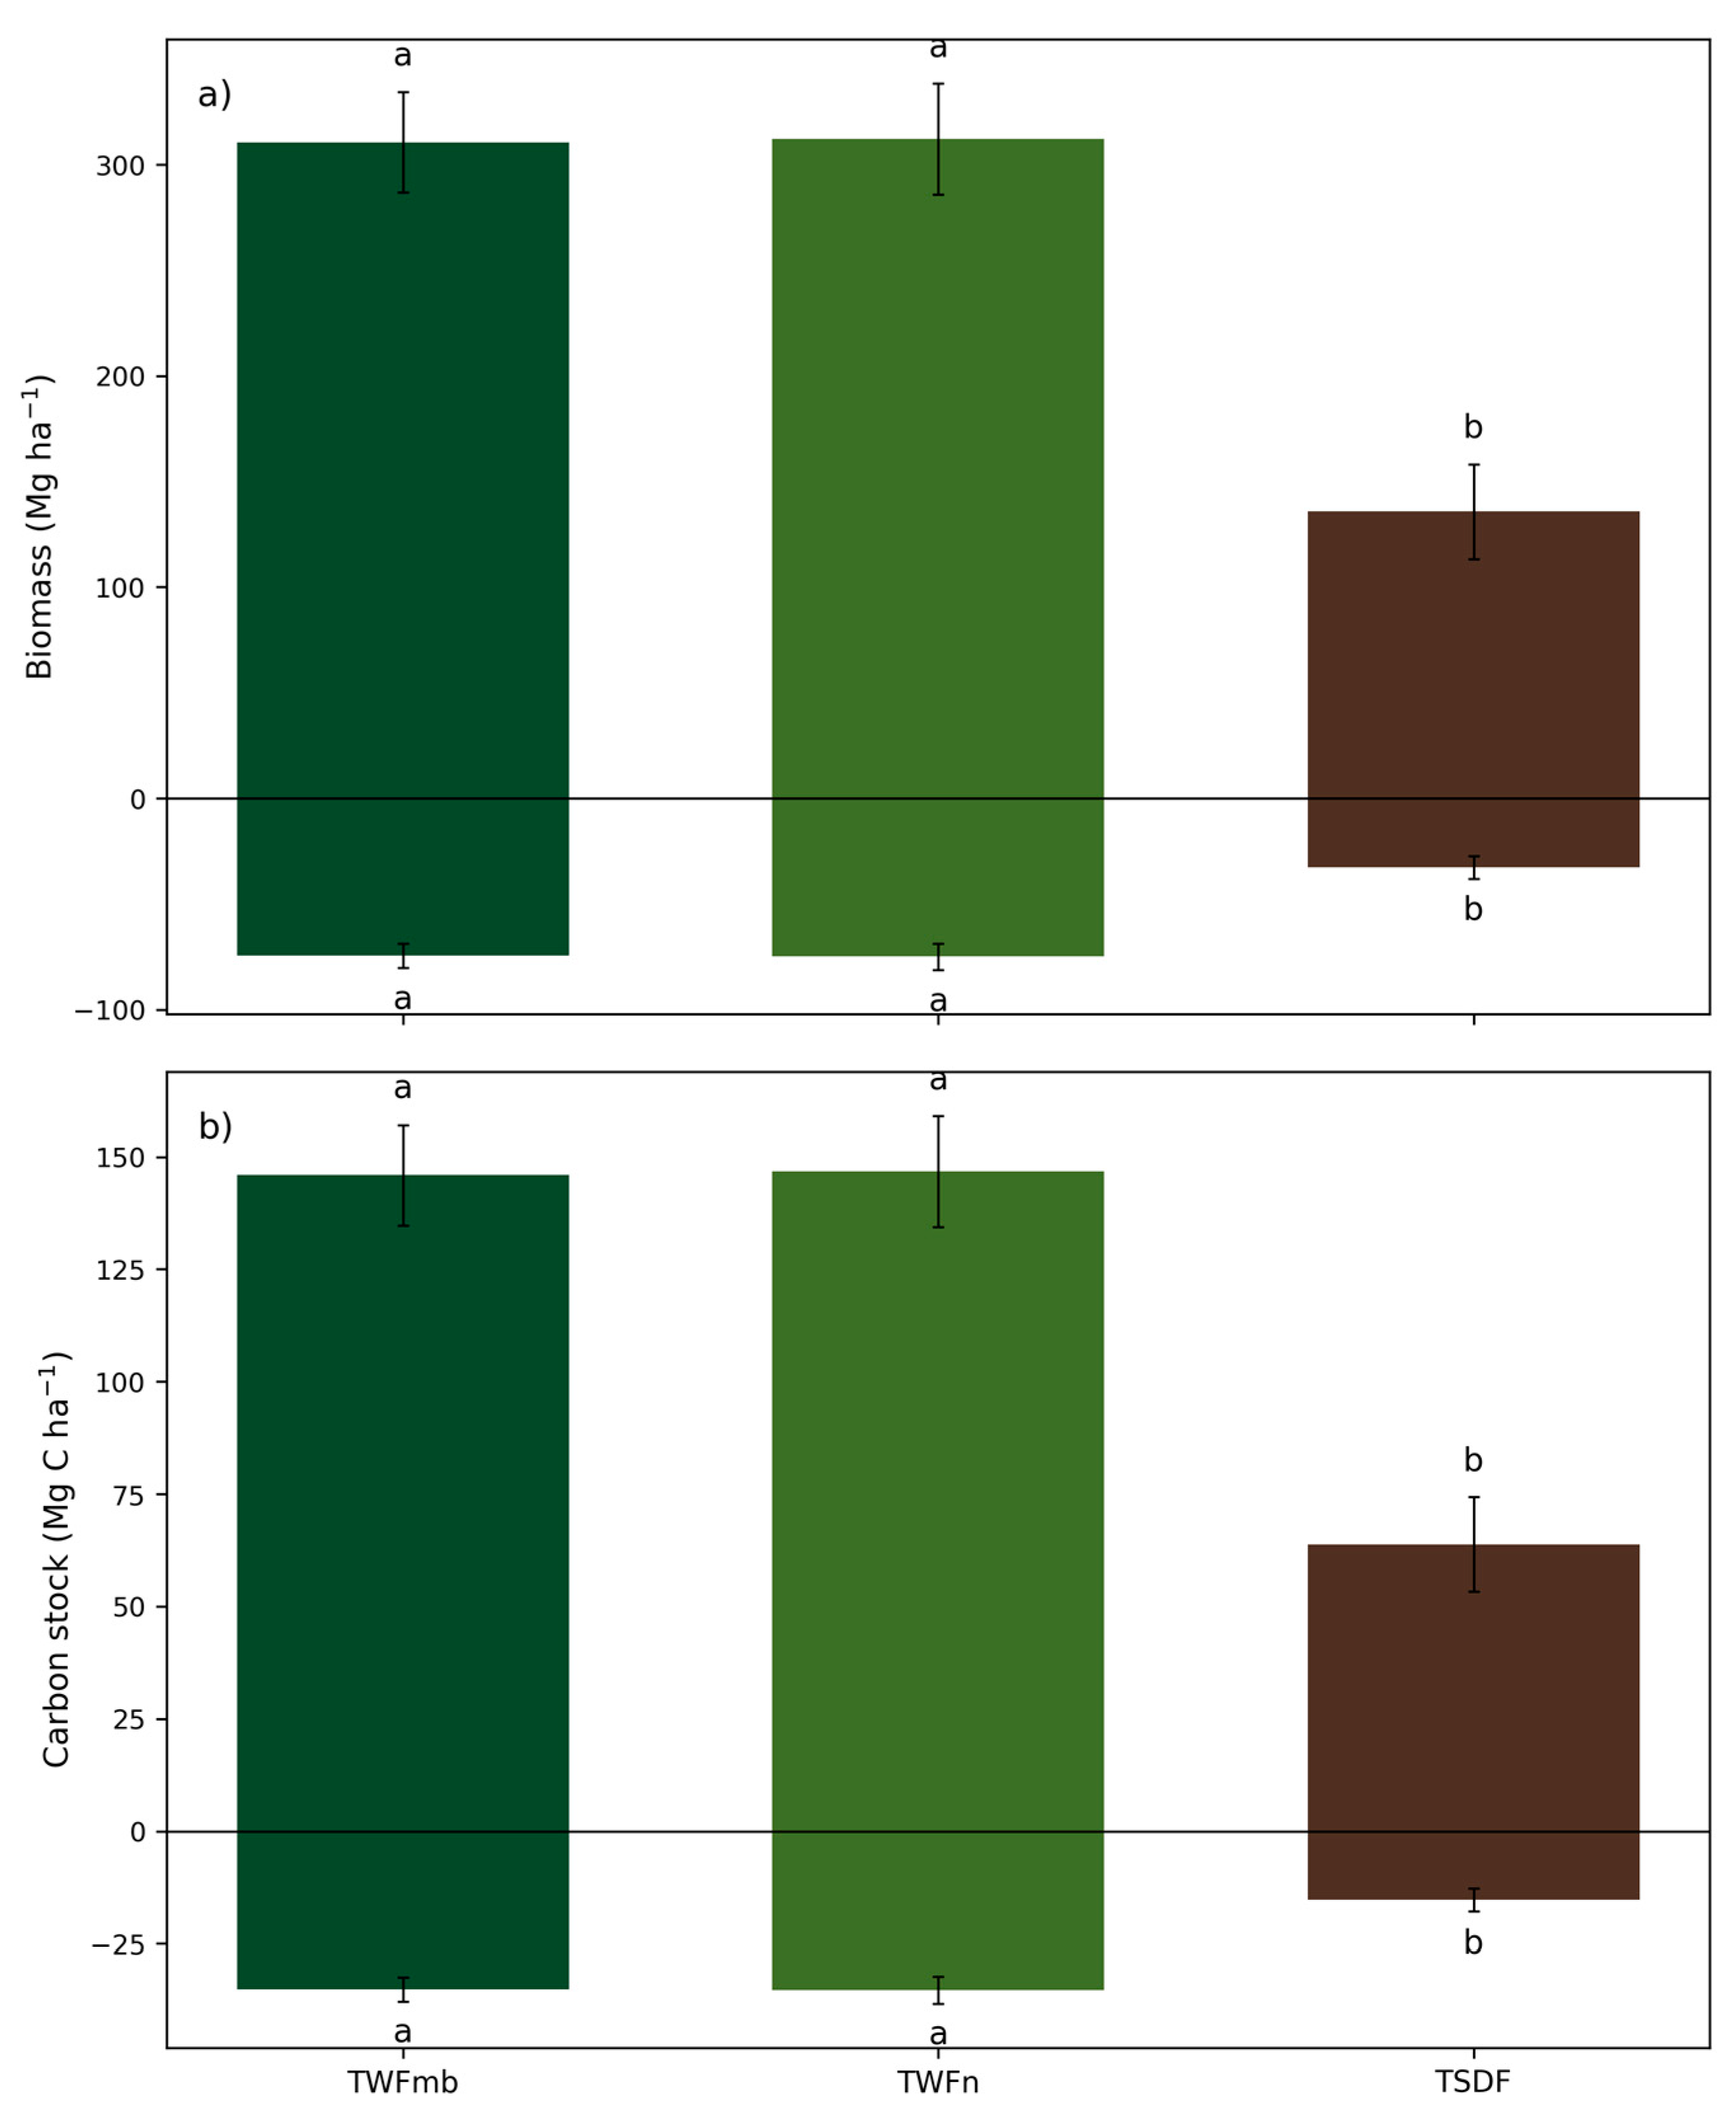
Biomass allocation differed significantly among forests for both aboveground and belowground components (ANOVA,
p = 5.76 × 10
−6 in both cases). TWFmb and TWFn did not differ significantly from one another, whereas TSDF showed significantly lower values for both fractions (
Figure 3a). In both wet forests, aboveground and belowground biomass were more than twice those recorded in TSDF, indicating substantially greater biomass accumulation under the more humid conditions represented by these sites. Carbon stocks followed the same pattern, with no significant differences between TWFmb and TWFn and significantly lower values in TSDF for both aboveground and belowground pools (
Figure 3b). Overall, the greater biomass accumulation observed in the two wet forests was directly reflected in higher carbon storage, whereas TSDF maintained a markedly lower biomass–carbon balance.
At the family level, biomass and carbon allocation (
Table 6) also differed among forests, although the magnitude and direction of these differences varied among taxonomic groups. In TSDF, Euphorbiaceae dominated both biomass and carbon storage, accounting for 36.2% of total standing volume and concentrating the largest share of aboveground and belowground biomass among all families. This dominance was reflected in significantly higher values than those recorded in TWFmb and TWFn for all biomass and carbon components (
p < 0.001), indicating that a substantial proportion of ecosystem biomass in TSDF was supported by a single lineage.
In contrast, biomass and carbon in the two wet forests were distributed more evenly among several dominant families. In TWFmb, Fabaceae contributed the largest share of total biomass and carbon, followed by Sapotaceae, Moraceae, and Malvaceae, whereas in TWFn Chrysobalanaceae also emerged as an important contributor. By comparison, the contribution of Fabaceae and Malvaceae declined significantly in TSDF (p = 0.029 and p = 0.006, respectively). Some families were strongly associated with the wet forests. Sapotaceae, Myristicaceae, and Lecythidaceae made substantial contributions to biomass and carbon in TWFmb and TWFn, but were not represented in TSDF, resulting in highly significant contrasts among forests (p < 0.001 in all cases). Chrysobalanaceae showed the opposite pattern, with its highest contribution in TWFn and much lower values in the other two forests (p < 0.001), reinforcing the distinct family-level allocation pattern of that forest.
Overall, the two wet forests stored biomass and carbon through a broader set of dominant families, whereas TSDF concentrated a larger fraction of both pools in fewer lineages, especially Euphorbiaceae. This pattern was consistent with the stronger structural concentration previously observed in TSDF and with the more even distribution of taxonomic importance in TWFmb and TWFn.
3.4. Ecological Attributes Associated with Standing Volume and Carbon Stocks
Ecological attributes showed contrasting levels of association with standing volume and carbon storage, but the strongest relationships were consistently linked to stand structure rather than to diversity alone. Basal area showed the highest correlation with standing volume, total biomass, and total carbon (r = 0.991,
p < 0.001), indicating that horizontal occupation of the stand was the variable most closely associated with the accumulation of woody volume and carbon pools under the analytical framework used in this study. Mean height also showed a strong positive association with these response variables (r = 0.828,
p < 0.001), followed by mean DBH (r = 0.693,
p < 0.001), reinforcing the importance of tree size and structural development in explaining differences among sampling units. The same variables also showed the strongest associations in the complementary Spearman analysis, confirming that the main correlation pattern remained stable across both parametric and non-parametric approaches (
Table 7 and
Table S5).
Diversity-related variables were also positively associated with standing volume and carbon, although with lower coefficients than those observed for structural attributes. Species richness showed a moderate to strong correlation with standing volume, total biomass, and total carbon (r = 0.683, p < 0.001). A similar pattern was found for Shannon diversity, Simpson diversity, and Hill numbers q1 and q2, all of which were significantly and positively related to the three response variables (p < 0.001 in all cases). These associations indicate that sampling units with greater taxonomic diversity also tended to store more volume and carbon, although the strength of this relationship remained below that of basal area and tree dimensions.
Among the ecological attributes evaluated, Pielou’s evenness showed the weakest association with standing volume and carbon storage (r = 0.307, p = 0.030). Although still significant, this lower coefficient suggests that the degree of equitability in species abundances had less influence on volume and carbon accumulation than structural attributes such as basal area, height, and DBH. Overall, the correlation pattern indicates that standing volume and carbon stocks were more closely related to stand occupation and tree size than to the evenness of species distribution.




 ,
,