Article

Slope Position Modulates Preferential Flow via Root–Soil Interactions: A Case Study of Larch Plantations in Rocky Mountainous Areas

1
Key Laboratory of National Forestry and Grassland Administration on Forest Ecosystem Protection and Restoration, Ecology and Nature Conservation Institute, Chinese Academy of Forestry, Beijing 100091, China
2
School of Landscape and Ecological Engineering, Hebei University of Engineering, Handan 056038, China
3
School of Soil and Water Conservation, Beijing Forestry University, Beijing 100083, China
*
Author to whom correspondence should be addressed.
Forests 2026, 17(4), 467; https://doi.org/10.3390/f17040467
Submission received: 5 March 2026 / Revised: 31 March 2026 / Accepted: 8 April 2026 / Published: 10 April 2026

Abstract

Soil preferential flow plays a crucial role in governing hydrological cycles and soil moisture distribution in mountain forests. This makes it essential for understanding subsurface water movement and for guiding hillslope hydrological management. In this study, soil preferential flow, soil properties, and root characteristics across three slope positions on a Larix gmelinii var. principis-rupprechtii (Mayr) Pilger (larch) plantation hillslope in the Liupan Mountains were systematically observed to reveal the spatial patterns and formation mechanisms of hillslope soil preferential flow. The results showed that soil preferential flow development followed a distinct spatial pattern across the slope positions, with the mid-slope exhibiting the most developed preferential flow characteristics. The comprehensive preferential flow index further quantified this spatial variation, ranking the slope positions as mid-slope > upper slope > lower slope. Different soil structural properties exerted varying influences on preferential flow. Macropore-related properties (low bulk density and high porosity and saturated conductivity) promoted most preferential flow, whereas aggregate-related properties (high organic matter and water-stable aggregates) suppressed it. The influence of root characteristics on preferential flow was also dual. Root length density generally promoted preferential flow (e.g., DC, LI, and UniFr), whereas root surface area density primarily exerted an inhibitory effect (e.g., LI, UniFr, and total stained area TotStAr). This study clarifies how slope position modulates preferential flow through soil and root characteristics, offering insights for slope-specific hydrological understanding and targeted soil and water conservation practices.

1. Introduction

In recent years, soil degradation in mountainous areas has become increasingly severe due to the combined effects of slope erosion, changes in land use, excessive water resource exploitation, and drought-induced tree mortality [1,2]. As the fundamental units of hydrological processes, hillslopes play a critical role in regulating soil erosion and runoff generation [3], surface and subsurface flow dynamics [4], groundwater recharge, and the transport of sediment and nutrients [5]. These processes govern slope stability and ecosystem functions [6,7]. Soil preferential flow is particularly important in this context, as it directly affects water conservation, runoff regulation, and the ecological water balance [8,9]. It also serves as a key indicator for evaluating soil erosion resistance and hydrological sustainability on hillslopes [10]. Its spatial variability is strongly influenced by slope position, as this affects site conditions, vegetation, and soil properties [11]. This is particularly important in rocky mountainous regions, where shallow soils, high stone content, and significant spatial heterogeneity mean that water movement is highly dependent on preferential flow pathways [12,13]. Therefore, investigating how slope position mediates preferential flow mechanisms is crucial for revealing the spatial patterns of rainfall–runoff processes in mountains, providing a scientific basis for optimising eco-hydrological management strategies.
Slope position significantly influences the pattern of preferential flow by altering soil structure and the distribution of vegetation roots [14]. However, the effect is mediated by site-specific conditions. For example, in semi-arid loess hilly regions, downslope positions act as key preferential flow channels owing to the high rock-fragment coverage [15]. In contrast to such regions, in subtropical mountainous regions, loose soil structure, high porosity, and dense herbaceous root systems favour the formation of continuous preferential flow channels at mid-slope positions [16]. Although several studies have been reported on hillslope preferential flow, their findings show substantial variability because of diverse soil and bedrock structures. In addition to the complexity introduced by high rock fragment and fragmented profiles in Rocky Mountains, vegetation plays a critical role in regulating hillslope hydrological processes. Spatial differences in root distribution on forested hillslopes further complicate preferential flow networks by creating macropores or altering soil hydraulic conductivity [8,9,17]. Without systematic investigation in these complex environments, our ability to understand and predict the spatial variability of hydrological functions remains limited.
Soil structure is the primary physical determinant of preferential flow. The abundance and connectivity of macropores, as well as the gravel content, directly influence water movement. For example, in the karst region of southwestern China, increased soil organic matter can greatly promote the development of preferential flow [18]. In glacial forest terrain, natural secondary forests exhibit more pronounced preferential flow than plantations due to their superior soil porosity [19]. At the hillslope scale, regional differences in the dominant role of soil structure in shaping preferential flow regimes also emerge. In boreal forests, a higher gravel content in the middle of the slope promotes the development of preferential flow [20]. In the Susquehanna Shale Hills Critical Zone Observatory in Pennsylvania, shale watersheds exhibit enhanced preferential flow due to elevated sand content, whereas increased flow in sandstone watersheds is facilitated by desiccation cracks in clay-rich soils [21]. However, there is still a lack of systematic research on how differences in slope position regulate preferential flow patterns through soil structure factors in highly heterogeneous mountainous regions. The key controlling factors remain unclear. This also limits the promotion and simulation of preferential flow mechanisms in complex mountainous areas.
Vegetation root traits are key biological factors that regulate the formation and development of soil preferential flow. For example, research on tropical forest hillslopes in southwestern China revealed that root biomass was notably higher at the upper slope position than at the middle and lower slope positions, and a strong positive correlation was observed between root biomass and the width and connectivity of preferential flow pathways [17]. Similarly, on the temperate forest hillslopes in the Miyun Basin, preferential flow contributions were found to be substantially higher at the middle of the slope, largely due to the presence of more root systems in the upper soil layers [12]. However, most current studies have focused on comparing the effects of vegetation restoration or land use [22,23,24]. Much remains to be learnt about how slope-induced spatial variability in root systems influences preferential flow within monoculture plantations. Trees often exhibit pronounced plasticity in root architecture and distribution across different slope positions [25,26]. Nevertheless, how topography-driven spatial heterogeneity in plantation root systems influences preferential flow development remains poorly understood. Roots can both create macropores that serve as preferential flow pathways and alter soil hydraulic conductivity through growth, decay, and structural modification [8,9]. Further mechanistic investigation is urgently needed to clarify the relationships among root spatial traits, soil hydraulic conductivity, and preferential flow characteristics at the hillslope scale.
The Liupan Mountains, situated in the southern part of Ningxia Hui Autonomous Region, Northwest China, are a critical area of the Loess Plateau, characterised by their soil and rock geology and play an essential role in water conservation as the headwater region for several major rivers, including the Jinghe, Weihe, and Qingshuihe rivers. Larix gmelinii var. principis-rupprechtii (Mayr) Pilger (larch), the primary species planted in this region, plays a pivotal role in retaining soil and water. Therefore, it is crucial to thoroughly investigate soil preferential flow processes on hillslopes under these plantations. This will help to reveal local hillslope hydrological pathways and runoff generation mechanisms, providing a scientific basis for optimising forest and water management on hillslopes. This study therefore aims to: (1) clarify the variation patterns of soil properties and root characteristics across different slope positions; (2) elucidate the process of preferential flow and its variation patterns across different slope positions; (3) determine the impact of soil properties and root traits on preferential flow. These data and findings will advance the understanding of preferential flow mechanisms on hillslopes and support effective forest management.

2. Materials and Methods

2.1. Study Area

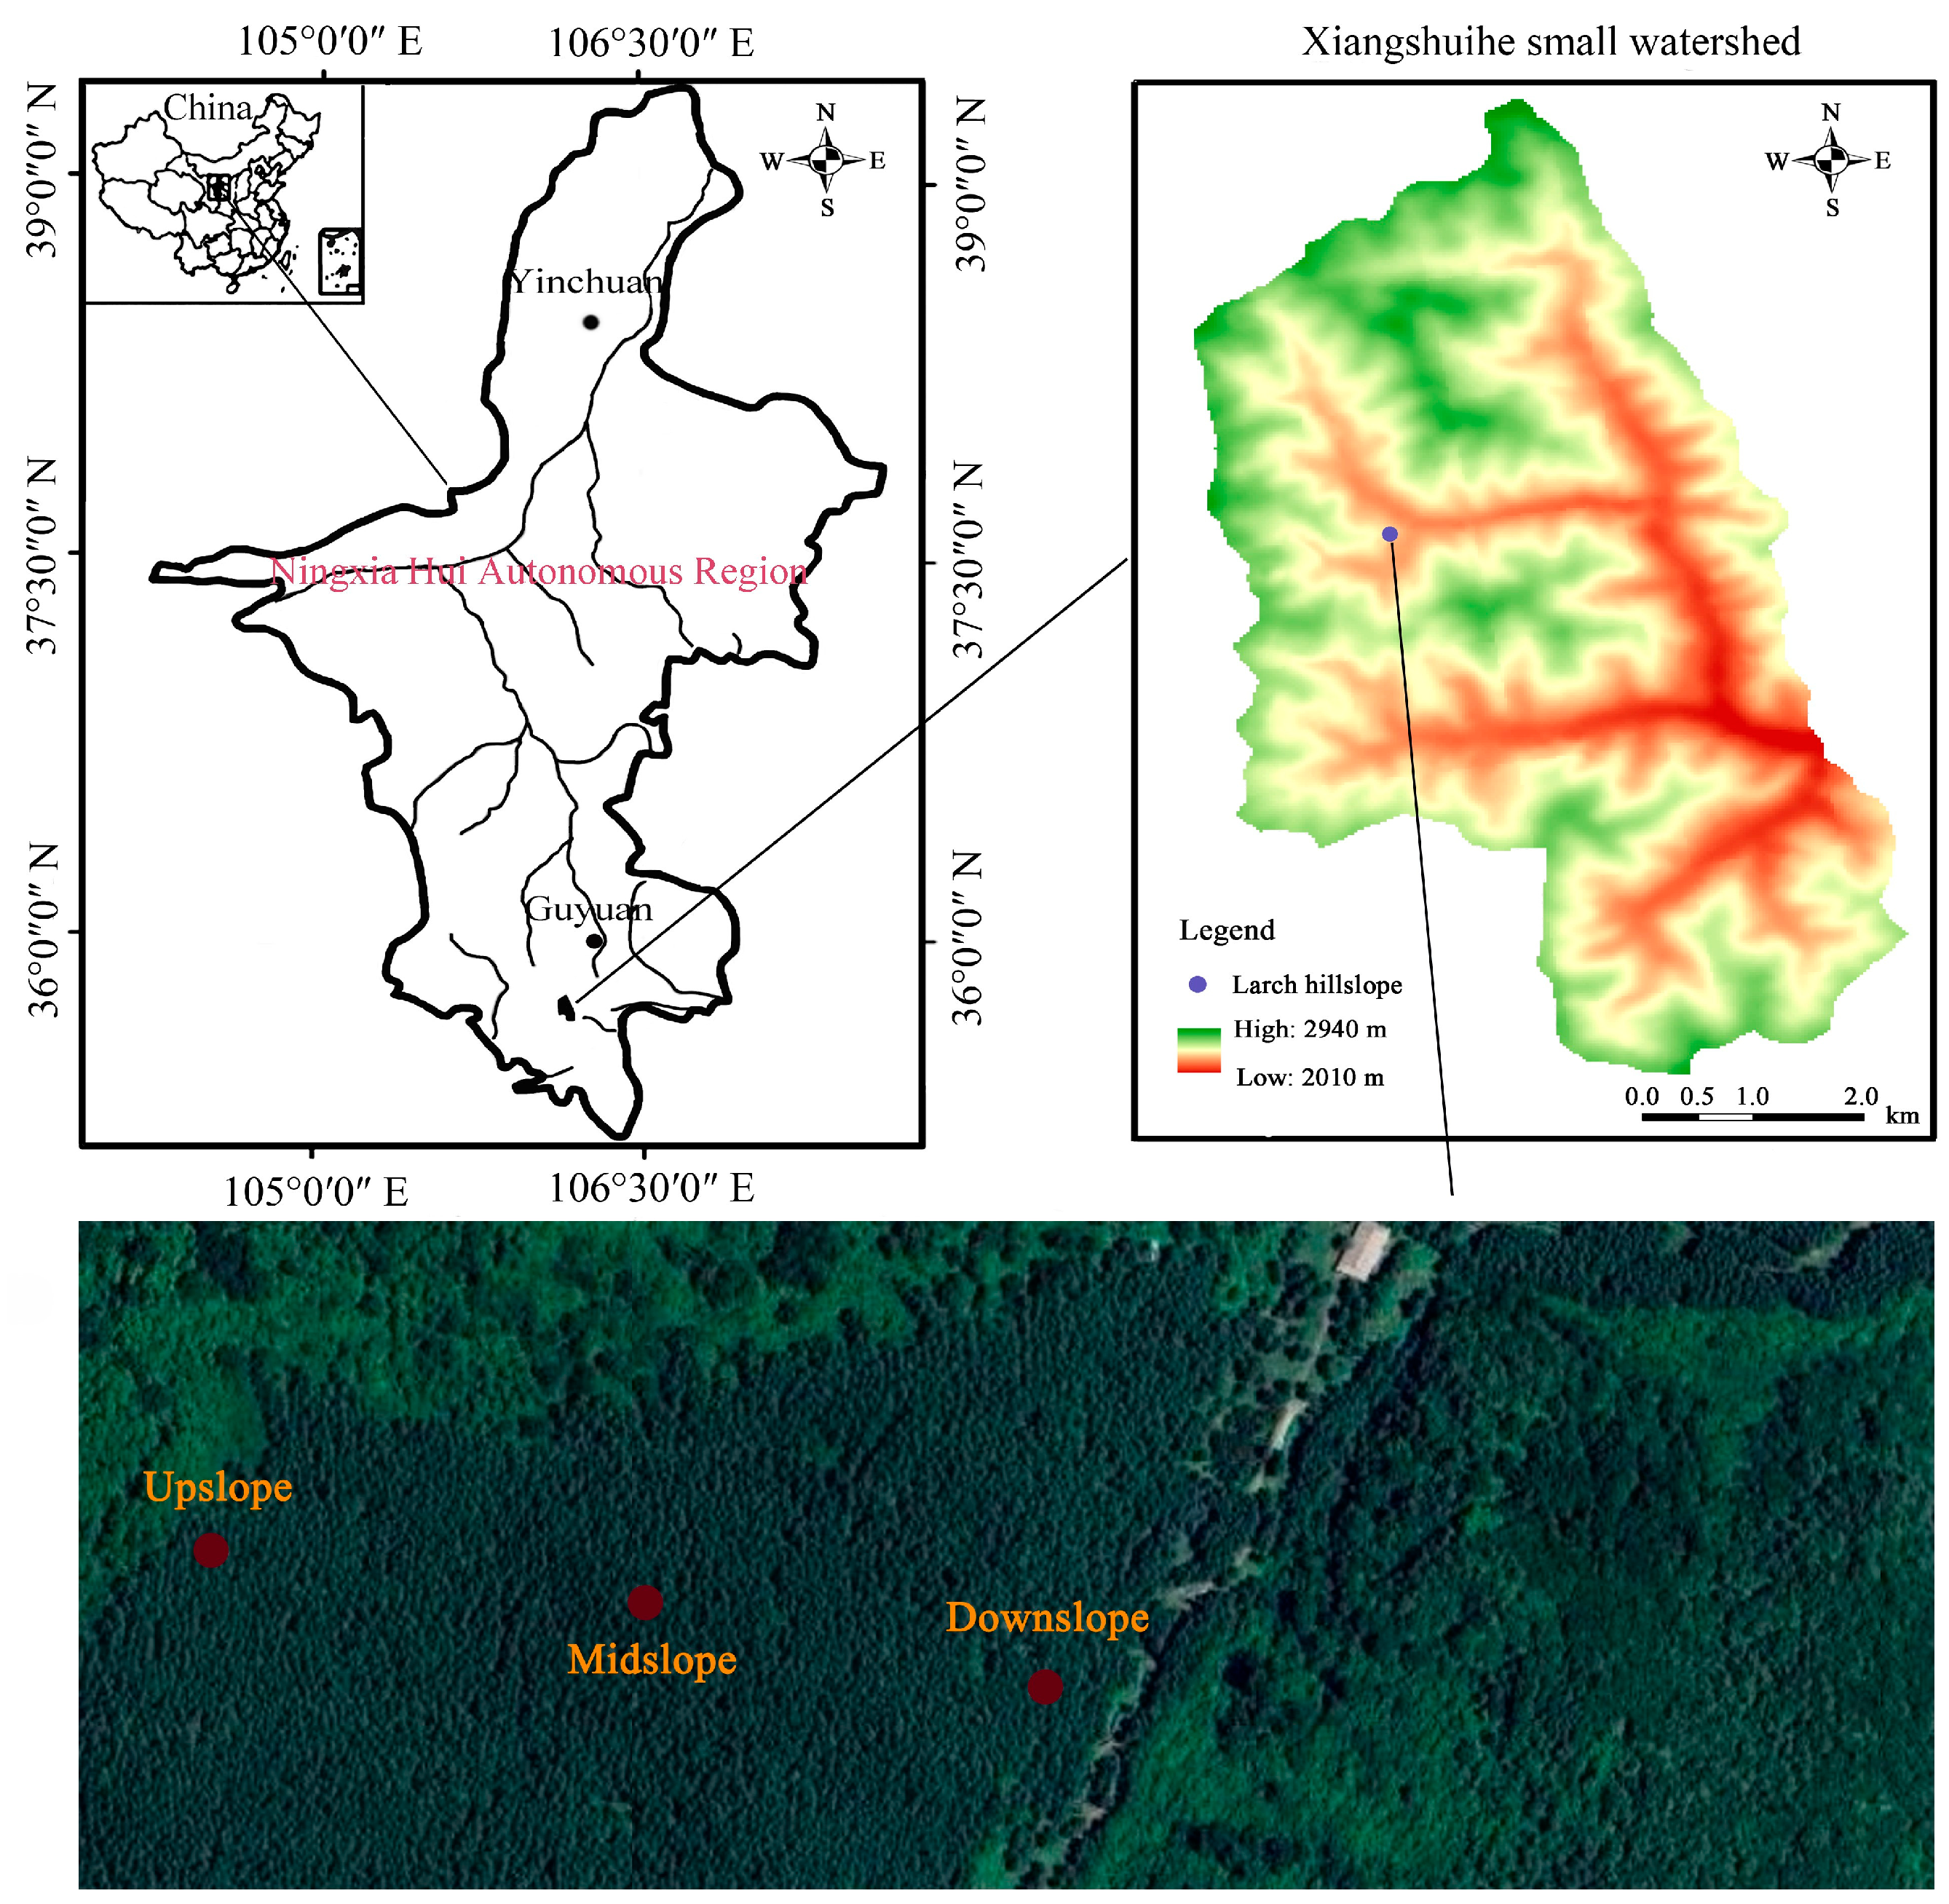
The study was carried out in the Xiangshuihe small watershed (XSW), which is located on the southern side of the Liupan Mountain Nature Reserve in Ningxia, China (106°12′–106°16′ E, 35°27′–35°33′ N). The XSW spans an area of 43.7 km2, with elevations ranging from 2010 to 2942 m above sea level. It has a warm temperate and semi-humid climate, with a mean annual temperature of 5.8 °C and an average annual rainfall of 618 mm, approximately 88% of which falls between May and October. The predominant soil type is mountain grey cinnamon soil. Vegetation cover comprises both secondary natural forests and artificial plantations. The dominant plantation species is Larix gmelinii var. principis-rupprechtii, with scattered Pinus tabuliformis Carrière. Secondary forest species include Pinus armandii Franch., Betula albosinensis Burkill, Betula platyphylla Sukaczev, and Quercus wutaishanica Mayr.

2.2. Sample Location and Collection

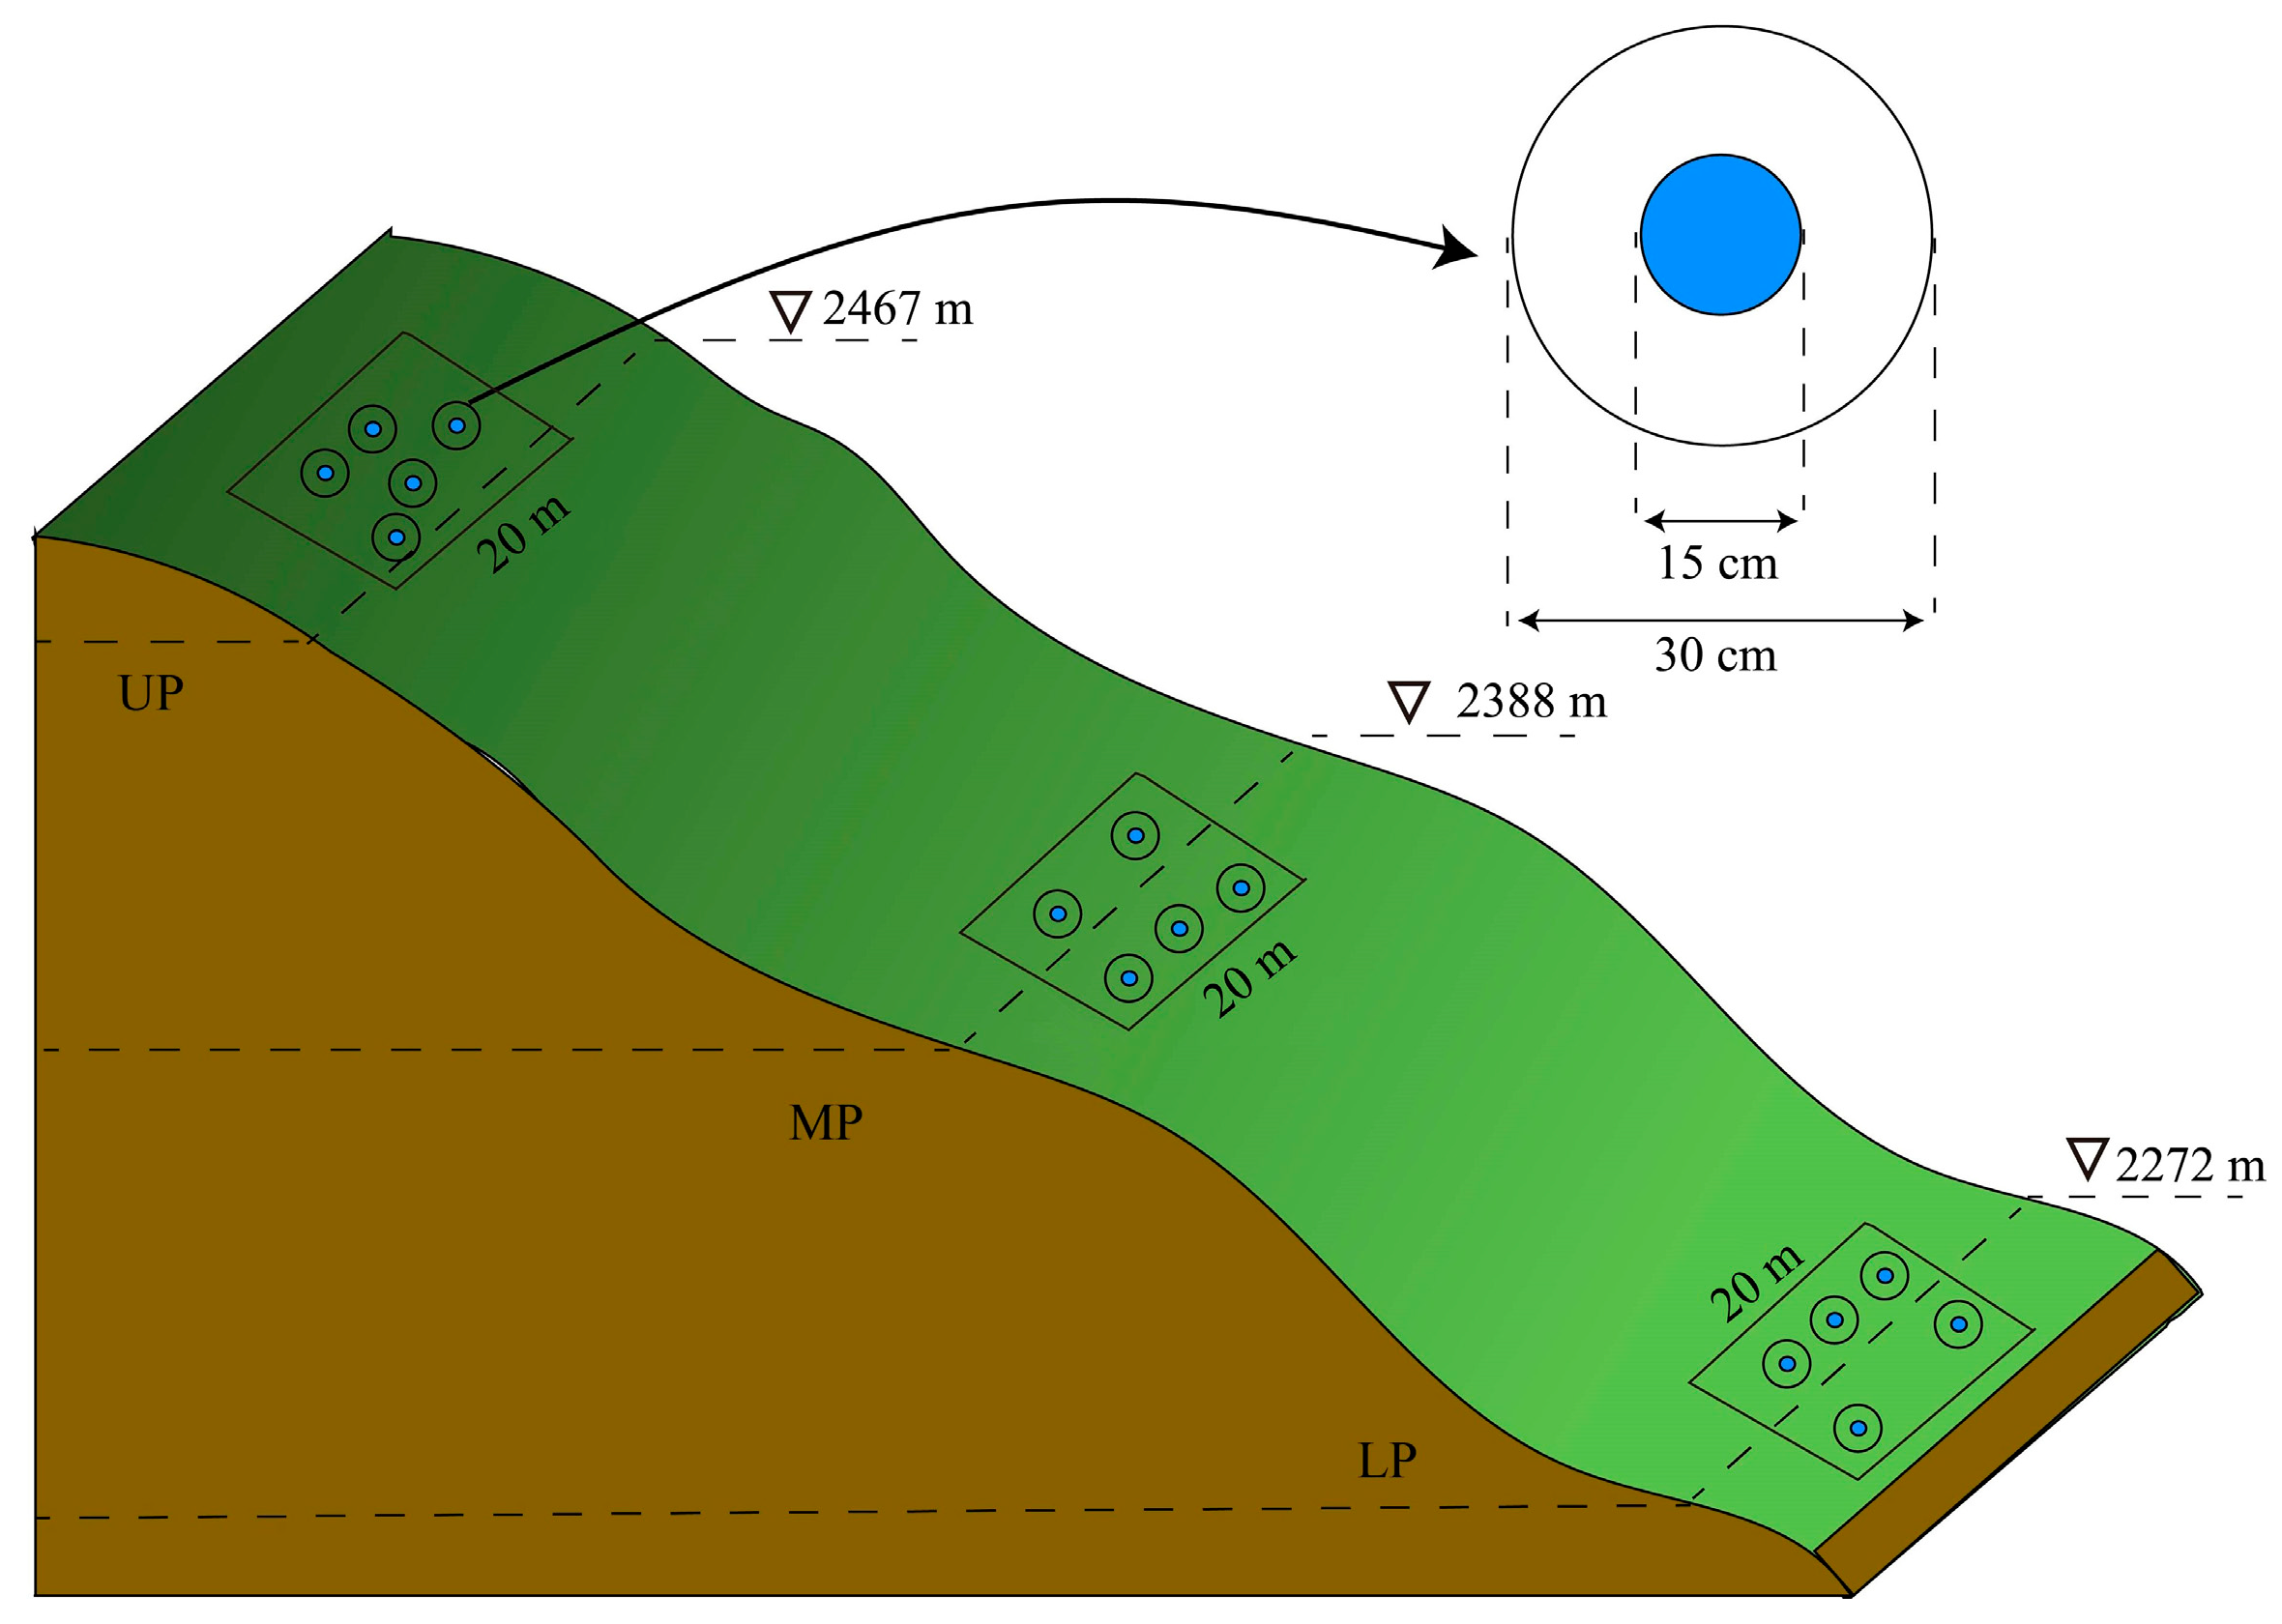
This study focused on a hillslope covered by a 44-year-old larch plantation. The hillslope is about 480 m long and has a soil depth ranging from 0.8 to 1.0 m [27]. Its lithology is sandy conglomerate and its soil type is grey cinnamon. The understorey vegetation consists of sparse shrubs, including Viburnum mongolicum (Pall.) Rehder and Berberis circumserrata (Schneid.) Schneid., which cover less than 5% coverage of the area, while herbaceous plants such as Fragaria orientalis Lozinsk. and Carex hancockiana Maxim. cover approximately 40% of the area. Three 20 m × 20 m plots were established at the upper (UP, 106°13′21″ E, 35°30′46″ N), middle (MP, 106°13′17″ E, 35°30′37″ N), and lower slope (LP, 106°13′20″ E, 35°30′36″ N) positions on the hillslope (Figure 1). In each plot, five standard trees were selected to conduct dye tracer penetration experiments. Detailed stand characteristics are shown in Table 1.

2.3. Dye Tracer Experiment

To assess preferential flow characteristics, a double-ring infiltrometer was used in combination with a Brilliant Blue dye tracer (Figure 2). The infiltration point was located 1 m away from the trunk of the selected tree. A total of 5 replicates were established per plot. Prior to the experiment, the surface litter and weeds were carefully removed to expose the bare soil and ensure accurate measurements. A double-ring infiltrometer, with an outer ring diameter of 30 cm and an inner ring diameter of 15 cm, was gently pressed into the soil surface, with an insertion depth of about 3 cm. The surrounding soil was then gently compacted using a rubber mallet to prevent water leakage along the ring walls. To ensure the comparability of dye tracer experimental results across different slope positions, the same number of replicate experiments was completed daily for each slope position. All experiments were conducted in June and July 2024.
At the start of the experiment, a solution of Brilliant Blue with a concentration of 4 g·L−1 was added to the inner ring, while the outer ring was filled with clear water. Both were maintained at a predetermined water level. The time taken for the water level in the inner ring to drop by 1 cm was recorded using a stopwatch. When the water level in the inner ring decreased by 2 cm, it was immediately replenished. Throughout the process, the outer ring was refilled as necessary to maintain the same water level as the inner ring. This process was repeated until the time taken for the water level to drop by 1 cm was consistent for three or more consecutive measurements, at which point the experiment concluded. The infiltrometer was then carefully removed, and the site was covered with plastic film to preserve moisture conditions.
After 24 h, a 40 cm wide by 60 cm deep vertical profile was excavated at the midpoint of the double-ring setup, starting from the outer ring tangent along the slope direction. Images obtained from this profile were used to extract the vertical distribution of preferential flow. Horizontal profiles were then prepared at depths of 5, 10, 20, and 30 cm within the infiltration area, covering both rings. Images were captured to extract the horizontal distribution of preferential flow. All images were then converted to black and white to obtain the vertical and horizontal distributions of preferential flow (see Section 2.4). Photographs were then taken in shaded conditions to avoid direct sunlight.

2.4. Image Processing and Analysis

Soil profile images were further processed in Adobe Photoshop CC (version 14.0, Adobe Inc., San Jose, CA, USA) to identify preferential flow pathways and subsequently quantify key preferential flow parameters. First, geometric correction was applied based on the reference scale included in each image. For vertical profiles, the upper slope edge was used as an alignment reference and each image was cropped to an actual size of 15 cm × 60 cm. Horizontal profile images were cropped to 15 cm × 30 cm according to the scale and outer ring diameter. Adjustments to brightness, saturation, contrast and hue were then uniformly applied to enhance the visual distinction between stained and unstained areas. The stained regions were converted to white using the Colour Replacement tool, followed by inversion to produce the final binary images, in which the stained areas are black and the unstained areas are white. All processed images were exported at a resolution of 1 pixel·mm−1. Finally, the binary images were imported into MATLAB R2020b (MathWorks Inc., Natick, MA, USA) for the quantitative extraction of preferential flow characteristic indices.

2.5. Plant Roots Sampling and Measurement

Root samples were collected at each infiltration point within each plot to examine the vertical distribution of understorey roots. Based on observations of infiltration profiles, the 0–40 cm soil layer was selected for root analysis because it contains the highest root density and corresponds to the dominant depth of preferential flow. Accordingly, soil samples were collected at 10 cm intervals within this depth range to characterize the vertical distribution of roots. The collected roots were washed to remove adhering soil. Root samples from the different slope positions were scanned using an Epson Perfection 4990P scanner (Seiko Epson Corp., Suwa, Japan) and analysed using the WinRHIZO root analysis system (Regent Instruments Inc., Québec, QC, Canada) to determine root length density and root surface area. The sampled roots were oven-dried at 65 °C until they reached a constant weight and were then weighed to determine the root biomass.

2.6. Soil Physical Properties Sampling and Measurement

Soil profiles were excavated around each infiltration point. To determine the physical properties of the soil, undisturbed soil samples were collected at four depths (0–10 cm, 10–20 cm, 20–40 cm, and 40–60 cm) using 100 cm3 cutting rings, with two samples taken at each depth. Additionally, disturbed soil samples were collected from the same depths to analyse particle size distribution and organic matter content. All samples were transported to the laboratory for further analysis.
Soil physical properties, including bulk density, capillary water holding capacity, field capacity, total porosity, and capillary porosity, were measured using the cutting ring method. Soil water content was determined using the oven-drying method at 105 °C until a constant weight was reached. Saturated hydraulic conductivity at the actual temperature was measured using the constant-head method on intact soil cores. To eliminate the influence of water temperature, the obtained values were further converted to the corresponding value at a standard temperature of 10 °C (Ks, mm·min−1).
A separate set of undisturbed soil samples was collected in aluminum containers from the same depth intervals for aggregate stability analysis. The soil aggregate size distribution was determined using the wet sieving method according to the procedure of He et al. [28], based on the oscillation and fractional sieving of pre-saturated aggregates. The total water-stable aggregate mass (WSA, %) was calculated using the following equation:
W S A = i = 1 n W S A i
where i represents the aggregate size class, WSAi is the proportion of the i-th aggregate fraction weight to the total sample weight, and n is the number of aggregate fractions.
Disturbed soil samples were used to determine the basic soil properties, such as particle size distribution and organic matter content. Particle size distribution was analysed using a Mastersizer 3000 laser diffractometer (Malvern Panalytical Ltd., Malvern, UK) and classified according to the US Department of Agriculture (USDA) system as clay, silt, and sand fractions. Soil organic matter content was measured using the potassium dichromate colorimetric method [29].

2.7. Quantification of Preferential Flow

2.7.1. Characteristic Indices of Preferential Flow

(1)
Dye coverage (DC)
Dye coverage is defined as the percentage of the stained area relative to the total area of the soil profile [30]. It reflects the extent of solution movement through and is calculated as follows:
D C = D r s S × 100 %
where DC is the dye coverage (%), Drs is the stained area (mm2), and S is the total profile area (mm2).
(2)
Total stained area (TotStAr)
The total stained area is defined as the sum of all the stained regions within a 15 cm × 60 cm profile [12].
(3)
Uniform infiltration depth (UniFr)
Infiltration is considered uniform when the dye coverage is below 80%. UniFr is defined as the soil depth at which the stained area ratio reaches or exceeds 80% in the vertical soil profile [31]. A higher UniFr value indicates that preferential flow occurs later during infiltration.
(4)
Preferential flow fraction (PF-fr)
The preferential flow fraction represents the proportion of the total stained area attributed to regions of preferential flow in the vertical profile [31]. It is calculated as follows:
P F - f r = 100 × 1 U n i F r × W T o t S t A r
where PF-fr is the preferential flow fraction (%), UniFr is the uniform infiltration depth (cm), TotStAr is the total stained area (cm2), and W is the horizontal width of the soil profile (15 cm in this study).
(5)
Length index (LI)
The length index quantifies the variation in the ratio of stained area between adjacent soil layers after the vertical soil profile is divided into equal segments [32]. A higher LI value indicates greater spatial variability in preferential flow. It is calculated as follows:
L I = i = 1 N D C i + 1 D C i
where LI is the length index, DCi+1 and DCi are the dye coverage values (%) of the (i + 1)-th and i-th layers, respectively, and N is the total number of layers.
(6)
Peak index (PI)
The peak index is defined as the number of intersections between the horizontal line representing the total dye coverage and the vertical dye coverage profile. This parameter reflects the spatial heterogeneity in stained patterns, where higher PI values indicate more pronounced preferential flow [32].

2.7.2. Preferential Flow Evaluation Index

The preferential flow evaluation index provides a quantitative measure of the degree of preferential flow development; higher values indicate more pronounced preferential flow. All preferential flow indicators were standardised using the mean-square deviation decision method to obtain dimensionless values. These values were then used to compute the mean, standard deviations, and weight coefficients required to determine the evaluation index, as detailed below:
(1)
Standardization of positive-correlation indicators:
Z i j = X i j X m i n j X m a x j X m i n j
where j is the indicator number, Zij is the standardized value of the i-th observation for the j-th indicator, Xij is the original value, and Xmin−j and Xmax−j are the minimum and maximum values of indicator j, respectively.
(2)
Standardization of negative-correlation indicators:
Z i j = X m a x j X i j X m a x j X m i n j
(3)
Standard deviation of each indicator:
σ G j = 1 m i = 1 m Z i j E G j 2
where σ(Gj) is the standard deviation of indicator j, m is the number of observations (m = 15), and E(Gj) is the mean of standardized values for indicator j:
E G i = 1 m i = 1 m Z i j
(4)
Weight coefficient of each indicator Wj:
W j = σ ( G j ) j = 1 6 σ ( G j )
(5)
Preferential flow index (PFI):
P F I = j = 1 6 i = 1 m Z i j W j

2.8. Data Analysis

Preferential flow characteristic indices were extracted and calculated using MATLAB R2020b (MathWorks Inc., Natick, MA, USA). Differences in soil physical properties and root traits across slope positions were assessed using one-way analysis of variance (ANOVA) and the least significant difference (LSD) test, performed in SPSS 26.0 (IBM Corp., Armonk, NY, USA). Pearson’s correlation analysis was also performed in SPSS 26.0 to examine the relationships between soil physical properties, root characteristics, and preferential flow infiltration. Correlations with p < 0.05 were considered statistically significant, and those with p < 0.01 were considered highly significant.

3. Results

3.1. Soil Physicochemical Properties and Root Traits

There were significant differences in the soil physicochemical properties among the different slope positions (Table 2). The lower slope position had the highest organic matter content and water-stable aggregates. The mid-slope position had the highest saturated hydraulic conductivity, total porosity and sand content, and the lowest soil bulk density. The upper slope position had a higher silt content, non-capillary porosity, and capillary water holding capacity.
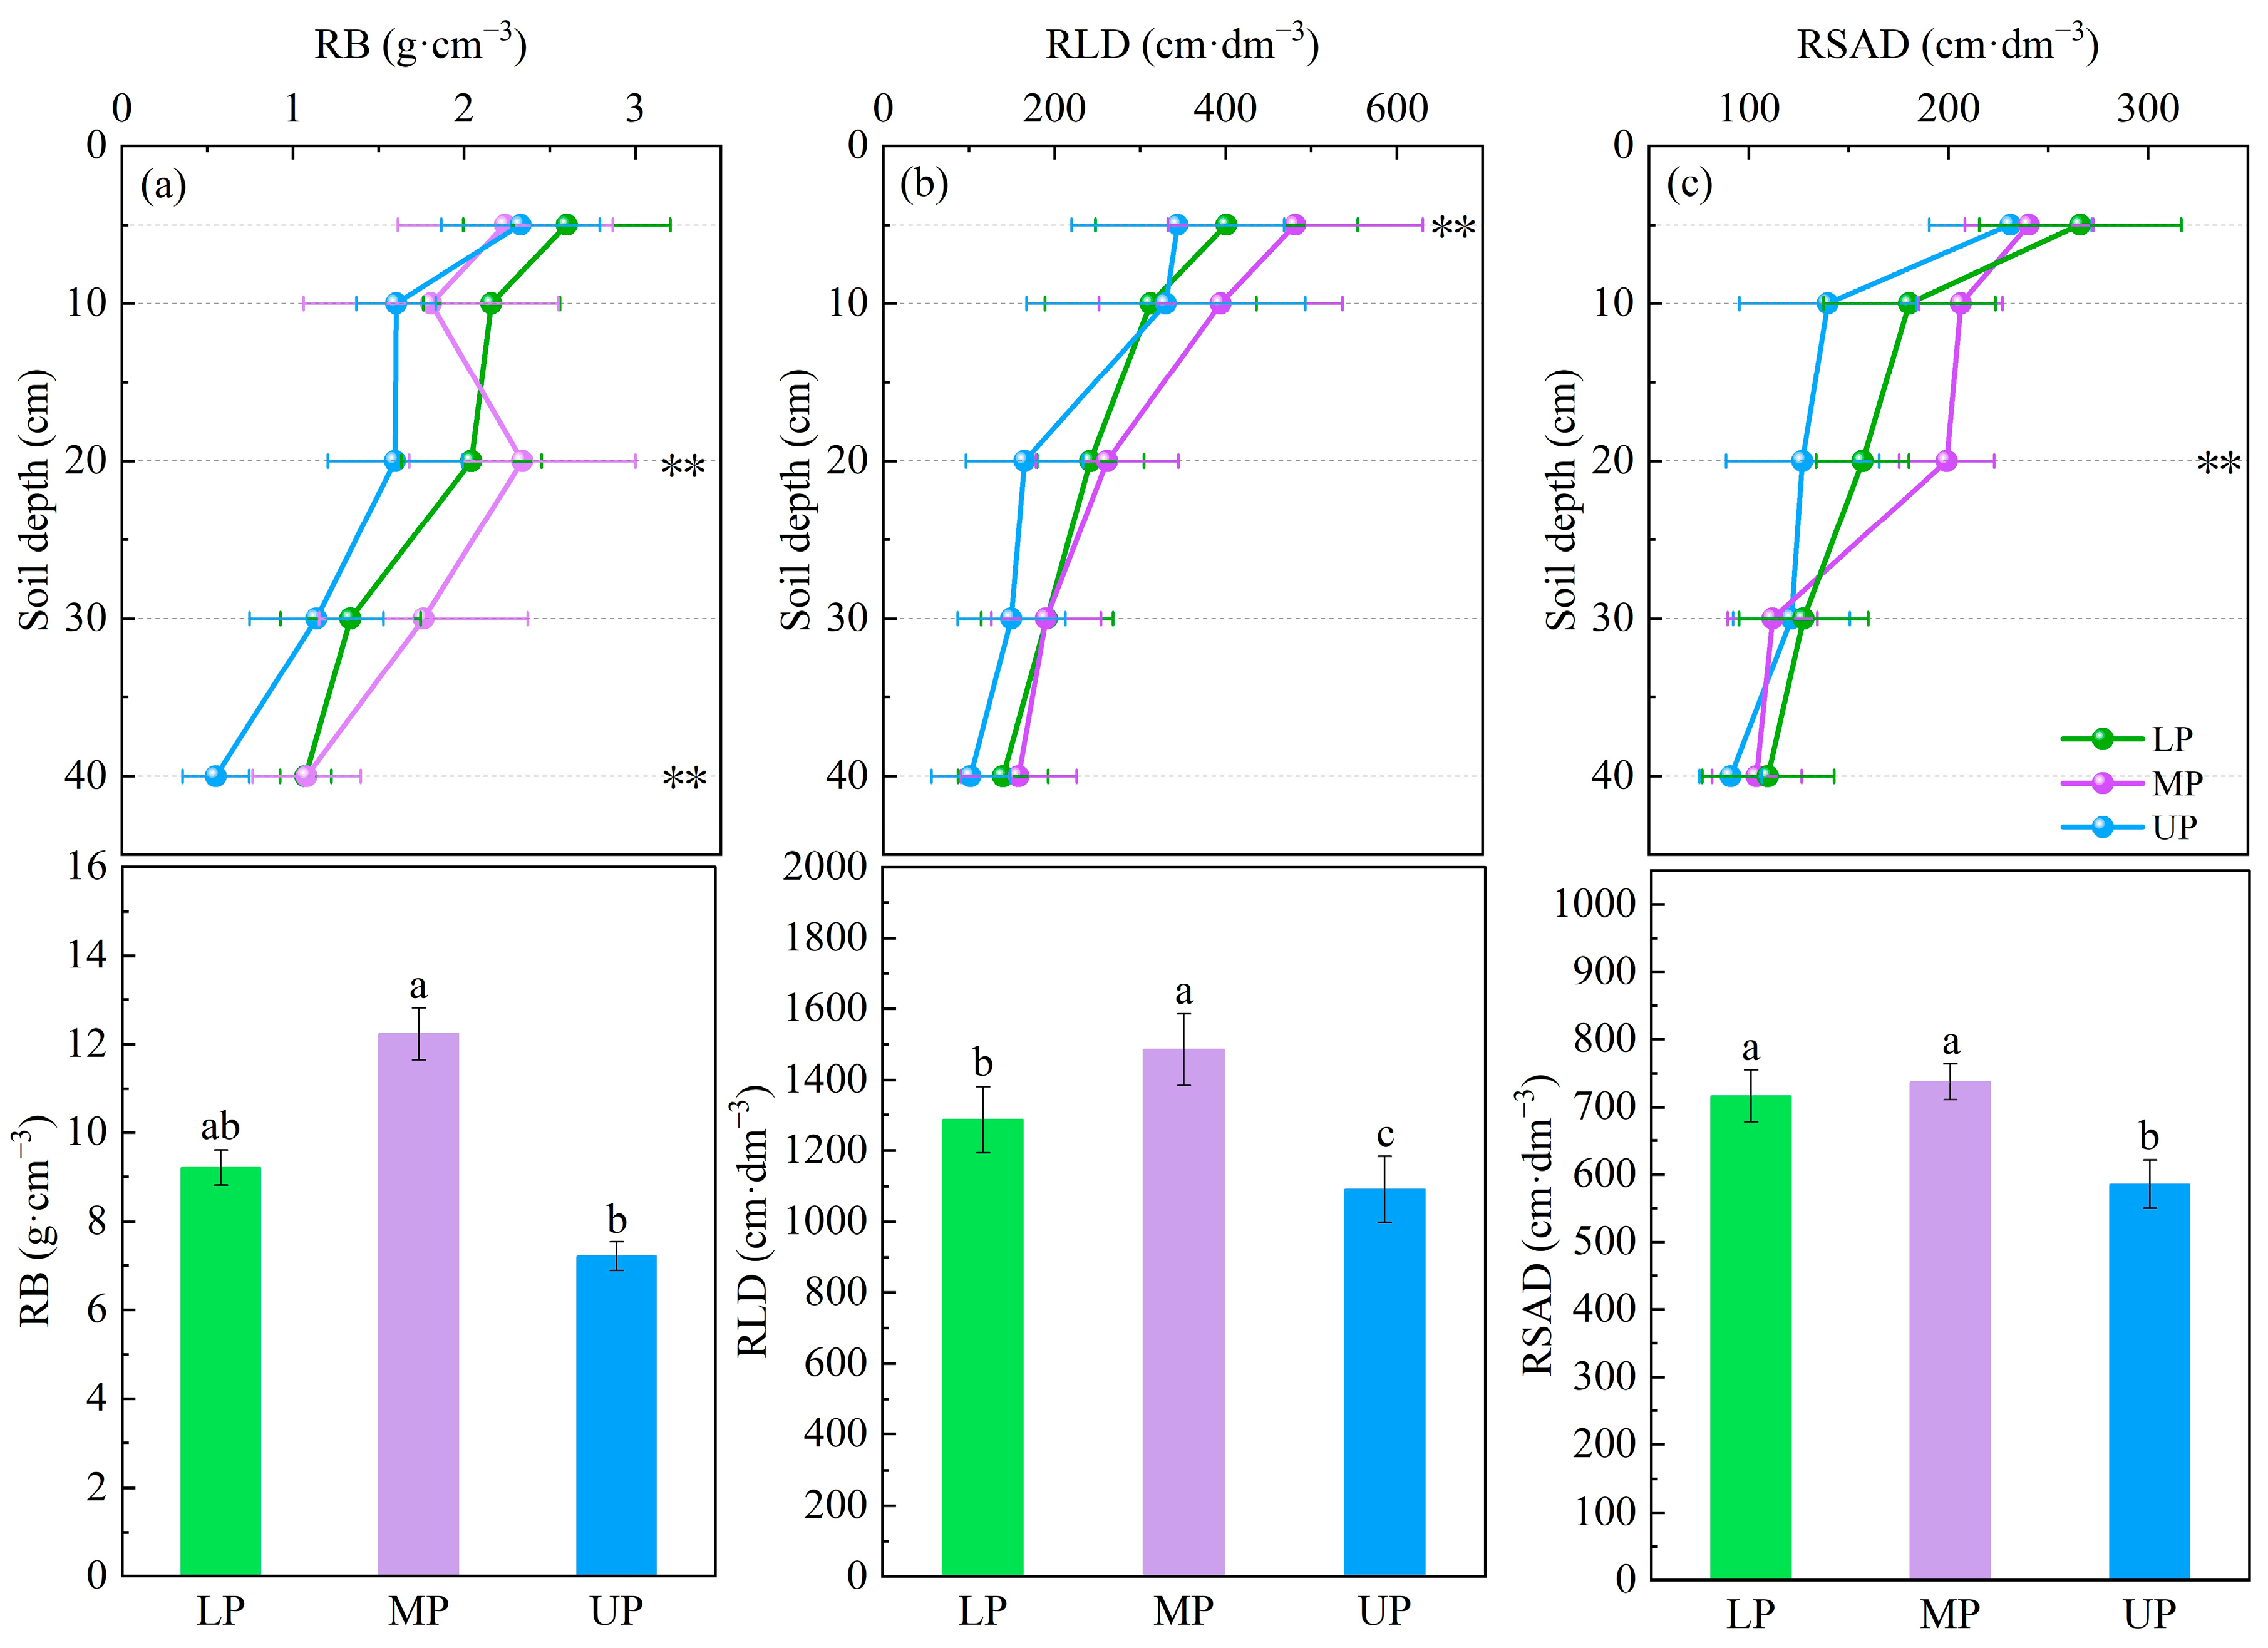
In terms of root system characteristics, the total root biomass (RB), root length density (RLD), and root surface area density (RSAD) of the three slope positions decreased significantly with increasing soil depth (Figure 3). RB, RLD, and RSAD were all significantly higher at the mid-slope position than at the upper slope position. Additionally, the RLD at the lower slope position exceeded that at the upper slope position, while the RSAD at both the mid- and lower slope positions was significantly greater.

3.2. Morphological Characteristics of Preferential Flow Pathways

3.2.1. Horizontal Staining Patterns Across Slope Positions

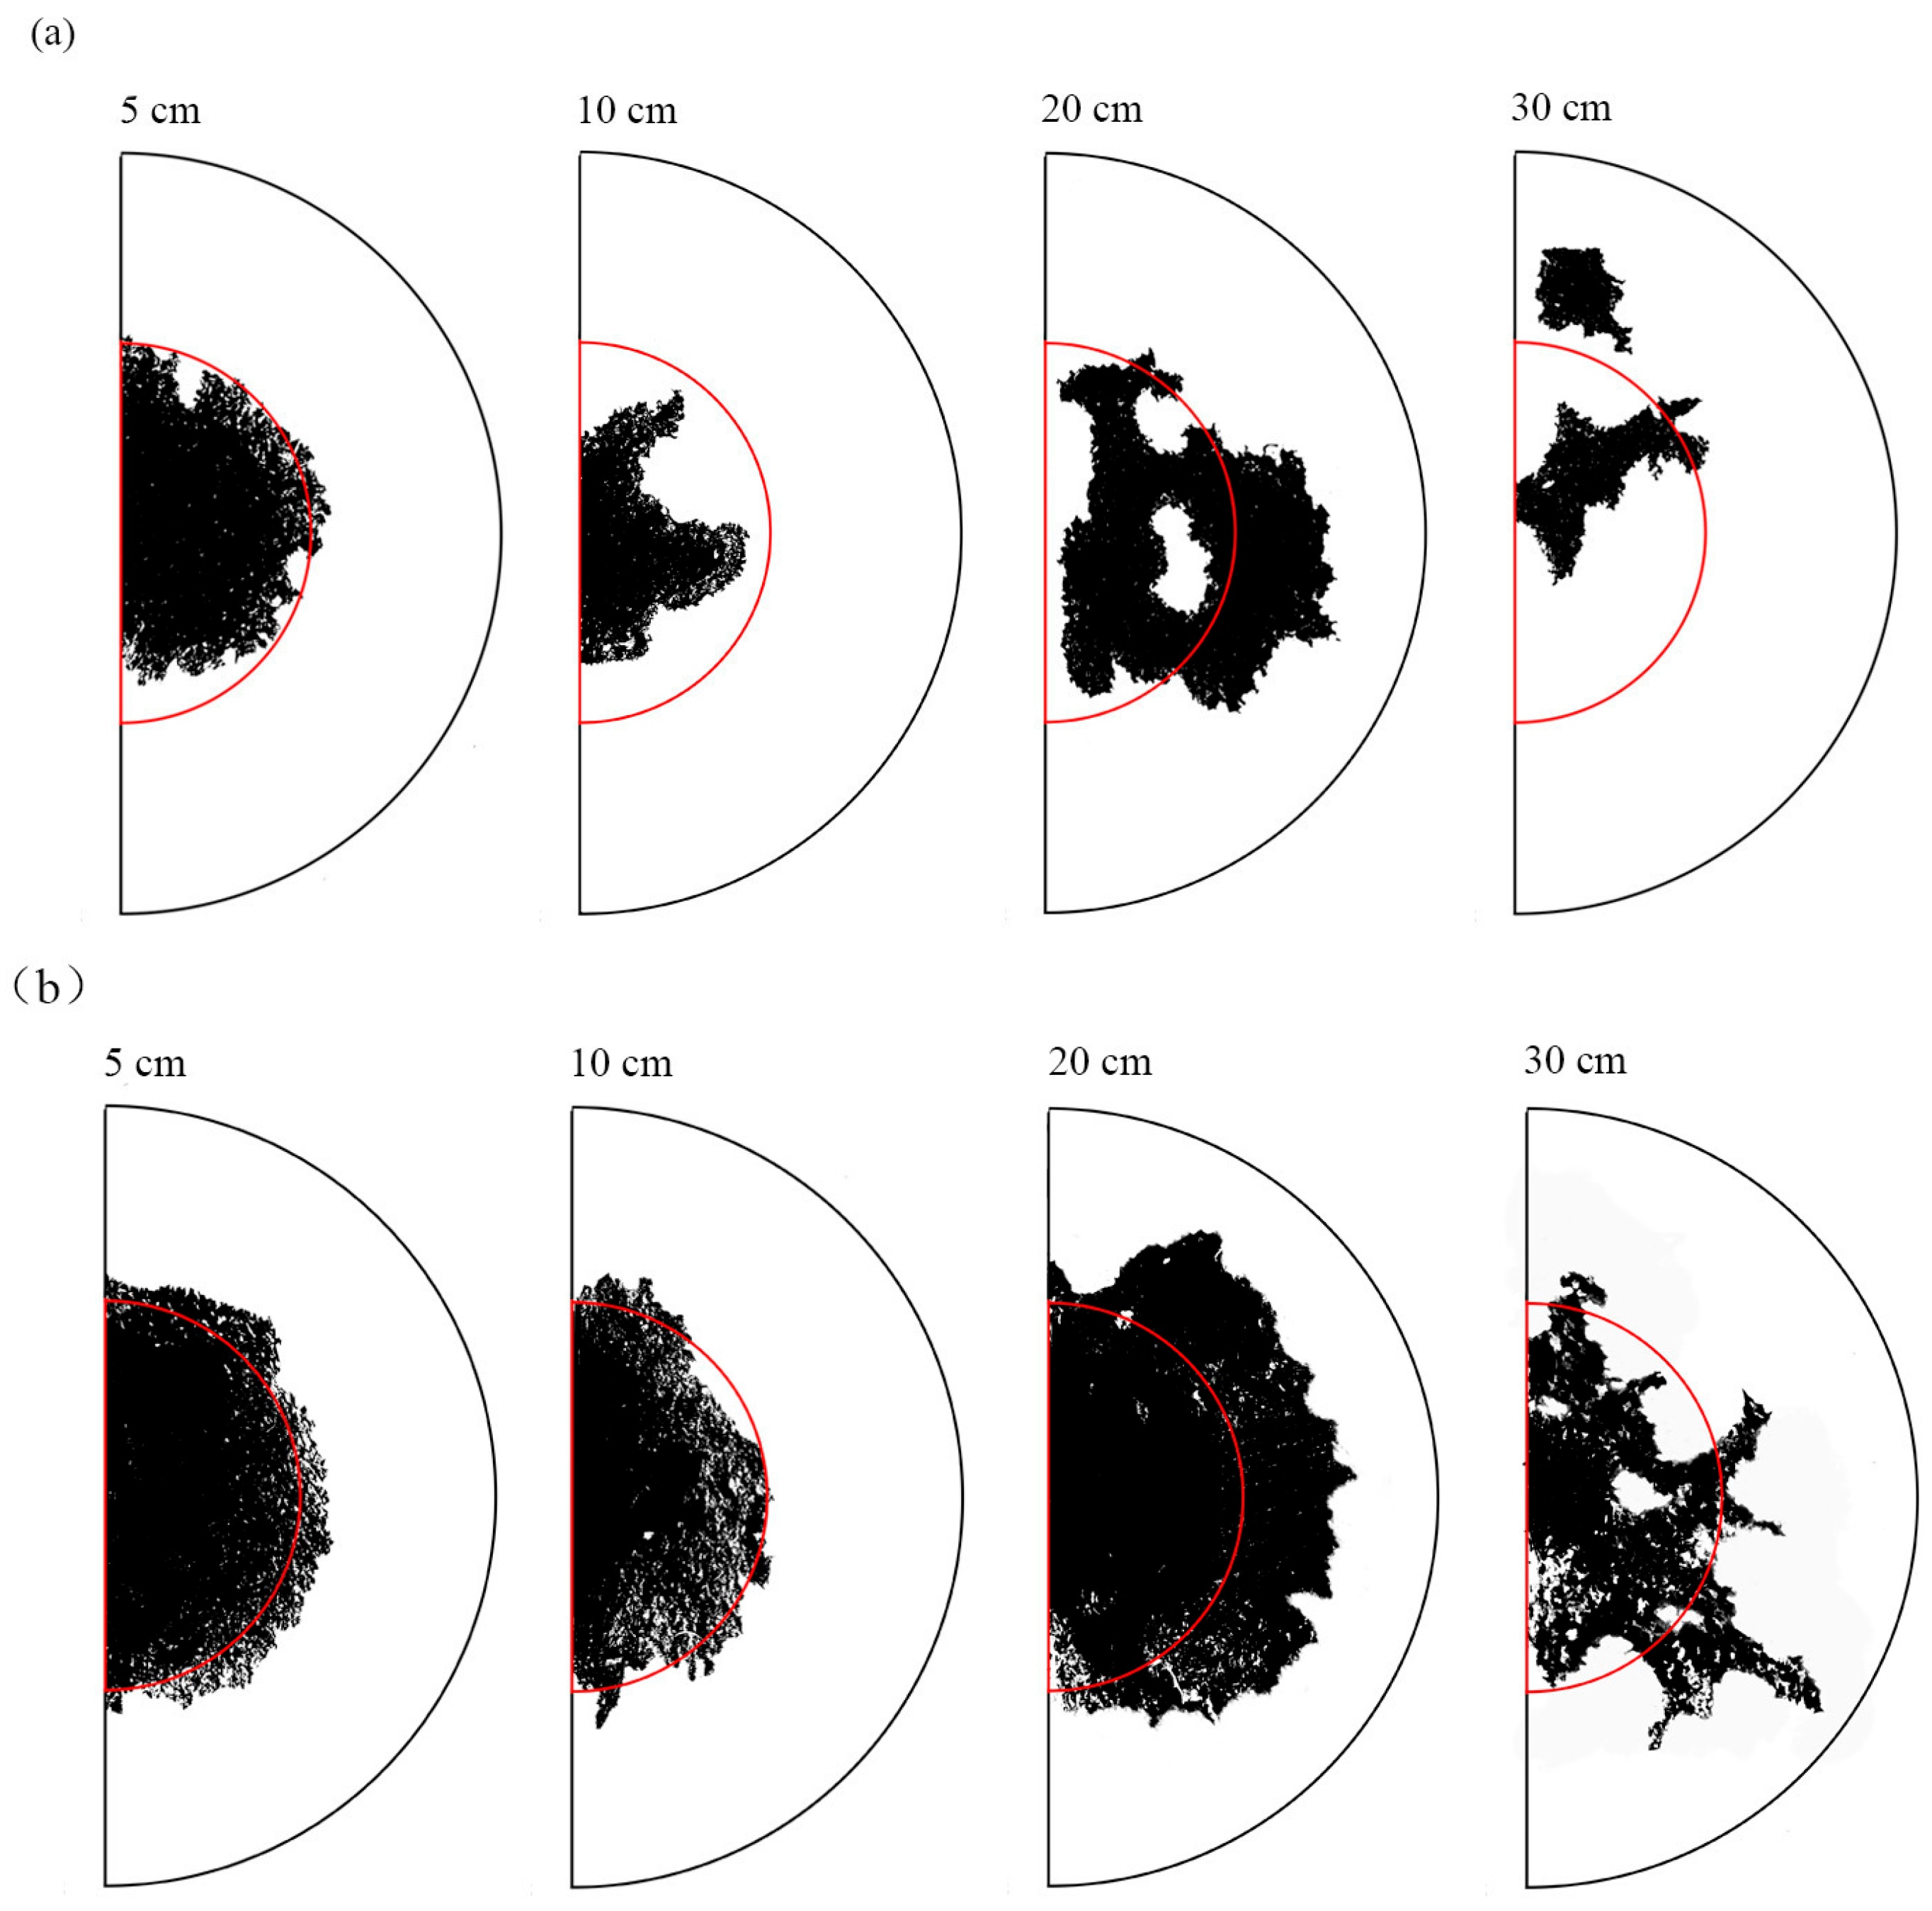
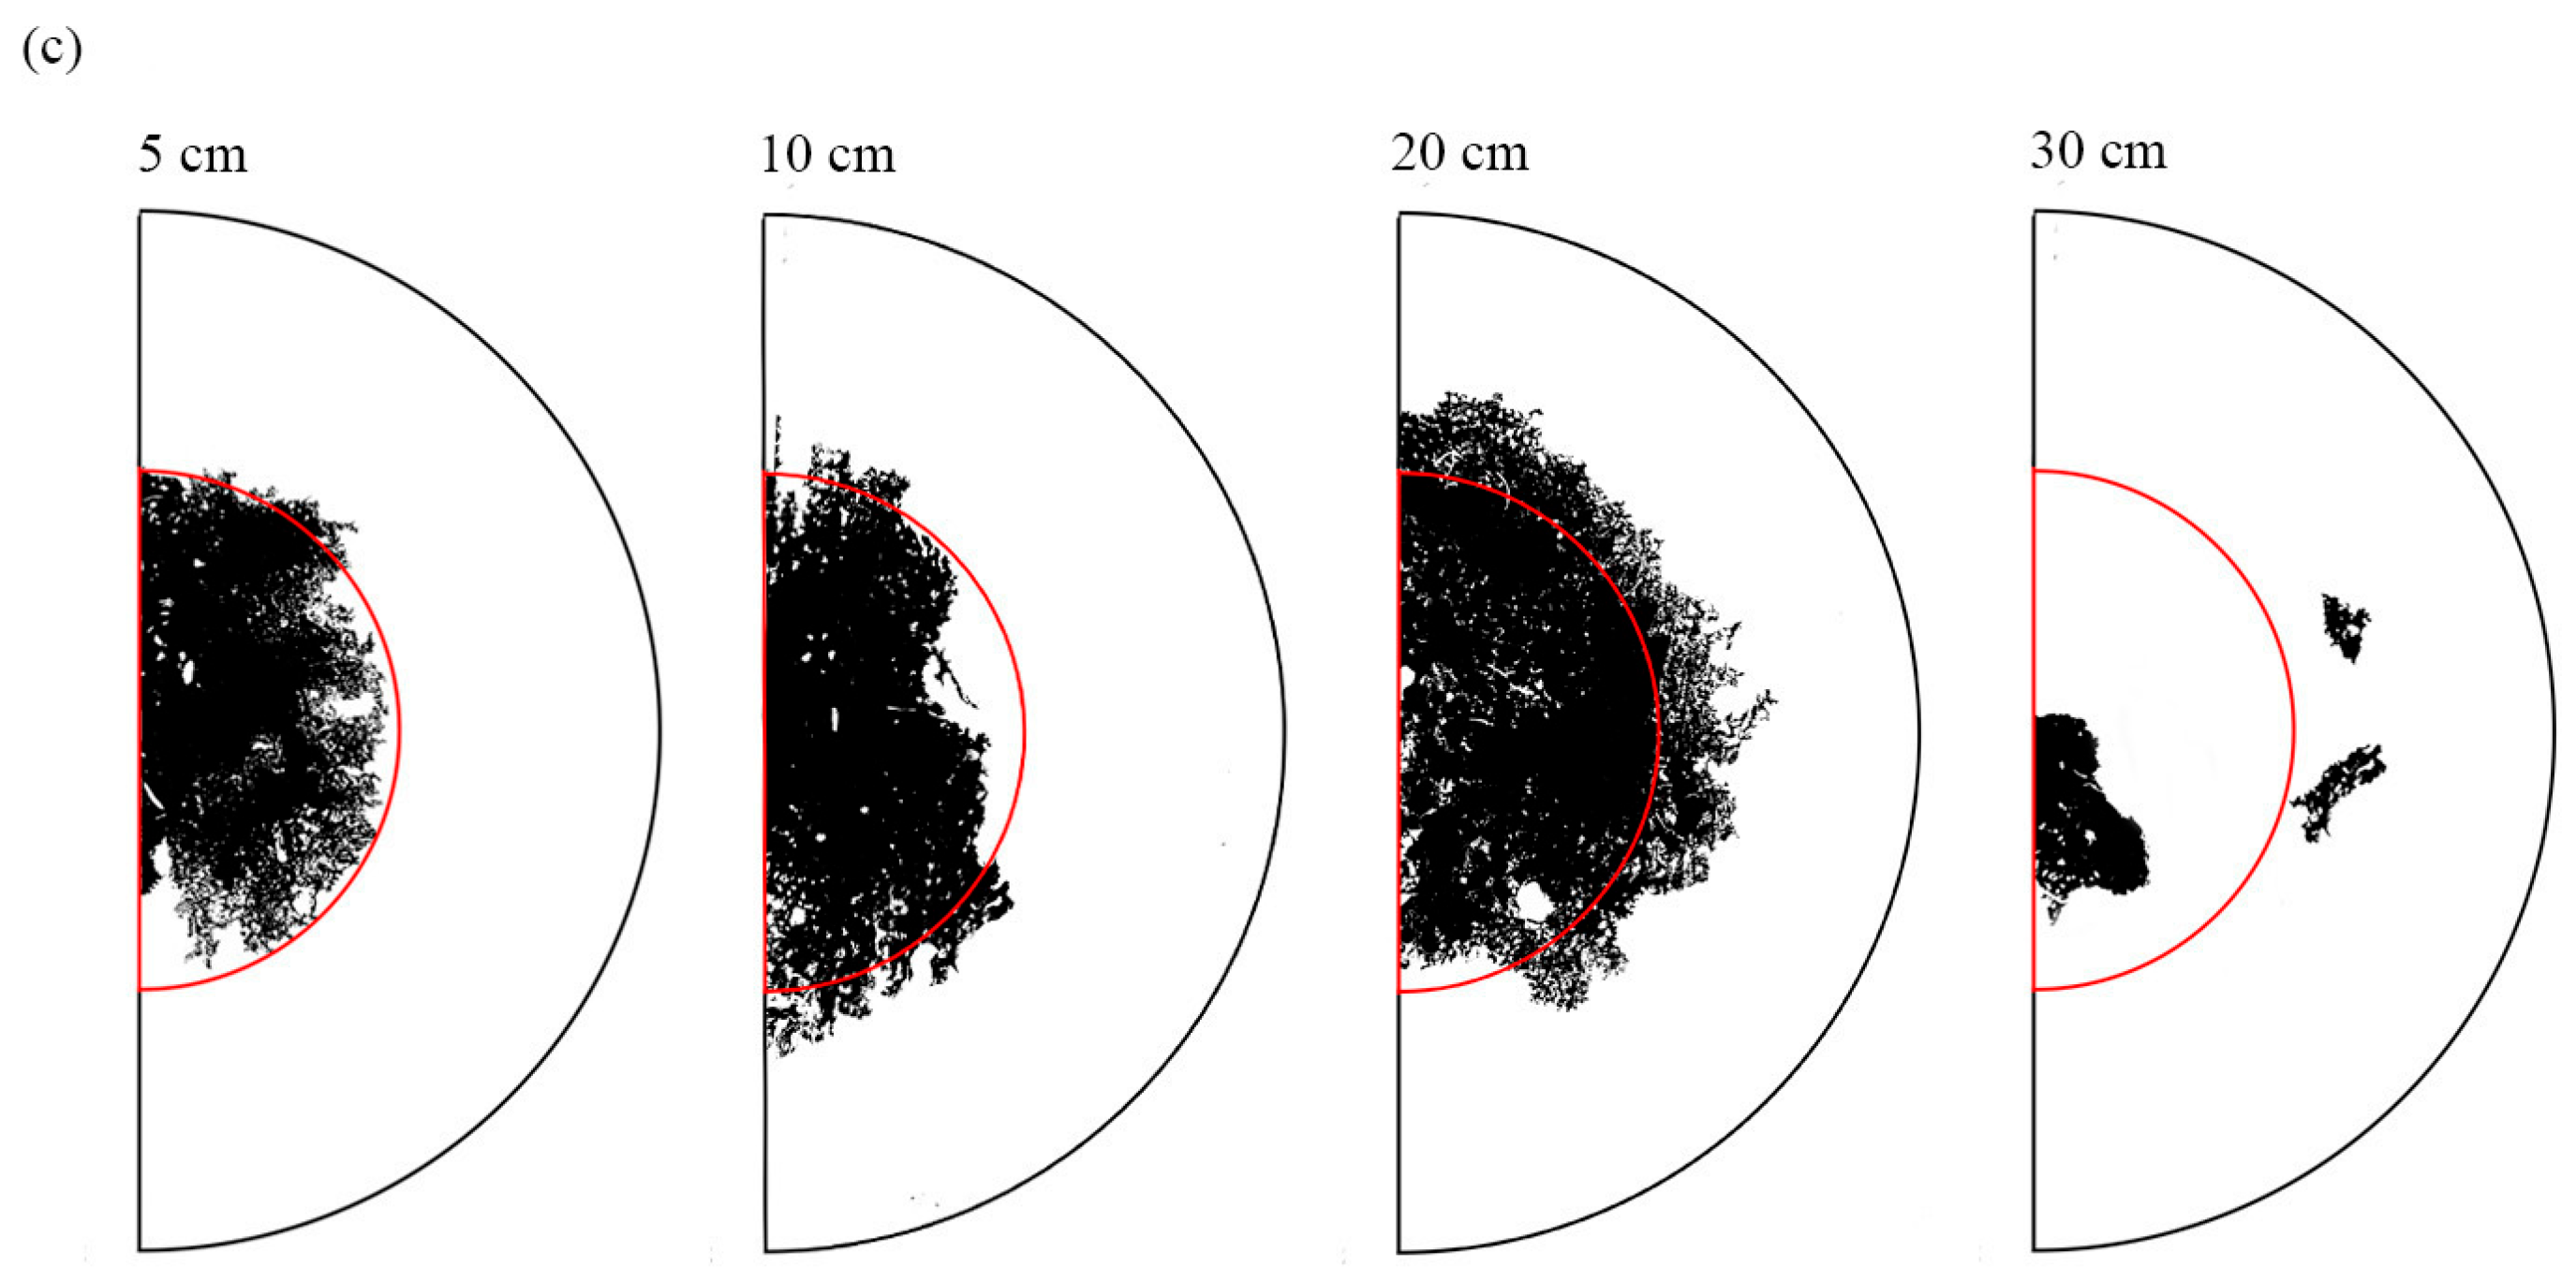
Representative horizontal staining profiles are illustrated in Figure 4. At a soil depth of 5 cm, staining was concentrated within the inner ring at all slope positions, suggesting dominant vertical infiltration. At 10 cm depth, the staining expanded towards the interface between the inner and outer rings at the upper and middle slope positions, indicating enhanced lateral flow. However, staining decreased at the lower slope position. At 20 cm depth, distinct lateral preferential flow pathways were evident, with the middle slope position showing the greatest development. At 30 cm depth, the staining became fragmented, with fewer and less connected flow channels.
The horizontal stained area ratios differed among slope positions (Table 3). The stained area ratios at all slope positions consistently increased initially and then decreased with depth, reaching a maximum at the 20 cm soil layer (mid-slope: 63.1%, upper slope: 43.5%, and lower slope: 35.5%); the minimum values occurred at the 30 cm layer (mid-slope: 27.0%, lower slope: 11.9%, and upper slope: 6.0%). The mid-slope position consistently demonstrated significantly greater stained area ratios than the upper and lower slope positions across all soil layers, with the most pronounced differences observed at depths of 5 cm and 30 cm. In certain layers, the lower slope position exceeded the upper slope position in terms of staining extent.

3.2.2. Vertical Differentiation of Preferential Flow Paths Along the Hillslope

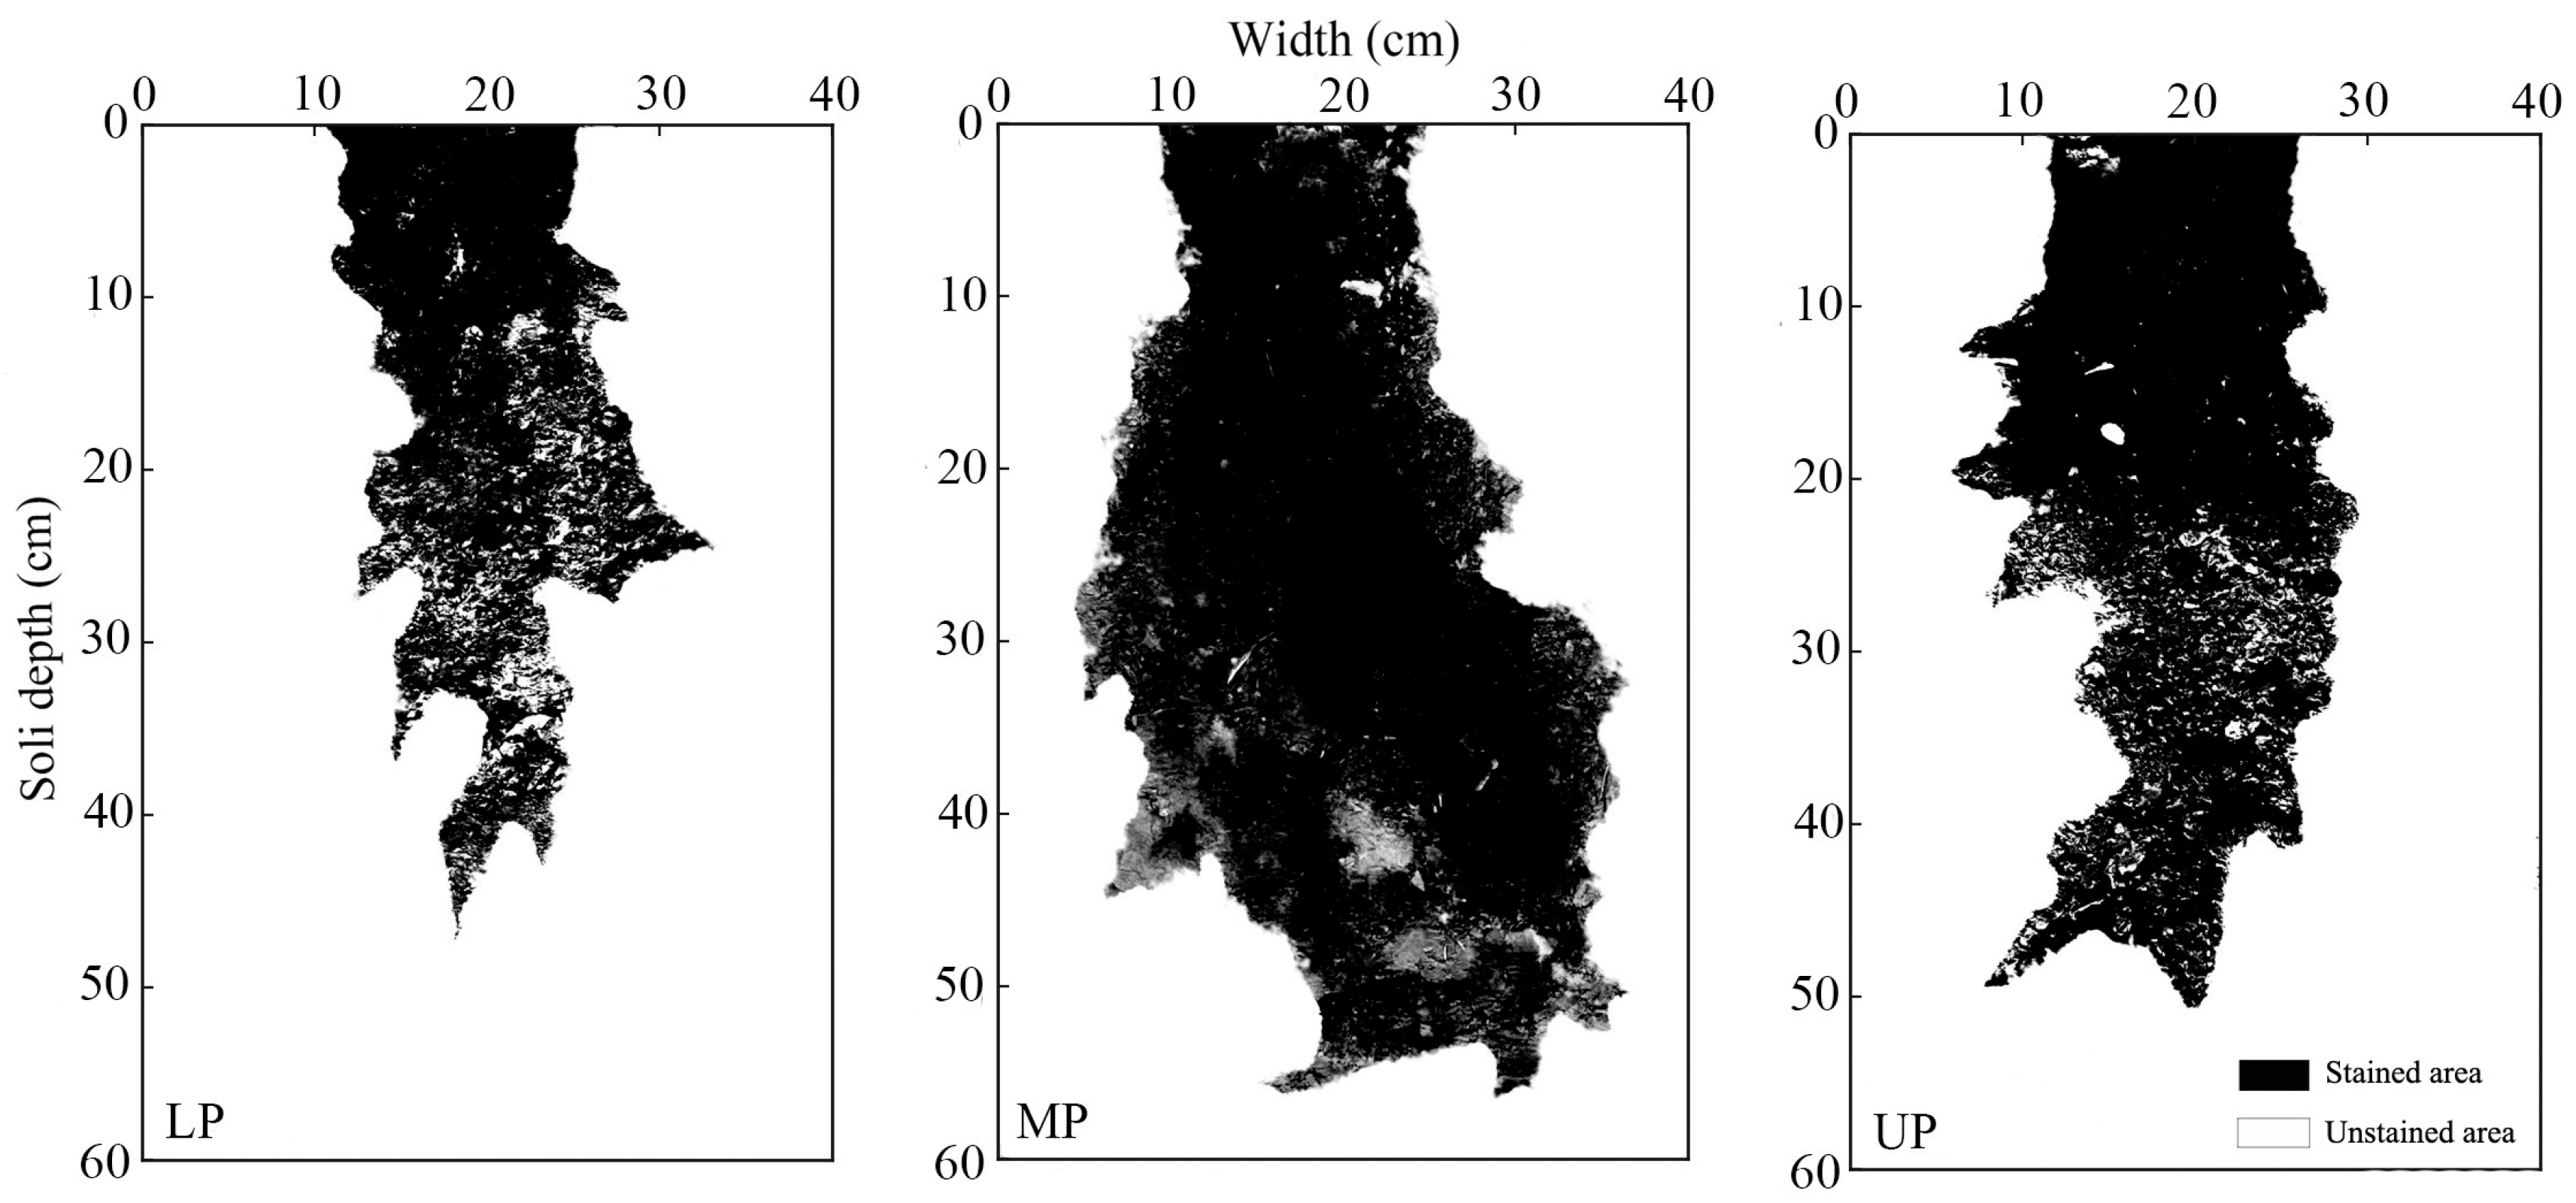
Distinct subsurface flow patterns were revealed by vertical dye staining across the slope positions (Figure 5). Matrix flow dominated at a depth of 10 cm depth at all slope positions, while preferential flow developed progressively with depth. The upper slope position exhibited finger-like vertical infiltration extending to 50 cm. The mid-slope position exhibited the deepest infiltration (60 cm) and the most extensive and continuous staining, indicating well-developed preferential flow. Below 30 cm, there was a transition from uniform matrix flow to lateral preferential pathways. In contrast, the lower slope position exhibited shallower penetration (35–45 cm) and fragmented, funnel-shaped or dendritic moisture distribution along macropores.
The variation in the vertical stained area ratio with soil depth differed among slope positions (Table 4). The upper and lower slope positions exhibited maximum staining at a depth of 20–30 cm (62.8% and 42.4%, respectively), whereas the mid-slope position showed a significantly higher peak (78.2%) at a greater depth (30–40 cm). Below the shallow surface layer, the staining ratio of mid-slope position consistently exceeded those of the upper and lower slope positions throughout the 10–60 cm profile, with the most pronounced disparities concentrated in the 30–50 cm layer.

3.3. Slope-Dependent Differences in Key Preferential Flow Metrics

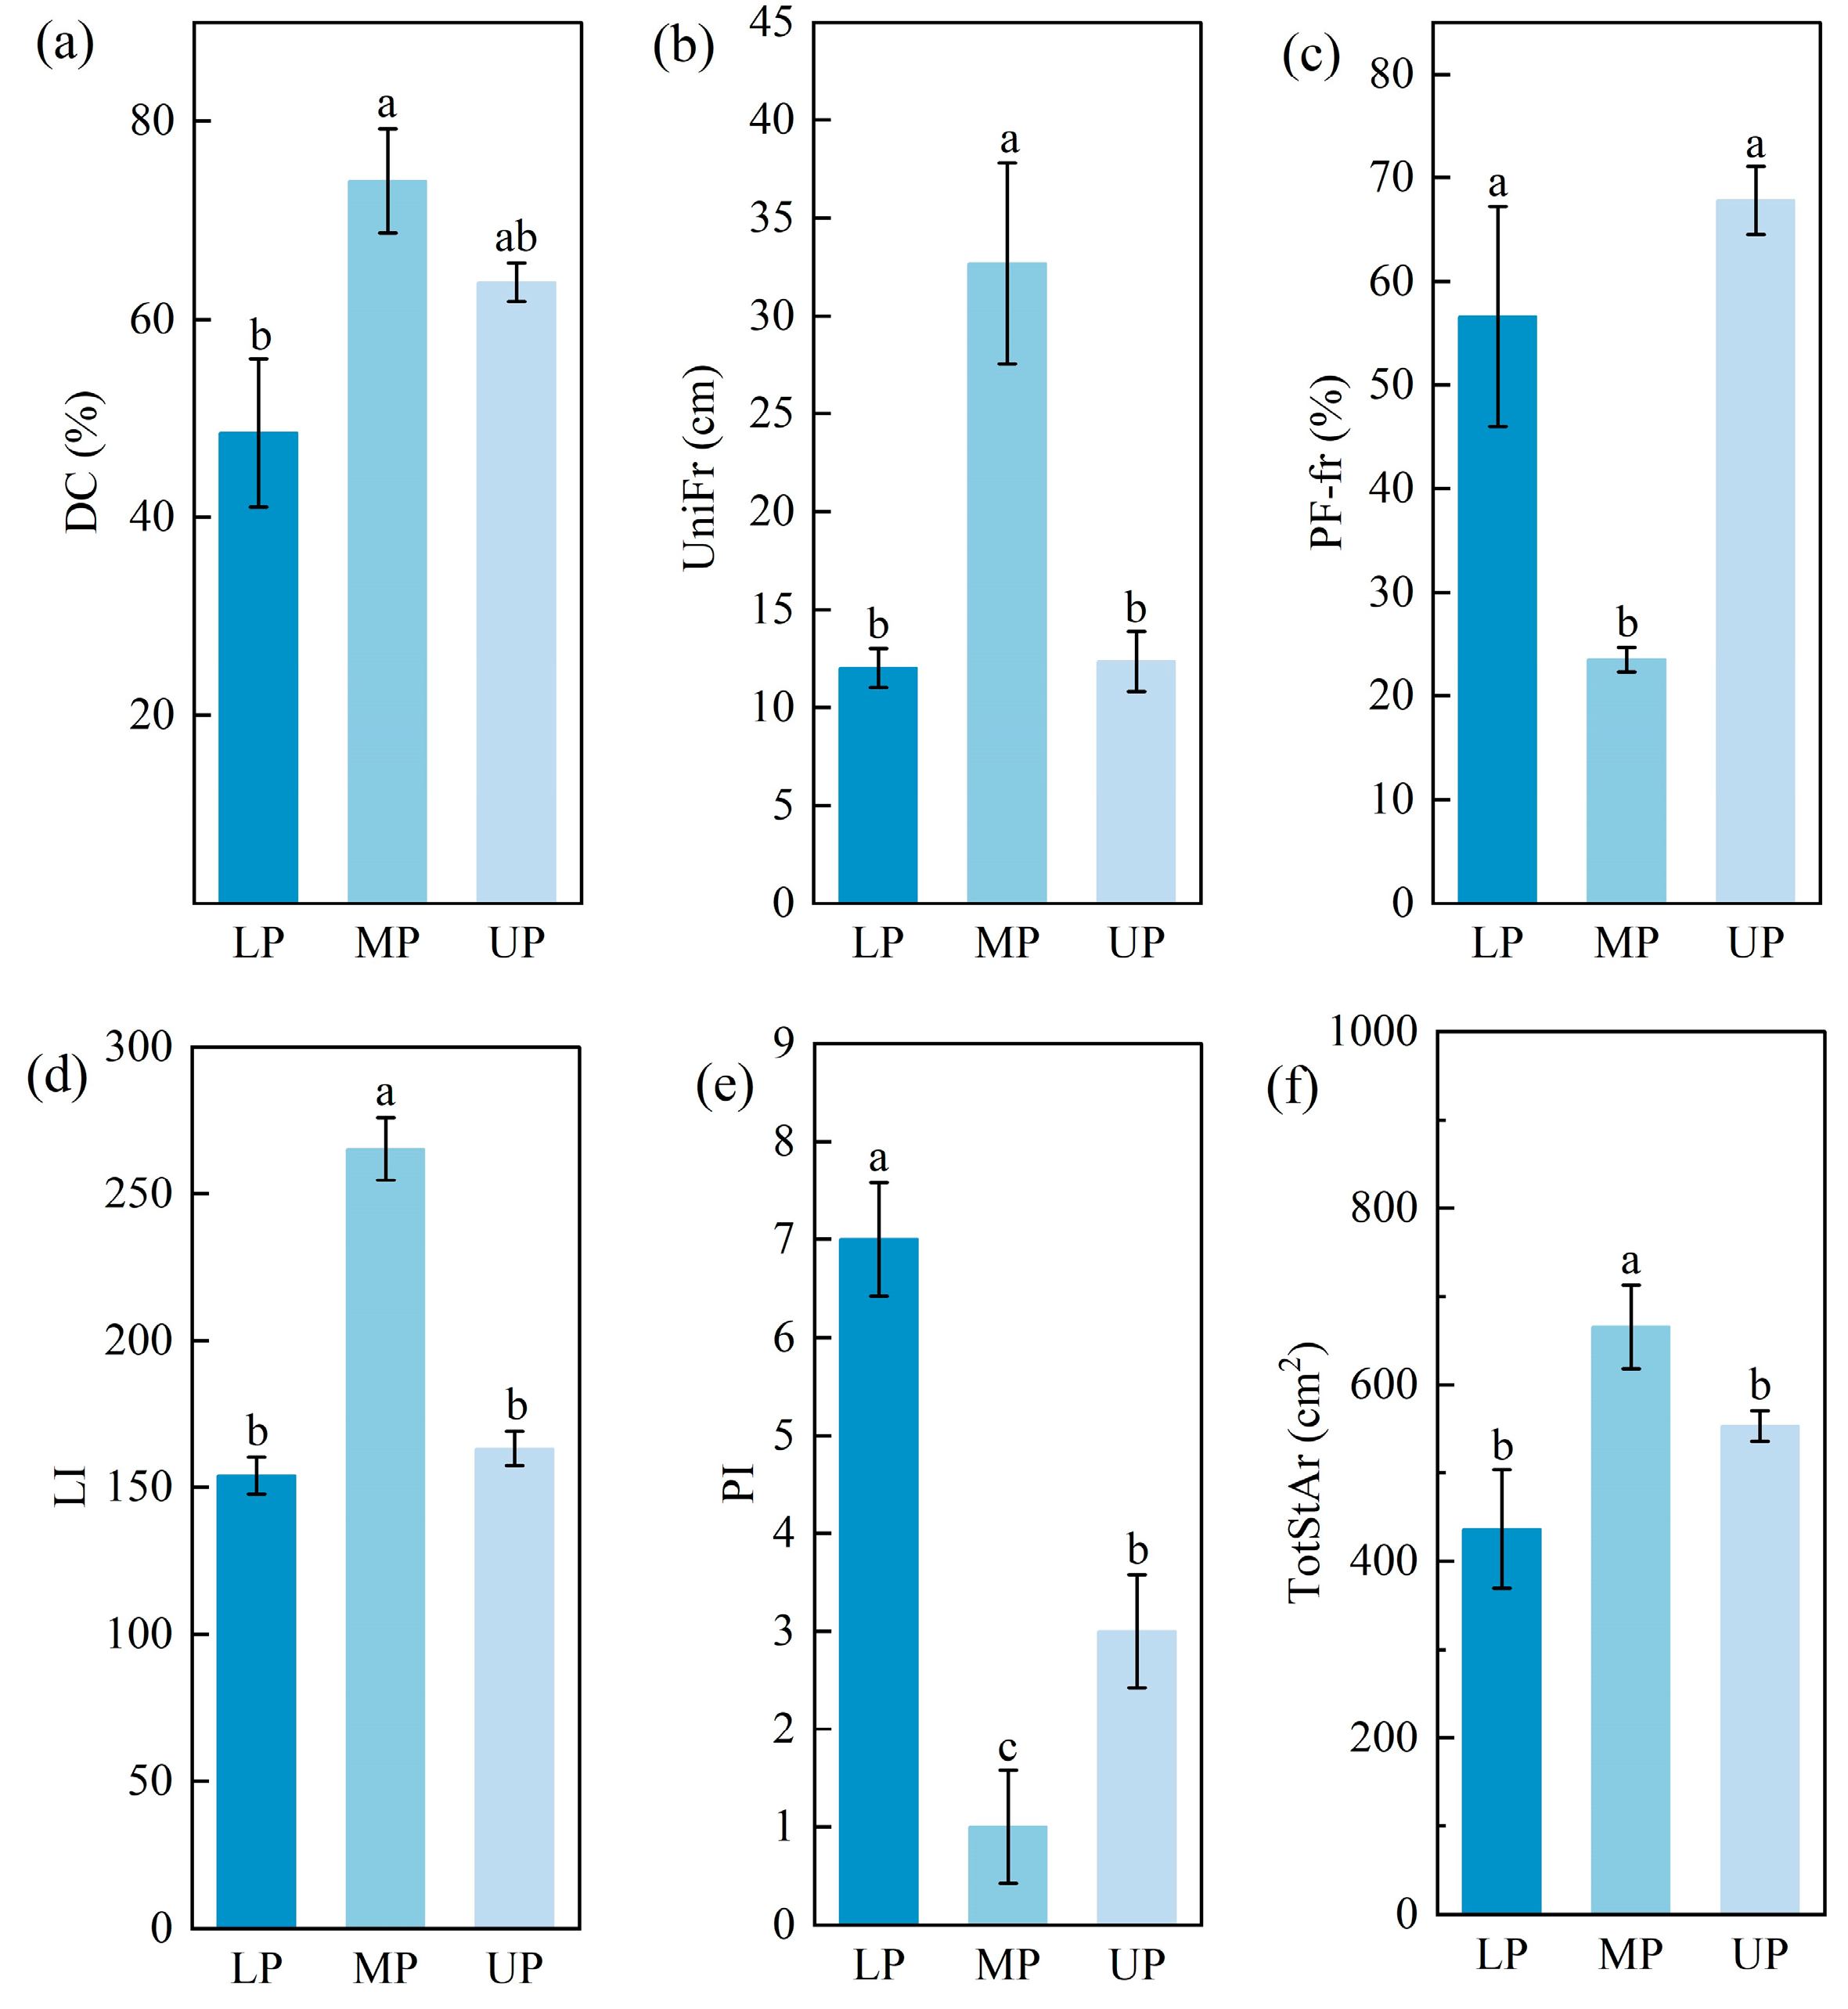
Quantitative comparisons of key preferential flow metrics are presented in Figure 6, revealing significant differences among slope positions. The mid-slope position exhibited the greatest dye coverage (DC: 74.0%), the deepest matrix flow depth (UniFr: 32.66 cm), the lateral infiltration index (LI: 265.25) and the largest total stained area (TotStAr: 665.70 cm2). However, the upper slope position exhibited the highest preferential flow fraction (PF-fr: 67.8%), which was significantly higher than that of the mid-slope position (23.5%). Additionally, the peak index (PI) at the lower slope position (7.0) was significantly higher than at the other slope positions.
To eliminate differences in dimension and scale among the evaluation indicators, a comprehensive preferential flow index was established to systematically evaluate the preferential flow development across slope positions. The evaluation results (Table 5) showed that the comprehensive preferential flow index was highest at the mid-slope position (0.67), which was significantly greater than at the upper (0.41) and lower (0.28) slope positions. Therefore, the degree of preferential flow development across slope positions decreased in the following order: mid-slope > upper slope > lower slope.

3.4. Key Factors Controlling Preferential Flow Development

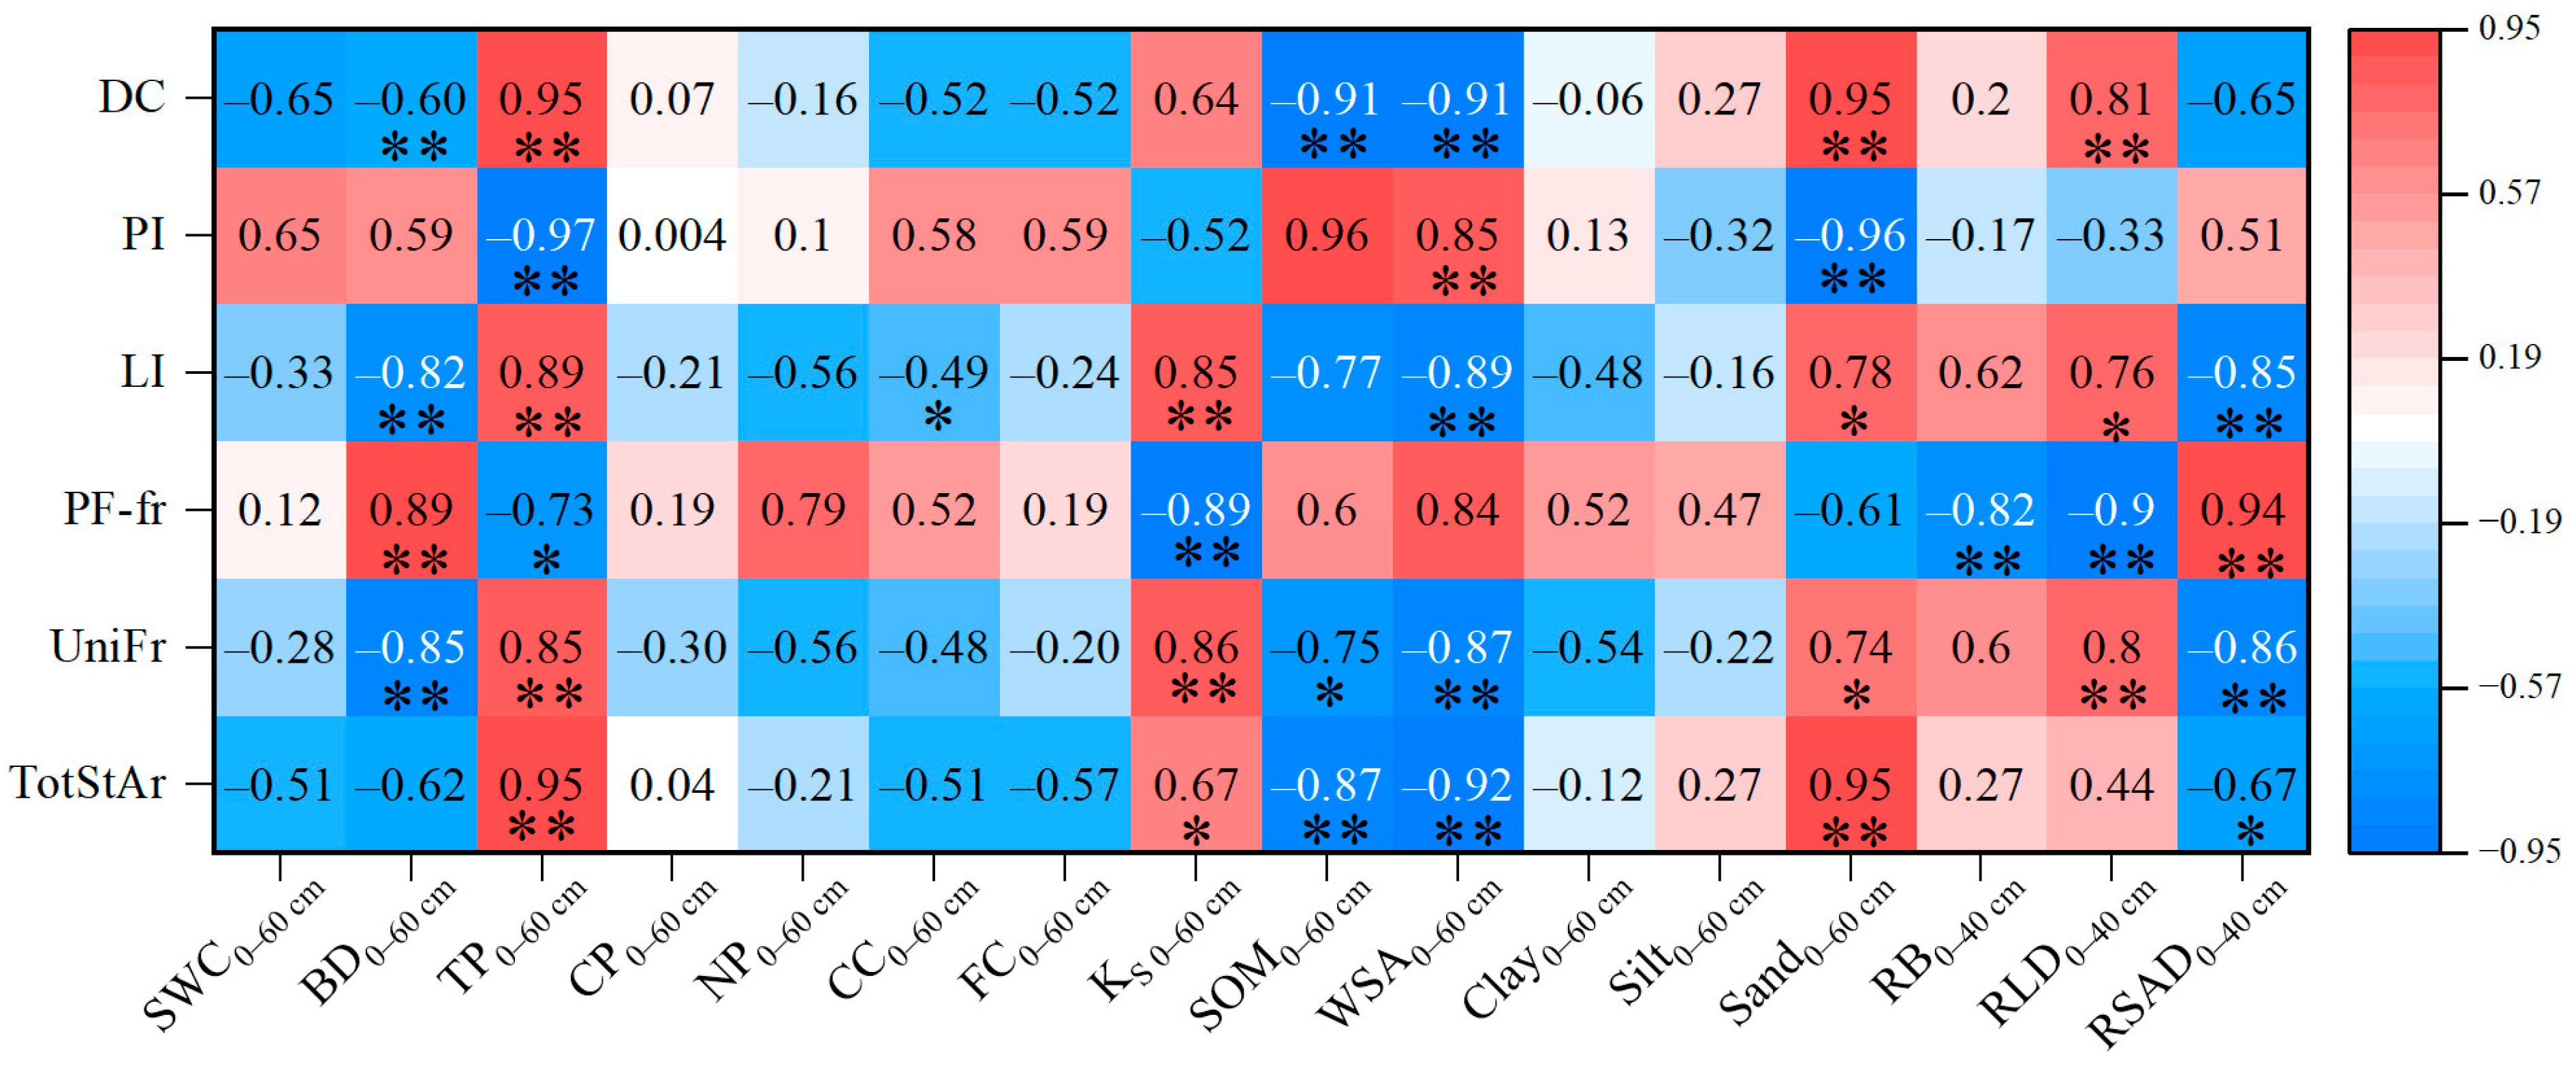
Preferential flow parameters were influenced by soil properties and root characteristics (Figure 7). In terms of soil properties, DC was significantly negatively correlated with soil bulk density, soil organic matter, and water-stable aggregates, but significantly positively correlated with total porosity and sand content. PI was significantly negatively correlated with total porosity and sand content, but significantly positively correlated with soil organic matter and water-stable aggregates. LI was significantly negatively correlated with soil bulk density, soil organic matter, and water-stable aggregate content in the 0–60 cm soil layer, but significantly positively correlated with total porosity and saturated hydraulic conductivity. PF-fr was significantly negatively correlated with total porosity and saturated hydraulic conductivity, but exhibited a significant positive correlation with soil bulk density and water-stable aggregates. UniFr was significantly negatively correlated with soil bulk density, soil organic matter, and water-stable aggregate content, yet positively correlated with total porosity and saturated hydraulic conductivity. TotStAr exhibited a significant negative correlation with organic matter content and water-stable aggregate content, but a significant positive correlation with total porosity and sand content.
In terms of root characteristics, DC exhibited a significant positive correlation with root length density. LI had a significant negative correlation with root surface area density but a significant positive correlation with root length density. PF-fr showed a positive correlation with root surface area density, but a negative correlation with root biomass and root length density. UniFr was negatively correlated with root surface area density, but positively correlated with root length density. TotStAr was negatively correlated with root surface area density.

4. Discussion

4.1. Effect of Slope Position on Soil Structure and Root Characteristics

As a key topographic factor, slope position influences the distribution of surface and subsurface flows, light, and thermal energy [33,34]. This directly controls coupled water–heat–vegetation dynamics and ultimately determines the spatial heterogeneity of soil physicochemical properties and root functional traits along the hillslope [13,17]. The spatial patterns of soil properties observed in this study provide clear evidence of this mechanism. Distinct differences were found across slope positions, for example, the lower slope position, functioning as a moisture and nutrient sink, showed the highest organic matter and water-stable aggregate content due to deposition of fine particles and organic materials. In contrast, the upper slope position, subject to stronger erosion with the shallowest soil layer, exhibited the highest silt content and a coarser texture consistent with the higher sand content at upper slope position. Notably, the mid-slope position exhibited the most favorable soil physical conditions for preferential flow, characterized by the lowest bulk density and the highest total porosity and saturated hydraulic conductivity. In contrast, the lower slope position had the highest bulk density and lowest porosity (Table 2). This indicates a loose, well-connected soil structure at the mid-slope position, which facilitates fluid movement, whereas compaction at the lower slope position likely reduces macropores and decreases pore connectivity. Previous studies have confirmed that slope-induced variability in soil physical properties critically influences preferential flow development [35,36]. Therefore, the differentiation in soil texture and structure driven by the terrain served as a key factor in governing the specific patterns of preferential flow across different slope positions.
Numerous studies have shown that roots are the most active biological agent in modifying soil structure and creating pathways for preferential flow [37,38,39]. The presence of roots influences this process via two pathways. Firstly, roots reshape soil pore structure through physical penetration and exudate action, thereby increasing the air-entry value and reducing saturated matrix permeability and suppressing uniform matrix flow [40,41]. Secondly, root–soil interfaces and macropores formed by decayed roots provide preferential pathways for water movement [17]. Variations in slope position significantly influence root distribution, thereby altering soil structure and affecting soil infiltration dynamics [42]. In this study, both root length density and root surface area density were consistently higher at mid-slope position than at upper and lower slope positions. This pattern aligns with the findings of Li et al. [43] in Robinia pseudoacacia L. plantations on the Loess Plateau, due to the similarly favorable soil moisture conditions at this slope position that promote root development. In this study, the relatively favorable hydrothermal conditions at the mid-slope position likely promoted the development of a more extensive root system, facilitating the formation of a denser, better-connected preferential flow network. Root growth enhances soil permeability by generating stable macropores and improving soil aggregation [44,45]. However, the relationship between root development and soil structure is not one-sided. Rather, it involves a dynamic interplay whereby roots respond to and actively shape their surrounding soil environment. Previous studies have highlighted the complexity of this interaction. For example, Vergani and Graf [46] found that roots can increase both soil permeability and aggregate stability simultaneously. Webb et al. [47] also demonstrated that root morphology has species-specific effects on soil hydraulic conductivity. Furthermore, Lange et al. [48] emphasised that tree roots form persistent biopores that function as effective preferential flow pathways. Consistent with these findings, our study revealed that the mid-slope exhibited the most favourable soil physical conditions (Table 2), including the highest saturated hydraulic conductivity and total porosity and the lowest bulk density. It also had the most developed root system. This suggests that synergistic root–soil interactions at the mid-slope facilitated the formation of a dense, well-connected preferential flow network. In contrast, such favourable interactions were less evident at the upper and lower slopes, where preferential flow development was comparatively limited.

4.2. Slope Position Pattern of Preferential Flow and Its Controls

Preferential flow development exhibits significant spatial heterogeneity across slope positions, with diverse patterns influenced by local site conditions. For example, in the forested andesitic critical zones of eastern China, preferential flow branching is more prevalent upslope than downslope [49]. In karst landscapes, the stained area ratio of preferential flow peaks at mid-slope (at around 74.8%), indicating that it is strongest in this position [12]; likewise, in subtropical forests, the mid-slope position contains approximately twice as many preferential flow paths as the upper and lower slope positions [16]. Conversely, on semi-arid Loess hillslopes, a higher content of rock fragments on the lower slope corresponds to greater variability in preferential flow [15]. In our study of larch plantations, the development of preferential flow varied significantly among slope positions, generally following the trend: mid-slope > upper slope > lower slope. Together, these findings emphasise that the distribution pattern of preferential flow along hillslopes is strongly influenced by local interactions between factors such as soil texture, stoniness, and vegetation root distribution.
Previous studies [50,51] have indicated that soil properties, particularly bulk density and pore structure, play a key role in controlling the development of preferential flow and are an important physical basis for its occurrence. This study found that soil bulk density was significantly negatively correlated with most preferential flow parameters, including DC, LI, and UniFr. Meanwhile, saturated hydraulic conductivity and total porosity, which are closely linked to the macropore network and critical for preferential flow [22,23,24], exhibited significant positive correlations with DC, PF-fr, UniFr, and TotStAr. These results further confirm that lower soil bulk density and a well-developed macropore network are key physical factors in promoting preferential flow formation and development. Although soil organic matter can promote aggregate stability and macropore development [52] and is considered a key driver of preferential flow [53], this study observed an inhibitory effect of higher organic matter and aggregate content on specific preferential flow parameters (e.g., DC, LI, UniFr, and TotStAr). This finding is consistent with the observations of Xie et al. [54] in Robinia pseudoacacia forests. This suppression may be due to the increased water retention capacity and homogenization effect of organic-rich soils, which reduce flow divergence. This discrepancy likely stems from the complex interactions among soil texture, vegetation type and hydrological dynamics across different ecosystems, highlighting the significant environmental dependency of organic matter’s influence on preferential flow. Furthermore, a significant positive correlation was observed between sand content and most preferential flow parameters (DC, LI, Unifr, and TotStAr). This aligns with the finding of Liu et al. [55] and Ding et al. [56], suggesting that coarser soil textures favour the formation of extensive and active preferential flow pathways. Higher sand content typically results in larger pores and greater permeability [57], which facilitates the development of preferential flow networks. However, other studies have reported no significant or negative correlation between sand content and preferential flow [58,59], highlighting the complexity of the relationship between soil texture and preferential flow.
Existing studies have revealed significant correlations between preferential flow parameters and root system characteristics, such as root length and surface area density [36,40]. This confirms the pivotal role of roots in forming preferential flow pathways. Generally, well-developed root systems can enhance soil structure, reduce bulk density and improve pore connectivity through rhizosphere disturbance and aggregate formation. This creates favourable conditions for preferential flow development [60,61]. Similarly, this study found that the root length density was significantly positively correlated with the DC, LI, and UniFr. This further supports the positive role of roots in promoting preferential flow development [18]. However, the influence of plant roots on preferential flow is dualistic, with the potential to either promote or suppress its development [8]. In this study, higher root surface area density was positively correlated with the PF-fr but negatively correlated with the LI, UniFr, and ToStAr. This suggests that dense root surfaces may obstruct or fragment preferential flow pathways to some extent by filling soil pores or altering aggregate stability, thereby limiting their continuous development. Concurrently, root surface area density was negatively correlated with saturated hydraulic conductivity (r = −0.94; p < 0.01), implying that high root surface area may also suppress preferential flow development by reducing soil hydraulic conductivity. This possibility is supported by Marzini et al. [62] who highlighted that the effect of roots on soil hydraulic conductivity varies across forest sites, suggesting that root traits can exert contrasting influences depending on site-specific conditions. Consequently, the relative importance of root length and surface area density in regulating preferential flow pathways varied across different positions on the hillslope. Root length density dominated preferential flow development at mid-slope positions, where it was significantly higher than at other positions. In contrast, the inhibitory effect of root surface area density on preferential flow was relatively limited because it was significantly lower at upper slope positions than elsewhere. These contradictory relationships highlight the complex role of root systems in regulating soil water movement, with the specific effects depending on the interaction between root morphological traits and soil structure. Future research should be extended to more hillslopes to establish quantitative relationships based on larger sample sizes to accurately quantify the contributions of different root characteristics to preferential flow.

4.3. Implications of Hillslope Hydrological Management and Model Improvement

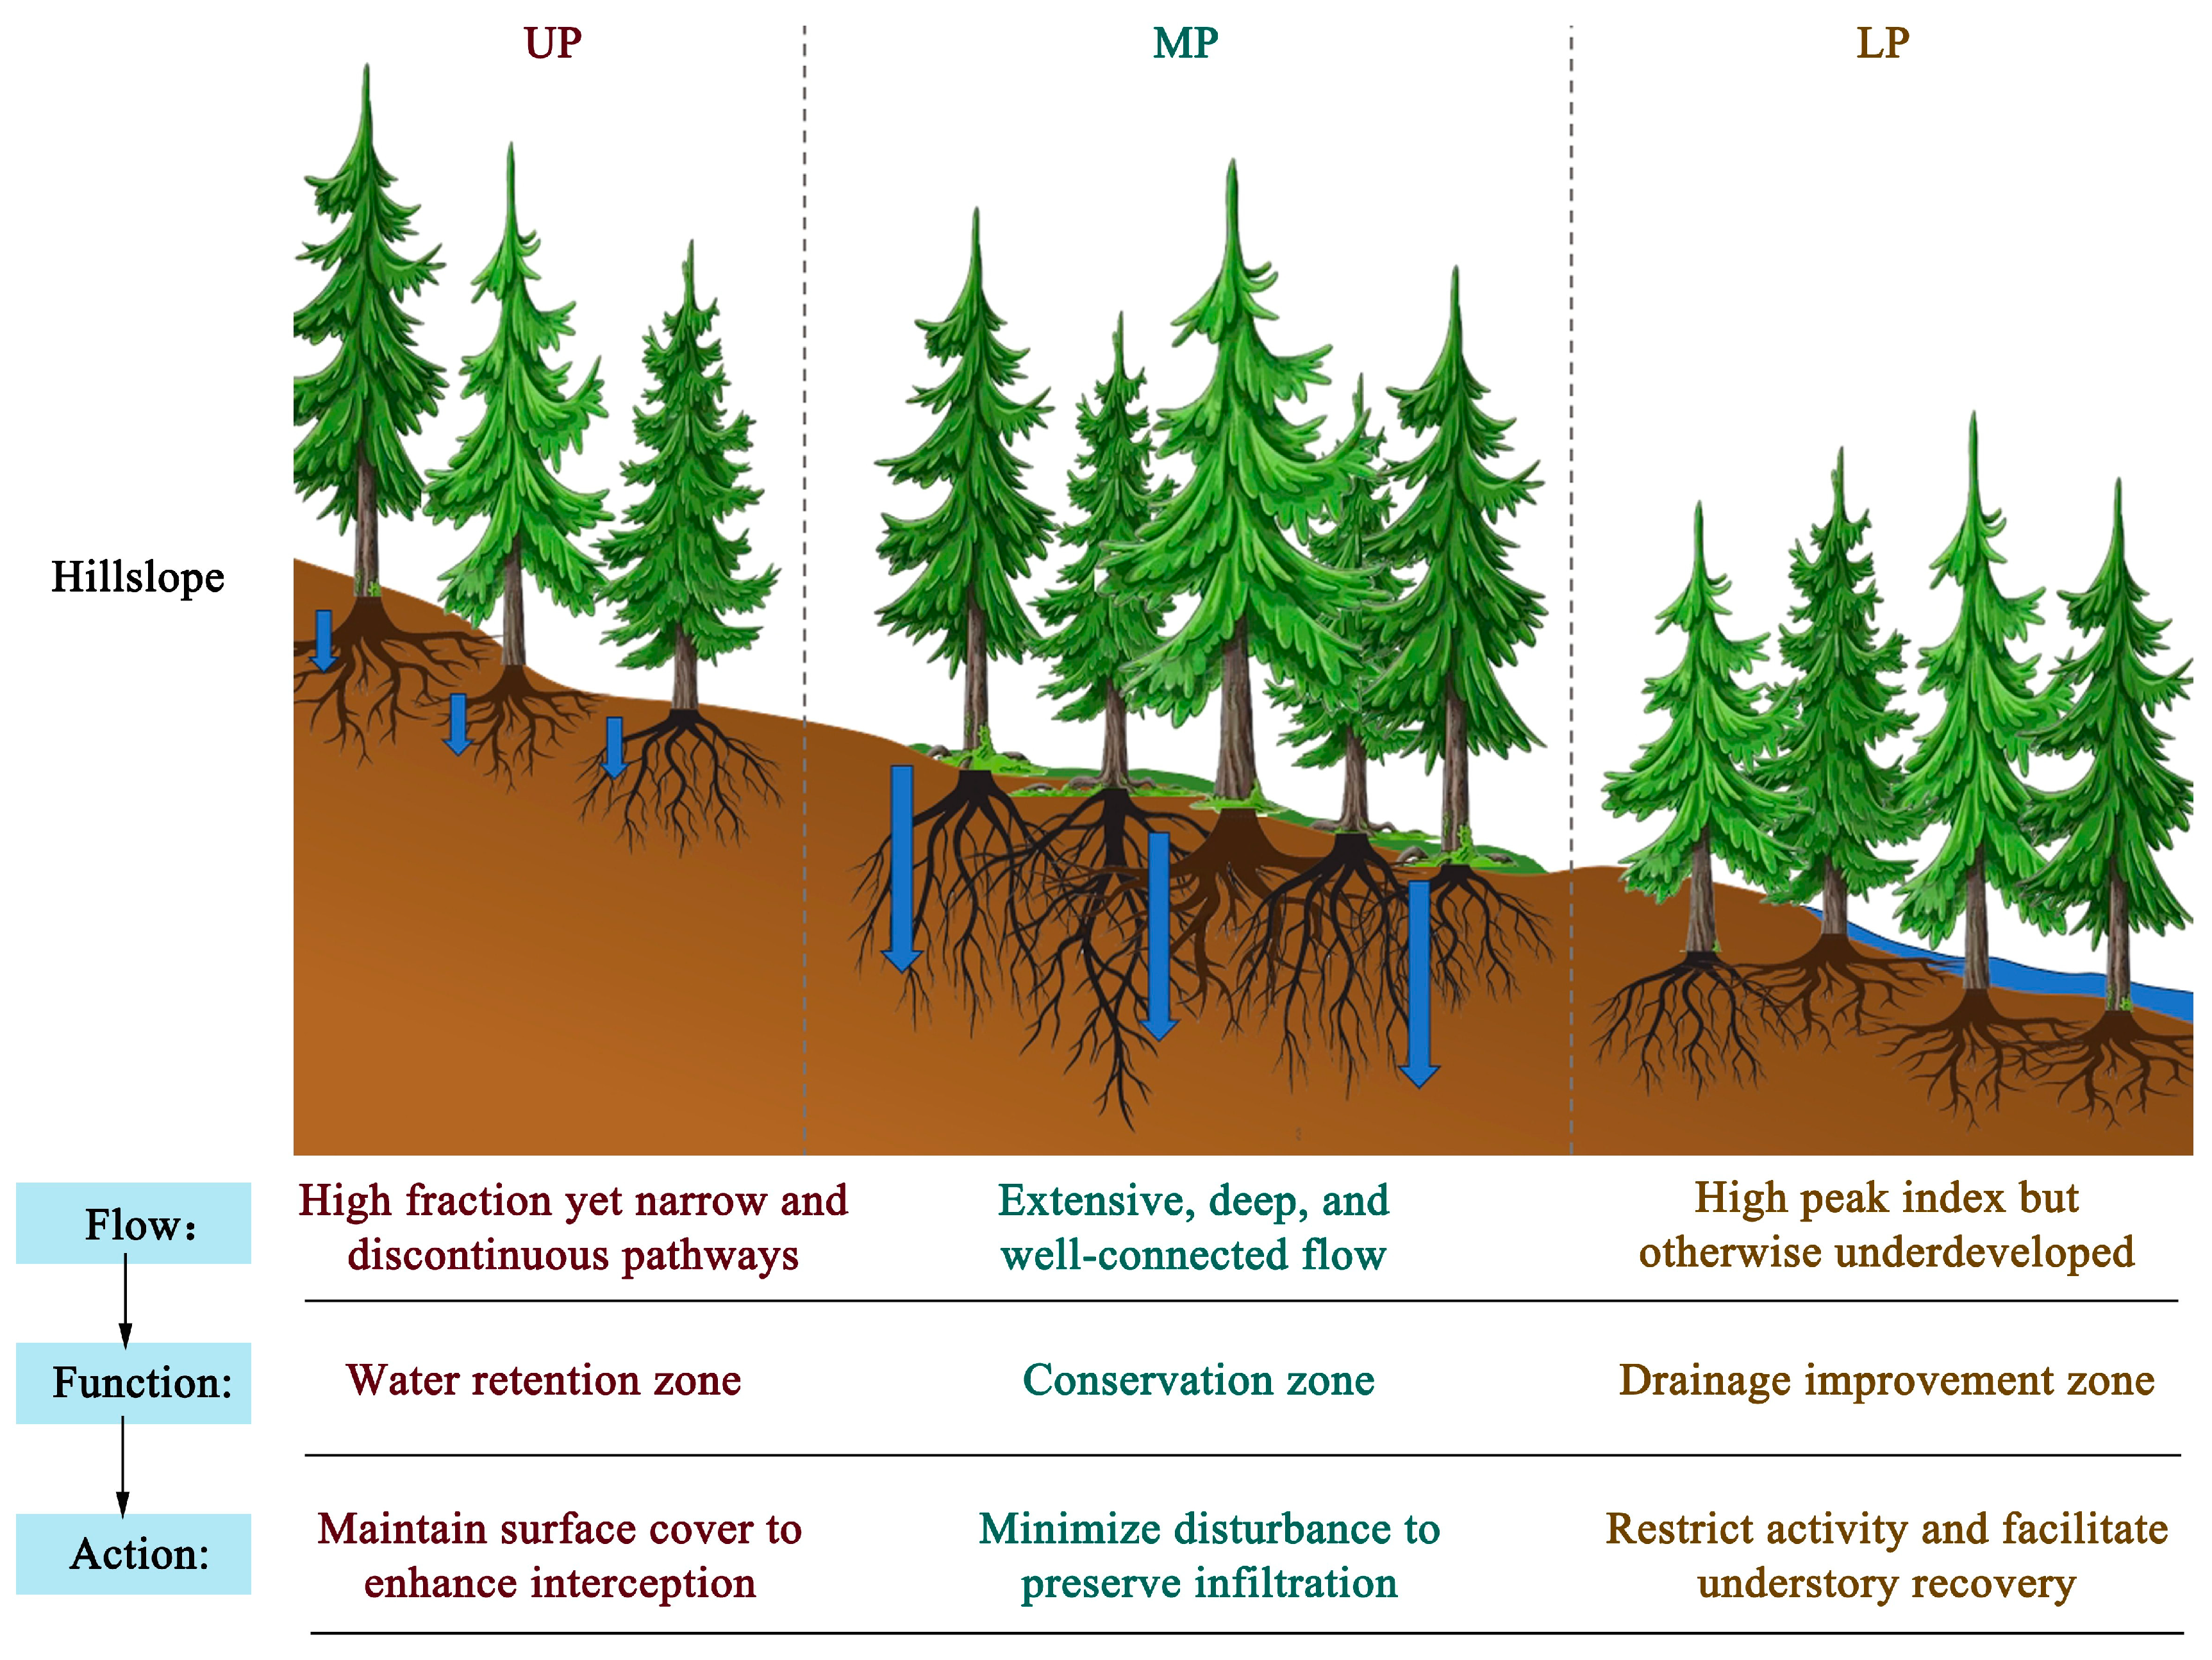
Traditionally, forest management has treated hillslopes as uniform entities, applying the same strategies to all of them. However, a growing body of research has demonstrated that hillslopes exhibit significant hydrological heterogeneity. Implementing differentiated management practices or optimising the allocation of tree species can enhance forest functions such as soil and water conservation and timber production. For instance, Liao et al. [63] proposed an optimal layout of different land use types across slope positions based on the spatial variation in infiltration along hillslopes, with the aim of maximising the hillslope’s soil and water conservation function. Meanwhile, Yu et al. [64], drawing on transpiration water consumption patterns along hillslopes, developed a forest structure optimisation scheme specific to slope position, aimed at controlling water consumption. Together, these studies highlight the necessity of implementing differentiated hillslope management. As a key indicator of hydrological connectivity and ecological function, preferential flow profoundly influences water migration processes and storage efficiency on hillslopes [34,65]. Its distribution pattern and developmental intensity are core regulatory factors. Consequently, given its spatial distribution characteristics, preferential flow underpins the formulation and implementation of strategies for soil and water conservation, land use management, and hydrological control [63,65]. In our study, differentiated hillslope management strategies tailored to the topographical location are needed due to the marked differences in preferential flow characteristics across different slope positions (Figure 8). The mid-slope position was a critical hydrological functional area. The preferential flow network was well developed here, offering strong infiltration and water storage capacity. Therefore, conservation-oriented management strategies must therefore be implemented to minimise soil disturbance and preserve its irreplaceable role in hillslope runoff generation and hydrological regulation. In contrast, the upper slope position was characterised by a high preferential flow fraction, but the pathways were narrow and discontinuous, resulting in limited water retention capacity. Management should prioritise water conservation by preserving surface cover to enhance forest floor interception and soil storage capacity. The lower slope position showed the highest peak index, but was otherwise underdeveloped, reflecting concentrated flow and poor drainage. This was exacerbated by soil compaction and pore degradation caused by human activities, resulting in poor drainage. Therefore, management at this location should strictly limit human disturbance first to facilitate the natural recovery of the understorey vegetation. This will help to improve the soil structure and enhance water movement and slope stability. It is worth noting that the slope position patterns of preferential flow and the associated hydrological management recommendations derived from this study are most applicable to similar larch plantations in comparable climatic and edaphic conditions. Due to variations in factors such as slope texture, forest type, land use pattern, and management objectives, the management strategies for forest slopes differ across regions [66]. Nevertheless, the core approach of this study, which translates slope position characterization of preferential flow into hillslope hydrological management strategies, offers methodological insights that can be adapted across a broader range of forest systems.
Our results revealed clear slope position variations in soil and root structure and the associated preferential flow patterns. Traditional hydrological models often rely on the assumption of homogeneity, which limits their ability to capture the coupled heterogeneity of root–soil–preferential flow interactions at the hillslope scale. Based on the findings of this study, the following implications were offered to enhance the application and predictive accuracy of hydrological models at the hillslope scale. Firstly, root traits should be represented spatially by assigning differentiated values of root length density and root surface area density according to their variation across slope positions. Secondly, the dual role of roots should be incorporated by characterising both the effect of root length density in promoting pore connectivity and forming biopores and the effect of root surface area density in blocking pores and increasing flow tortuosity. Thirdly, model parameterisation should be based on field measurements of root traits and soil hydraulic properties at the hillslope scale. Fourthly, model outputs should be expanded beyond total runoff to include the vertical and lateral distribution of preferential flow, since these control subsurface flow paths, deep percolation and the potential for sediment transport.

4.4. Limitations and Future Directions of This Study

This study used a larch plantation as a case study to systematically reveal the spatial distribution pattern of preferential flow along hillslopes. It also uncovered the underlying dual mechanism: soil properties associated with macropores promoted preferential flow, whereas soil properties associated with aggregates had an inhibitory effect. Meanwhile, root length density enhanced preferential flow, whereas root surface area density tended to suppress it. Based on these findings, a ‘slope position–function–management’ framework was proposed to provide a scientific basis for shifting from uniform forest management to slope-differentiated management strategies. However, this study does have certain limitations that require attention in future research.
This study took a larch plantation hillslope as a case study to explore the spatial variation in preferential flow and its influencing factors. This provides a reference for understanding the spatial heterogeneity of preferential flow on forested hillslopes. Future studies should conduct comparative research across different forest types, stand ages, and climatic zones to identify more general patterns.
This study revealed the dual effect of roots on preferential flow on forested hillslopes. However, due to the limited number of sampling points, it is not yet possible to determine precisely the critical threshold at which root density shifts from promoting to inhibiting preferential flow. Future research should collect data from a broader range of sites, covering different root densities, stand ages and tree species, to create a multi-factor coupled dataset. Methods such as piecewise regression, threshold models, or machine learning approaches could then be used to identify the critical root density threshold at which the effect changes from promotion to inhibition.
Dye tracer experiments clearly demonstrated the spatial distribution of preferential flow under controlled conditions. However, to understand whether these patterns remain stable under natural variations in rainfall, complementary methods such as continuous soil moisture monitoring, tension infiltrometer, and hydrological modelling are required to validate this.

5. Conclusions

The development of preferential flow varied markedly with slope positions, with a clear gradient of mid-slope > upper slope > lower slope. The mid-slope position exhibited optimal preferential flow characteristics, including extensive dye coverage, deep infiltration, and well-connected pathways, primarily due to more favourable soil physicochemical properties, such as lower bulk density and higher total porosity and saturated hydraulic conductivity, coupled with a more developed root system. In contrast, upper slope position was characterised by a high preferential flow fraction but confined to narrow and discontinuous pathways, while the lower slope position exhibited the highest peak index yet remained underdeveloped in other key metrics. Macropore-related properties (low bulk density, high porosity, and high saturated conductivity) promoted preferential flow, while aggregate-related properties (high organic matter and water-stable aggregates) suppressed it. Root characteristics also showed a dual influence: root length density promoted preferential flow (e.g., DC, LI, UniFr), whereas root surface area density mainly inhibited it (e.g., LI, UniFr, TotStAr). These distinct patterns indicate that each slope position fulfills a specific hydrological function. Consequently, forest hydrological management should adopt slope-specific strategies tailored to these functional differences to enhance integrated hillslope water regulation and ecosystem services.

Author Contributions

Conceptualization, Z.L.; methodology, S.L.; formal analysis, S.L.; investigation, S.L. and M.W.; resources, P.Y., Y.W., L.X. and X.L.; data curation, S.L. and J.L.; writing—original draft preparation, S.L.; writing—review and editing, Z.L.; visualization, S.L.; project administration, Z.L.; funding acquisition, Z.L., Y.W. and P.Y. All authors have read and agreed to the published version of the manuscript.

Funding

This research was supported by the National Natural Science Foundation of China (42477090) and the National Key R & D Program of China (2022YFF0801803 and 2022YFF1300404).

Data Availability Statement

Data is contained within the article.

Conflicts of Interest

The authors declare no conflicts of interest.

Abbreviations

PFPreferential flow
DCDye coverage
TotStArTotal stained area
UniFrUniform infiltration depth
PF-frPreferential flow fraction
LILength index
PIPeak index
SWCSoil water content
KsSaturated hydraulic conductivity
TPTotal porosity
CPCapillary porosity
CCCapillary water holding capacity
FCField capacity
BDBulk density
SOMSoil organic matter
WSAsWater-stable aggregates
RBRoot biomass
RLDRoot length density
RSADRoot surface area density

References

  1. Vilakazi, B.S.; Mukwada, G. Curbing Land Degradation and Mitigating Climate Change in Mountainous Regions: A Systemic Review. Environ. Monit. Assess. 2023, 195, 75. [Google Scholar] [CrossRef] [PubMed]
  2. Yan, Y.J.; Hu, Z.Y.; Wang, L.J.; Jiang, J.; Dai, Q.H.; Gan, F.L.; Almaliki, A.H.; Hashim, M.A.; Hussein, E.E.; Ghoneim, S.S.M. Impact of Extreme Rainfall Events on Soil Erosion on Karst Slopes: A study of hydrodynamic mechanisms. J. Hydrol. 2024, 638, 131532. [Google Scholar] [CrossRef]
  3. Hancock, G.R.; Willgoose, G.R.; Evans, K.G. Testing of the SIBERIA Landscape Evolution Model using the Tin Camp Creek, Northern Territory, Australia, field catchment. Earth Surf. Process. Landf. 2002, 27, 125–143. [Google Scholar] [CrossRef]
  4. Gu, Z.J.; Xie, Y.; Gao, Y.; Ren, X.Y.; Cheng, C.C.; Wang, S.C. Quantitative Assessment of Soil Productivity and Predicted Impacts of Water Erosion in the Black Soil Region of Northeastern China. Sci. Total Environ. 2018, 637, 706–716. [Google Scholar] [CrossRef]
  5. Caviedes-Voullieme, D.; Ahmadinia, E.; Hinz, C. Interactions of Microtopography, Slope and Infiltration Cause Complex Rainfall-Runoff Behavior at the Hillslope Scale for Single Rainfall Events. Water Resour. Res. 2021, 57, e2020WR028127. [Google Scholar] [CrossRef]
  6. Kumar, M.; Paramaputra, K.; Mousa, A.; Kong, S.Y.; Garg, A.; Anggraini, V. Field Based Analysis of Vegetation and Climate Impacts on the Hydrological Properties of Urban Vegetated Slope. Sci. Rep. 2025, 15, 7702. [Google Scholar] [CrossRef]
  7. Loaiciga, H.A.; Johnson, J.M. Infiltration on Sloping Terrain and Its Role on Runoff Generation and Slope Stability. J. Hydrol. 2018, 561, 584–597. [Google Scholar] [CrossRef]
  8. Kendrick, A.K.; Knight, R.; Johnson, C.D.; Liu, G.; Hart, D.J.; Butler, J.J., Jr.; Hunt, R.J. Evaluation of Models for Estimating Hydraulic Conductivity in Glacial Aquifers with NMR Logging. Groundwater 2023, 61, 778–792. [Google Scholar] [CrossRef] [PubMed]
  9. Lu, Z.; Wei, J.; Yang, X. Effects of Hydraulic Conductivity on Simulating Groundwater–land Surface Interactions over a Typical Endorheic River Basin. J. Hydrol. 2024, 638, 131542. [Google Scholar] [CrossRef]
  10. Jarvis, N.J. A Review of Non-equilibrium Water Flow and Solute Transport in Soil Macropores: Principles, Controlling Factors and Consequences for Water Quality. Eur. J. Soil Sci. 2007, 58, 523–546. [Google Scholar] [CrossRef]
  11. Wang, F.; Wang, G.X.; Cui, J.F.; Guo, L.; Mello, C.R.; Boyer, E.W.; Tang, X.Y.; Yang, Y. Preferential Flow Patterns in Forested Hillslopes of East Tibetan Plateau Revealed by Dye Tracing and Soil Moisture Network. Eur. J. Soil Sci. 2022, 73, e13294. [Google Scholar] [CrossRef]
  12. Du, Y.; Wang, X.Y.; Nan, Z.; Li, T.T.; Tang, Y.; Huang, L.S. Assessment of the Vertical Preferential Flow Characteristics and Flow Types on a Slope in a Small Headwater Catchment. Front. Environ. Sci. 2025, 13, 1515739. [Google Scholar] [CrossRef]
  13. Xiang, J.D.; Zhai, M.M.; Wang, K.Q.; Wang, Z.C.; Zhao, Y.Y. Characteristics of Soil Preferential Flow and Its Influencing Factors under Different Elevation Gradients in Mopan Mountain, Central Yunnan, China. Plant Soil 2026, 518, 2037–2051. [Google Scholar] [CrossRef]
  14. Zhao, S.Y.; Jia, Y.W.; Gong, J.G.; Niu, C.W.; Su, H.D.; Gan, Y.D.; Liu, H. Spatial Variability of Preferential Flow and Infiltration Redistribution along a Rocky-Mountain Hillslope, Northern China. Water 2020, 12, 1102. [Google Scholar] [CrossRef]
  15. Mei, X.M.; Zhu, Q.K.; Ma, L.; Zhang, D.; Wang, Y.; Hao, W.J. Effect of Stand Origin and Slope Position on Infiltration Pattern and Preferential Flow on a Loess Hillslope. Land Degrad. Dev. 2018, 29, 1353–1365. [Google Scholar] [CrossRef]
  16. Li, M.F.; Yao, J.J.; Yan, R.; Fan, Y.X.; Liu, S.Q. Effect of Slope Position on the Spatial Distribution of Soil Preferential Flow Paths Based on Point Pattern Analysis. PLoS ONE 2024, 19, e0315660. [Google Scholar] [CrossRef]
  17. Chen, C.F.; Zou, X.; Singh, A.K.; Zhu, X.A.; Zhang, W.J.; Yang, B.; Jiang, X.J.; Liu, W.J. Effects of Hillslope Position on Soil Water Infiltration and Preferential Flow in Tropical Forest in Southwest China. J. Environ. Manag. 2021, 299, 113672. [Google Scholar] [CrossRef]
  18. Wei, H.; Yang, Y.F.; Wang, J.Y.; Meng, Q.M.; Deng, Y.S. A Comparison of Preferential Flow Characteristics and Influencing Factors Between Two Soils Developed in the Karst Region of Southwest China. Soil Tillage Res. 2024, 241, 106132. [Google Scholar] [CrossRef]
  19. Wang, D.; Niu, J.Z.; Dai, Z.Y.; Yang, T.; Miao, Y.B.; Zhang, L.; Chen, X.W.; Berndtsson, R. Forest Restoration Effects on Soil Preferential Flow in the Paleo-Periglacial Eastern Liaoning Mountainous Regions, China. J. Clean. Prod. 2024, 467, 142974. [Google Scholar] [CrossRef]
  20. Laine-Kaulio, H.; Backnas, S.; Koivusalo, H.; Lauren, A. Dye Tracer Visualization of Flow Patterns and Pathways in Glacial Sandy Till at a Boreal Forest Hillslope. Geoderma 2015, 259, 23–34. [Google Scholar] [CrossRef]
  21. Tang, Q.C.; Duncan, J.M.; Guo, L.; Lin, H.; Xiao, D.; Eissenstat, D.M. On the Controls of Preferential Flow in Soils of Different Hillslope Position and Lithological Origin. Hydrol. Process. 2020, 34, 4295–4306. [Google Scholar] [CrossRef]
  22. Zhang, L.; Zhao, T.H.; Qi, S. Vegetation Restoration Governs the Changes in Soil Preferential Flow and Matrix Infiltration. Rhizosphere 2026, 37, 101258. [Google Scholar] [CrossRef]
  23. Chu, L.L.; Ma, R.; Liu, Y.; Zhao, Y.; Bi, L.D.; Dan, C. Effects of Land-Use Change on Soil Infiltrability and Preferential Flow in Typical Low Hilly Area. J. Soil Sci. Plant Nutr. 2025, 25, 7482–7495. [Google Scholar] [CrossRef]
  24. Zhang, S.Y.; Liu, Y.H.; Yang, M.Y.; Tian, P.; Mu, X.M.; Zhao, G.J. Impact of Vegetation Restoration on Preferential Flow and Soil Infiltration Capacity in the Hilly Region of the Loess Plateau. J. Hydrol. Reg. Stud. 2025, 59, 102333. [Google Scholar] [CrossRef]
  25. Yanagisawa, N.; Fujita, N. Different Distribution Patterns of Woody Species on a Slope in Relation to Vertical Root Distribution and Dynamics of Soil Moisture Profiles. Ecol. Res. 1999, 14, 165–177. [Google Scholar] [CrossRef]
  26. Li, L.X.; Yan, X.L.; Tian, Y.L.; Zhao, Z.H.; Wu, S.X.; Farooq, T.H.; Li, M.; Ma, X.Q.; Wu, P.F. Root Spatial Distribution and Architectural Formation of Chinese Fir Plantations: Changes in Soil Water and Nutrients Based on Different Slope Positions. Eur. J. For. Res. 2025, 144, 1645–1657. [Google Scholar] [CrossRef]
  27. Liu, S.; Liu, Z.B.; Wang, M.F.; Wang, Y.H.; Xu, L.H.; Liu, X.F.; Yu, P.T. Spatiotemporal Variation Characteristics of Soil Water Storage and Their Influencing Factors on a Larix gmelinii var. rincipis-rupprechtii Plantation Hillslope in Liupan Mountains. J. Soil Water Conserv. 2025, 39, 234–243. [Google Scholar] [CrossRef]
  28. He, S.Q.; Zhu, R.H.; Zheng, Z.C.; Li, T.X. The Effect of Tea Plantation Age on Soil Water-Stable Aggregates and Aggregate-Associated Carbohydrate in Southwestern China. Int. Soil Water Conserv. Res. 2023, 11, 393–401. [Google Scholar] [CrossRef]
  29. Dong, L.B.; Li, J.W.; Liu, Y.L.; Hai, X.Y.; Li, M.Y.; Wu, J.Z.; Wang, X.Z.; Shang Guan, Z.P.; Zhou, Z.C.; Deng, L. Forestation Delivers Significantly More Effective Results in Soil C and N Sequestrations Than Natural Succession on Badly Degraded Areas: Evidence from the Central Loess Plateau Case. Catena 2022, 208, 105734. [Google Scholar] [CrossRef]
  30. Flury, M.; Flühler, H.; Jury, W.A.; Leuenberger, J. Susceptibility of Soils to Preferential Flow of Water: A Field Study. Water Resour. Res. 1994, 30, 1945–1954. [Google Scholar] [CrossRef]
  31. Van Schaik, N.L.M.B. Spatial Variability of Infiltration Patterns Related to Site Characteristics in a Semi-arid Watershed. Catena 2009, 78, 36–47. [Google Scholar] [CrossRef]
  32. Tobella, A.B.; Reese, H.; Almaw, A.; Bayala, J.; Malmer, A.; Laudon, H.; Ilstedt, U. The Effect of Trees on Preferential Flow and Soil Infiltrability in an Agroforestry Parkland in Semiarid Burkina Faso. Water Resour. Res. 2014, 50, 3342–3354. [Google Scholar] [CrossRef] [PubMed]
  33. Fu, T.G.; Liu, J.T.; Gao, H.; Qi, F.; Wang, F.; Zhang, M. Surface and Subsurface Runoff Generation Processes and Their Influencing Factors on a Hillslope in Northern China. Sci. Total Environ. 2024, 906, 167372. [Google Scholar] [CrossRef] [PubMed]
  34. Liu, Z.B.; Wang, M.F.; Liu, S.; Wang, Y.H.; Ma, J.; Xu, L.H.; Yu, P.T. Quantifying the Independent and Interactive Effects of Environmental Drivers on Dry-Day Evapotranspiration Between Two Slope Positions in a Larch Forest. Forests 2025, 16, 1035. [Google Scholar] [CrossRef]
  35. Wang, Y.X.; Xu, Y.Y.; Yang, H.Y.; Shen, H.B.; Zhao, L.; Zhu, B.G.; Wang, J.X.; Guo, L.F. Effect of Slope Shape on Soil Aggregate Stability of Slope Farmland in Black Soil Region. Front. Environ. Sci. 2023, 11, 1127043. [Google Scholar] [CrossRef]
  36. Liu, R.H.; Pan, Y.F.; Bao, H.; Liang, S.C.; Jiang, Y.; Tu, H.R.; Nong, J.L.; Huang, W.Q. Variations in Soil Physico-Chemical Properties along Slope Position Gradient in Secondary Vegetation of the Hilly Region, Guilin, Southwest China. Sustainability 2020, 12, 1303. [Google Scholar] [CrossRef]
  37. Luo, Z.T.; Niu, J.Z.; Xie, B.Y.; Zhang, L.; Chen, X.W.; Berndtsson, R.; Du, J.; Ao, J.K.; Yang, L.; Zhu, S.Y. Influence of Root Distribution on Preferential Flow in Deciduous and Coniferous Forest Soils. Forests 2019, 10, 986. [Google Scholar] [CrossRef]
  38. Wu, Y.A.; Zhang, Y.H.; Xie, L.M.; Zhao, S.Q.; Liu, Y.; Zhang, Z.M. Preferential Flow Improves Root-Soil System on a Small Scale: A Case Study of Two Ecotypes of Phragmites Communis. J. Clean. Prod. 2021, 328, 129581. [Google Scholar] [CrossRef]
  39. Tian, Z.; Zhang, S.P.; Xu, Q.X.; Bi, M.F.; He, J.H. Influence of Paulownia Fortunei (seem.) Hemsl. Roots on Preferential Flow in the Red Soil Hilly Region. Soil Water Res. 2023, 18, 89–101. [Google Scholar] [CrossRef]
  40. Rahardjo, H.; Satyanaga, A.; Wang, C.L.; Wong, J.L.H.; Lim, V.H. Effects of Unsaturated Properties on Stability of Slope Covered with Caesalpinia crista in Singapore. Environ. Geotech. 2020, 7, 393–403. [Google Scholar] [CrossRef]
  41. Satyanaga, A.; Rahardjo, H. Stability of Unsaturated Soil Slopes Covered with Melastoma malabathricum in Singapore. Proc. Inst. Civ. Eng.-Geotech. Eng. 2019, 172, 530–540. [Google Scholar] [CrossRef]
  42. Chandler, K.R.; Chappell, N. A Influence of Individual Oak (Quercus robur) Trees on Saturated Hydraulic Conductivity. For. Ecol. Manag. 2008, 256, 1222–1229. [Google Scholar] [CrossRef]
  43. Li, H.Y.; Luo, Y.; Sun, L.; Li, X.D.; Ma, C.K.; Wang, X.L.; Jiang, T.; Zhu, H.Y. Modelling the Artificial Forest (Robinia pseudoacacia L.) Root-Soil Water Interactions in the Loess Plateau, China. Hydrol. Earth Syst. Sci. 2022, 26, 17–34. [Google Scholar] [CrossRef]
  44. Kalhoro, S.A.; Ding, K.; Zhang, B.Y.; Chen, W.Y.; Hua, R.; Shar, A.H.; Xu, X.X. Soil Infiltration Rate of Forestland and Grassland over Different Vegetation Restoration Periods at Loess Plateau in Northern Hilly Areas of China. Landsc. Ecol. Eng. 2019, 15, 91–99. [Google Scholar] [CrossRef]
  45. Cai, L.; Wang, F.; Lin, Y.; Long, Q.; Zhao, Y.L.; Han, J.Q.; Ge, W.Y.; Chen, H. Changes in Preferential Flow Caused by Root Effects in Black Locust Plantations of Different Stand Ages in the Semi-Arid Region of the Loess Plateau. J. Hydrol. 2024, 634, 131086. [Google Scholar] [CrossRef]
  46. Vergani, C.; Graf, F. Soil Permeability, Aggregate Stability and Root Growth: A Pot Experiment from a Soil Bioengineering Perspective. Ecohydrology 2016, 9, 830–842. [Google Scholar] [CrossRef]
  47. Webb, B.; Robinson, D.A.; Marshall, M.R.; Ford, H.; Pagella, T.; Healey, J.R.; Smith, A.R. Variation in Root Morphology Amongst Tree Species Influences Soil Hydraulic Conductivity and Macroporosity. Geoderma 2022, 425, 116057. [Google Scholar] [CrossRef]
  48. Lange, B.; Lüescher, P.; Germann, P.F. Significance of Tree Roots for Preferential Infiltration in Stagnic Soils. Hydrol. Earth Syst. Sci. 2009, 13, 1809–1821. [Google Scholar] [CrossRef]
  49. Liu, H.W.; Yang, Y.Q.; Zhang, J.Y.; Tang, J.L.; Huang, A.M.; Liao Am Wan, S.C.; Liu, C.S.; Wang, G.Q. Effects of Hillslope Position on Soil Water Flow Paths in the Forested Hilly Andesitic Critical Zone of Eastern China. Catena 2025, 259, 109368. [Google Scholar] [CrossRef]
  50. Luo, Y.W.; Wen, T.D.; Lin, X.; Chen, X.S.; Shao, L.T. Quantitative Analysis of Pore-Size Influence on Granite Residual Soil Permeability Using CT Scanning. J. Hydrol. 2024, 645, 132133. [Google Scholar] [CrossRef]
  51. Wen, Y.F.; Li, M.Z.; Gao, P.; Zhou, J.H.; Ai, X.C.; Zhang, Y.X.; Mu, X.M. Soil Physicochemical Properties and Roots Promoted Preferential Flow Development after Vegetation Restoration. J. Hydrol. 2025, 659, 133349. [Google Scholar] [CrossRef]
  52. Rabot, E.; Wiesmeier, M.; Schlüter, S.; Vogel, H.-J. Soil Structure as an Indicator of Soil Functions: A review. Geoderma 2018, 314, 122–137. [Google Scholar] [CrossRef]
  53. Weiler, M.; Flühler, H. Inferring Flow Types from Dye Patterns in Macroporous Soils. Geoderma 2004, 120, 137–153. [Google Scholar] [CrossRef]
  54. Xie, M.L.; Zhang, Y.H.; Zhang, M.X.; Zhang, Z.M. Soil Preferential Flow and Nutrient Distribution of Robinia pseudoacacia Linn Community in Yellow River Delta. Acta Ecol. Sin. 2021, 41, 7713–7724. [Google Scholar] [CrossRef]
  55. Liu, Y.; Zhang, Y.H.; Xie, L.M.; Zhao, S.Q.; Dai, L.Y.; Zhang, Z.M. Effect of Soil Characteristics on Preferential Flow of Phragmites Australis Community in Yellow River Delta. Ecol. Indic. 2021, 125, 107486. [Google Scholar] [CrossRef]
  56. Ding, B.; Cai, X.; Wang, Y.; Li, H.; Zhao, X.; Xiao, M.; Li, J.; Yu, Q.; Zhao, Y. Secondary Vegetation Succession Following Reforestation Intensifies Preferential Flow by Improving Soil Structure in the Chinese Karst Region. Ecol. Indic. 2023, 156, 111166. [Google Scholar] [CrossRef]
  57. Govindaraju, R.S.; Reddi, L.N.; Bhargava, S.K. Characterization of Preferential Flow Paths in Compacted Sand-Clay Mixtures. J. Geotech. Eng. 1995, 121, 652–659. [Google Scholar] [CrossRef]
  58. Basset, C.; Najm, M.A.; Ghezzehei, T.; Hao, X.; Daccache, A. How Does Soil Structure Affect Water Infiltration? A Meta-Data Systematic Review. Soil Tillage Res. 2023, 226, 105577. [Google Scholar] [CrossRef]
  59. Liu, Y.Y.; You, L.; Zhang, W.Q.; Tang, Z.Y.; Wang, D.; Zhang, Y.H. Soil- and Root Properties in Driving Preferential Flow of North Subtropical Forest Stands: Insights from Machine Learning. Catena 2025, 261, 109544. [Google Scholar] [CrossRef]
  60. Bodner, G.; Loiskandl, W.; Buchan, G.; Kaul, H.-P. Natural and Management-Induced Dynamics of Hydraulic Conductivity along a Cover-Cropped Field Slope. Geoderma 2008, 146, 317–325. [Google Scholar] [CrossRef]
  61. Glab, T. Impact of Soil Compaction on Root Development and Yield of Meadow-Grass. Int. Agrophys. 2013, 27, 7–13. [Google Scholar] [CrossRef][Green Version]
  62. Marzini, L.; Papasidero, M.P.; D’Addario, E.; Schwarz, M.; Disperati, L. Exploring the Relationship Between Saturated Hydraulic Conductivity and Roots Distribution: Two Case Studies in Garfagnana (Northern Tuscany, Italy) and Zollikofen (Bern, Switzerland). Front. Sustain. 2025, 6, 1631482. [Google Scholar] [CrossRef]
  63. Liao, Y.L.; Pan, T.S.; Deng, Y.Y.; Yang, M.G.; Yang, G.R.; Yu, X.X.; Huang, Y.H. Comparing of Soil Matrix Infiltration and Preferential Flow across Different Land Use Types in Karst Landscapes: Implications for Soil and Water Conservation. Catena 2025, 256, 109127. [Google Scholar] [CrossRef]
  64. Yu, S.P.; Wang, Y.H.; Wang, Q.; Liu, Z.B.; Xu, L.H.; Chao, Y.; Ma, X. How Vertical Stand Structure Shapes Transpiration in Larch Plantations: Implications for the Integrated Forest-water Management. Agric. Water Manag. 2026, 323, 110111. [Google Scholar] [CrossRef]
  65. Chen, X.G.; Yu, Z.B.; Yi, P.; Hwang, H.-T.; Sudicky, E.A.; Tang, T.T.; Aldahan, A. Effects of Soil Heterogeneity and Preferential Flow on the Water Flow and Isotope Transport in an Experimental Hillslope. Sci. Total Environ. 2024, 917, 170548. [Google Scholar] [CrossRef] [PubMed]
  66. Zhu, X.A.; Chen, C.F.; Wu, J.E.; Yang, J.B.; Zhang, W.J.; Zou, X.; Liu, W.J.; Jiang, X.J. Can Intercrops Improve Soil Water Infiltrability and Preferential Flow in Rubber-based Agroforestry System? Soil Tillage Res. 2019, 191, 327–339. [Google Scholar] [CrossRef]
Figure 1. Location of the study plots.
Forests 17 00467 g001
Figure 2. Layout of the experiment.
Forests 17 00467 g002
Figure 3. Root traits across slope positions and soil depths. (a) Total root biomass (RB); (b) Root length density (RLD); (c) Root surface area density (RSAD). The lowercase letters are significantly different among slope positions in the same soil layer (p < 0.05). ** p < 0.01.
Forests 17 00467 g003
Figure 4. Staining distribution in horizontal soil profiles across slope positions and soil depths. (a) Lower slope position (LP); (b) Middle slope position (MP); (c) Upper slope position (UP). Black indicates the stained area, and white indicates the unstained area. The red line indicates the inner ring boundary.
Forests 17 00467 g004aForests 17 00467 g004b
Figure 5. Vertical soil profiles with dye patterns at different slope positions.
Forests 17 00467 g005
Figure 6. Comparison of preferential flow parameters across slope positions. (a) Dye coverage (DC); (b) Uniform infiltration depth (UniFr); (c) Preferential flow fraction (PF-fr); (d) Length index (LI); (e) Peak index (PI); (f) Total stained area (TotStAr). Different lowercase letters indicate significant differences among slope positions (p < 0.05).
Forests 17 00467 g006
Figure 7. Correlation between soil properties, root traits, and preferential flow parameters. Significance levels: * p < 0.05, ** p < 0.01.
Forests 17 00467 g007
Figure 8. Slope position-specific management strategy based on preferential flow characteristics.
Forests 17 00467 g008
Table 1. Stand information of sample plots at different slope positions.
PositionSlope Gradient
(°)
Altitude (m)Stand Density
(Tree·hm−2)
Canopy DensityMean Tree Height (m)Mean DBH (cm)Clay (%)Silt (%)Sand (%)
LP2522727250.7416.218.310.058.920.5
MP2123887750.7917.919.69.461.833.0
UP1924676750.7516.818.911.468.128.8
Table 2. Soil properties in the 0–60 cm soil layer at different slope positions.
Soil PropertySoil Layer Slope Position
(cm)LPMPUP
SWC (%)0–6018.29 ± 2.87 a16.54 ± 2.95 a16.07 ± 2.95 a
Ks (mm·min−1)0–600.50 ± 0.14 b1.13 ± 0.40 a0.30 ± 0.07 b
TP (%)0–6058.39 ± 8.57 b63.77 ± 7.22 a56.42 ± 13.77 b
CP (%)0–6047.23 ± 12.99 a47.17 ± 6.87 a48.45 ± 7.76 a
NP (%)0–608.32 ± 4.50 ab7.34 ± 4.25 b11.16 ± 4.82 a
CC (g·kg−1)0–60429.69 ± 133.60 a384.76 ± 154.39 b413.09 ± 106.82 ab
FC (g·kg−1)0–60374.23 ± 108.67 a349.35 ± 148.25 a341.04 ± 100.08 a
BD (g·cm−3)0–601.29 ± 0.23 a1.08 ± 0.20 b1.20 ± 0.24 ab
SOM (g·kg−1)0–6037.33 ± 1.63 a28.15 ± 2.94 b31.44 ± 0.75 b
WSA (%)0–6077.58 ± 2.40 a72.23 ± 0.71 ab75.96 ± 0.91 b
Clay (%)0–609.98 ± 0.83 a9.39 ± 0.69 a11.35 ± 1.75 a
Silt (%)0–6058.88 ± 4.46 b61.77 ± 1.02 ab68.14 ± 2.03 a
Sand (%)0–6020.50 ± 3.78 b32.97 ± 2.51 a28.84 ± 0.57 a
Note: The lowercase letters are significantly different among slope positions in the same soil layer (p < 0.05). Data are expressed as the mean ± standard deviation (n = 5).
Table 3. Horizontal stained area ratios at different slope positions.
Soil Layer (cm)LPMPUP
0–528.74% ± 0.15% b39.49% ± 0.25% a27.07% ± 0.85% c
5–1013.50% ± 0.25% c29.29% ± 0.45% a28.75% ± 0.60% b
10–2035.45% ± 0.40% c63.09% ± 0.33% a43.49% ± 0.51% b
20–3011.88% ± 0.35% b26.98% ± 0.37% a5.98% ± 0.50% c
Note: Different lowercase letters indicate significant differences among plots (p < 0.05). Data are expressed as the mean ± standard deviation (n = 5).
Table 4. Vertical stained area ratios at different slope positions.
Soil Layer (cm)LPMPUP
0–537.66% ± 1.96% a37.76% ± 3.18% a37.25% ± 7.31% a
5–1038.48% ± 4.73% a39.00% ± 7.90% a38.57% ± 6.13% a
10–2041.07% ± 3.59% c51.71% ± 3.62% a48.56% ± 4.96% b
20–3042.36% ± 0.19% b65.31% ± 2.93% a62.82% ± 1.94% ab
30–4036.88% ± 3.14% b78.15% ± 5.14% a41.13% ± 6.37% b
40–5016.17% ± 1.20% b61.71% ± 2.48% a17.39% ± 1.50% b
50–600.00% b9.39% ± 2.17% a0.00% b
Note: Different lowercase letters indicate significant differences among slope positions (p < 0.05). The data were calculated based on the image width (40 cm) in Figure 4. Data are expressed as the mean ± standard deviation (n = 5).
Table 5. Preferential flow index (PFI) at different slope positions.
Slope PositionPreferential Flow Evaluation Index
LP0.28
MP0.67
UP0.41
Disclaimer/Publisher’s Note: The statements, opinions and data contained in all publications are solely those of the individual author(s) and contributor(s) and not of MDPI and/or the editor(s). MDPI and/or the editor(s) disclaim responsibility for any injury to people or property resulting from any ideas, methods, instructions or products referred to in the content.