Article

Land Use Type Affects SOM Molecular Composition in Forest Plantations by Altering Soil Nutrients and Enzyme Activities

1
East China Academy of Inventory and Planning of the National Forestry and Grassland Administration, Hangzhou 310019, China
2
State Key Laboratory for Development and Utilization of Forest Food Resources, Co-Innovation Center for Sustainable Forestry in Southern China, Nanjing Forestry University, Nanjing 210037, China
*
Author to whom correspondence should be addressed.
Forests 2026, 17(2), 222; https://doi.org/10.3390/f17020222
Submission received: 13 January 2026 / Revised: 3 February 2026 / Accepted: 4 February 2026 / Published: 6 February 2026
(This article belongs to the Section Forest Soil)

Abstract

Soil organic matter (SOM) molecular composition governs its stability and ecological functions in forest ecosystems. Nevertheless, how land-use changes (LUCs) regulate the SOM molecular composition remains poorly understood, particularly the underlying mechanisms mediated by soil properties. This study investigated the effects of LUCs on SOM molecular composition in a subtropical coastal region and examined the driving roles of soil nutrient availability and enzyme activities. The research was conducted in Huanghai National Forest Park, Jiangsu Province, China, focusing on four land-use types converted from historical wheat cropland (W, as control): monoculture plantations of Ginkgo biloba (G) and Metasequoia glyptostroboides (M), a ginkgo–metasequoia mixed forest (GM), and a ginkgo–wheat agroforestry system (GW). Soil samples were collected from 0 to 20 cm and 20–40 cm layers and analyzed for SOM molecular compositions using solid-state 13C nuclear magnetic resonance (NMR) spectroscopy. Soil chemical properties and enzyme activity activities were also determined, with redundancy analysis (RDA) and correlation analysis applied to identify key influencing factors. Results demonstrated that LUCs significantly altered SOM molecular composition. The GW system exhibited the highest proportion of labile O-alkyl carbon (42.65%), while the M plantation accumulated greatest levels of stable aromatic carbon (up to 49.25%). During the initial decades following afforestation, soil nutrient availability and enzyme activities were confirmed as pivotal drivers of SOM molecular variation. Specifically, available potassium (AK), ammonium nitrogen (AN), and the carbon/phosphorus (C/P) ratio were significantly correlated with specific SOM components (p < 0.05). The elevated O-alkyl carbon proportion in GW was closely associated with its higher invertase activity. Notably, vertical differentiation in SOM stability was observed across land-use types, with the agroforestry system achieving the highest carbon pool management index in surface soil but showing a weakened capacity for subsoil C stabilization. RDA further confirmed that AK and AN were dominant factors shaping SOM molecular composition. In conclusion, LUCs modulate SOM chemical composition and stability primarily through altering soil nutrient availability and associated enzyme activities. Agroforestry system facilitates labile C accumulation in surface soil, whereas monoculture plantations are more conducive to stable C sequestration, especially in subsoil layers. These findings provide novel mechanistic insights into SOM dynamics following LUCs and offer a theoretical basis for formulating tailored management strategies to enhance C sequestration efficiency in subtropical coastal ecosystems.

1. Introduction

Amidst global warming, the continuous accumulation of greenhouse gases (e.g., CO2, N2O) exerts profound impacts on the structure and functioning of terrestrial ecosystems. As the largest dynamic carbon pool, soil organic carbon (SOC), which forms the core carbon skeleton of soil organic matter (SOM), plays a critical role in regulating atmospheric CO2 concentrations and serves as a fundamental indicator of soil health and fertility [1,2]. It underpins essential soil ecological functions, including nutrient cycling and water retention, and provides the primary energy and carbon substrate for microbial metabolism [3,4]. However, SOC dynamics remain a major source of uncertainty in global carbon cycle modeling and carbon budget assessments, largely due to an incomplete understanding of the mechanisms through which land use practices regulate SOM stability [5]. To address this knowledge gap, research must extend beyond SOC stock quantification to examine the molecular composition of SOM, a key determinant of its stability, and the soil biogeochemical processes that shape this composition.
The stability of SOM is governed by the dynamic equilibrium between carbon input from plant residues and output via microbial decomposition, processes co-modulated by climate, vegetation type, and land management practices [6,7,8]. Forests, especially plantations, are recognized for their strong carbon sequestration potential and play an increasingly vital role in global climate change mitigation. Large-scale ecological projects in China have demonstrated that afforestation and forest restoration can markedly enhance both SOC stock and SOM stability [9,10]. Our previous research revealed that land-use changes (LUCs) significantly alter SOM mineralization rates, with bacterial alpha diversity identified as a key explanatory factor [11]. Notably, the agroforestry system exhibited higher SOC content but lower cumulative mineralization, a pattern that could not be fully explained by bacterial diversity alone. This implies that SOM molecular composition, as the direct substrate for microbial activity, is a critical unaddressed component in deciphering SOC stability. Therefore, elucidating how LUCs reshape the chemical structure of SOM is essential for mechanistically explaining differences in its stability and turnover dynamics [12].
SOM comprises a continuum of compounds with distinct degradability, ranging from labile O-alkyl carbon (e.g., polysaccharides) to recalcitrant alkyl and aromatic carbon (e.g., derivatives of lipids and lignin) [13,14,15,16]. Its molecular composition is continually transformed by microbial activity, a process regulated by environmental filters such as soil nutrient availability and extracellular enzyme activities [17,18]. Thus, accurately characterizing the chemical structure of SOM is crucial for understanding its turnover and long-term persistence. Conventional chemical fractionation methods lack sufficient resolution to reflect the native molecular composition of SOM, whereas advanced spectroscopic techniques such as solid-state 13C nuclear magnetic resonance (13C NMR) enable non-destructive, quantitative, and high-resolution analysis of SOM functional groups [19,20]. This technique can identify and quantify key carbon types, alkyl C (0–45 ppm), O-alkyl C (45–110 ppm), aromatic C (110–160 ppm), and carbonyl C (160–220 ppm) based on their chemical shifts. Moreover, derived indices (e.g., alkyl C/O-alkyl C ratio and aromaticity) serve as reliable proxies for assessing SOM stability and decomposition state [21], making it an ideal tool to unravel the structural complexity of SOM in heterogeneous land-use systems.
Under consistent climatic and edaphic conditions, land use emerges as a dominant regulator of SOM dynamics [22]. Conversion from cropland to forest has been widely reported to enhance both SOC quantity and quality, with sequestration capacity strengthening as plantations mature [23]. Different land use types influence SOC turnover through variations in litter quality and quantity, and shifts in microbial community structure, thereby modulating decomposition pathways and stabilization processes. Critically, these vegetation- and management-induced changes are mediated by alterations in the soil physicochemical environment and the activity of extracellular enzymes that catalyze organic matter decomposition [24,25]. These factors constitute the immediate drivers that transform plant residues into distinct SOM molecular signatures.
Despite extensive research on SOC stocks under different land uses, systematic and quantitative assessments of SOM chemical composition across different plantation types remain limited. More importantly, the explicit links between land-use-driven shifts in edaphic factors (e.g., nutrient availability, enzyme activity), the resulting alterations in the molecular structure of SOM, and subsequent changes in SOM stability are poorly understood. This gap hinders the ability to predict the persistence of sequestered carbon and optimize land management for long-term carbon sink enhancement. To address this, we hypothesized that: (1) Soil nutrient availability, enzyme activity, and SOM molecular composition (e.g., alkyl/O-alkyl ratio, aromaticity) differs significantly among land-use types, with tree-based systems containing a higher proportion of stable carbon forms than cropland; and (2) Variations in SOM molecular composition are more strongly associated with land-use-induced changes in key soil nutrients and microbial enzyme activities than with soil properties during the initial decades following afforestation. To test these hypotheses, we investigated typical land-use systems in a subtropical coastal region. By integrating solid-state 13C NMR spectroscopy with soil physicochemical and enzymatic properties analyses, this study aims to mechanistically explain the observed differences in SOM stability and provide a theoretical foundation for optimizing plantation management to enhance persistent carbon sequestration.

2. Materials and Methods

2.1. Study Site Description

The study was conducted in Huanghai National Forest Park (32°51′–32°52′ N, 120°48′–120°50′ E, 5 m a.s.l.) in Dongtai City, Jiangsu Province, China. The region has a subtropical monsoon climate, featuring distinct seasons, concentrated rainfall, and synchronous temperature and precipitation peaks. According to meteorological data from 1995 to 2018 (https://data.cma.cn/, accessed on 1 May 2025), the mean annual temperature is 15.45 °C, and the mean annual precipitation is 1075.88 mm, with over 53% occurring in summer. The soils are classified as Fluvisols according to the World Reference Base for Soil Resources 2022 (https://wrb.isric.org/documents/, accessed on 1 February 2026), with consistent physical properties (e.g., bulk density and texture) to those reported in Guo et al. [11], thereby minimizing the influence of inherent edaphic variation on inter-study comparisons [26].

2.2. Experimental Design and Soil Sampling

The manipulative field experiment was identical to those in Guo et al. [11], incorporating five land use types: wheat–maize rotation cropland (abbreviated as W, control), pure Ginkgo biloba plantation (G, planted at 3 m × 3 m spacing in 2002), pure Metasequoia glyptostroboides plantation (M, planted at 0.8 m × 0.8 m spacing in 2010), ginkgo–wheat agroforestry system (GW, established in 2002 with ginkgo spacing of 2 m × 8 m), and ginkgo–metasequoia mixed plantation (GM, ginkgo planted at 2 m × 8 m spacing in 2002, metasequoia planted at 0.8 m × 0.8 m spacing in 2010). Prior to the establishment of the forest plantations and the agroforestry system, the site was under conventional wheat–maize cultivation. During that period, traditional management was applied, including annual application of synthetic compound fertilizer (approximately 0.9 t ha−1, N:P2O5:K2O = 15:15:15). Since the land-use conversion to the current systems (G and GM in 2002 and M in 2010), no further fertilizers or pesticides have been applied. GW and W remained under the conventional management to sustain cereal crop yield as practiced historically.
For each land-use type, three replicate plots (10 m × 10 m) were randomly established. Ten soil cores were randomly collected from two depth layers (0–20 cm and 20–40 cm) using a soil auger, and thoroughly mixed to form one composite sample within each plot. Litter debris and visible roots were manually removed. Each composite sample was then quartered and divided into two portions: one was stored at 4 °C for soil enzyme activity analysis, and the other was air-dried at ambient temperature in a well-ventilated room and then sieved through a 2 mm mesh for subsequent analysis of soil physicochemical properties.

2.3. Soil Physicochemical and Biochemical Analyses

Soil ammonium nitrogen (AN) and nitrate nitrogen (NN) were extracted with 2 M KCl and determined by spectrophotometry. Available phosphorus (AP) was extracted with 0.5 M NaHCO3 and measured spectrophotometrically. Available potassium (AK) was extracted with 1 M CH3COONH4 and determined by flame photometry [27]. Soil enzyme activities were assessed using 3,5-dinitrosalicylic acid colorimetric methods; invertase activity (IA) and cellulase activity (CA) were measured using sucrose as substrate [18]. SOC was determined using the Walkley and Black method (SOM was estimated from SOC using a conversion factor of 1.724). ROC was determined using a modified Walkley and Black method (333 mmol·L−1 K2Cr2O7 and diluted 250-fold). TN was determined using the modified semimicro Kjeldahl method. TP was determined through sodium hydroxide melting molybdenum antimony colorimetry. TK was determined using the sodium hydroxide melting flame photometer method. The corresponding data were consistent with Guo et al. [11]. The stoichiometric ratios of C and nutrients were calculated by the mass ratios.

2.4. Solid-State 13C NMR Spectroscopy

Soil samples were pretreated with hydrofluoric acid (HF) to remove paramagnetic materials and improve the signal-to-noise ratio [28]. Briefly, 8 g of soil was repeatedly treated with 10% HF (8 times in total, with varying durations from 1 h to 24 h), centrifuged, and the supernatant discarded. The pellet was washed, dried, and ground through a 250 µm mesh sieve. Solid-state 13C CP/MAS NMR spectra were acquired on a Bruker AVANCE II 600 MHz spectrometer (13C frequency: 75.5 MHz, Bruker BioSpin, Rheinstetten, Germany) under 5 kHz spinning, 2 ms contact time, and 2.5 s recycle delay. Chemical shifts were referenced to hexamethylbenzene (17.33 ppm), and spectra were integrated into four regions: alkyl C (0–45 ppm), O-alkyl C (45–110 ppm), aromatic C (110–160 ppm), and carbonyl C (160–220 ppm).

2.5. Carbon Pool Management Index (CMI) Calculation

The CMI was calculated to evaluate the SOC dynamics and lability, according to Blair et al. [29], using the wheat–maize cropland (W) as the reference. The calculation formulas are as follows:
Carbon Pool Index (CPI) = SOC content of sample/SOC content of reference soil (W)
Lability (L) = ROC/(SOC5 − ROC)
Lability Index (LI) = L of sample/L of reference soil (W)
CMI = CPI × LI × 100
Notably, ROC: readily oxidizable organic carbon, an indicator of labile SOC. The SOC and ROC data used for CMI calculation were directly cited from Guo et al. (2023), ensuring that the index accurately reflects the relationship between SOM chemical structure and carbon pool stability [11].

2.6. Statistical Analysis

Data are presented as mean ± standard deviation (SD) of three independent biological replicates (n = 3). The statistical analyses were conducted in R software (version 4.5.1) and SPSS (version 20.0; IBM Corp., USA). Descriptive statistics and variance inflation factors (VIFs) were calculated. Prior to multivariate analysis, variables with severe multicollinearity (VIF > 10) were excluded. A two-way analysis of variance (Two-way ANOVA) was used to examine the main and interactive effects of land use type and soil depth on all measured soil variables (chemical properties, enzyme activities, C functional groups, and CMI). Assumptions of normality (Shapiro–Wilk test) and homogeneity of variances (Levene’s test) were verified before analysis.
Relationships between the relative abundances of SOM functional groups and other soil parameters were examined using Pearson correlation analysis and visualized via a heatmap (n = 30). Redundancy analysis (RDA) was performed to visualize and test the comprehensive effects of environmental variables on the SOM chemical composition. The response matrix (Y) consisted of the relative contents of the four SOM functional groups, and the explanatory matrix (X) included selected soil physicochemical and biological properties. All variables were standardized (Z-score) prior to RDA to eliminate scale effects. The significance of the RDA model and each explanatory axis was tested using 999 permutations.

3. Results

3.1. Soil Physicochemical Properties

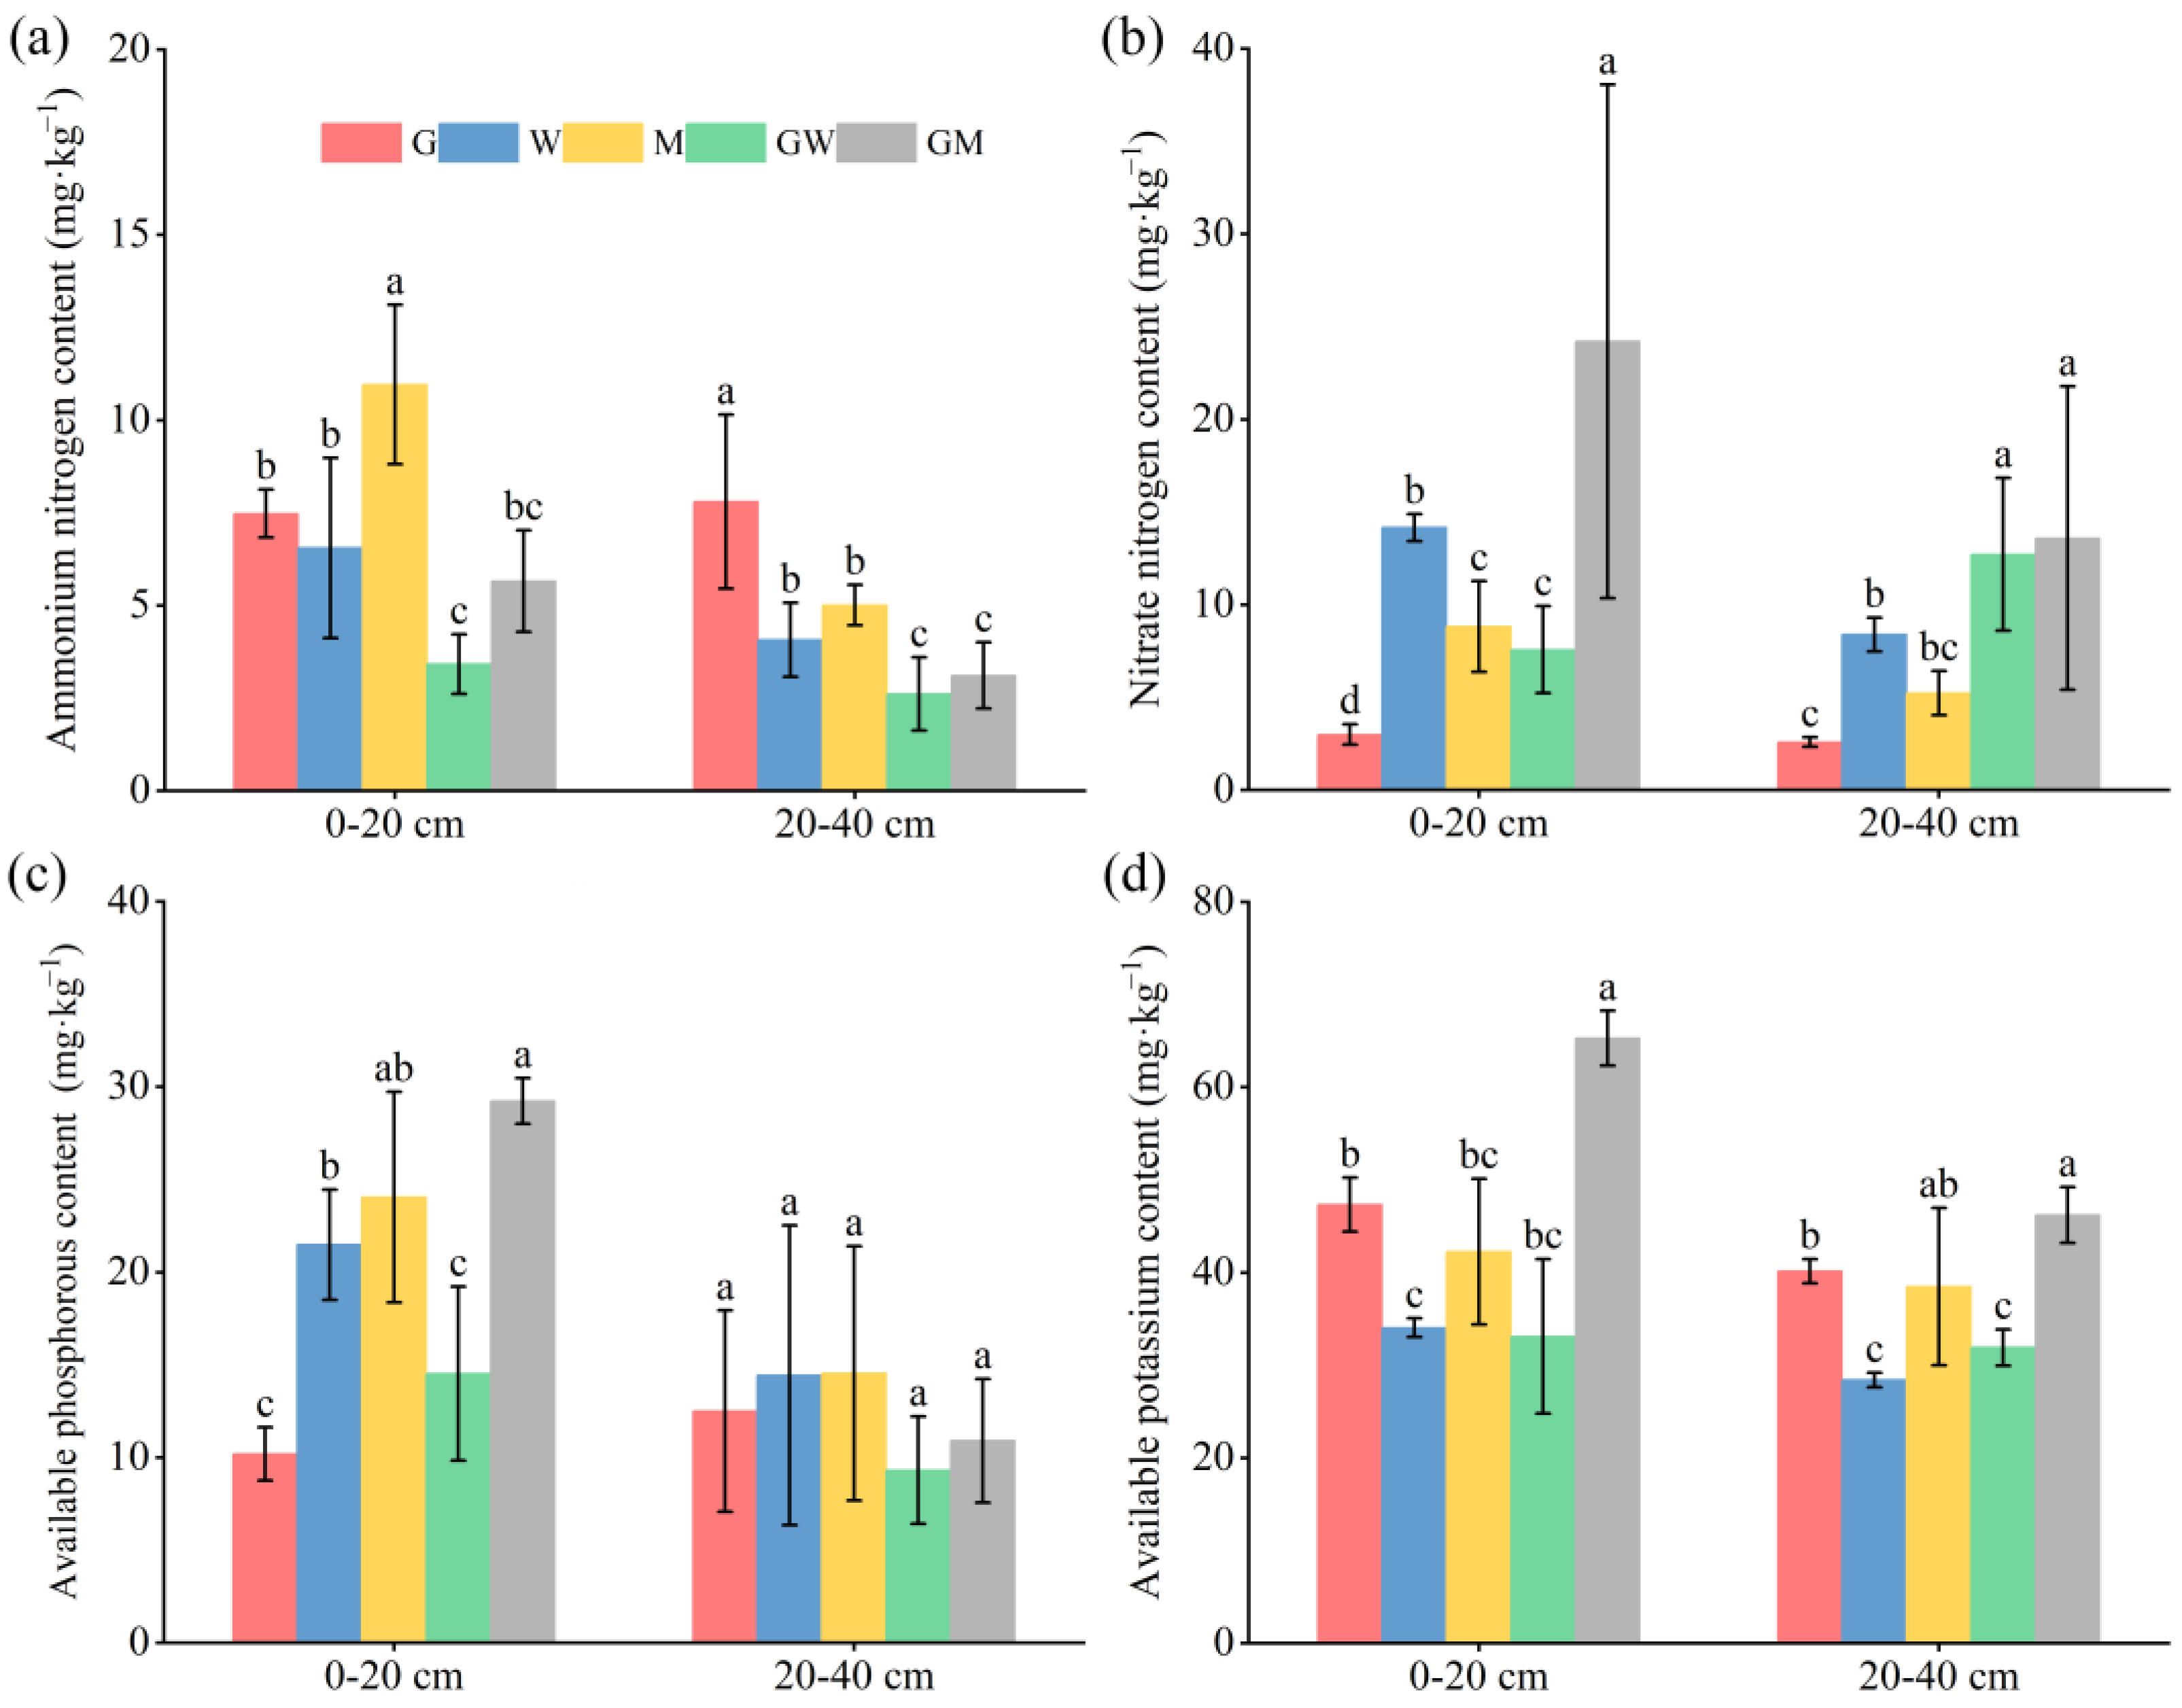
AN, AP, and AK were significantly influenced by the interaction between land use and depth (p < 0.05), while NO3-N was solely affected by the main effect of land use type (p < 0.05) (Figure 1). M exhibited the highest AN content in the 0–20 cm layer (10.97 mg·kg−1). NN was consistently enriched under GM in both soil layers, reaching 24.17 and 13.60 mg·kg−1, respectively, significantly higher than the lowest values under the G (2.99 and 2.58 mg·kg−1). Both AP and AK show a clear decreasing trend with depth. In the 0–20 cm layer, the lowest AP content was recorded under G (10.20 mg·kg−1), while GM reached the highest (29.25 mg·kg−1). In the 20–40 cm layer, M showed the highest AP value (14.55 mg·kg−1). GM also significantly enhanced AK content by 91.67% and 62.65% in the two layers, respectively, compared to W.

3.2. Stoichiometric Characteristics of Soil Elements

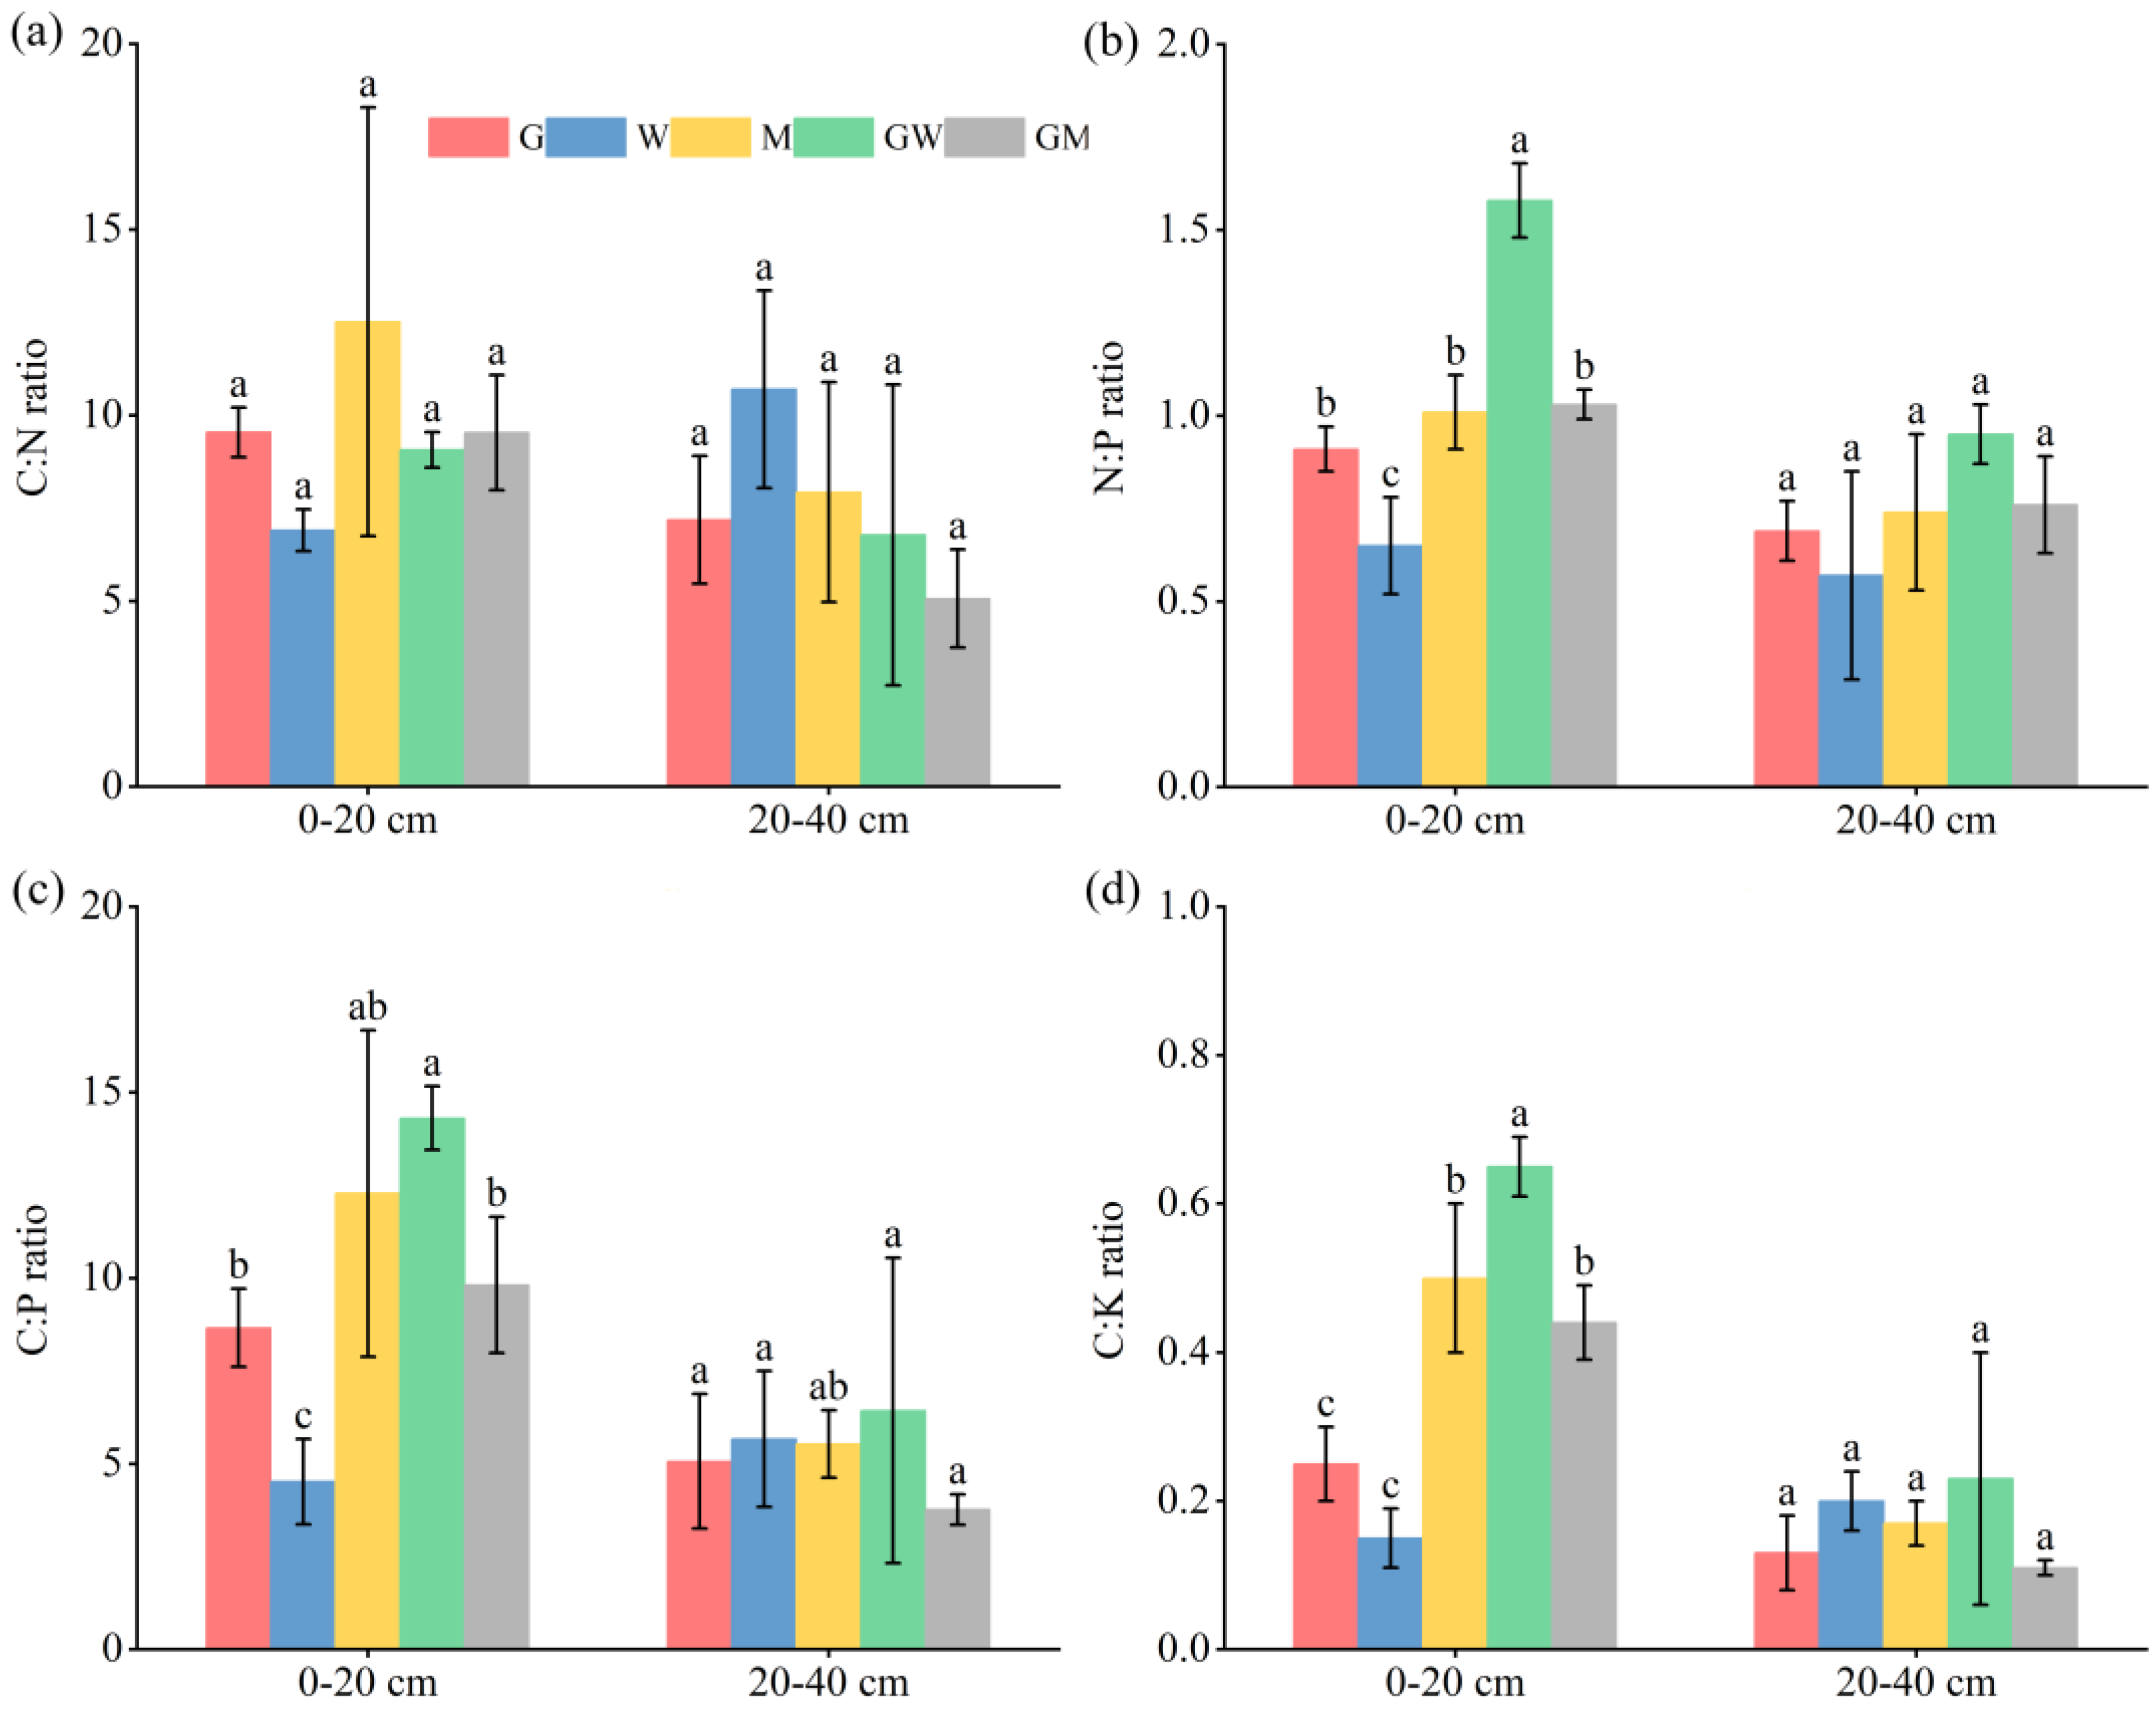
Soil stoichiometric ratios responded sensitively to land use types (Figure 2). In the 0–20 cm layer, the value ranges were as follows: C:N, 6.91–12.52; C:P, 4.52–14.31; N:P, 0.65–1.58; and C:K, 0.15–0.65. All ratios under the G, M, GW, and GM were higher than those under W. In the 20–40 cm layer, the value ranges were: C:N, 5.07–10.70; C:P, 3.77–6.43; N:P, 0.57–0.95; and C:K, 0.11–0.23. The highest soil C:N ratios were observed in the M (0–20 cm) and W (20–40 cm) treatments, while the GW system consistently exhibited the highest C:P, N:P, and C:K ratios across both soil layers. All land use types exhibited a decrease in stoichiometric ratios with depth, with declines ranging from 24.63%–75.00%, indicating that land use markedly altered soil nutrient balance, particularly in surface soil.

3.3. Activities of Carbon-Hydrolyzing Enzymes

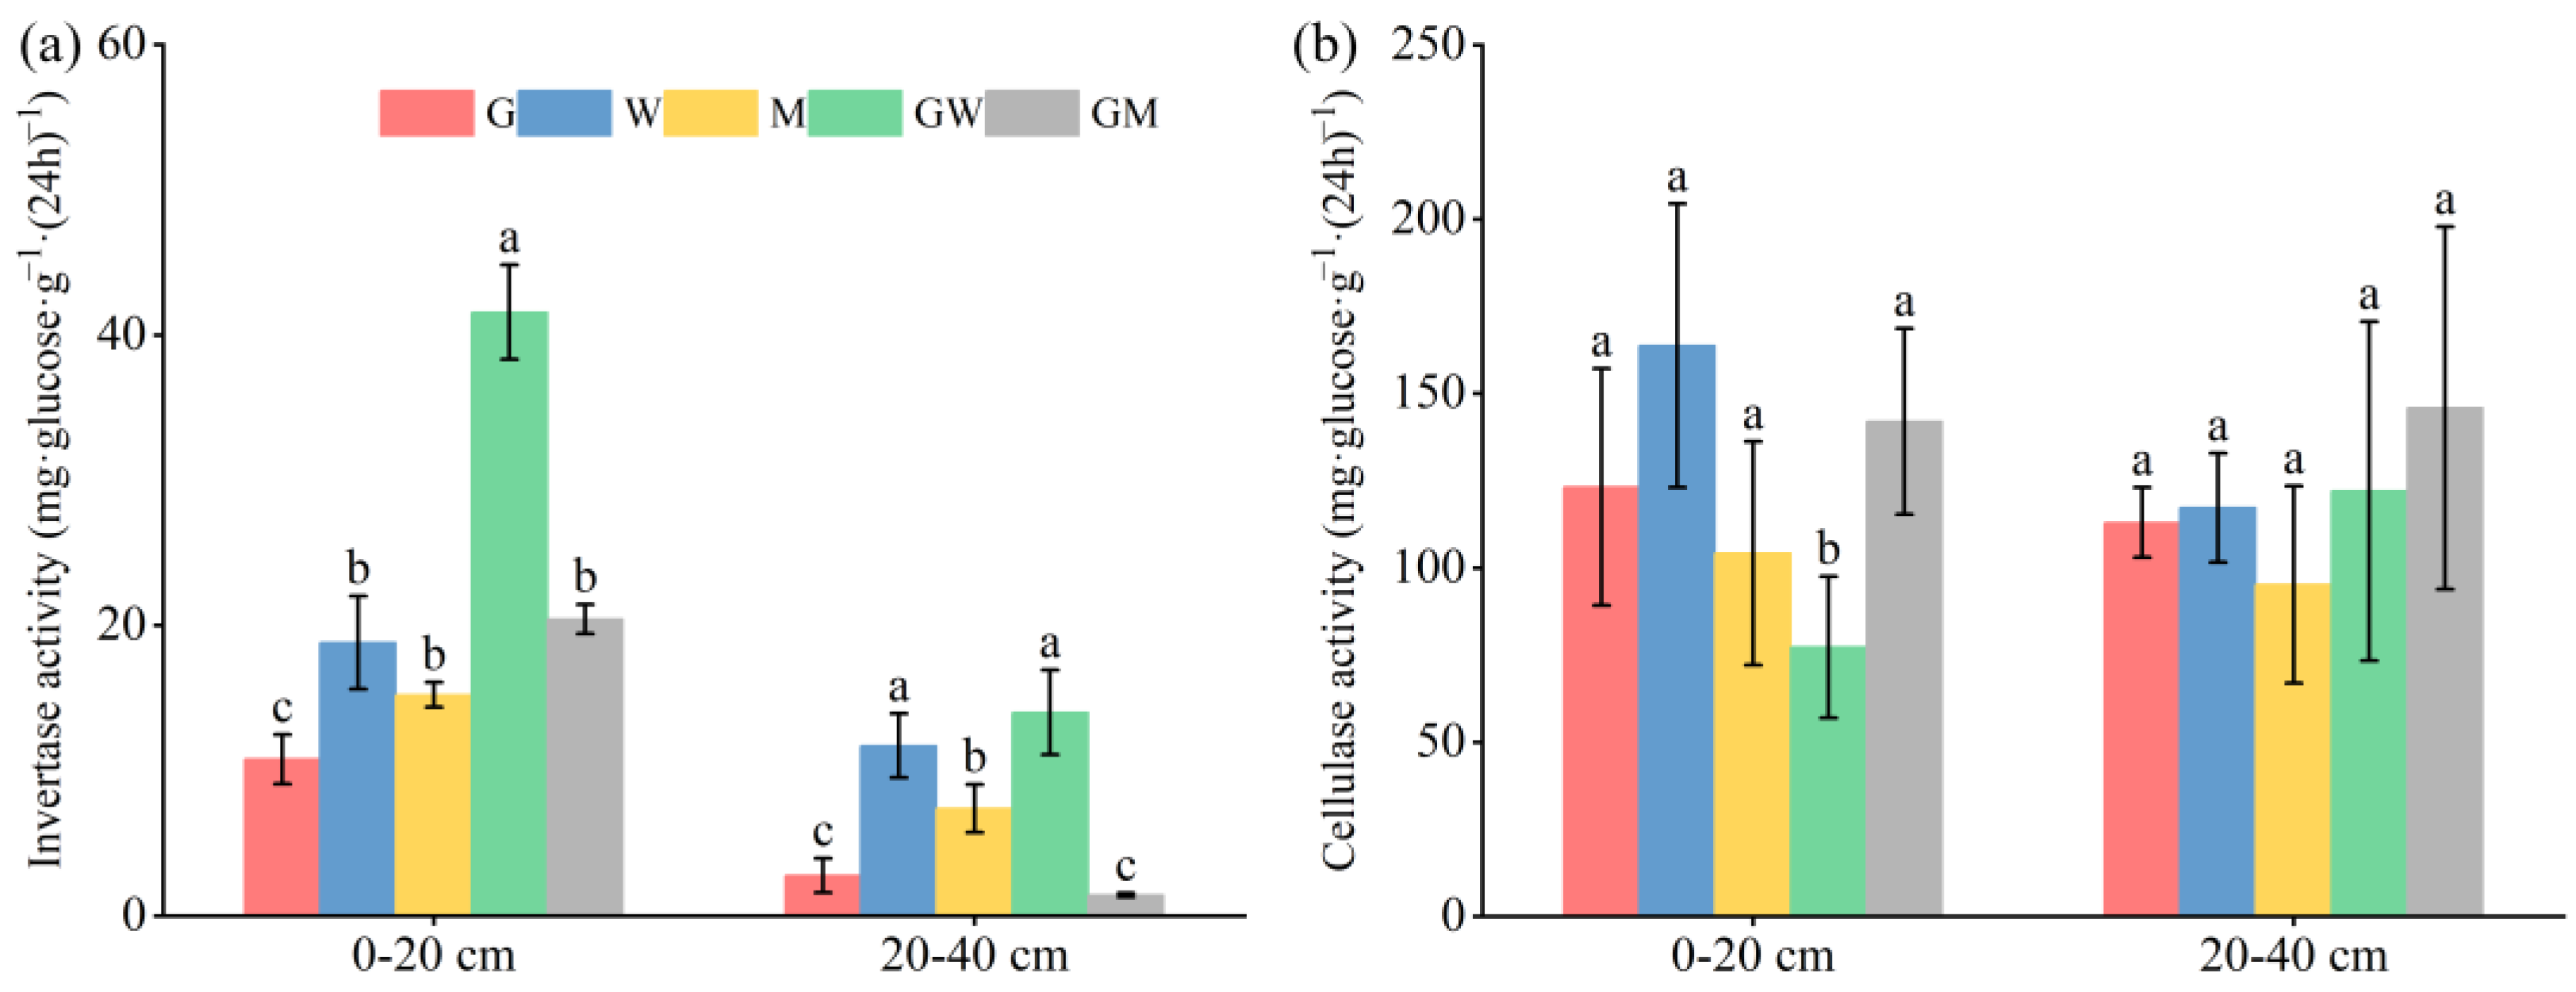
Invertase and cellulase activities, key enzymes in organic carbon transformation, showed significant vertical differentiation among land use types (Figure 3). Compared to the W system, the GW system significantly elevated invertase activity by 120.88% and 19.48% in the 0–20 cm and 20–40 cm layers, respectively (p < 0.01). Invertase activity was typically lower in other systems compared to W, except for GM in the 0–20 cm layer. By contrast, surface cellulase activity was 21.76%–86.50% lower across all land use types relative to W. However, in the 20–40 cm layer, cellulase activity under GW and GM increased significantly by 58.00% and 2.75%, respectively, relative to the surface soil. GM reached an activity of 145.93 mg glucose·g−1·24 h−1, exceeding the W by 24.40%.

3.4. Chemical Structure of SOM

Solid-state 13C NMR analysis revealed substantial variations in SOM chemical composition across different land-use systems and soil depths (Table 1), providing molecular-level insights into carbon stabilization mechanisms. Aromatic carbon, widely recognized as a robust indicator of stable SOM, constituted the dominant fraction across both soil layers (0–20 cm, 35.86%; 20–40 cm, 40.32%, respectively). Notably, the highest aromatic carbon proportions occurred in W (51.08%) and M (49.25%) systems in the surface layer, indicating considerable accumulation of stable, recalcitrant carbon pools in these systems. In contrast, the GW exhibited significantly reduced aromatic carbon proportion in both soil layers (minimum values of 28.84% and 31.94%; p < 0.05), suggesting fundamentally different carbon transformation pathways.
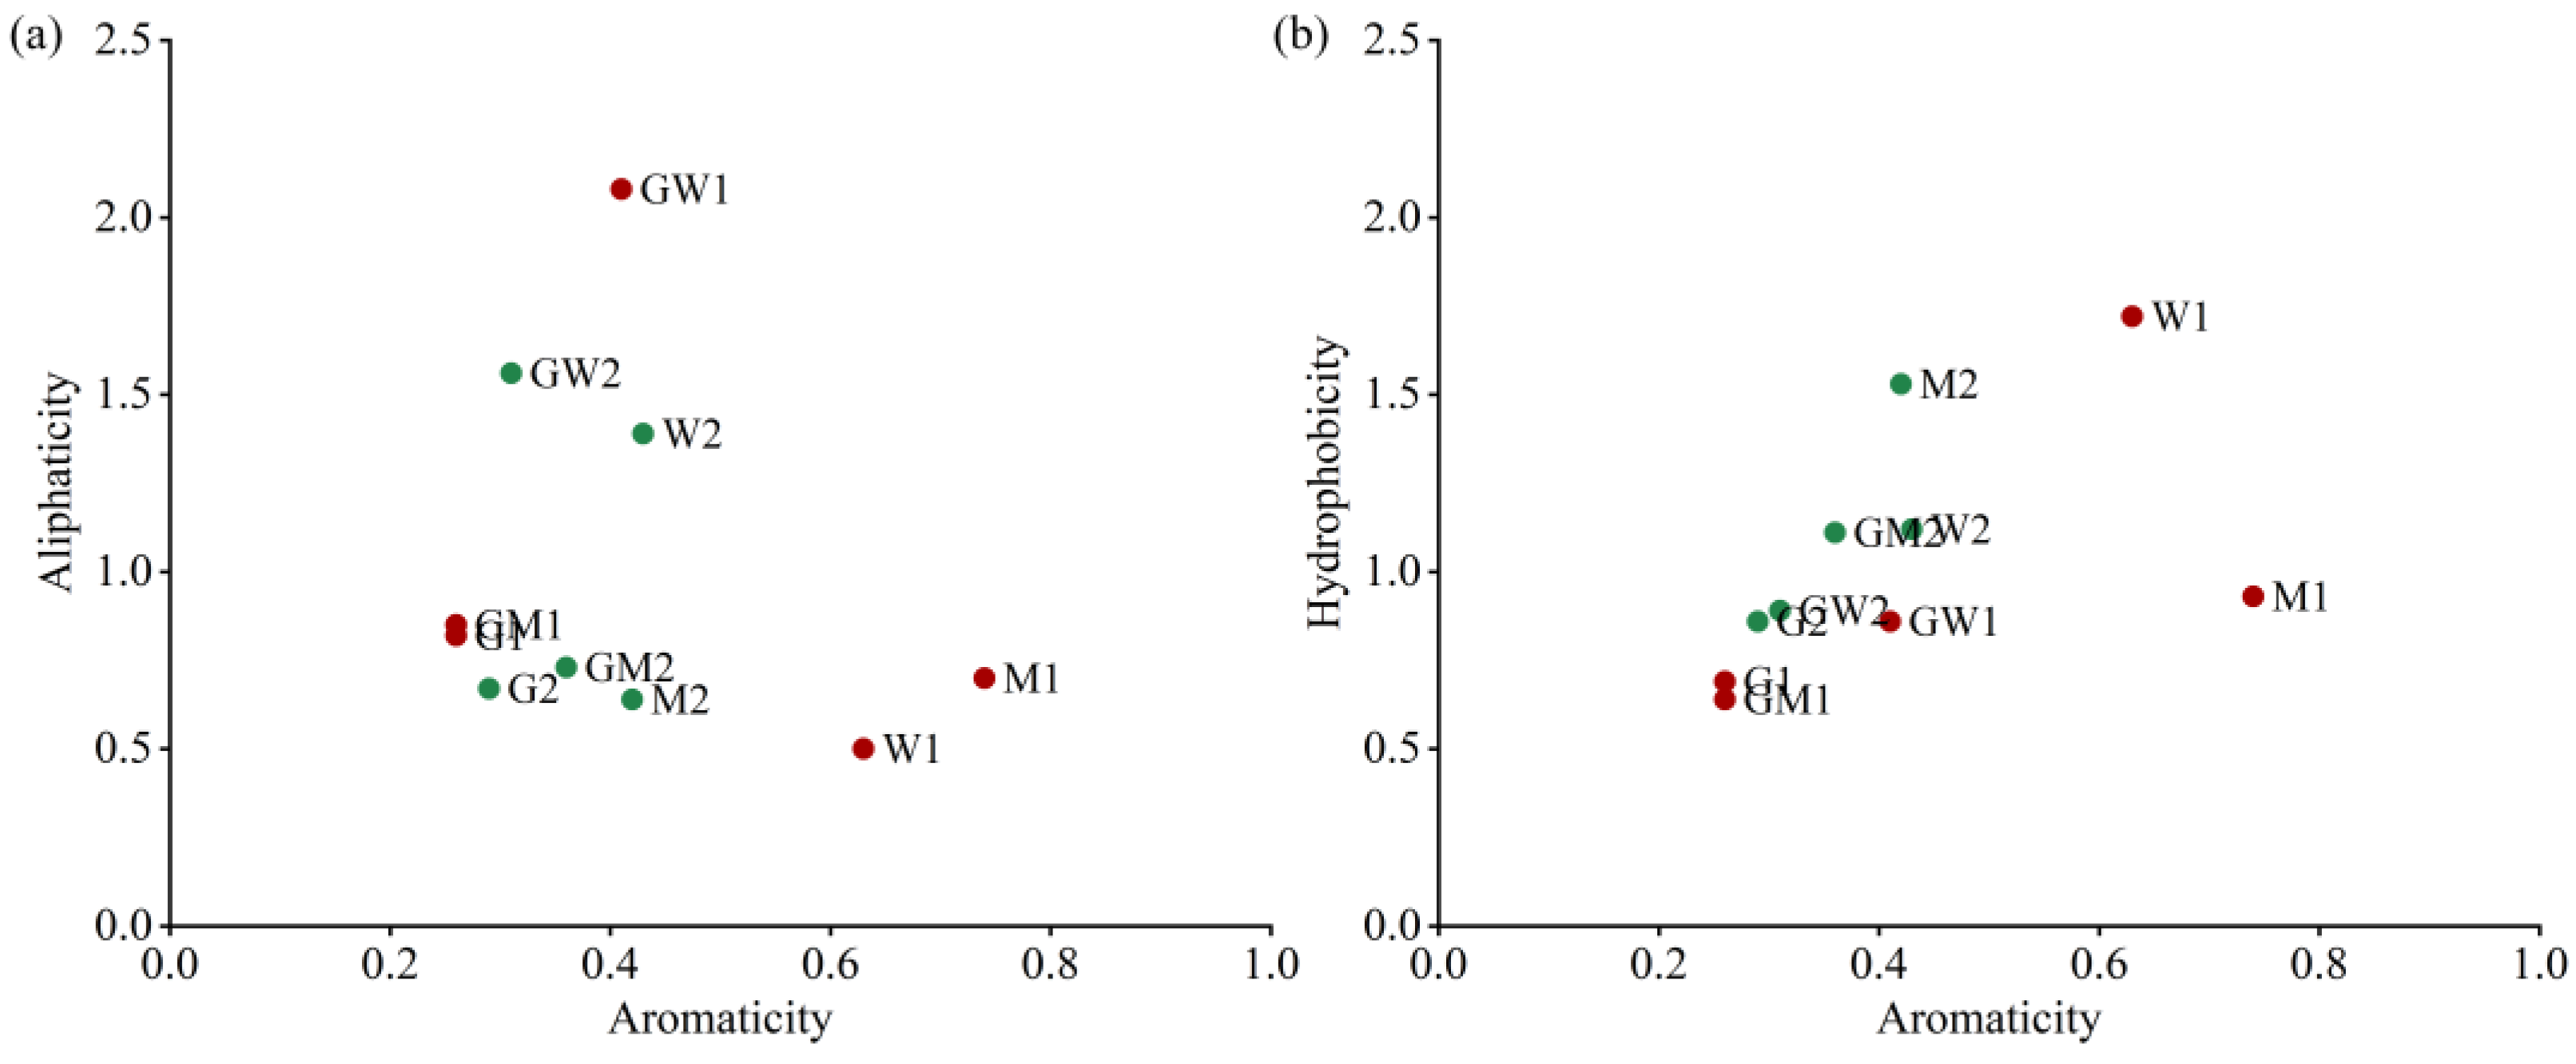
The GW displayed the highest O-alkyl carbon content in the surface layer (42.65%, 173.74% higher than W) and maintained O-alkyl dominance in the subsurface soil (37.95%). This pattern indicates substantial inputs of plant-derived carbohydrates and relatively rapid carbon cycling in the agroforestry system. Derived structural indices further quantified these compositional differences: the aromaticity index reached its maximum value in M in surface soil (0.74) and minimum values in G and GM (0.26), reflecting differential degrees of SOM stabilization (Figure 4). The aliphaticity index was highest in GW across both depths (2.08 and 1.56, respectively), while the W exhibited the highest hydrophobicity indices (1.72 and 1.12), potentially influencing microbial accessibility and decomposition rates.

3.5. Comprehensive Analysis

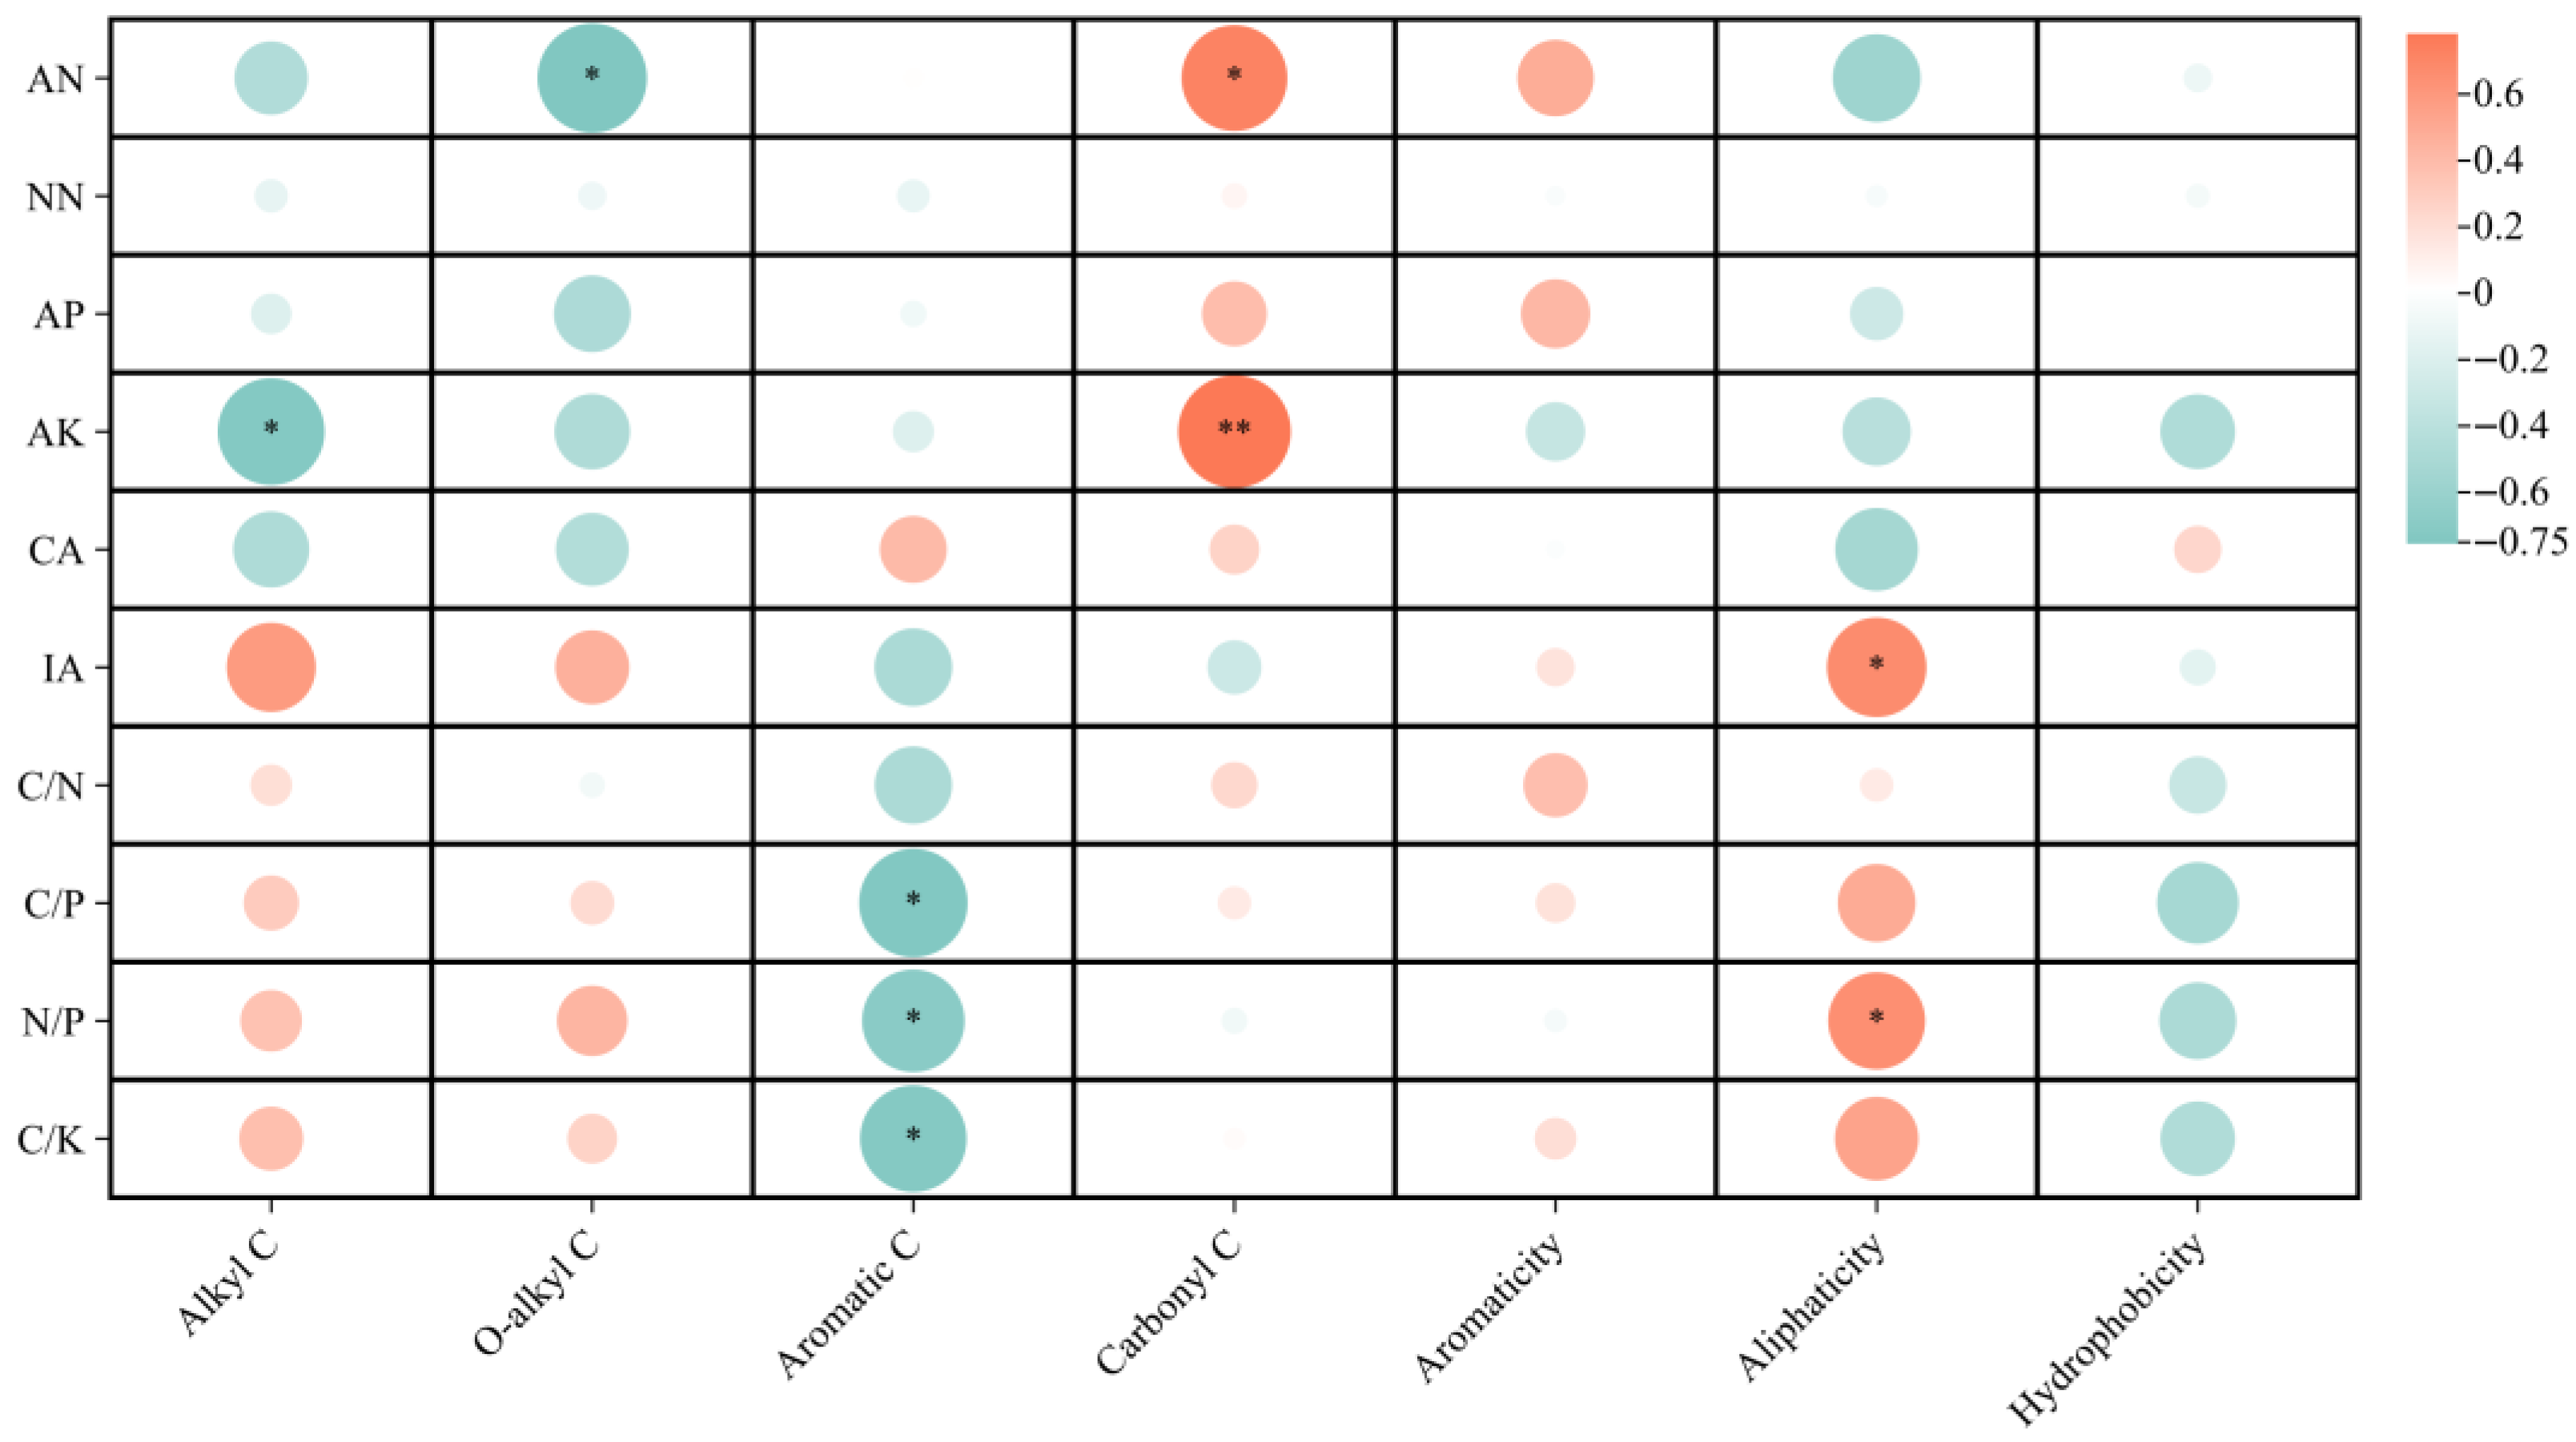
Correlation analysis identified a significant inverse relationship between alkyl C and AK (p < 0.05), alongside positive relationships of AN with both O-alkyl C and carbonyl C (Figure 5). Aromatic C demonstrated a significant negative correlation with C/P, N/P, and C/K. Additionally, aliphaticity was positively correlated with invertase activity and N/P (p < 0.05), indicating linkages between microbial processing and lipid carbon dynamics.
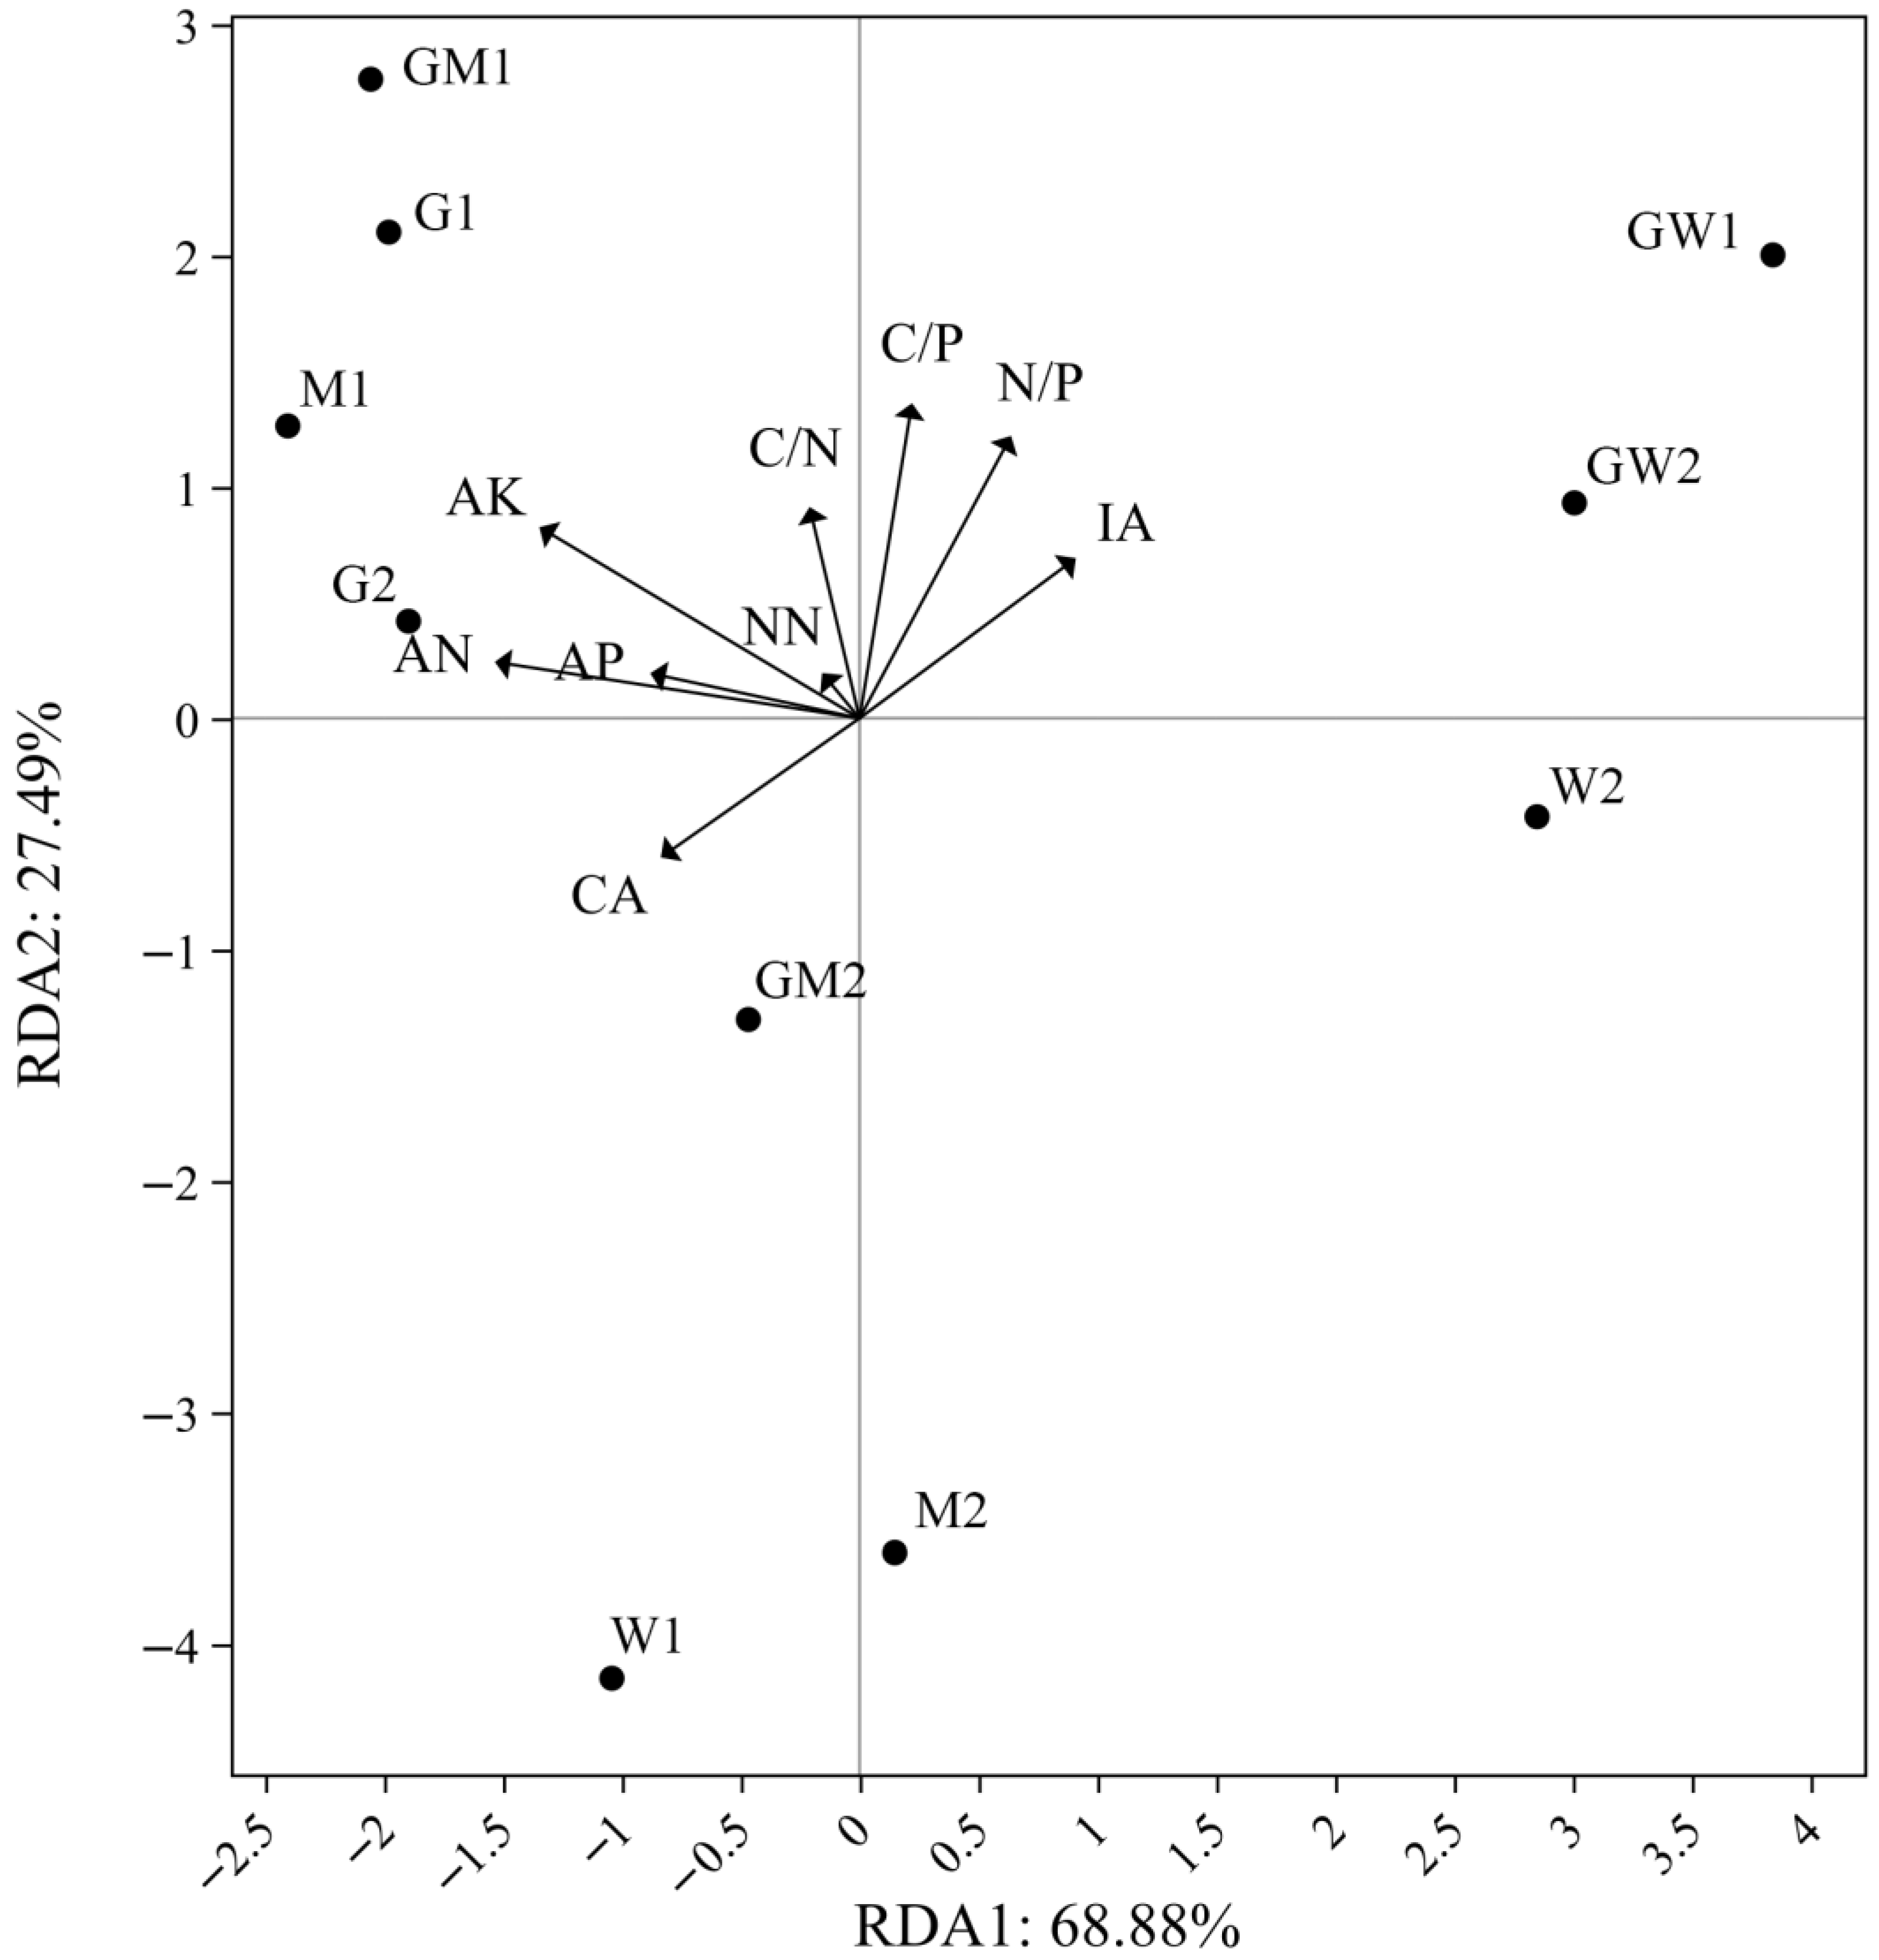
RDA further quantified the integrated effects of soil properties on SOM chemical structure. Permutation tests confirmed that the selected environmental factors together explained a highly significant proportion of variance in SOM molecular composition (p < 0.001). The RDA biplot clearly visualized the relationships between environmental variables and carbon fractions (Figure 6), with the first two axes collectively explaining 96.37% of the variance (RDA1: 68.88%; RDA2: 27.49%), indicating robust model performance. Critically, the analysis distinguished drivers operating on different temporal scales. The identified key environmental factors, including AK, AN, and the C/P ratio, all significantly influencing SOM chemical structure (p < 0.05). These labile parameters reflect recent biogeochemical cycling and immediate nutrient availability, emerged as the dominant drivers in young plantations. Vector orientations in the RDA space indicated that AK and AN were associated with higher proportions of labile O-alkyl carbon, while the C/P ratio aligned more closely with stable aromatic carbon fractions.

3.6. CMI Analysis

The CMI effectively bridged the molecular characteristics of SOM and their ecosystem functions, directly linking land use practices to distinct pathways of soil carbon stabilization. GW showed the highest stable carbon content in both layers, consistent with its elevated SOC content (Table 2). The CPI mirrored stable carbon patterns, with ginkgo-based systems in the 0–20 cm layer following the order: GW > M > GM > G (ranging from 1.75 to 4.17), and in the 20–40 cm layer: GW > M > G > GM (range: 0.59–1.14).
CMI patterns revealed depth-dependent functionality across systems. In surface soils (0–20 cm), systems followed the order GW > GM > M > G (range: 42.74–67.17), indicating enhanced carbon stabilization capacity in agroforestry systems. Conversely, in subsurface layers (20–40 cm), pure forest systems (G and M) showed increased CMI values while agroforestry systems (GW and GM) declined. These patterns align with the molecular composition data, where systems with higher aromatic carbon (M, G) exhibited greater depth persistence, while systems dominated by O-alkyl carbon (GW) showed more pronounced surface accumulation.

4. Discussion

Land-use changes fundamentally alter the input and accumulation of soil organic matter, thereby exerting a profound impact on soil available nutrients, stoichiometry, and enzyme activities [30,31]. In this study, land-use type was confirmed as a primary driver reshaping both the soil nutrient environment and the molecular composition of SOM in coastal plantation systems, supporting our first hypothesis. Tree-based systems (G, M, GM, GW) consistently fostered a soil environment distinct from cropland (W), characterized by divergent levels of available nutrients. Specifically, the GM system exhibited higher levels of NN, AP, and AK, likely due to enhanced nutrient redistribution via deep-rooted tree species [32,33]. In contrast, the lower AP and AK under GW reflect the high nutrient demand of intensive cropping in the rotation system, and low P/K availability constrains microbial decomposition of labile carbon. In addition, the consistently higher content of available nutrients in the surface soil (0–20 cm) compared to the subsurface layer (20–40 cm) aligns with the greater inputs of litter and organic matter in surface soils [34].
Crucially, these shifts in land use and nutrient context were directly mirrored in the SOM molecular composition. As hypothesized, the GW system contained a significantly higher proportion of labile O-alkyl C and a lower proportion of stable aromatic C, aligning with substantial inputs of crop residues rich in carbohydrates [35,36,37]. This interpretation is corroborated by two independent lines of evidence: elevated invertase activity in the GW system, and our parallel finding of reduced SOM mineralization despite higher labile carbon content [11,32]. Conversely, the pure forest systems (G and M) exhibited a marked enrichment of aromatic carbon, indicative of a larger pool of recalcitrant compounds derived from lignin-rich forest litter [38]. This clear divergence in SOM chemical structure among land-use types validates our first hypothesis and establishes the substrate basis for differential carbon stability.
Our second hypothesis posited that SOM composition differences are strongly associated with land-use-induced variations in soil nutrients and enzyme activities. Our analyses support this by identifying available nutrients, specifically AK and AN, as major factors governing SOM chemical structure (e.g., via RDA) in these young plantations. During the initial decades following afforestation, shifts in SOM chemical composition are most directly mediated by the available nutrient pools and their associated microbial activities, rather than by the relatively stable soil parameters [39]. The nutrient-rich environment under GW appeared to stimulate a bacterial-dominated metabolism, favoring the rapid processing of labile inputs (high O-alkyl C) and the accumulation of microbial derivatives, as reflected in its high aliphaticity [15,40,41,42]. This process was biochemically evidenced by the markedly higher invertase activity under GW, which corresponds to active microbial hydrolysis of glycosidic bonds and utilization of labile carbon sources [43,44].
In contrast, relatively lower nutrient availability in the pure forest systems, particularly phosphorus, favors fungal-dominated communities. These fungi are not only more adept at functioning in low-phosphorus environments but are also specialized in the slow, oxidative degradation of recalcitrant compounds like lignin [38]. This selective preservation pathway, alongside physicochemical protection, explains the higher aromaticity in these systems. The suppressed cellulase activity in pure forest surface soils further suggests a microbial strategy that bypasses readily decomposable structural compounds (cellulose) to focus on more recalcitrant materials, thereby preserving stable carbon components [45,46,47]. Thus, land use modulates SOM molecular composition not merely through initial litter quality, but more dynamically through its control over the soil nutrient milieu and the consequent expression of microbial enzymatic strategies.
The stability of SOM is further modulated by depth-dependent processes. GW surface soil (0–20 cm) showed superior carbon pool stability (high CPI and CMI), aligning with its high SOC and alkyl carbon accumulation from intense microbial processing. However, its contribution diminished in subsurface layers. In contrast, pure forests exhibited increasing stability indices with depth, coinciding with higher aromaticity, suggesting that deep-rooting trees facilitate the translocation and preservation of stable, plant-derived compounds in subsoils where microbial activity is reduced.
Notably, our findings must be interpreted within the context of divergent post-conversion management, particularly the continuation or cessation of fertilization. Synthesizing our findings with prior work [11], we propose an integrated mechanistic framework to explain land-use effects on coastal SOC dynamics: (1) Land-use type determines litter input quality/quantity and modifies the soil nutrient availability. (2) The significantly higher levels of AK and AN under the GW system may be a legacy of its sustained fertilizer inputs, which identified as key drivers of labile O alkyl C accumulation. (3) SOM molecular signature (O-alkyl C vs. aromatic C dominance) ultimately determines the intrinsic stability and turnover rate of carbon pools, with differential outcomes across soil depths.
N input can enhance soil microbial activity and invertase production, accelerating the processing of fresh plant residues into microbial-derived labile intermediates and may modify microbial processes and affect SOM stability [48,49]. This framework validates our hypotheses by delineating the cascade from land use to SOM composition via soil nutrients and enzymes, providing a mechanistic basis for managing plantations to enhance persistent carbon sequestration. Future studies should aim to quantify the long-term C sequestration efficiency across this management gradient, balancing input-driven accumulation against stability.

5. Conclusions

This study integrated solid-state 13C NMR technology with soil physicochemical and enzymatic analysis to investigate the chemical structure of SOM and the mechanisms regulating its stability under different land use types in a subtropical coastal region of Northern Jiangsu. The results demonstrated that land use significantly altered the chemical composition and stability of SOM. GW promoted the accumulation of labile O-alkyl carbon, exhibiting the highest CMI in the surface soil, which indicates higher carbon lability and short-term carbon sequestration potential. In contrast, M accumulated higher amounts of lignin-derived aromatic carbon, accompanied by a greater aromaticity index, indicating enhanced chemical stability of SOM. RDA identified AK and AN as key environmental factors driving the divergence in SOM chemical structure during the initial decades following afforestation. The agroforestry system facilitated a rapid carbon turnover pathway characterized by bacterial-dominated decomposition, elevated nutrient availability, and high invertase activity. In comparison, pure forest systems promoted the accumulation of stable carbon components under relatively nutrient-limited conditions, likely through fungal-mediated decomposition of recalcitrant compounds. Furthermore, land use effects on SOC exhibited pronounced vertical differentiation. The agroforestry system significantly enhanced SOC retention in the surface layer (0–20 cm) but showed limited contribution to the stability of the subsoil carbon pool (20–40 cm). In summary, this study confirms that agroforestry practices are effective for rapidly improving topsoil fertility and increasing surface carbon storage in coastal plantations. However, further research is needed to develop management strategies that enhance the stability and persistence of deep soil carbon sinks.

Author Contributions

Conceptualization, J.G. and G.W.; methodology, A.Z.; software, J.G.; validation, G.Z., N.S. and W.T.; formal analysis, A.Z., G.Z., N.S. and W.T.; investigation, J.G.; resources, J.G.; data curation, G.W.; writing—original draft preparation, J.G.; writing—review and editing, G.W.; visualization, A.Z.; supervision, G.W.; project administration, G.W.; funding acquisition, A.Z. All authors have read and agreed to the published version of the manuscript.

Funding

This research was supported by the China National Academy of Bamboo Industry (2025YJY08), the National Key Research and Development Program of China (2017YFD0600700), and the Priority Academy Program Development of Jiangsu Higher Education Institution (PAPD).

Data Availability Statement

The data supporting the conclusions of this study are included within the article and are available from the corresponding author upon reasonable request.

Conflicts of Interest

The authors declare no conflicts of interest.

References

  1. Wiesmeier, M.; Hübner, R.; Spörlein, P.; Geuß, U.; Hangen, E.; Reischl, A.; Schilling, B.; von Lützow, M.; Kögel-Knabner, I. Carbon sequestration potential of soils in southeast Germany derived from stable soil organic carbon saturation. Glob. Change Biol. 2014, 20, 653–665. [Google Scholar] [CrossRef]
  2. Zhao, H.; Shar, A.G.; Li, S.; Chen, Y.; Shi, J.; Zhang, X.; Tian, X. Effect of straw return mode on soil aggregation and aggregate carbon content in an annual maize-wheat double cropping system. Soil Tillage Res. 2018, 175, 178–186. [Google Scholar] [CrossRef]
  3. Shao, X.; Yang, W.; Wu, M. Seasonal dynamics of soil labile organic carbon and enzyme activities in relation to vegetation types in Hangzhou Bay tidal flat wetland. PLoS ONE 2015, 10, e0142677. [Google Scholar] [CrossRef]
  4. Yu, P.; Liu, S.; Han, K.; Guan, S.; Zhou, D. Conversion of cropland to forage land and grassland increases soil labile carbon and enzyme activities in northeastern China. Agric. Ecosyst. Environ. 2017, 245, 83–91. [Google Scholar] [CrossRef]
  5. You, Y.; Wang, J.; Sun, X.; Tang, Z.; Zhou, Z.; Sun, O. Differential controls on soil carbon density and mineralization among contrasting forest types in a temperate forest ecosystem. Sci. Rep. 2016, 6, 22411. [Google Scholar] [CrossRef] [PubMed]
  6. Davidson, E.A.; Janssens, I.A. Temperature sensitivity of soil carbon decomposition and feedbacks to climate change. Nature 2006, 440, 165–173. [Google Scholar] [CrossRef] [PubMed]
  7. Marin-Spiotta, E.; Chaopricha, N.T.; Plante, A.F.; Diefendorf, A.F.; Mueller, C.W.; Grandy, A.S.; Mason, J.A. Long-term stabilization of deep soil carbon by fire and burial during early Holocene climate change. Nat. Geosci. 2014, 7, 428–432. [Google Scholar] [CrossRef]
  8. Yang, J.; Li, A.; Yang, Y.; Li, G.; Zhang, F. Soil organic carbon stability under natural and anthropogenic-induced perturbations. Earth-Sci. Rev. 2020, 205, 103199. [Google Scholar] [CrossRef]
  9. Han, X.; Zhao, F.; Tong, X.; Deng, J.; Yang, G.; Chen, L.; Kang, D. Understanding soil carbon sequestration following the afforestation of former arable land by physical fractionation. Catena 2017, 150, 317–327. [Google Scholar] [CrossRef]
  10. Poeplau, C.; Don, A. Sensitivity of soil organic carbon stocks and fractions to different land-use changes across Europe. Geoderma 2013, 192, 189–201. [Google Scholar] [CrossRef]
  11. Guo, J.; Xiong, W.; Qiu, J.; Wang, G. Linking soil organic carbon mineralization to soil physicochemical properties and bacterial alpha diversity at different depths following land use changes. Ecol. Process. 2023, 12, 39. [Google Scholar] [CrossRef]
  12. Crow, S.E.; Lajtha, K.; Filley, T.R.; Swanston, C.W.; Bowden, R.D.; Caldwell, B.A. Sources of plant-derived carbon and stability of organic matter in soil: Implications for global change. Glob. Change Biol. 2009, 15, 2003–2019. [Google Scholar] [CrossRef]
  13. Assunção, S.A.; Pereira, M.G.; Rosset, J.S.; Berbara, R.L.L.; García, A.C. Carbon input and the structural quality of soil organic matter as a function of agricultural management in a tropical climate region of Brazil. Sci. Total Environ. 2019, 658, 901–911. [Google Scholar] [CrossRef] [PubMed]
  14. Chai, Y.; Zeng, X.; Che, Z.; Bai, L.; Su, S.; Wang, Y. The stability mechanism for organic carbon of aggregate fractions in the irrigated desert soil based on the long-term fertilizer experiment of China. Catena 2019, 173, 312–320. [Google Scholar] [CrossRef]
  15. He, Y.T.; He, X.H.; Xu, M.G.; Zhang, W.J.; Yang, X.Y.; Huang, S.M. Long-term fertilization increases soil organic carbon and alters its chemical composition in three wheat-maize cropping sites across central and south China. Soil Tillage Res. 2018, 177, 79–87. [Google Scholar] [CrossRef]
  16. Wang, C.; Kuzyakov, Y. Mechanisms and implications of bacterial-fungal competition for soil resources. ISME J. 2024, 18, wrae073. [Google Scholar] [CrossRef]
  17. Ye, X.; Luan, J.; Wang, H.; Zhang, Y.; Wang, Y.; Liu, S. N-fixing tree species promote the chemical stability of soil organic carbon in subtropical plantations through increasing the relative contribution of plant-derived lipids. For. Ecosyst. 2024, 11, 100232. [Google Scholar] [CrossRef]
  18. Wang, C.; Xue, L.; Jiao, R. Soil organic carbon fractions, C-cycling associated hydrolytic enzymes, and microbial carbon metabolism vary with stand age in Cunninghamia lanceolate (Lamb.) Hook plantations. For. Ecol. Manag. 2021, 482, 118887. [Google Scholar] [CrossRef]
  19. Spaccini, R.; Mbagwu, J.S.C.; Conte, P.; Piccolo, A. Changes of humic substances characteristics from forested to cultivated soils in Ethiopia. Geoderma 2006, 132, 9–19. [Google Scholar] [CrossRef]
  20. Spaccini, R.; Piccolo, A. Molecular characteristics of humic acids extracted from compost at increasing maturity stages. Soil Biol. Biochem. 2009, 41, 1164–1172. [Google Scholar] [CrossRef]
  21. Ussiri, D.A.; Johnson, C.E. Characterization of organic matter in a northern hardwood forest soil by 13C NMR spectroscopy and chemical methods. Geoderma 2003, 111, 123–149. [Google Scholar] [CrossRef]
  22. Gao, J.; Zhang, X.; Lei, G.; Wang, G. Soil organic carbon and its fractions in relation to degradation and restoration of wetlands on the Zoigê Plateau, China. Wetlands 2014, 34, 235–241. [Google Scholar] [CrossRef]
  23. Don, A.; Schumacher, J.; Freibauer, A. Impact of tropical land-use change on soil organic carbon stocks—A meta-analysis. Glob. Change Biol. 2011, 17, 1658–1670. [Google Scholar] [CrossRef]
  24. Zhao, J.; Lai, L.; Mei, Y.; Zhao, Y.; Li, Z.; Dou, Y.; Hou, L.; Geng, Q.; Zhang, S. Distinct roles of forest stand types in regulating soil organic carbon stability across depths. Forests 2025, 16, 1585. [Google Scholar] [CrossRef]
  25. Wang, Y.; Tu, H.; Zheng, J.; Li, X.; Wang, G.; Guo, J. Ecological stoichiometric characteristics of plant–litter–soil among different forest stands in a limestone region of China. Plants 2025, 14, 1758. [Google Scholar] [CrossRef]
  26. IUSS Working Group WRB. World Reference Base for Soil Resources. In International Soil Classification System for Naming Soils and Creating Legends for Soil Maps, 4th ed.; IUSS: Vienna, Austria, 2022. [Google Scholar]
  27. Guo, J.; Wang, B.; Wang, G.; Wu, Y.; Cao, F. Vertical and seasonal variations of soil carbon pools in ginkgo agroforestry systems in eastern China. Catena 2018, 171, 450–459. [Google Scholar] [CrossRef]
  28. Mathers, N.J.; Xu, Z.; Berners-Price, S.J.; Perera, M.S.; Saffigna, P.G. Hydrofluoric acid pre-treatment for improving 13C CPMAS NMR spectral quality of forest soils in south-east Queensland, Australia. Soil Res. 2002, 40, 665–674. [Google Scholar] [CrossRef]
  29. Blair, G.J.; Lefroy, R.D.; Lisle, L. Soil carbon fractions based on their degree of oxidation, and the development of a carbon management index for agricultural systems. Aust. J. Agric. Res. 1995, 46, 1459–1466. [Google Scholar] [CrossRef]
  30. Qiao, Y.; Miao, S.; Han, X.; Yue, S.; Tang, C. Improving soil nutrient availability increases carbon rhizodeposition under maize and soybean in Mollisols. Sci. Total Environ. 2017, 603, 416–424. [Google Scholar] [CrossRef]
  31. Sarker, J.R.; Singh, B.P.; Dougherty, W.J.; Fang, Y.; Badgery, W.; Hoyle, F.C.; Dalal, R.C.; Cowie, A.L. Impact of agricultural management practices on the nutrient supply potential of soil organic matter under long-term farming systems. Soil Tillage Res. 2018, 175, 71–81. [Google Scholar] [CrossRef]
  32. Wu, M.; Pang, D.; Chen, L.; Li, X.; Liu, L.; Liu, B.; Li, J.; Wang, J.; Ma, L. Chemical composition of soil organic carbon and aggregate stability along an elevation gradient in Helan Mountains, northwest China. Ecol. Indic. 2021, 131, 108228. [Google Scholar] [CrossRef]
  33. Kirschbaum, M.U.F.; Guo, L.; Gifford, R.M. Observed and modelled soil carbon and nitrogen changes after planting a Pinus radiata stand onto former pasture. Soil Biol. Biochem. 2008, 40, 247–257. [Google Scholar] [CrossRef]
  34. Zhang, K.; Song, C.; Zhang, Y.; Dang, H.; Cheng, X.; Zhang, Q. Global-scale patterns of nutrient density and partitioning in forests in relation to climate. Glob. Change Biol. 2018, 24, 536–551. [Google Scholar] [CrossRef]
  35. Augusto, L.; Boča, A. Tree functional traits, forest biomass, and tree species diversity interact with site properties to drive forest soil carbon. Nat. Commun. 2022, 13, 1097. [Google Scholar] [CrossRef]
  36. Deng, J.; Zhu, W.; Zhou, Y.; Yin, Y. Soil organic carbon chemical functional groups under different revegetation types are coupled with changes in the microbial community composition and the functional genes. Forests 2019, 10, 240. [Google Scholar] [CrossRef]
  37. Li, N.; Sheng, M.; You, M.; Han, X. Advancement in research on application of 13C NMR techniques to exploration of chemical structure of soil organic matter. Acta Pedol. Sin. 2019, 56, 796–812. (In Chinese) [Google Scholar]
  38. Ragauskas, A.J.; Beckham, G.T.; Biddy, M.J.; Chandra, R.; Chen, F.; Davis, M.F.; Davison, B.H.; Dixon, R.A.; Gilna, P.; Keller, M.; et al. Lignin valorization: Improving lignin processing in the biorefinery. Science 2014, 344, 1246843. [Google Scholar] [CrossRef]
  39. Liu, J.; Yang, L.; Wang, J.; Zhang, L.; Qian, Y.; Wei, R.; Cui, W.; Zhou, C. Microbial-mediated shifts regulate the trade-off between soil organic carbon content and stability after cropland afforestation in Eastern China. Appl. Soil Ecol. 2026, 219, 106808. [Google Scholar] [CrossRef]
  40. Fan, W.; Wu, J. Changes in soil fungal community on SOC and POM accumulation under different straw return modes in dryland farming. Ecosyst. Health Sustain. 2021, 7, 1935326. [Google Scholar] [CrossRef]
  41. Kubar, K.A.; Huang, L.; Xue, B.; Li, X.; Lu, J. Straw management stabilizes the chemical composition of soil organic carbon (SOC): The relationship with aggregate-associated C in a rice-rape cropping system. Land Degrad. Dev. 2021, 32, 851–866. [Google Scholar] [CrossRef]
  42. Wang, H.; Ding, Y.; Zhang, Y.; Wang, J.; Freedman, Z.B.; Liu, P.; Cong, W.; Wang, J.; Zang, R.; Liu, S. Evenness of soil organic carbon chemical components changes with tree species richness, composition and functional diversity across forests in China. Glob. Change Biol. 2023, 29, 2852–2864. [Google Scholar] [CrossRef] [PubMed]
  43. Stevenson, B.A.; Sarmah, A.K.; Smernik, R.; Hunter, D.W.F.; Fraser, S. Soil carbon characterization and nutrient ratios across land uses on two contrasting soils: Their relationships to microbial biomass and function. Soil Biol. Biochem. 2016, 97, 50–62. [Google Scholar] [CrossRef]
  44. Yang, Y.; Jia, G.; Yu, X.; Cao, Y. Land use conversion impacts on the stability of soil organic carbon in Qinghai Lake using 13C NMR and C cycle-related enzyme activities. Land Degrad. Dev. 2023, 34, 3606–3617. [Google Scholar] [CrossRef]
  45. Chen, J.S.; Chiu, C.Y. Characterization of soil organic matter in different particle-size fractions in humid subalpine soils by CP/MAS 13C NMR. Geoderma 2003, 117, 129–141. [Google Scholar] [CrossRef]
  46. Li, Y.; Zhang, J.; Chang, S.X.; Jiang, P.; Zhou, G.; Fu, S.; Yan, E.; Wu, J.; Lin, L. Long-term intensive management effects on soil organic carbon pools and chemical composition in Moso bamboo (Phyllostachys pubescens) forests in subtropical China. For. Ecol. Manag. 2013, 303, 121–130. [Google Scholar] [CrossRef]
  47. Wang, H.; Liu, S.; Song, Z.; Yang, Y.; Wang, J.; You, Y.; Zhang, X.; Shi, Z.; Nong, Y.; Ming, A.; et al. Introducing nitrogen-fixing tree species and mixing with Pinus massoniana alters and evenly distributes various chemical compositions of soil organic carbon in a planted forest in southern China. For. Ecol. Manag. 2019, 449, 117477. [Google Scholar] [CrossRef]
  48. Zang, H.; Mehmood, I.; Kuzyakov, Y.; Jia, R.; Gui, H.; Blagodatskaya, E.; Xu, X.; Smith, P.; Chen, H.; Zeng, Z.; et al. Not all soil carbon is created equal: Labile and stable pools under nitrogen input. Glob. Change Biol. 2024, 30, e17405. [Google Scholar] [CrossRef]
  49. Zhang, X.; Jia, S.; You, C.; Xu, H.; Yuan, Y.; Li, J.; Liu, S.; Tan, B.; Xu, Z.; Sardans, J.; et al. Nitrogen-induced soil acidification mitigates the negative effects of nitrogen addition on SOC stability. Soil Tillage Res. 2025, 254, 106752. [Google Scholar] [CrossRef]
Figure 1. Soil available nutrients in 0–20 cm and 20–40 cm soil layers across different land use types in the subtropical coastal region. (a) Ammonium nitrogen (AN), (b) nitrate nitrogen (NN), (c) available phosphorus (AP), and (d) available potassium (AK). Different lowercase letters indicate significant differences among different land use types within the same soil layer (p < 0.05). W, wheat–maize rotation cropland; G, pure Ginkgo biloba plantation; M, pure Metasequoia glyptostroboides plantation; GW, ginkgo–wheat agroforestry system; and GM, ginkgo–metasequoia mixed plantation.
Forests 17 00222 g001
Figure 2. Stoichiometric characteristics of soil elements across different land use types. (a) C:N ratio, (b) N:P ratio, (c) C:P ratio, and (d) C:K ratio. Different lowercase letters indicate significant differences among different land use types within the same soil layer (p < 0.05). The stoichiometric ratios of C and nutrients were calculated by the mass ratios.
Forests 17 00222 g002
Figure 3. Activities of carbon-hydrolyzing enzymes across different land use types. (a) Invertase activity (IA) and (b) cellulase activity (CA). Different lowercase letters indicate significant differences among different land use types within the same soil layer (p < 0.05).
Forests 17 00222 g003
Figure 4. Relative chemical composition index of SOM in different land use types. (a) Aliphaticity/Aromaticity; (b) Hydrophobicity/Aromaticity. Aromaticity, A/AO, Alkyl C/O-alkyl C; Aliphaticity, AL/AR, (Alkyl C + O-alkyl C)/Aromatic C; Hydrophobicity, AR/AOC, (Alkyl C+ Aromatic C)/(O-alkyl C+ Carbonyl C). The number 1 following the abbreviation of land use type represents the 0–20 cm soil layer, and 2 represents the 20–40 cm soil layer.
Forests 17 00222 g004
Figure 5. Pearson correlation of soil chemical composition and indices with selected environmental variables. Orange and green colors represent positive and negative relationships, respectively. * indicates significance at p < 0.05 and ** at p < 0.01. The circles represent the absolute values of the correlation values, the larger the circle, the greater the absolute value.
Forests 17 00222 g005
Figure 6. Redundancy analysis (RDA) showing the relationships of soil selected environmental variables (arrows) and the molecular composition of SOM functional groups (dots). Each point represents a unique land-use and soil layer combination (n = 10). The position of each point is determined by the integrated profile of eight SOM functional groups (as quantified by 13C NMR) from that specific sample. The first two axes explain 96.37% of the total variance (RDA1 = 68.88%, RDA2 = 27.49%). The permutation test indicated the model was highly significant (p < 0.001).
Forests 17 00222 g006
Table 1. The assignment of SOM functional groups at different chemical shift regions and their relative proportion in different land use types.
Soil LayerLand Use TypeSOC Content/g·kg−1Alkyl CO-alkyl CAromatic CCarbonyl C
Proportion/%
0–20 cmG5.06 ± 0.87 c5.90 ± 0.70 c22.75 ± 0.40 b35.04 ± 2.60 b36.31 ± 2.50 a
W2.90 ± 0.81 c9.82 ± 1.10 b15.58 ± 0.70 c51.08 ± 5.30 a19.8 ± 0.60 b
M9.53 ± 2.13 ab9.89 ± 1.20 b13.32 ± 3.30 c33.01 ± 0.60 b32.91 ± 1.70 a
GW12.07 ± 0.65 a17.4 ± 0.70 a42.65 ± 2.10 a28.84 ± 3.30 b11.11 ± 0.50 c
GM8.47 ± 0.86 b5.55 ± 1.50 c21.24 ± 1.70 b31.34 ± 4.10 b36.16 ± 2.60 a
20–40 cmG2.60 ± 0.87 a6.06 ± 2.60 b20.94 ± 1.90 b40.05 ± 2.70 ab32.95 ± 0.50 a
W3.65 ± 0.80 a15.69 ± 0.40 a36.08 ± 0.40 a37.23 ± 4.50 ab11.01 ± 3.60 c
M3.30 ± 0.54 a9.38 ± 0.70 b22.25 ± 2.50 b49.25 ± 0.20 a16.19 ± 1.70 c
GW4.15 ± 3.05 a11.74 ± 1.40 b37.95 ± 4.70 a31.94 ± 0.90 b11.08 ± 5.20 c
GM2.15 ± 0.23 a8.42 ± 2.40 b23.17 ± 0.20 b43.14 ± 3.90 ab23.16 ± 0.50 b
Note: Different lowercase letters indicate significant differences among different land use types within the same soil layer (p < 0.05).
Table 2. Effect of different land use types on soil carbon pool management index.
Soil DepthSystemNon-Labile C/g·kg−1Lability, LLability Index, LICarbon Pool Index, CPICarbon Pool Management Index, CMI
0–20 cmG3.08 ± 0.54 c0.65 ± 0.23 a0.24 ± 0.09 a1.75 ± 0.30 c42.74 ± 17.66 a
M6.90 ± 2.04 ab0.40 ± 0.10 a0.15 ± 0.04 a3.29 ± 0.74 b46.91 ± 5.82 a
GW8.40 ± 0.68 a0.44 ± 0.05 a0.16 ± 0.02 a4.17 ± 0.22 a67.17 ± 5.15 a
GM5.72 ± 0.72 b0.38 ± 0.17 a0.55 ± 0.25 a1.14 ± 0.83 b53.97 ± 26.02 a
20–40 cmG1.40 ± 0.74 a1.04 ± 0.56 a1.53 ± 0.83 a0.71 ± 0.24 a98.34 ± 27.31 a
M1.99 ± 0.45 a0.68 ± 0.14 a1.00 ± 0.21 a0.90 ± 0.15 a88.81 ± 14.3 a
GW3.17 ± 2.66 a0.49 ± 0.08 a0.18 ± 0.03 a2.93 ± 0.3 a52.22 ± 8.39 a
GM1.42 ± 0.28 a0.56 ± 0.37 a0.82 ± 0.55 a0.59 ± 0.06 a49.62 ± 37.34 a
Note: Different lowercase letters indicate significant differences among different land use types within the same soil layer (p < 0.05).
Disclaimer/Publisher’s Note: The statements, opinions and data contained in all publications are solely those of the individual author(s) and contributor(s) and not of MDPI and/or the editor(s). MDPI and/or the editor(s) disclaim responsibility for any injury to people or property resulting from any ideas, methods, instructions or products referred to in the content.