Article

Optimization of Polyethylene Glycol Impregnation in Two Stages for Artificially Aged Waterlogged Wood and Performance Evaluation of the Treated Wood After Freeze Drying

by
Meng Ning
1,
Jing Qin
1,
Hongjie Luo
2 and
Jianfeng Zhu
1,3,*
1
School of Material Science and Engineering, School of Conservation Science & Technology for Cultural Heritage, Shaanxi University of Science and Technology, Xi’an 710021, China
2
Research Institute of Cultural Relics, Shanghai University, Shanghai 200444, China
3
Key Laboratory of Materials and Technology for Unearthed Cultural Heritage Conservation, Ministry of Education, Xi’an 710021, China
*
Author to whom correspondence should be addressed.
Forests 2026, 17(10), 1200; https://doi.org/10.3390/f17101200
Submission received: 8 September 2026 / Revised: 28 September 2026 / Accepted: 5 October 2026 / Published: 8 October 2026
(This article belongs to the Section Wood Science and Forest Products)

Abstract

Considering differences in the penetration and retention of polyethylene glycol with different molecular weights in waterlogged wood structures at different scales, artificially aged waterlogged wood served as the model material. A Box–Behnken response surface design was employed, using low-molecular-weight PEG with molecular weights of 400–800 and solution mass fractions of 29–41 wt.% and high-molecular-weight PEG with molecular weights of 4000–8000 and solution mass fractions of 28–44 wt.% as the independent variables, with volume shrinkage after freeze drying as the response variable for optimization. The quadratic model showed good fit and predictive reliability, with significant interactions between molecular weight and solution mass fraction in both ranges. The optimal two-stage treatment was 35.7 wt.% polyethylene glycol 600 followed by 37.5 wt.% polyethylene glycol 6000, with predicted and experimental volume shrinkage values of 2.34% and 2.43%, respectively. Polyethylene glycol 600 was distributed mainly in the cell wall regions, whereas polyethylene glycol 6000 was distributed in both the cell wall and some cell lumen regions, with relatively pronounced enrichment in some lumina; after two-stage treatment, polyethylene glycol exhibited a more uniform spatial distribution within the wood cellular structure. The optimized treatment achieved an anti-shrink efficiency of 82.91% relative to the water control group, a moisture uptake of 14.3% after 230 h at 85% relative humidity, and a bending strength of 12.97 MPa, 67.79% higher than the water control. Overall, the treatment improved dimensional stability after freeze drying while maintaining favorable moisture stability and relative bending performance.

1. Introduction

Wooden cultural heritage constitutes an important component of human cultural heritage. Compared with stone, metal, and ceramic artifacts, wood is an organic porous material and is therefore more susceptible to environmental influences [1,2]. In wooden artifacts exposed to submerged or high-humidity environments for prolonged periods, the cell lumina, cell walls, and fine pores gradually become saturated with water, resulting in a typical waterlogged state; such materials are commonly referred to as waterlogged archeological wood [3]. After excavation, the ineffective treatment of waterlogged archeological wood can lead to moisture loss and the destabilization of the cell walls and pore structure, resulting in shrinkage, collapse, cracking, and deformation, which can severely compromise its structural integrity and conservation value [4]. Therefore, consolidants need to be introduced before dehydration to support the degraded structure and preserve its original form [5]. Accordingly, various consolidation systems have been developed for waterlogged wood.
Braovac and Kutzke [6] reported that alum salts can maintain the dimensional stability of waterlogged archeological wood through crystallization within the wood structure; however, they may create an acidic environment, promote the hydrolysis of polysaccharide components, and increase the risk of long-term degradation. Broda et al. [7] found that organosilane systems can improve the dimensional stability of wood through the formation of siloxane networks, although potentially harmful substances may be released during hydrolysis and condensation. Sugars and sugar alcohols can also reduce drying shrinkage and hygroscopic swelling, but problems such as surface tackiness, migration and precipitation, or poorly controlled crystallization may occur, thereby affecting the appearance and structural stability of the wood [8].
In contrast, polyethylene glycol (PEG) can penetrate the cell walls, cell lumina, and pores of wood through physical impregnation and provide structural support through its retention and filling within the wood. The treatment process is also relatively simple [9,10]. In addition, PEG is relatively mild and is unlikely to create strongly acidic or alkaline conditions [11]. Its molecular weight and solution concentration can be adjusted over a wide range, allowing flexible selection according to the degradation state of the wood and specific treatment requirements [12,13].
After PEG impregnation, the wood still requires further dehydration and shape stabilization. Compared with conventional drying, freeze drying removes internal water through freezing and sublimation, thereby reducing the capillary forces generated during the evaporation of liquid water and lowering the risks of drying shrinkage and structural collapse [14,15]. Volume shrinkage (Sv) after freeze drying directly characterizes the overall dimensional change in the wood, thereby reflecting the shape-stabilizing effect of different PEG treatment parameters and providing a basis for dimensional stability during subsequent preservation. However, the effectiveness of shape stabilization is still influenced by the penetration, distribution, and supporting state of PEG within the wood. Therefore, appropriate control of PEG parameters before freeze drying is essential.
For determining PEG treatment parameters before freeze drying, Cook and Grattan [16] proposed a method that uses the selected PEG molecular weight and the normal density of undegraded wood of the same species as reference values. By comparing the actual density of waterlogged wood with the normal density of undegraded wood of the same species, the method evaluates the degree of degradation based on the extent of density reduction and subsequently determines the PEG solution concentration required before freeze drying. However, for samples of similar wood species and density but with different internal degradation levels or structural conditions, this method may yield similar PEG solution concentrations. In addition, the method is mainly intended to estimate the treatment solution concentration and is therefore not well suited to evaluating how different combinations of PEG molecular weight and concentration affect dimensional stability after freeze drying. Therefore, it remains necessary to experimentally determine the optimal PEG treatment parameters.
In experimental studies, previous work has investigated the use of single-molecular-weight PEG for the consolidation of waterlogged wood. For example, Liu et al. [17] impregnated waterlogged archeological wood from the Huaguangjiao No. 1 shipwreck with PEG4000 and found that PEG4000 could penetrate structures such as the cell lumina and adhere to the surfaces of the cell walls, thereby reducing volume shrinkage during freeze drying and improving the dimensional stability of the waterlogged wood.
However, waterlogged archeological wood contains pore and cavity structures spanning markedly different scales, including fine pores within the cell walls and larger cell lumina [18]. The ability of PEG with different molecular weights to enter these structures varies [19]. In addition, differences in the state of preservation and degree of degradation among waterlogged archeological wood further increase the complexity of PEG treatment [20]. Therefore, a single-molecular-weight PEG is difficult to meet the treatment requirements of such complex wood structures, whereas the combined use of low- and high-molecular-weight PEG may provide complementary effects. For example, Stelzner et al. [15] treated waterlogged archeological wood with PEG400 and PEG4000 using impregnation in two stages. After treatment, the anti-shrink efficiency (ASE) exceeded 90% for most specimens, and internal cracking was relatively limited, indicating that impregnation with low- and high-molecular-weight PEG in two stages can improve the dimensional stability of waterlogged wood after freeze drying.
In addition, the effectiveness of impregnation with low- and high-molecular-weight PEG in two stages combined with freeze drying still depends on the molecular weights of the two types of PEG and their solution concentrations. When the solution concentration is too low, the structural support provided by PEG within the wood is limited, and shrinkage and collapse may still occur during freeze drying [21]. Excessive retention of high-molecular-weight PEG may also cause appearance problems, such as surface residues, darkening, or a resinous surface appearance [22]. When the proportion of low-molecular-weight PEG is relatively high, the treated wood may absorb more moisture from the environment, resulting in increased moisture content and reduced dimensional stability [22]. For example, Babiński [23] used a combination of PEG300 and PEG4000 as a pretreatment for waterlogged archeological pine prior to freeze drying and found that different combinations of solution concentrations affected the moisture content and dimensional stability of the treated wood. These findings indicate that impregnation with PEG in two stages requires not only an appropriate combination of low- and high-molecular-weight PEG, but also optimization of their respective solution concentrations.
Overall, existing studies have mainly relied on empirical estimation, single-factor screening, or comparisons of different solution concentration combinations with the molecular weights of the low- and high-molecular-weight PEG fixed. In a PEG treatment system involving two stages, the molecular weights and solution concentrations of the low- and high-molecular-weight PEG do not act independently; rather, they jointly influence the distribution and supporting state of PEG within the wood, thereby affecting dimensional stability and the effectiveness of dehydration and shape stabilization after freeze drying. Therefore, a multifactor experimental design is needed to systematically evaluate the effects of different treatment parameters and their interactions on the performance of PEG impregnation in two stages.
Based on the above background, this study used artificially aged waterlogged wood as a model material and applied response surface methodology (RSM), with the molecular weights and solution concentrations of low- and high-molecular-weight PEG as the influencing factors and Sv after freeze drying as the response variable. A quantitative relationship between the PEG impregnation parameters in two stages and volume shrinkage was established, and the optimal parameter combination was identified with the objective of minimizing Sv. On this basis, the overall performance of the optimized treatment was further evaluated in terms of PEG distribution, dimensional stability, color, weight percentage gain (WPG), microstructure, moisture stability, and relative bending performance. The results are expected to provide a basis for the optimization and evaluation of PEG impregnation parameters in two stages prior to freeze drying of severely degraded waterlogged wood.

2. Materials and Methods

2.1. Materials

Commercial Mongolian Scots pine (Pinus sylvestris var. mongolica) wood imported from Russia was used as the raw material. PEG of different molecular weights, including PEG400, PEG600, PEG800, PEG4000, PEG6000, and PEG8000, was purchased from Shanghai Macklin Biochemical Co., Ltd., Shanghai, China. Sodium hydroxide (NaOH) was purchased from Tianjin Damao Chemical Reagent Factory, Tianjin, China. All chemical reagents were of analytical grade and were used as received without further purification.

2.2. Experimental Methods

2.2.1. Preparation of Artificially Aged Waterlogged Wood Specimens

The preparation procedure for the artificially aged waterlogged wood specimens is shown in Figure 1. First, Mongolian Scots pine sapwood free of visible defects, such as knots, cracks, mold, insect damage, and decay, was selected and cut into rectangular specimens measuring 30 mm × 15 mm × 10 mm along the longitudinal, radial, and tangential directions (L × R × T), respectively. To standardize the initial moisture condition of the specimens, they were placed in a forced-air drying oven (101-1DB, Taisite Instrument Co., Ltd., Tianjin, China) and predried at 50 °C for 48 h. After predrying, the initial moisture content of the specimens was 7.28 ± 0.12%.
Subsequently, the predried specimens were placed in polytetrafluoroethylene (PTFE) liners, and a 3 wt.% NaOH aqueous solution was added until the specimens were completely immersed. After the PTFE liners were sealed, they were placed in high-pressure reactors and subjected to hydrothermal treatment in a forced-air drying oven preheated to 180 °C for 10 h. After treatment, the reactors were allowed to cool naturally to room temperature before the specimens were removed.
To remove residual NaOH, the specimens were transferred to deionized water and soaked for 7 d, with the water replaced daily. The pH of the soaking solution was monitored using a pH meter (PHS-3C, Shanghai INESA Scientific Instrument Co., Ltd., Shanghai, China). Before measurement, the pH meter was calibrated using standard buffer solutions of pH 6.86 and 9.18, and the pH was recorded after the reading had stabilized. When the pH of the final soaking solution approached 7.0, the soluble alkaline residues in the specimens were considered to have been largely removed. The specimens were then stored in deionized water to maintain a fully waterlogged state and were used as artificially aged waterlogged wood in subsequent experiments.

2.2.2. Response Surface Methodology and Box–Behnken Design

To establish a quantitative relationship between PEG impregnation parameters in two stages and volume shrinkage after freeze drying, and to identify the optimal parameter combination for reducing volume shrinkage, a Box–Behnken response surface design was performed using Design-Expert software (Version 13, Stat-Ease, Inc., Minneapolis, MN, USA). The molecular weight of low-molecular-weight PEG (A), the molecular weight of high-molecular-weight PEG (B), the solution concentration of low-molecular-weight PEG (C), and the solution concentration of high-molecular-weight PEG (D) were selected as the independent variables, while the volume shrinkage (Sv) of the specimens after freeze drying was used as the response variable. Based on preliminary experiments, low, center, and high levels were selected for each factor, corresponding to coded values of −1, 0, and +1, respectively. A total of 28 experimental runs were designed, and the factors and their coded levels are presented in Table 1. A quadratic regression model was established based on the experimental results, and the reliability of the model was evaluated through analysis of variance and model evaluation. Response surface plots were further generated to predict the parameter combination corresponding to the minimum Sv, and the optimization result was subsequently verified experimentally.

2.2.3. PEG Impregnation and Freeze-Drying Treatment

According to the Box–Behnken experimental design matrix generated using Design-Expert software, aqueous solutions of low- and high-molecular-weight PEG corresponding to each experimental group were prepared separately. The PEG of the specified molecular weight was added to deionized water and stirred at 40 °C and 500 rpm until completely dissolved to obtain PEG impregnation solutions of the required concentrations. The artificially aged waterlogged wood specimens were then removed from storage, and free water on the specimen surfaces was gently blotted with lint-free paper before the specimens were placed in 100 mL centrifuge tubes. A total of 60 mL of the low-molecular-weight PEG impregnation solution was added to completely immerse each specimen, and the first impregnation stage was conducted at 40 °C for 5 d. After the first stage, the specimens were removed, excess solution on the surfaces was gently wiped off, and the specimens were transferred to the corresponding high-molecular-weight PEG impregnation solution for the second impregnation stage under the same conditions for 5 d. During impregnation, the PEG solution was replaced every 24 h with fresh solution of the same concentration to maintain a relatively stable impregnation solution concentration.
To compare the effects of single-molecular-weight PEG treatment with those of the optimized PEG treatment in two stages, additional comparative specimens were prepared after completion of the response surface optimization using the optimal parameter combination obtained. For the low-molecular-weight PEG single-stage treatment group, only the low-molecular-weight PEG impregnation solution corresponding to the first stage of the optimal parameter combination was used, and the specimens were continuously impregnated at 40 °C for 10 d. For the high-molecular-weight PEG single-stage treatment group, only the high-molecular-weight PEG impregnation solution corresponding to the second stage of the optimal parameter combination was used, and the specimens were continuously impregnated at 40 °C for 10 d. For the optimized treatment group in two stages, the low- and high-molecular-weight PEG impregnation solutions from the optimal parameter combination were applied sequentially in the first and second stages, respectively, with each stage conducted at 40 °C for 5 d, giving a total impregnation time of 10 d. In addition, for the water control group, deionized water was used instead of the PEG impregnation solution in both the first and second stages, with each stage conducted at 40 °C for 5 d and a total treatment time of 10 d. All comparative specimens were placed in 100 mL centrifuge tubes, and 60 mL of the corresponding treatment solution was added to completely immerse each specimen. During treatment, the treatment solution was replaced with fresh solution every 24 h, and three replicate specimens were prepared for each treatment group.
After PEG impregnation or water control treatment, the specimens were removed, and the residual solution on their surfaces was wiped off. The specimens were then prefrozen at −15 °C for 48 h and subsequently placed in a vacuum freeze dryer (SCIENTZ-10N, Ningbo Scientz Biotechnology Co., Ltd., Ningbo, China). Freeze drying was performed for 24 h at a cold trap temperature of −55 °C and a vacuum pressure of 5 Pa.

2.3. Characterization and Evaluation Methods

2.3.1. Characterization of the Degradation State of Artificially Aged Waterlogged Wood

To characterize the basic degradation state of the artificially aged waterlogged wood before PEG impregnation, the maximum water content, basic density, and chemical composition of unaged wood and artificially aged waterlogged wood were determined. Three replicate specimens were used for each measurement.
  • Determination of Maximum Water Content
The maximum water content was determined in accordance with the Chinese national standard GB/T 1927.4-2021 [24]. Before measurement, the unaged wood specimens were immersed in deionized water until their mass in the waterlogged state became constant, whereas the artificially aged waterlogged wood specimens were measured directly in the waterlogged state. After free water on the specimen surfaces was gently blotted with lint-free paper, the specimens were weighed, and the mass in the waterlogged state was recorded as M1. The specimens were then dried at 103 ± 2 °C to constant mass, and the dry mass was recorded as M0. The maximum water content (MWC) was calculated according to Equation (1):
MWC = M 1 − M 0 M 0 × 100 %
where MWC (%) is the maximum water content; M1 and M0 are the mass of the specimen in the waterlogged state and the mass after drying to constant mass, respectively, both in g.
2.
Determination of Basic Density
Basic density was determined in accordance with the Chinese national standard GB/T 1927.5-2021 [25]. Before measurement, the unaged wood specimens were immersed in deionized water until their mass in the waterlogged state became constant, whereas the artificially aged waterlogged wood specimens were measured directly in the waterlogged state. The longitudinal, radial, and tangential dimensions of each specimen in the waterlogged state were measured using a vernier caliper, and the corresponding volume was calculated and recorded as Vsat. The specimens were then dried at 103 ± 2 °C to constant mass, and the dry mass was recorded as M0. Basic density (BD) was calculated according to Equation (2):
BD = M 0 V sat
where BD is the basic density, in g/cm3; M0 is the mass of the specimen after drying to constant mass, in g; and Vsat is the volume of the specimen in the waterlogged state, in cm3.
3.
Determination of Chemical Composition
The hemicellulose, cellulose, and lignin contents of the unaged wood and artificially aged waterlogged wood specimens were determined using the Van Soest sequential extraction method. After drying, the specimens were ground into wood powder and passed through a 40-mesh sieve. Approximately 1 g of wood powder was mixed with 100 mL of neutral detergent solution and maintained at a gentle boil for 60 min under heating. After vacuum filtration, washing, and drying, neutral detergent fiber (NDF) was obtained. NDF consisted mainly of hemicellulose, cellulose, and lignin.
A separate wood powder sample of the same mass was mixed with 100 mL of acid detergent solution and treated under the same conditions to obtain acid detergent fiber (ADF). ADF consisted mainly of cellulose and lignin. Subsequently, ADF was treated with 72% sulfuric acid solution at 20 °C for 3 h to obtain acid detergent lignin (ADL). The hemicellulose, cellulose, and lignin contents were calculated from the mass differences among NDF, ADF, and ADL.

2.3.2. Evaluation of PEG Impregnation and Freeze-Drying Treatment

  • Determination of Weight Percentage Gain
After the corresponding treatment and freeze drying, the mass of each specimen was measured and recorded as W1. The mass of untreated artificially aged waterlogged wood after drying at 103 ± 2 °C to constant mass was recorded as W0. The weight percentage gain (WPG) was calculated according to Equation (3):
WPG = W 1 − W 0 W 0 × 100 %
where WPG (%) is the weight percentage gain; W1 is the mass of the specimen after the corresponding treatment and freeze drying, in g; and W0 is the oven-dry mass of untreated artificially aged waterlogged wood, in g.
2.
Evaluation of Dimensional Stability
Taking the volume of the artificially aged waterlogged wood specimen before PEG impregnation as the reference volume, the volume shrinkage (Sv) was calculated using the specimen volume after PEG impregnation and freeze drying according to Equation (4):
S v = V 0 − V 1 V 0 × 100 %
where Sv (%) is the volume shrinkage; V0 is the volume of the artificially aged waterlogged wood specimen before PEG impregnation, in cm3; and V1 is the volume of the specimen after PEG impregnation and freeze drying, in cm3.
Based on the dimensional changes in the corresponding directions between the artificially aged waterlogged wood specimen before PEG impregnation and the specimen after PEG impregnation and freeze drying, the longitudinal, radial, and tangential shrinkage were calculated according to Equation (5):
S i = D 0 − D 1 D 0 × 100 %
where Si (%) is the shrinkage of the specimen in the corresponding direction; D0 is the dimension of the artificially aged waterlogged wood specimen in the corresponding direction before PEG impregnation, in mm; and D1 is the dimension of the specimen in the corresponding direction after PEG impregnation and freeze drying, in mm. When i is L, R, or T, it represents the longitudinal, radial, or tangential direction, respectively.
Based on the volume shrinkage of the water control group and PEG treatment groups after freeze drying, the anti-shrink efficiency (ASE) was calculated according to Equation (6):
ASE = S c − S t S c × 100 %
where ASE (%) is the anti-shrink efficiency; Sc is the volume shrinkage of the water control group after freeze drying; and St is the volume shrinkage of the PEG treatment group after freeze drying.

2.3.3. Color Measurement

The surface color parameters of specimens from different treatment groups after freeze drying were measured using a colorimeter (NR60CP, Shenzhen Threenh Technology Co., Ltd., Shenzhen, China). Measurements were performed in the CIE Lab* color space using D65 as the standard illuminant, a 10° observer angle, and an 8 mm measurement aperture. In this color space, L* represents lightness, with higher values indicating a lighter color and lower values indicating a darker color; a* represents the red–green chromaticity coordinate, with positive values indicating red and negative values indicating green; and b* represents the yellow–blue chromaticity coordinate, with positive values indicating yellow and negative values indicating blue.
For each specimen, five measurement points were selected on the radial surface, and the L*, a*, and b* values were recorded. Their mean values were used as the color parameters of the specimen. Using the water control group as the reference, the lightness difference ΔL*, red–green difference Δa*, yellow–blue difference Δb*, and total color difference ΔE* of each PEG treatment group were calculated. The total color difference was calculated according to Equation (7):
Δ E * = ( Δ L * ) 2 + ( Δ a * ) 2 + ( Δ b * ) 2
where ΔE* is the total color difference; and ΔL*, Δa*, and Δb* are the differences in L*, a*, and b*, respectively, between the PEG treatment group and the water control group.

2.3.4. Microstructural Observation

The microstructure of the transverse surfaces of the specimens was observed using field emission scanning electron microscopy (FE-SEM, Verios 460, FEI Company, Hillsboro, OR, USA). Before observation, the dried specimens were cut along the transverse direction using a precision cutting machine to obtain relatively flat observation surfaces. The specimens were then mounted on conductive adhesive tape, and the transverse surfaces were gold-coated for 60 s using an ion sputter coater (108 Auto, Cressington Scientific Instruments, Watford, UK). During observation, the accelerating voltage of the FE-SEM was set to 2 kV, with a beam current of approximately 13 pA.
The cell wall thickness of earlywood tracheids was measured using ImageJ software (Version 1.53, National Institutes of Health, Bethesda, MD, USA). Three replicate specimens were prepared for each group, and three nonoverlapping fields of view were randomly selected from the earlywood tracheid region of each specimen. In each field of view, two earlywood tracheids with relatively intact outlines, clearly defined cell wall boundaries, and no obvious damage were selected. Cell corners and regions affected by damage, folding, or local deposits were avoided. Three different positions were selected along the middle portion of relatively straight cell walls in each tracheid, and the shortest distance between the inner and outer cell wall boundaries was measured. A total of 18 measurements were obtained for each replicate specimen, and their mean value was used as the average cell wall thickness of that specimen.
To quantitatively characterize the uniformity of cell wall thickness distribution after different treatments, the cell wall thickness nonuniformity coefficient (Td) was introduced and calculated according to Equation (8):
T d = H 2 − H 1 H 2 × 100 %
where Td (%) is the cell wall thickness nonuniformity coefficient; H1 and H2 are the minimum and maximum cell wall thicknesses measured for each replicate specimen, respectively, both in micrometers. A lower Td value indicates a more uniform distribution of cell wall thickness.

2.3.5. Fourier-Transform Infrared Spectroscopy Analysis

The chemical structure of the specimens was characterized using a Fourier-transform infrared spectrometer (FTIR, VECTOR 22, Bruker Optics GmbH, Ettlingen, Germany). After freeze drying, the specimens were ground and passed through an 80-mesh sieve. An appropriate amount of specimen powder was thoroughly mixed and ground with KBr at a mass ratio of 1:100 and then pressed into pellets for measurement. The spectra were collected over the range of 4000–500 cm−1 at a resolution of 4 cm−1 with 30 scans.

2.3.6. X-Ray Diffraction Analysis

X-ray diffraction (XRD) analysis was performed using an X-ray diffractometer (TD3500, Dandong Tongda Technology Co., Ltd., Dandong, China) to determine the relative crystallinity index of cellulose in the unaged wood and artificially aged waterlogged wood and to analyze the characteristic diffraction peaks of cellulose and PEG crystalline phases in the differently treated specimens. Cu Kα radiation was used, with an operating voltage of 35 kV and a current of 25 mA. The scanning range was 2θ = 10–50°, with a step size of 0.04° and a scanning rate of 5°/min. The relative crystallinity index (CrI) of cellulose was calculated using the Segal method according to Equation (9):
CrI = I 002 − I am I 002 × 100 %
where CrI (%) is the relative crystallinity index of cellulose; I002 is the diffraction peak intensity of the cellulose (002) crystalline plane at approximately 2θ = 22°; and Iam is the scattering intensity of the amorphous region at approximately 2θ = 18.5°.

2.3.7. Confocal Raman Microscopy Imaging Analysis

A confocal Raman imaging microscope (DXR2xi, Thermo Fisher Scientific, Waltham, MA, USA) was used to analyze the spatial distribution of PEG-related Raman signals in specimens from different PEG treatment groups. Before measurement, 20 μm thick sections were cut from the transverse surfaces of the freeze-dried wood specimens using a sliding microtome (SM2400, Leica Microsystems GmbH, Wetzlar, Germany) and mounted on glass slides for analysis. Measurement areas were selected from regions where the earlywood tracheid structure was clearly visible, and the boundaries between the cell walls and cell lumina were well defined.
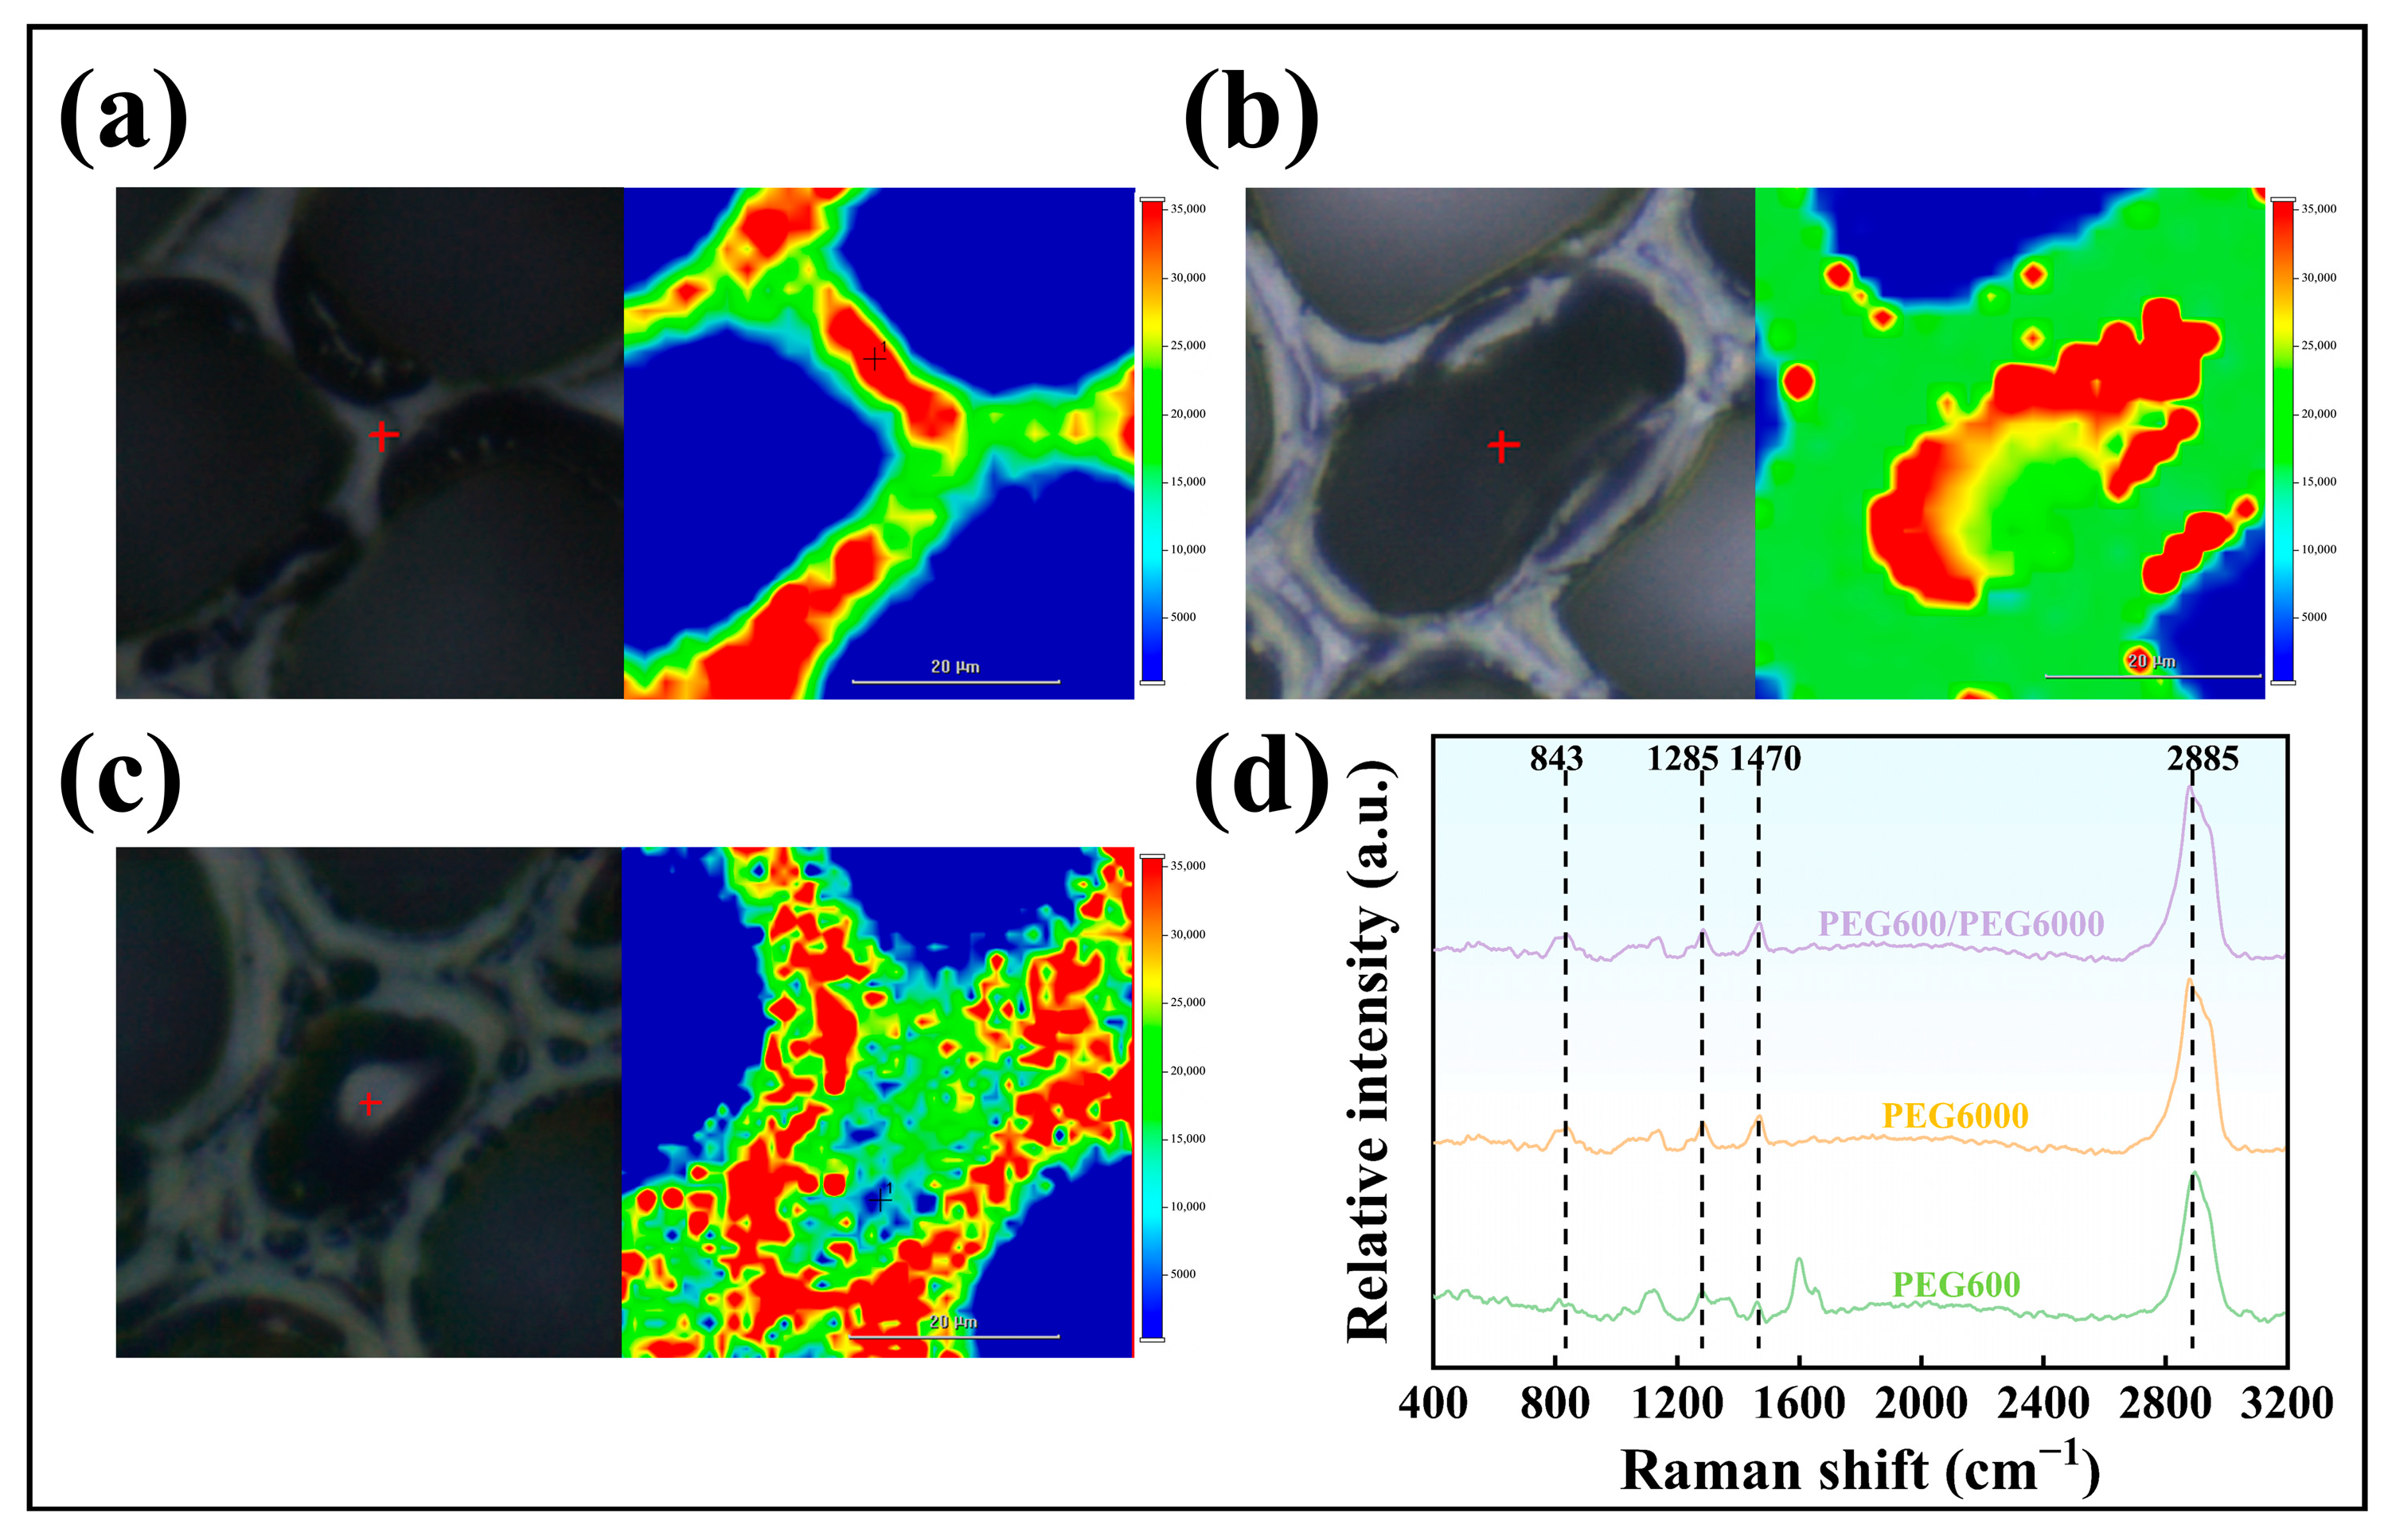
Raman spectral mapping was performed using a 532 nm laser with a laser power of 16 mW and a 50× objective. A 50 μm × 50 μm area was scanned with a step size of 1.0 μm in both the x and y directions. At each acquisition point, spectra were collected over the range of 50–3400 cm−1 with an integration time of 0.1 s and 12 accumulations. After data acquisition, the characteristic PEG peaks at approximately 843, 1285, 1470, and 2885 cm−1 were selected to generate Raman mapping images. The spatial distribution of PEG-related signals was evaluated according to their locations and relative intensities within the observed wood cellular structure.

2.3.8. Determination of Moisture Stability

The moisture stability of specimens from different treatment groups under high-humidity conditions was evaluated using a constant temperature and humidity chamber (CTHI-250B, Shidukai Instrument Equipment Co., Ltd., Shanghai, China), with three replicate specimens prepared for each group. Before testing, the initial mass of each freeze-dried specimen was measured and recorded as m0. The specimens were then placed in an environment maintained at 25 °C and 85% relative humidity (RH) for the moisture uptake test. The specimens were removed and weighed after 2, 4, 8, 12, 24, 48, 96, 110, 134, 158, 182, 206, and 230 h, and the mass of each specimen at time t was recorded as mt. After each weighing, the specimens were immediately returned to the humidity-controlled environment to continue the test. Moisture uptake was calculated according to Equation (10):
W U t = m t − m 0 m 0 × 100 %
where WUt (%) is the moisture uptake of the specimen at time t; m0 is the initial mass of the specimen before moisture uptake, in g; and mt is the mass of the specimen after moisture uptake at time t, in g.

2.3.9. Relative Bending Performance Test

The bending performance of specimens from different treatment groups was measured using a universal testing machine (XWW-20B, Chengde Jinjian Testing Instrument Co., Ltd., Chengde, China), with three replicate specimens prepared for each group. A three-point bending test was conducted with a support span of 26 mm and a loading rate of 2 mm/min. Before testing, the actual width and height of the bending cross-section of each specimen were measured using a vernier caliper. The maximum load sustained by each specimen during testing was recorded. Because the support span was limited by the specimen length, the obtained bending strength values were used primarily to compare the relative bending performance among the different treatment groups. The bending strength was calculated according to Equation (11):
σ b = 3 FL 2 b h 2
where σb is the bending strength, in MPa; F is the maximum load recorded during testing, in N; L is the support span, in mm; and b and h are the actual width and height of the bending cross-section of the specimen, respectively, both in mm. Statistical differences among treatment groups were evaluated using one-way ANOVA, with p < 0.05 considered statistically significant.

3. Results and Discussion

3.1. Characterization of the Degradation State of Artificially Aged Waterlogged Wood

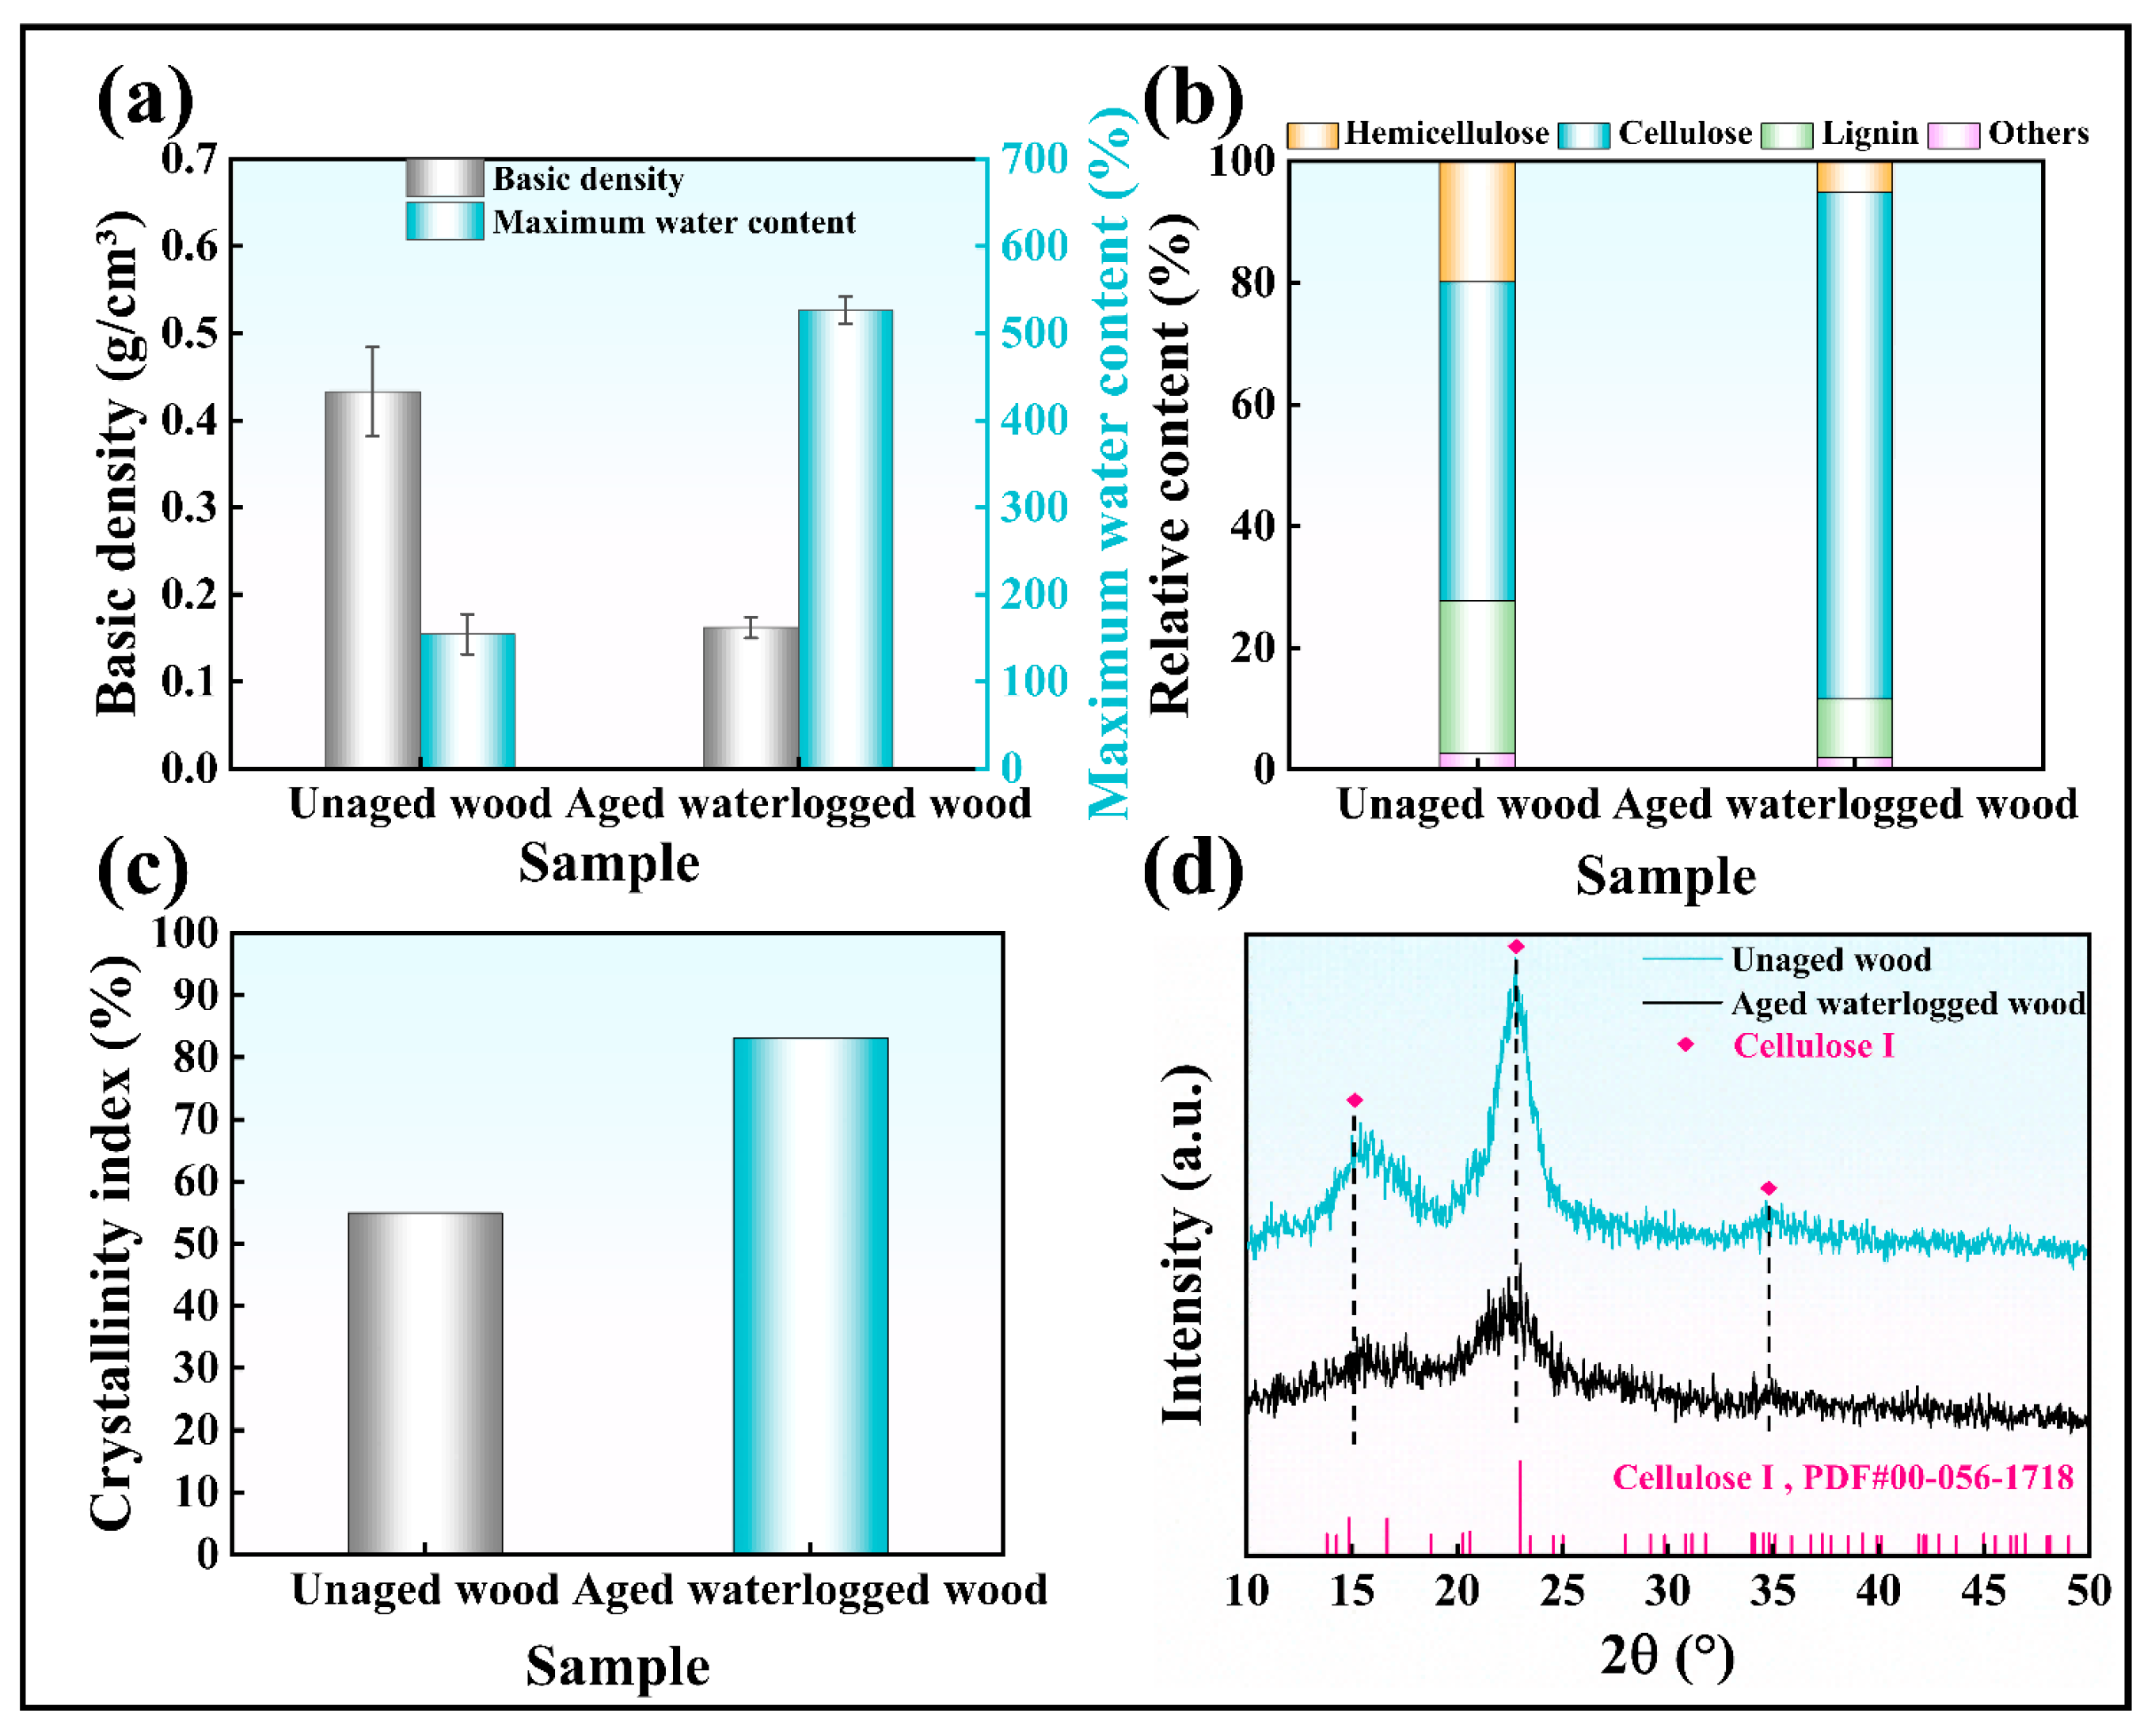
MWC and BD reflect the water-holding capacity of waterlogged wood and the amount of dry matter retained per unit volume, respectively, and are commonly used indicators for evaluating the degree of physical degradation [26]. In general, wood with a maximum water content exceeding 400% can be classified as severely degraded wood [27]. As shown in Figure 2a, after NaOH hydrothermal treatment, the MWC of the wood increased from 154.5 ± 23.1% to 526.3 ± 15.5%, exceeding the threshold for severe degradation. Meanwhile, the BD decreased from 0.433 ± 0.051 g/cm3 to 0.162 ± 0.012 g/cm3, indicating a substantial loss of dry matter per unit volume. Therefore, in terms of physical properties, the wood subjected to NaOH hydrothermal treatment exhibited characteristics of severe degradation.
The wood cell wall is composed mainly of cellulose, hemicellulose, and lignin [28]. Among these components, cellulose is arranged along the longitudinal direction of wood in the form of microfibrils and is an important structural component that contributes to the mechanical strength of wood [29]. Hemicellulose is distributed between cellulose microfibrils and contributes to the bonding and stability of the microfibrils [30]. Cellulose and hemicellulose are collectively referred to as holocellulose and together form the polysaccharide framework of the wood cell wall [31]. Lignin is embedded within the cell wall structure and forms a stable network with cellulose and hemicellulose, thereby enhancing cell wall rigidity [32]. Lignin is also an important component for maintaining stable bonding between adjacent cell walls [33]. Based on these structural roles, the contents of hemicellulose, cellulose, and lignin in the unaged wood and artificially aged waterlogged wood were compared to evaluate the condition of the artificially aged waterlogged wood from the perspective of chemical composition, as shown in Figure 2b.
The hemicellulose content of the unaged wood was 19.84% and decreased to 5.07% after NaOH hydrothermal treatment, indicating substantial loss of hemicellulose during treatment. This may be attributed to the relatively amorphous structure and low chemical stability of hemicellulose, which make it susceptible to hydrolysis under alkaline conditions into low-molecular-weight sugar fragments, such as mannose and glucose, followed by their loss during subsequent soaking. The lignin content decreased from 25.18% in the unaged wood to 9.53% in the artificially aged waterlogged wood, indicating that substantial lignin loss also occurred during NaOH hydrothermal treatment. This may be attributed to disruption of the stable lignin network under high-temperature alkaline conditions. In contrast to the changes in hemicellulose and lignin, the cellulose content increased from 52.36% in the unaged wood to 83.40% in the artificially aged waterlogged wood. This increase was mainly due to the substantial loss of hemicellulose and lignin during NaOH hydrothermal treatment, which increased the relative proportion of cellulose among the remaining wood components. In addition, cellulose has a relatively stable structure and therefore degrades more slowly under alkaline hydrothermal conditions. Overall, the decreases in hemicellulose and lignin contents, together with the increase in the relative proportion of cellulose, indicate, from the perspective of chemical composition, that NaOH hydrothermal treatment caused a certain degree of wood degradation.
NaOH hydrothermal treatment may also cause changes in the relative crystallinity of cellulose in wood. The XRD patterns of the unaged wood and artificially aged waterlogged wood are shown in Figure 2d. All specimens exhibited distinct diffraction peaks at approximately 2θ = 15.2°, 22.6°, and 35.2°, which were assigned to the (101), (002), and (040) crystalline planes, respectively, of monoclinic cellulose Iβ (P21, PDF#00-056-1718) [34,35]. According to the Segal method, the relative crystallinity index of cellulose increased from 54.95% in the unaged wood to 83.09% after NaOH hydrothermal treatment, as shown in Figure 2c. This increase may be attributed to the greater susceptibility of the amorphous regions of cellulose to degradation than the crystalline regions during wood degradation, thereby increasing the relative proportion of crystalline regions in the residual cellulose. Therefore, the increase in the relative crystallinity index of cellulose provides further evidence of degradation in the artificially aged waterlogged wood.
Overall, the results for maximum water content, basic density, chemical composition, and the relative crystallinity index of cellulose indicate that the prepared artificially aged waterlogged wood exhibited clear degradation characteristics and could serve as a severely degraded model material for subsequent PEG impregnation and freeze-drying treatment.

3.2. Response Surface Optimization of PEG Impregnation Parameters in Two Stages

3.2.1. Establishment and Reliability Evaluation of the Regression Model

The Box–Behnken experimental design matrix and the Sv results for each experimental run are presented in Table 2.
Based on the response surface experimental results presented in Table 2, a quadratic regression model describing the relationship between the experimental factors and Sv was established, and the corresponding regression equation is given in Equation (12). To evaluate the significance and fitting performance of the model, analysis of variance and model evaluation were performed, and the results are presented in Table 3.
Sv = 2.35 + 0.0600A − 0.0842B − 0.0742C − 0.1383D + 0.0050AB + 0.2000AC + 0.0200AD
−0.0150BC − 0.1975BD − 0.0175CD + 0.4283A2 + 0.4471B2 + 0.4446C2 + 0.4683D2
In the equation, A, B, C, and D represent the coded values of the low-molecular-weight PEG molecular weight, high-molecular-weight PEG molecular weight, low-molecular-weight PEG solution concentration, and high-molecular-weight PEG solution concentration, respectively.
As shown in Table 3, the p-value of the Sv model was <0.0001, indicating that the model was highly significant. The p-value for lack of fit was 0.4125 (>0.05), indicating that the lack of fit was not significant. The R2 and adjusted R2 values of the model were 0.9876 and 0.9741, respectively, both close to 1, indicating a good model fit. The model could explain 98.76% of the variation in the response. In addition, the C.V. was 1.87% (<10%), and the Adeq Precision was 27.4056 (>4), indicating high model precision and a high signal-to-noise ratio. Therefore, the model was suitable for the analysis and prediction of volume shrinkage. The molecular weight of low-molecular-weight PEG (A), molecular weight of high-molecular-weight PEG (B), low-molecular-weight PEG solution concentration (C), and high-molecular-weight PEG solution concentration (D) all had significant effects on Sv, with the magnitude of their effects following the order D > B > C > A. Among the interaction terms, AC and BD were significant, indicating that the combination of low-molecular-weight PEG molecular weight and its solution concentration, as well as the combination of high-molecular-weight PEG molecular weight and its solution concentration, had significant effects on Sv.
In addition, the p-values of A2, B2, C2, and D2 were all <0.0001, indicating that all quadratic terms were highly significant. This result indicates that the effects of the individual factors on Sv were nonlinear. Therefore, further response surface analysis was necessary to examine the effects of the factors and their interactions on Sv and to identify the optimal parameter combination for PEG impregnation in two stages.
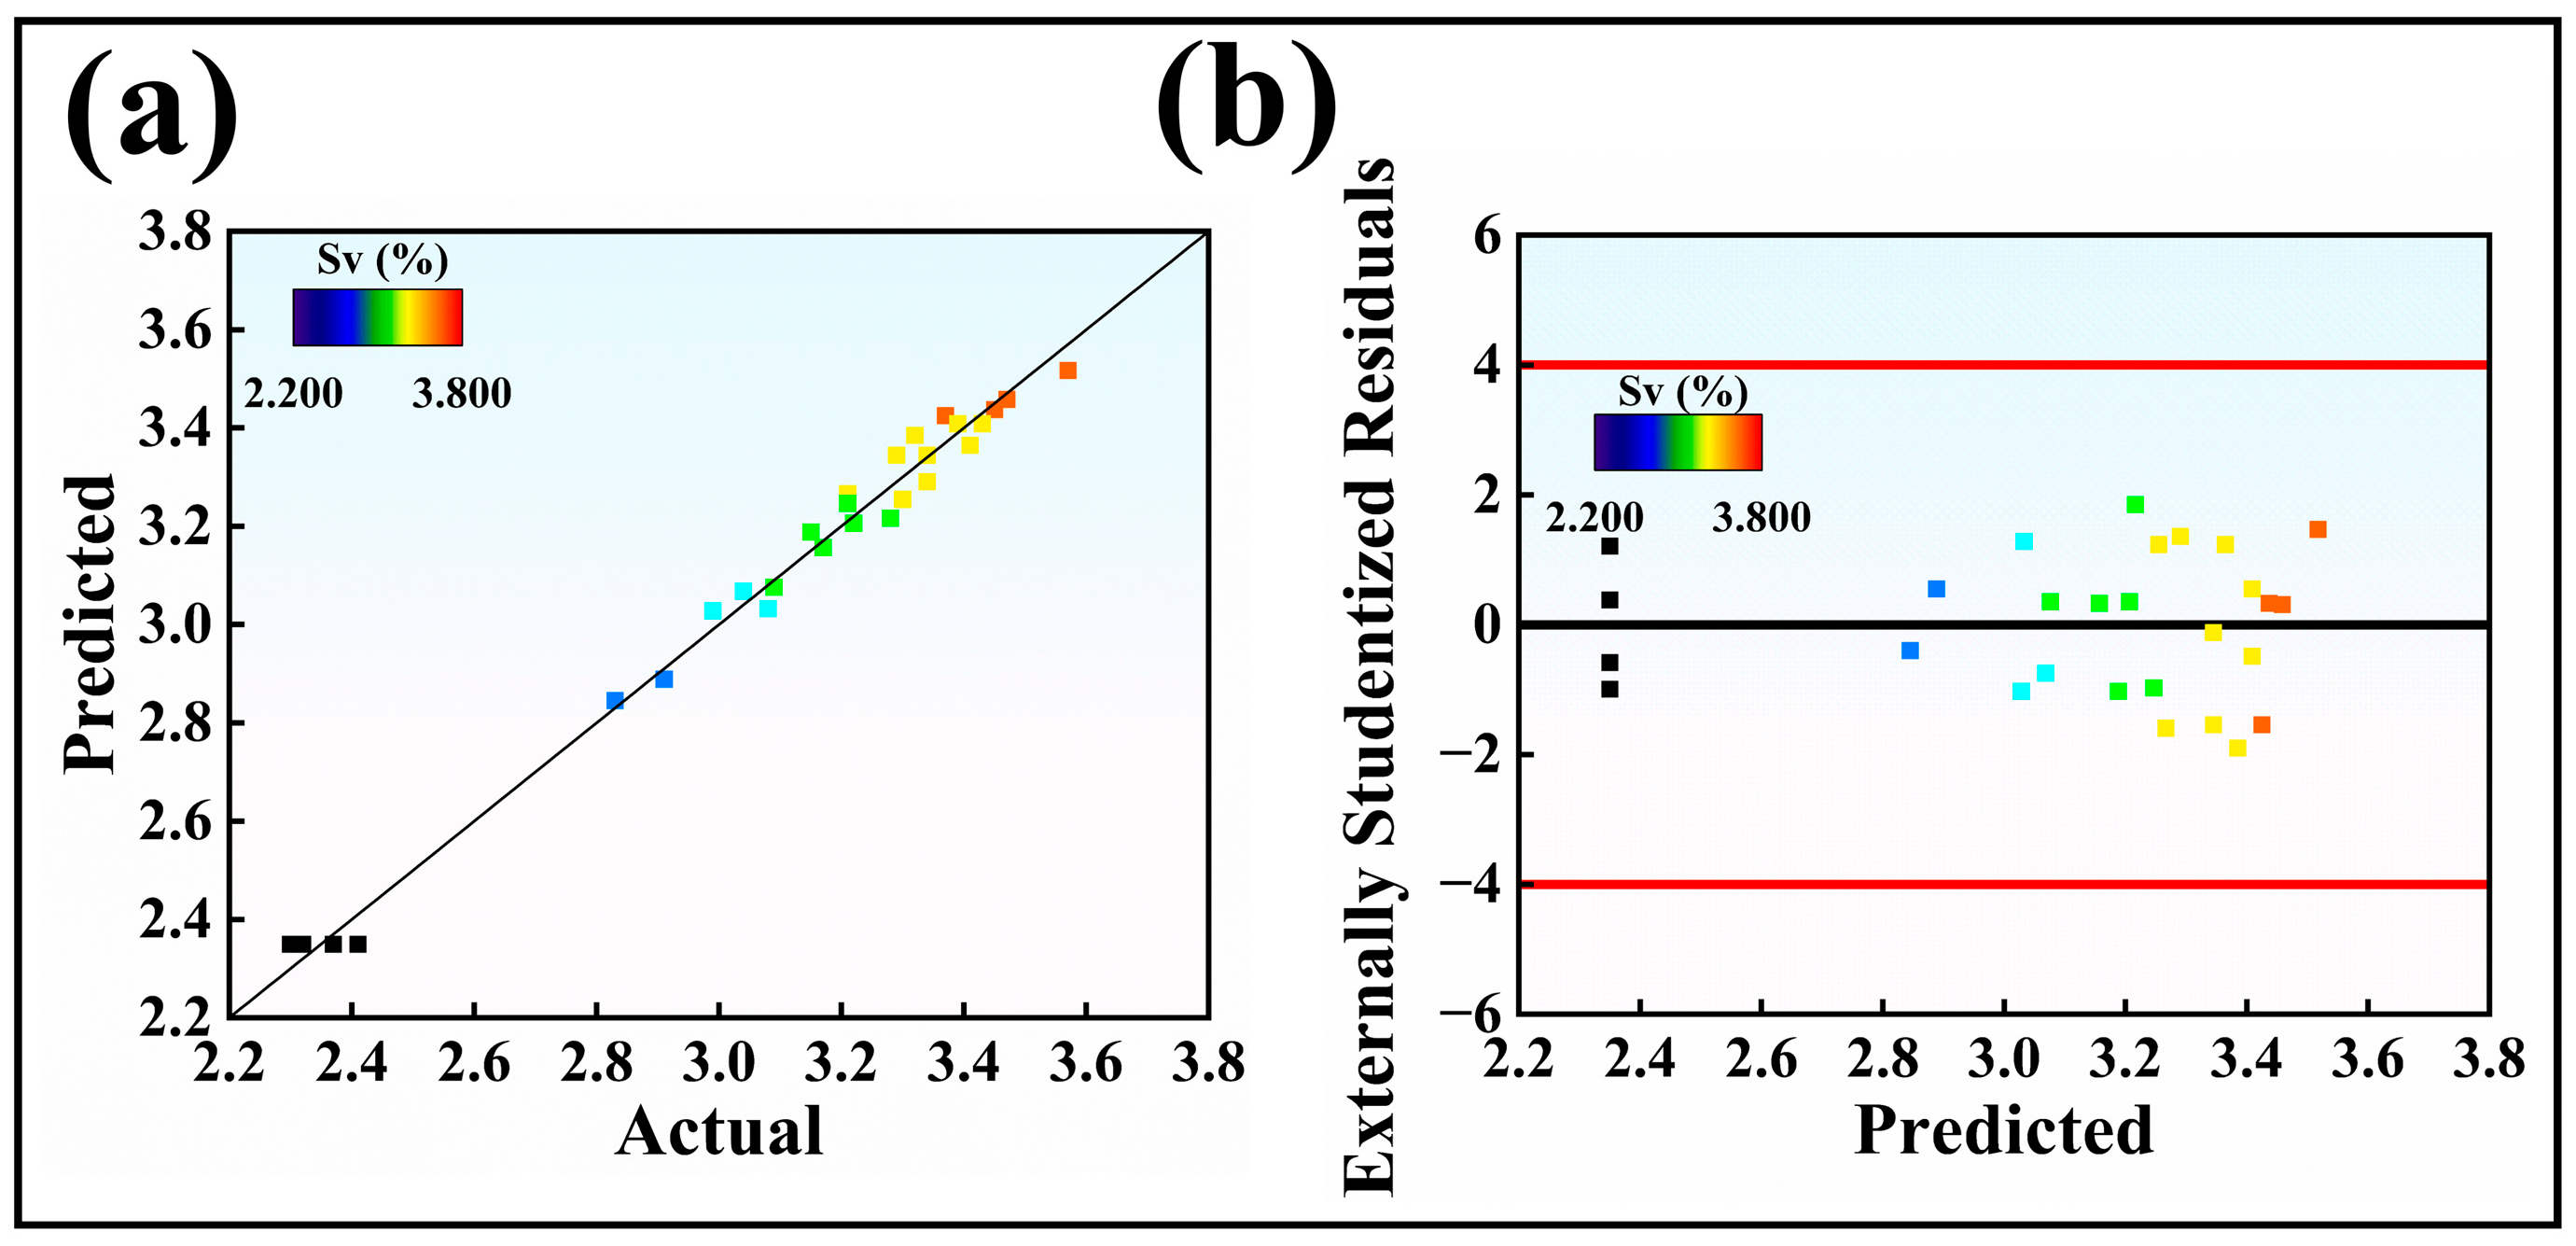
To further evaluate the predictive reliability of the Sv regression model, the model-predicted Sv values were compared with the corresponding experimental values, as shown in Figure 3a. The predicted and experimental values were generally distributed close to the 45° diagonal line. The experimental values ranged from 2.30% to 3.57%, whereas the predicted values ranged from 2.35% to 3.52%, showing close agreement between the model predictions and the experimental results. The residual distribution of the model is shown in Figure 3b. In general, for a well-fitted model, the residuals of most data points should fall within ±2 SD [36]. In the present model, all residuals were within ±2 SD, with no obvious outliers. Taken together, the agreement between the predicted and experimental values and the residual distribution indicate that the model has good fitting performance and predictive reliability and is suitable for subsequent response surface analysis and parameter optimization.

3.2.2. Response Surface Analysis and Determination and Validation of the Optimal Parameter Combination

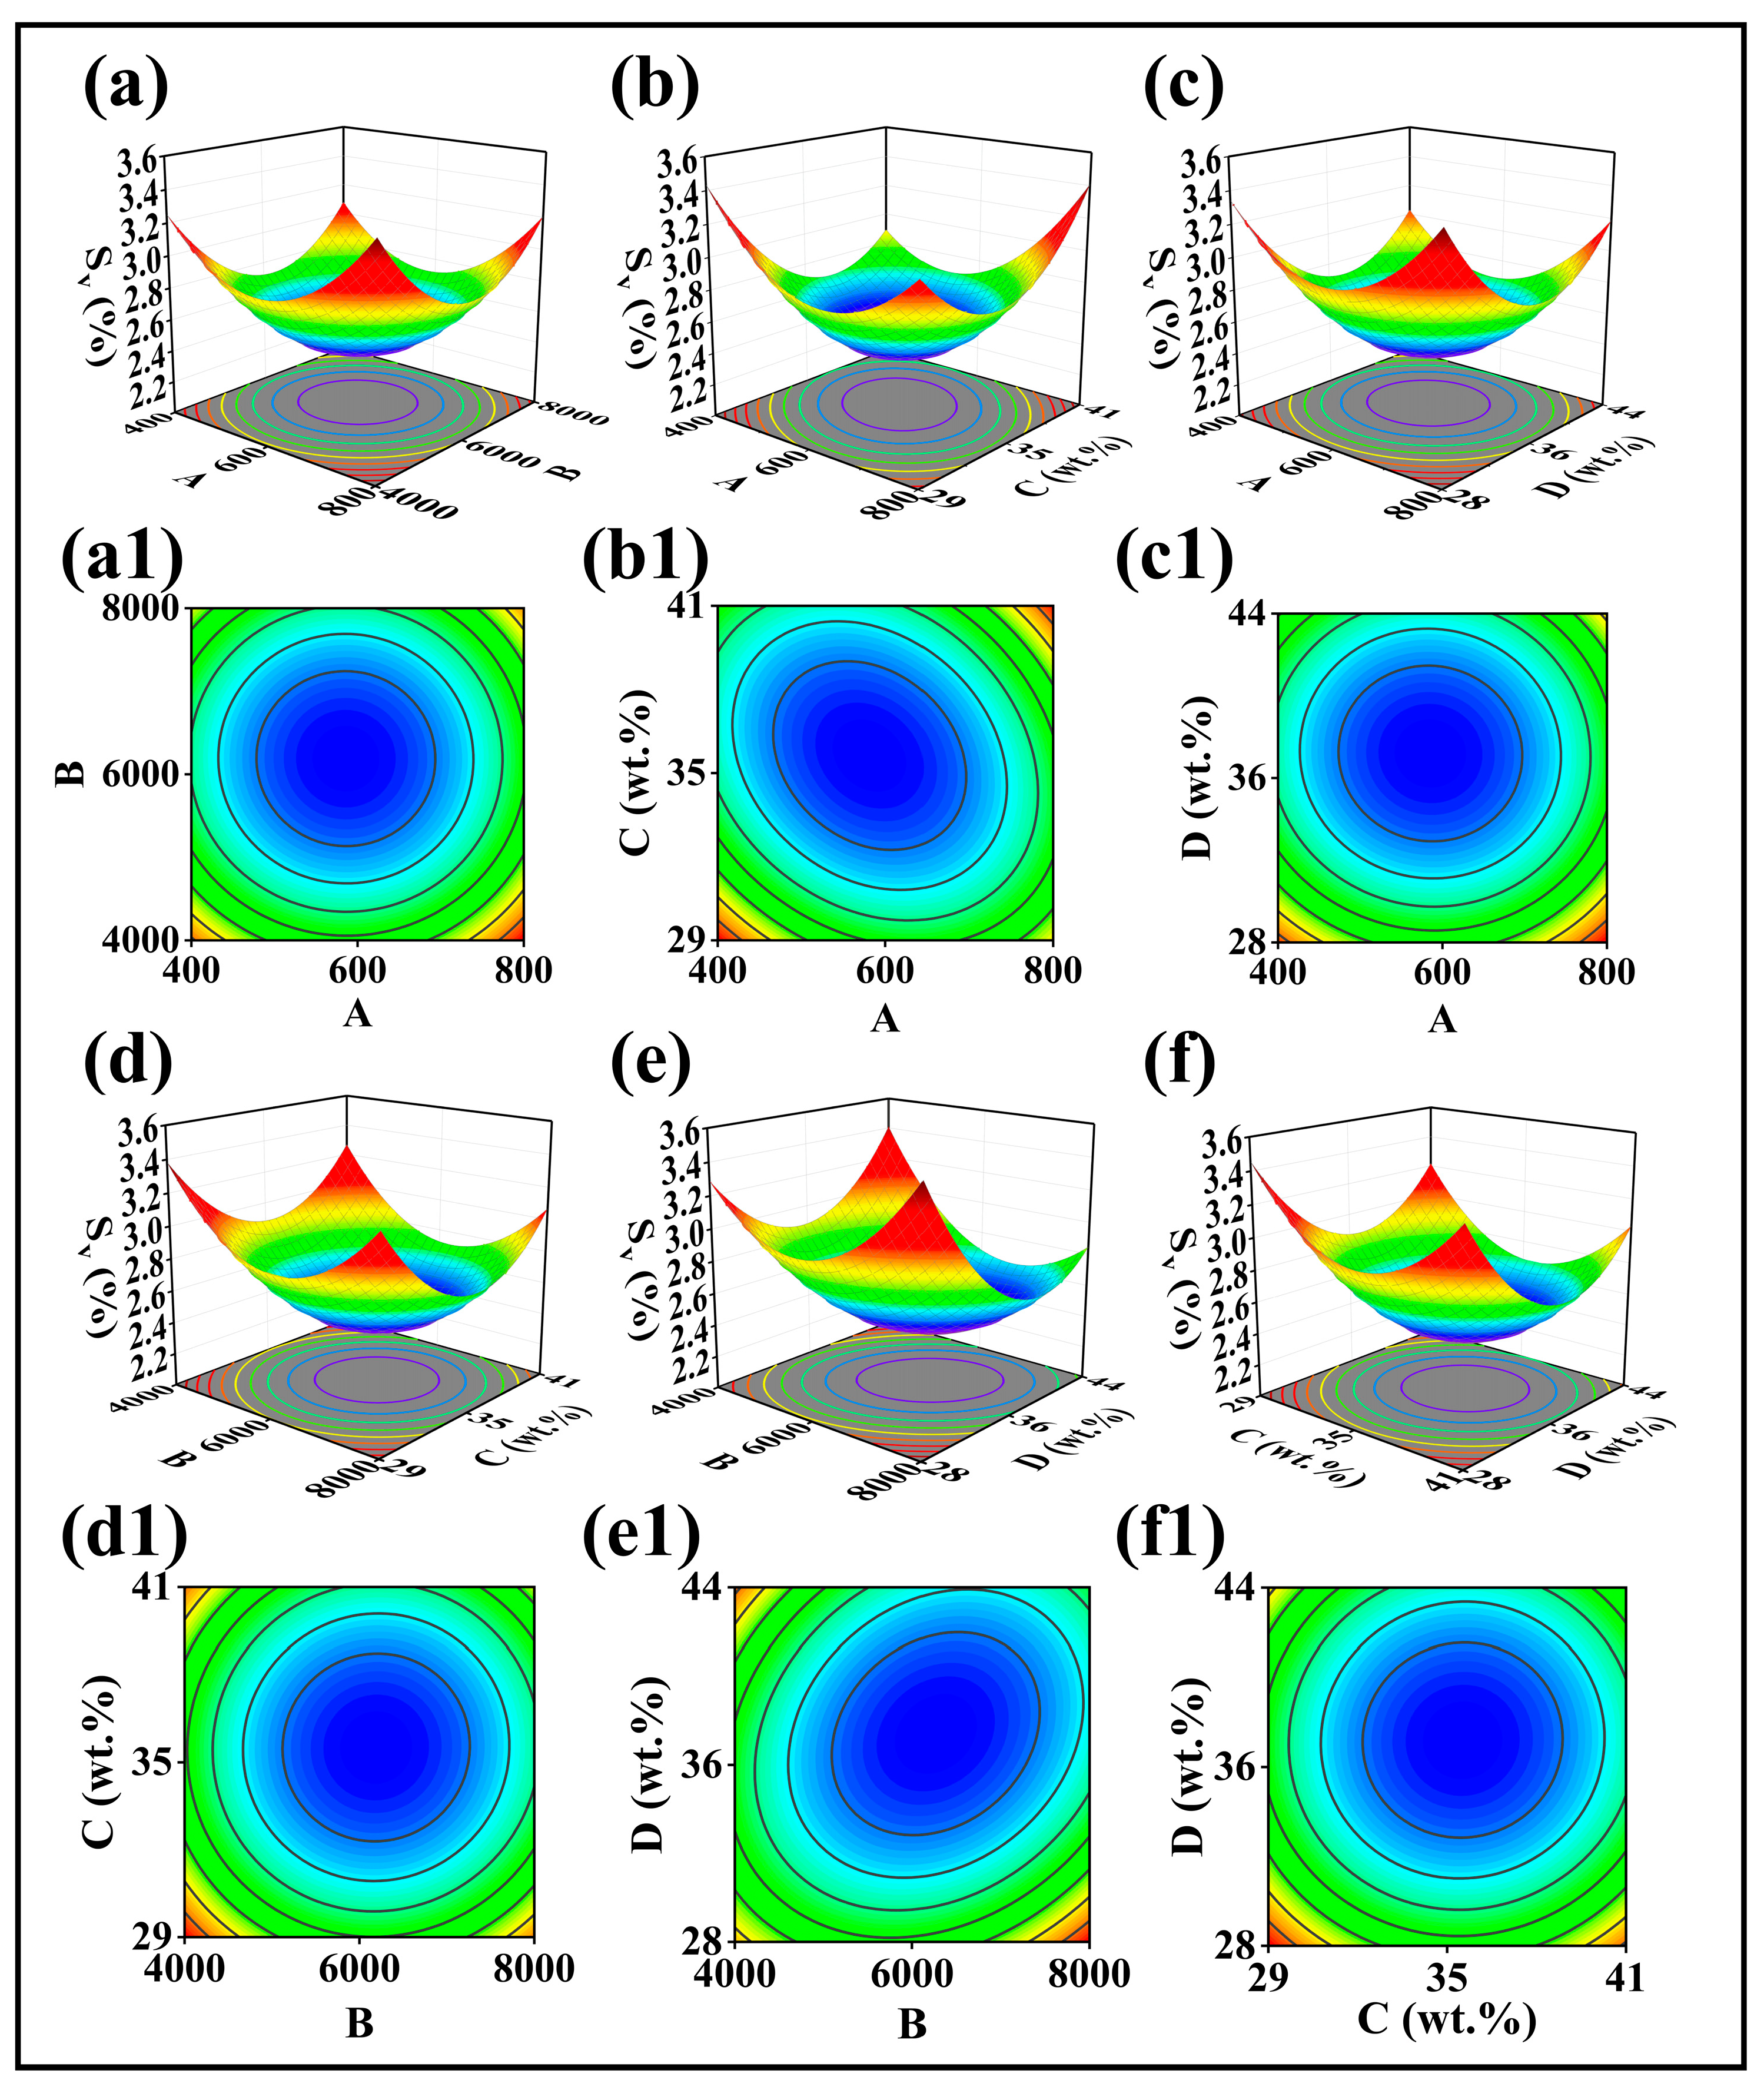
Based on the quadratic regression equation fitted using Design-Expert, the response surface and contour plots for Sv were generated, as shown in Figure 4. As shown in Figure 4, in the response surfaces for AC and BD, Sv initially decreased and then increased as the corresponding factor levels increased. When A was approximately 500–700, C was approximately 33–37 wt.%, B was approximately 5000–7500 and D was approximately 35–39 wt.%, Sv decreased to approximately 2.8% or lower. The regression model predicted that Sv reached its minimum when the molecular weight and solution concentration of the low-molecular-weight PEG were 580 and 35.7 wt.%, respectively, and those of the high-molecular-weight PEG were 6273 and 37.5 wt.%, respectively. Considering the commercially available PEG grades, the low- and high-molecular-weight PEG were adjusted to PEG600 and PEG6000, respectively, while their solution concentrations were maintained at 35.7 wt.% and 37.5 wt.%, respectively. Under this parameter combination, the model predicted an Sv of 2.34%. The validation experiment yielded an Sv of 2.43 ± 0.24%, which was close to the predicted value. Therefore, this combination was determined as the optimal parameter combination for PEG impregnation in two stages.

3.3. Characterization and Performance Evaluation of Artificially Aged Waterlogged Wood After PEG Impregnation and Freeze Drying

3.3.1. Analysis of Chemical Structure and Crystalline Phase Characteristics

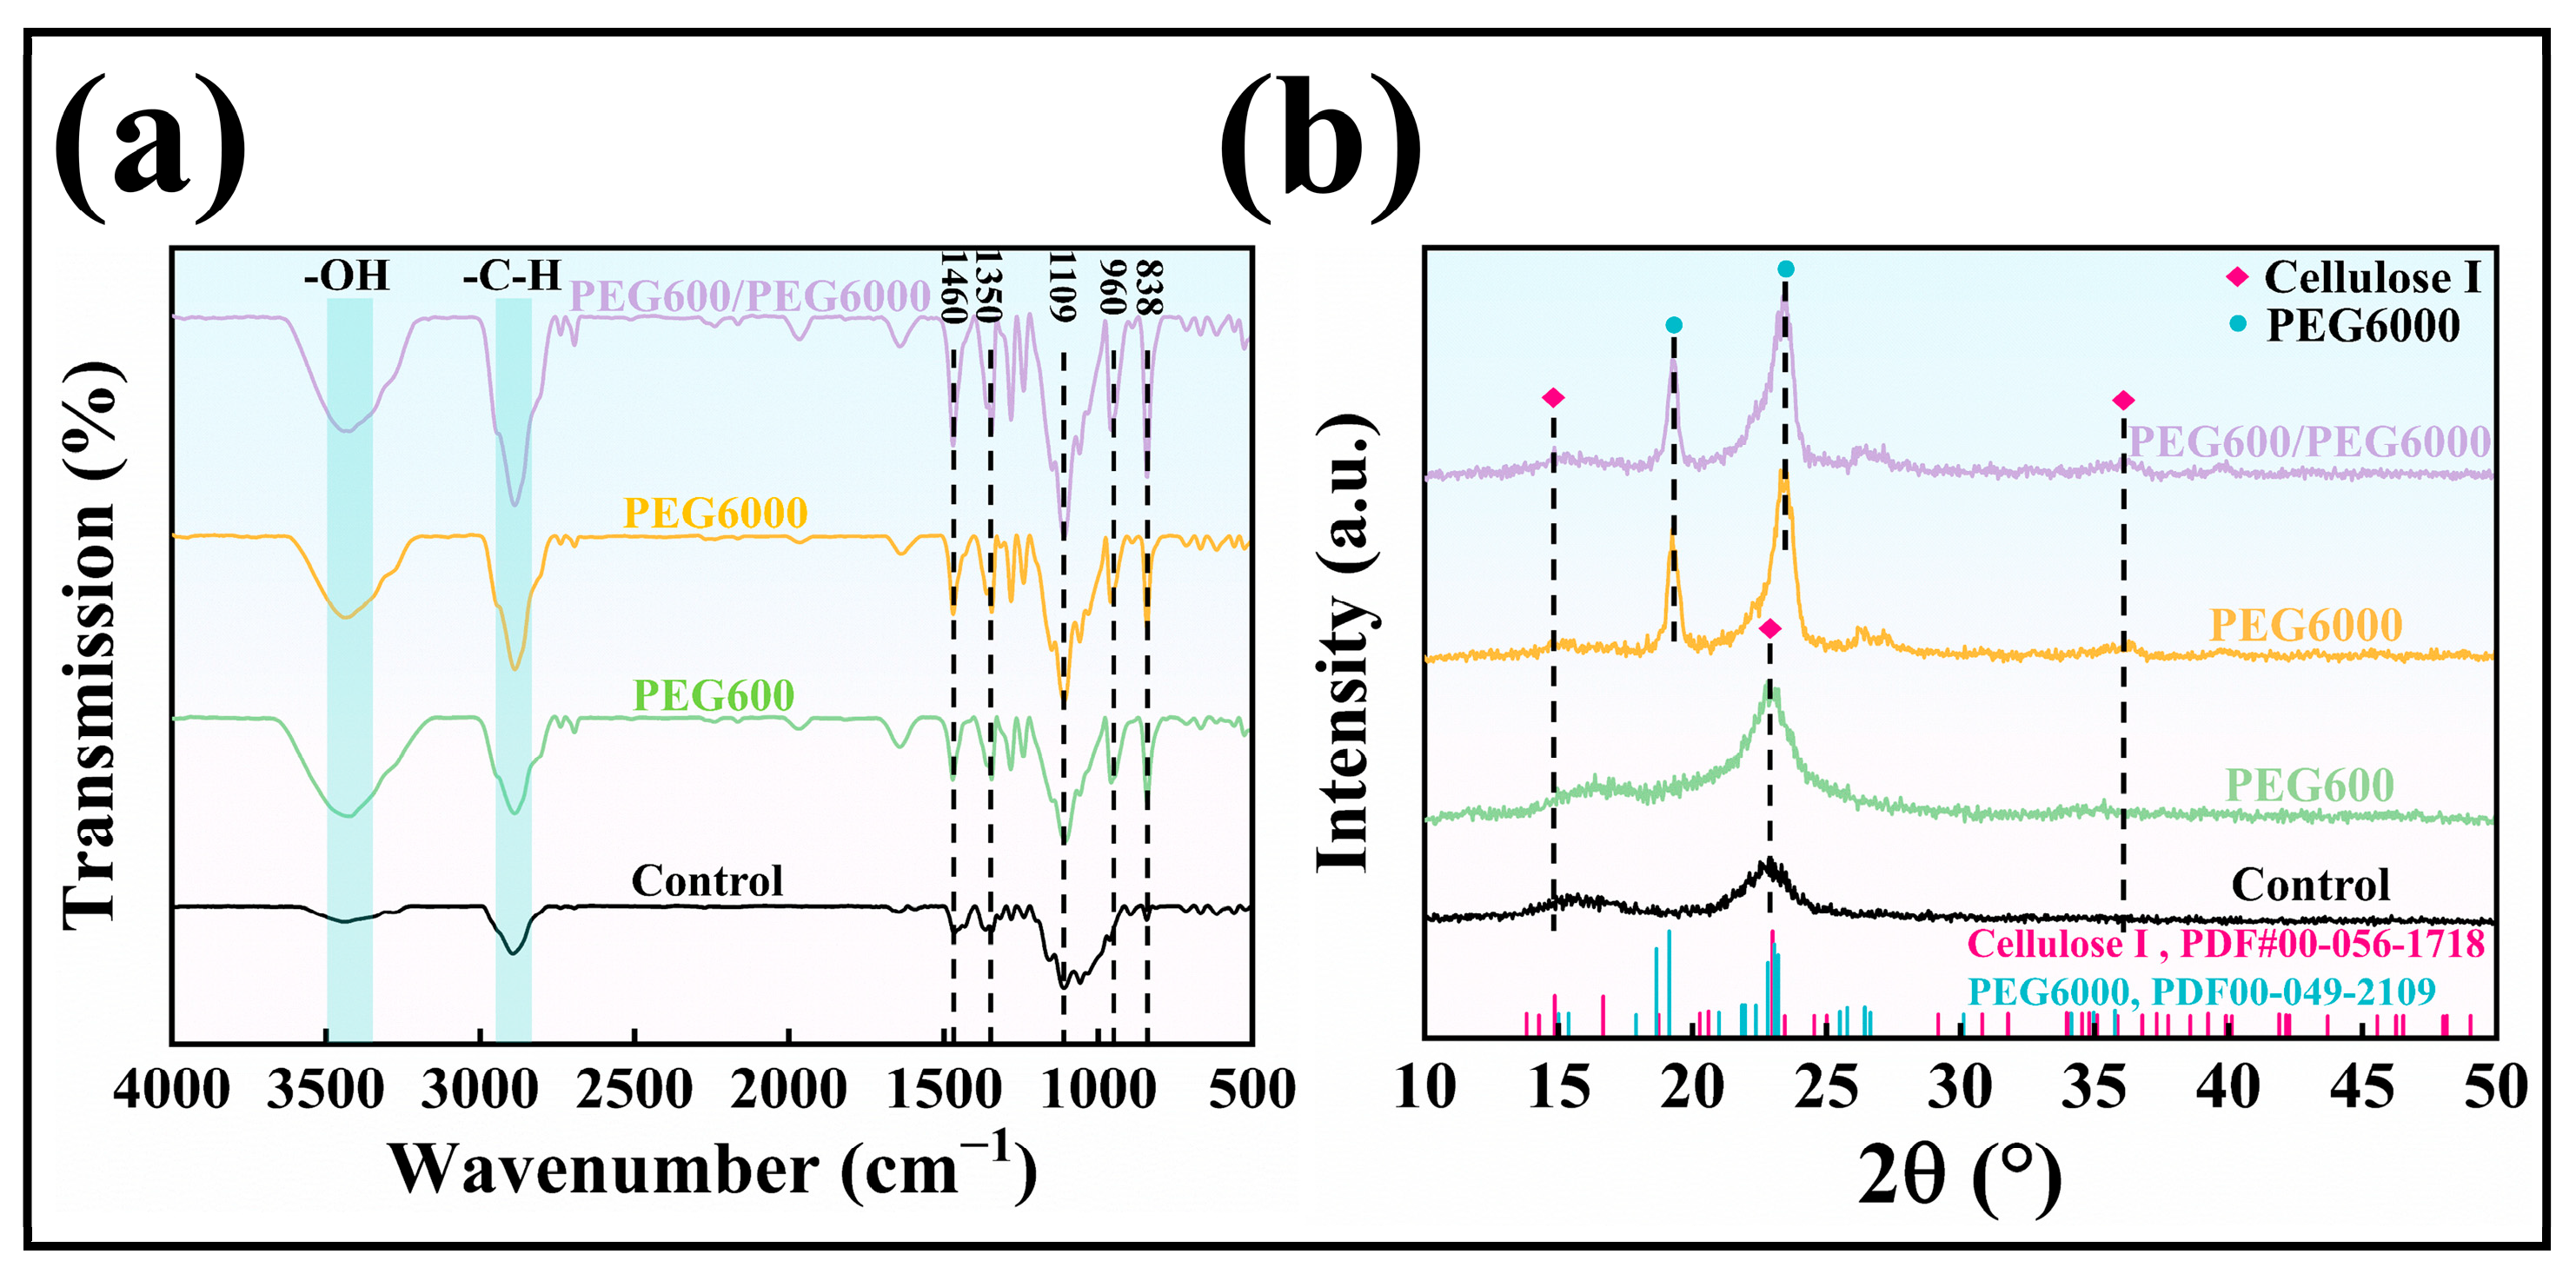
Based on the response surface optimization results described above, the FTIR spectra and XRD patterns of the water control group, PEG600 single-stage treatment group, PEG6000 single-stage treatment group, and PEG600/PEG6000 treatment group in two stages were compared, as shown in Figure 5.
Figure 5a shows the FTIR spectra of specimens subjected to different treatment methods. As shown in the figure, all groups exhibited absorption peaks at approximately 3433, 2887, 1460, 1350, 1109, and 1060 cm−1. The absorption peak at approximately 3433 cm−1 was assigned to O-H stretching vibrations of hydroxyl groups, whereas the peak at approximately 2887 cm−1 was attributed to C-H stretching vibrations [37,38]. The peaks at approximately 1460 and 1350 cm−1 were assigned to the bending and rocking vibrations of methylene CH2 groups, respectively [39]. The peak at approximately 1109 cm−1 was mainly associated with C-O-C and C-O stretching vibrations [36]. Compared with the water control group, the PEG treatment groups showed increased absorption intensities at these positions, indicating enhanced absorption signals associated with O-H, C-H, CH2, and C-O-C structures after PEG treatment. This may be attributed to the presence of hydroxyl groups at both ends of the PEG molecular chain, together with methylene structures containing C-H bonds and ether linkages in the main chain, which enhanced the intensities of the corresponding absorption peaks [40]. These changes indirectly indicate that PEG was introduced into the specimens after treatment.
In addition, compared with the water control group, the PEG treatment groups exhibited more distinct additional absorption peaks at approximately 960 and 838 cm−1. These two peaks were mainly assigned to the rocking vibrations of methylene CH2 groups in the PEG molecular chain, further indicating the presence of PEG in the specimens after treatment [41].
Figure 5b shows the XRD patterns of specimens subjected to different treatment methods. All groups exhibited diffraction peaks at 2θ = 15.2° and 35.2°, which were assigned to the (101) and (040) crystalline planes, respectively, of monoclinic cellulose Iβ (P21, PDF#00-056-1718) [42,43].
In addition, all groups showed distinct diffraction signals in the region around 2θ = 22.6°, mainly associated with diffraction from the (002) crystalline plane of cellulose Iβ. The diffraction peaks in this region were relatively broad for the water control and PEG600 groups, whereas those of the PEG6000 and PEG600/PEG6000 treatment groups in two stages were sharper and shifted slightly toward higher angles. This may be attributed to the retention of PEG6000 in crystalline form within the wood after treatment and freeze drying. Because the diffraction signal of crystalline PEG6000 is close to that of the cellulose Iβ (002) peak, overlap between the two signals may have altered the peak shape in this region [44].
Further examination showed that the PEG6000 and PEG600/PEG6000 treatment groups in two stages exhibited an additional distinct diffraction peak at approximately 2θ = 19.2°. This peak was assigned to diffraction from the (120) crystalline plane of monoclinic polyethylene glycol (PEG6000, P21/a, PDF#00-049-2109), further indicating that PEG6000 was retained in crystalline form within the wood after treatment and freeze drying [45].

3.3.2. Analysis of PEG Distribution Within Wood Cells

To further clarify the spatial distribution of PEG in the treated wood, specimens from the different PEG treatment groups were characterized using confocal Raman microscopy imaging, and the characteristic Raman peaks of PEG were analyzed, as shown in Figure 6. Figure 6d presents the Raman spectra of the different PEG treatment groups. As shown in the figure, all PEG treatment groups exhibited Raman peaks at approximately 843, 1285, 1470, and 2885 cm−1. The peak at approximately 843 cm−1 was assigned to vibrations associated with C-O-C groups in the PEG molecular chain; the peak at approximately 1285 cm−1 was assigned to C-C stretching vibrations; the peak at approximately 1470 cm−1 was assigned to CH2 bending vibrations; and the strong peak at approximately 2885 cm−1 was assigned to C-H stretching vibrations [46,47,48]. These peak positions were generally consistent with the characteristic Raman bands of PEG reported in the literature, indicating that characteristic PEG signals were detected in all PEG-treated specimens and further confirming the retention of PEG in the treated wood.
The Raman mapping results in Figure 6a–c were further analyzed to examine the spatial distribution of PEG within the treated wood. In the maps, the color scale changes sequentially from blue to green, yellow, and red, representing a gradual increase in the signal intensity of the characteristic PEG peaks. As shown in Figure 6a, in the PEG600 group, stronger PEG-related signals were distributed mainly along the cell wall regions, whereas relatively weak signals were observed in most cell lumen regions, indicating that PEG600 was distributed mainly in the cell wall regions. As shown in Figure 6b, in the PEG6000 group, PEG-related signals were distributed in the cell wall regions and some cell lumen regions. In some cell lumen regions, the signal intensity was higher than that in the surrounding cell wall regions, indicating relatively pronounced enrichment of PEG6000 in these lumen regions. As shown in Figure 6c, in the PEG600/PEG6000 two-stage treatment group, PEG-related signals were observed in both the cell wall regions and some cell lumen regions, and the signal intensity showed a relatively more even distribution, indicating that the spatial distribution of PEG within the wood cellular structure tended to become more uniform.
The differences in PEG distribution may be mainly related to differences in PEG molecular size and the characteristic dimensions of the internal wood structure. Artificially aged waterlogged wood contains numerous fine pores within the cell walls. Owing to its relatively small molecular size, PEG600 can more readily penetrate these fine pores and be retained within the cell wall structure. In contrast, the larger molecular size of PEG6000 may restrict its penetration into the fine pores of the cell walls, whereas the larger cell lumina provide more available space for its retention, thereby favoring pronounced enrichment of PEG6000 in some lumen regions [49,50]. During the two-stage treatment, the initial impregnation with PEG600 may have facilitated its penetration into the fine pores of the cell walls, while the subsequent PEG6000 treatment provided further retention and support in larger internal spaces. These complementary penetration and retention characteristics contributed to a more uniform spatial distribution of PEG within the wood cellular structure.

3.3.3. Analysis of Weight Percentage Gain and Macroscopic Appearance

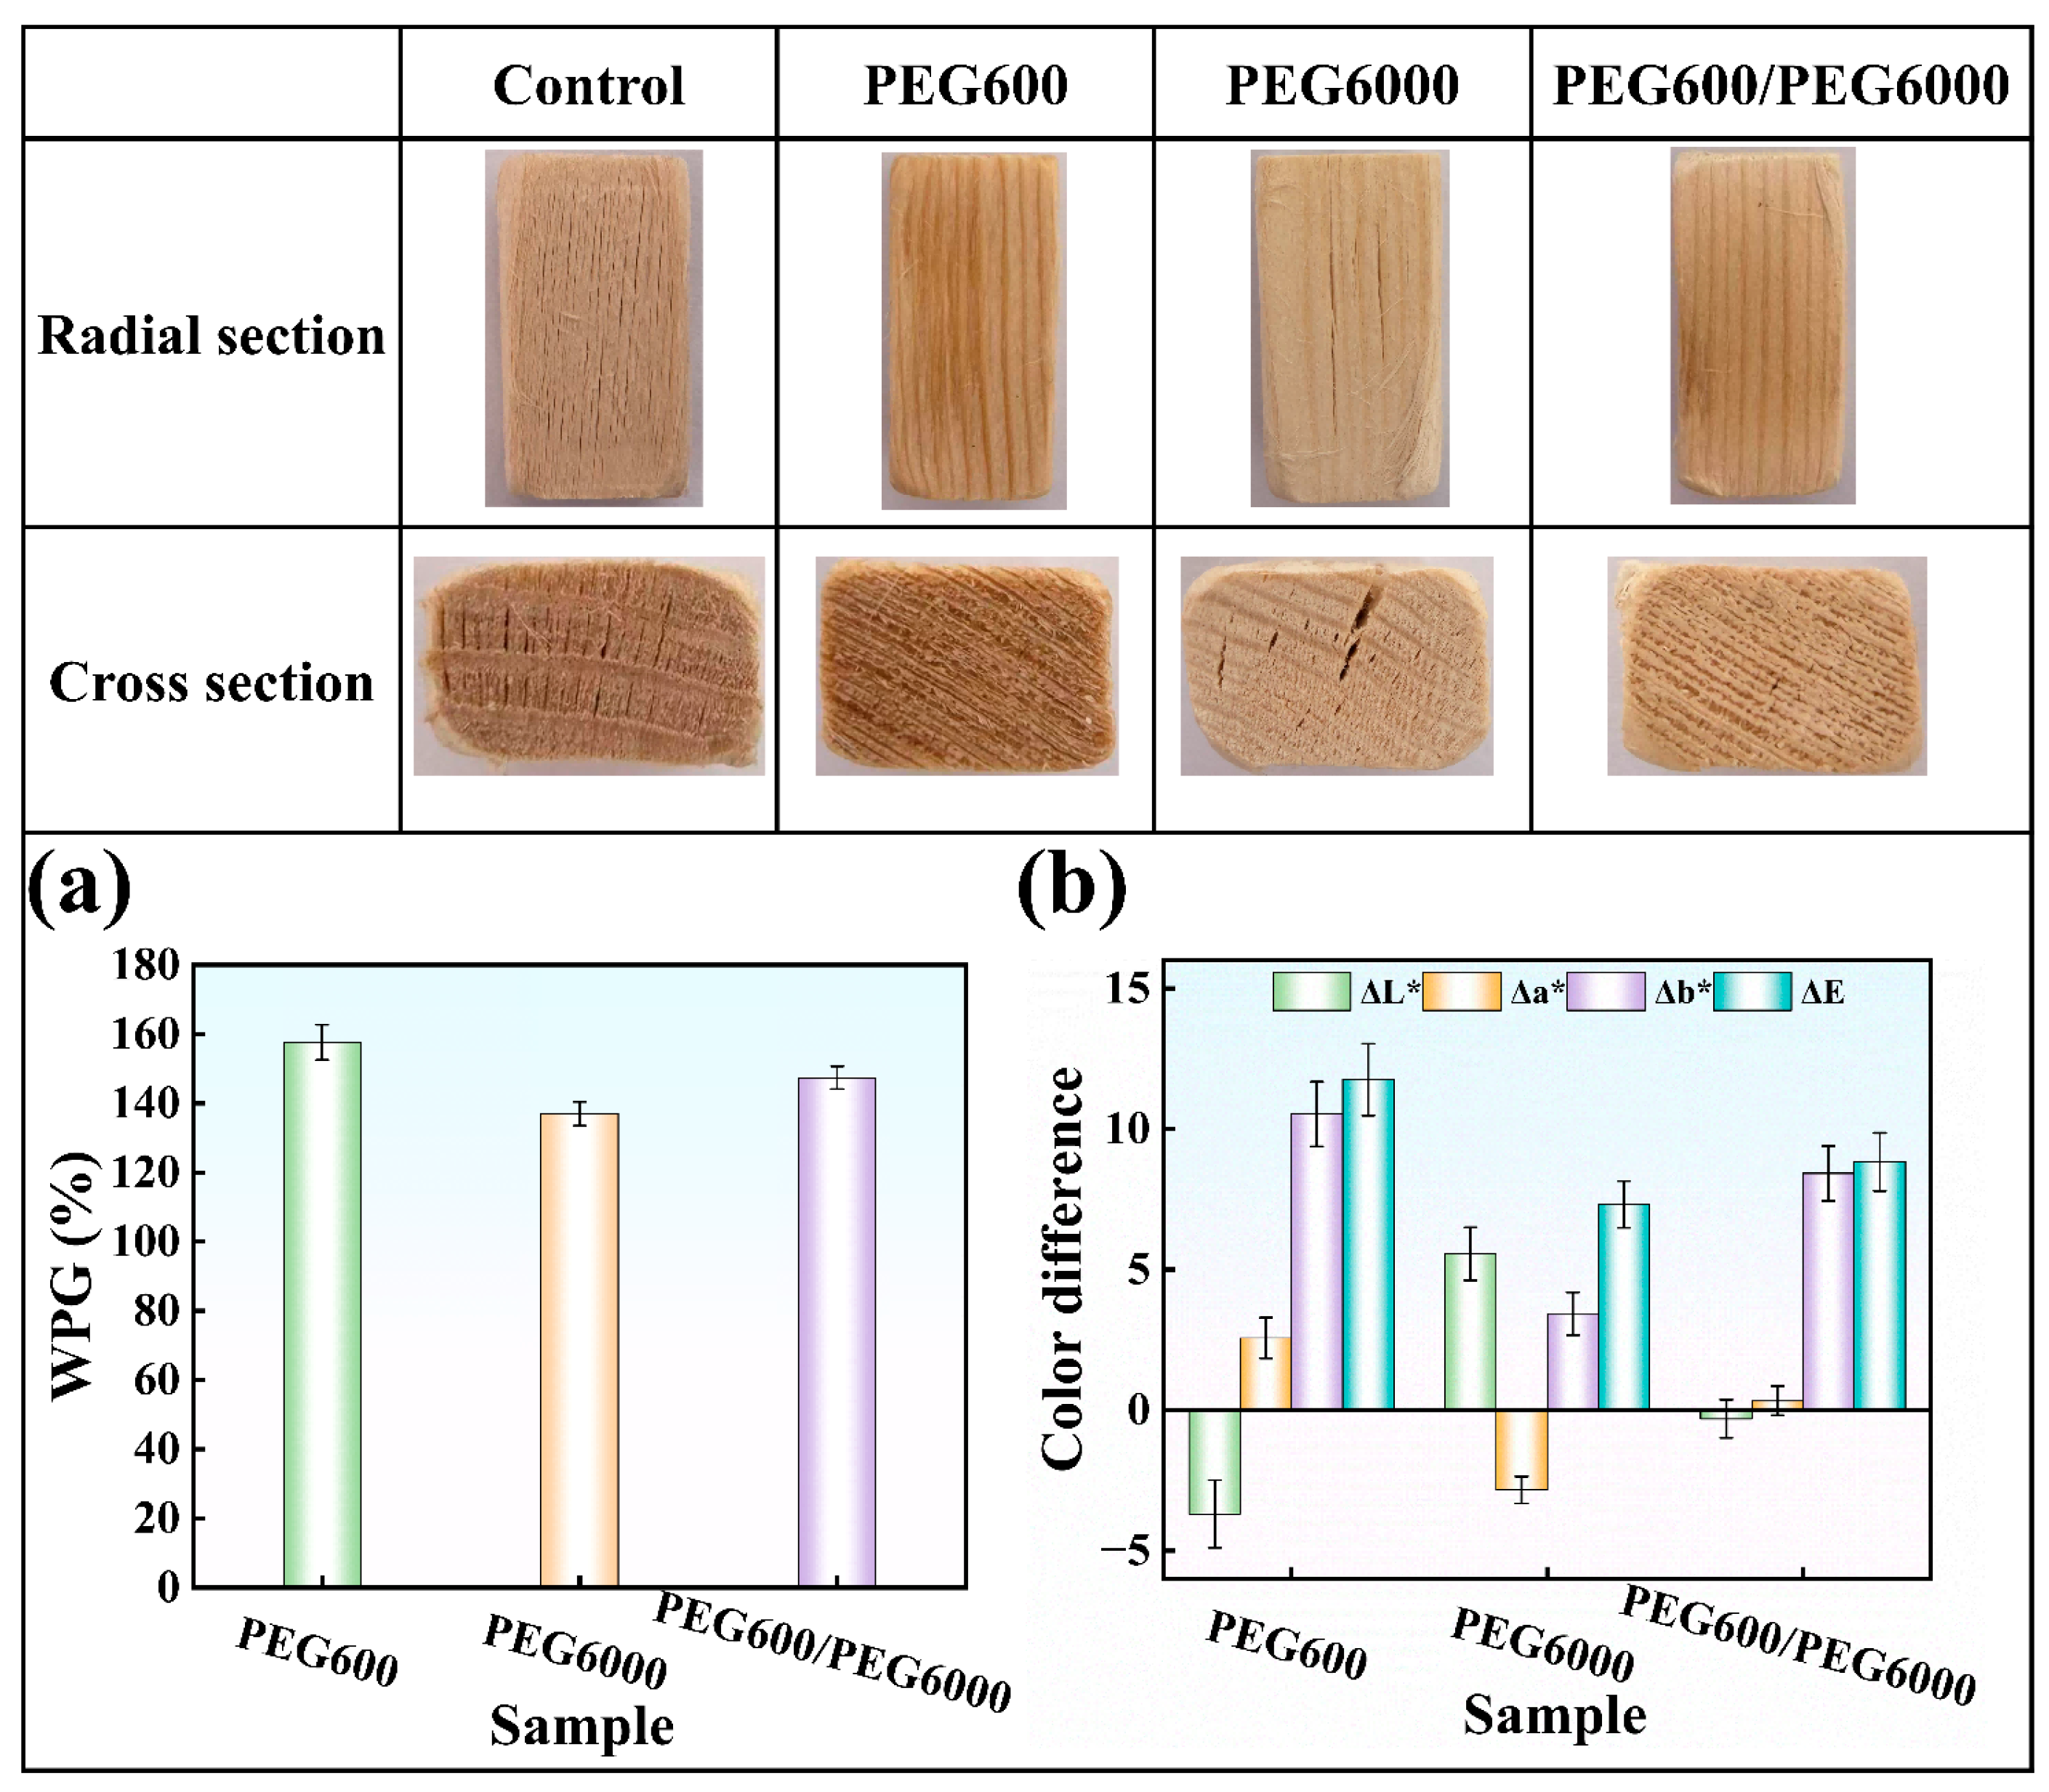
Figure 7 shows the macroscopic appearance, WPG, and color difference in the specimens after freeze drying under different treatment methods. As shown in Figure 7a, among the PEG treatment groups, the PEG600 group exhibited the highest WPG, indicating that a relatively large amount of PEG ultimately entered and was retained within the wood. This may be attributed to the lower molecular weight of PEG600 and the relatively low viscosity of its solution, which reduced resistance to PEG transport within the wood and allowed more PEG to penetrate the wood during the same impregnation period [51]. In contrast, PEG6000 has a higher molecular weight and a relatively higher solution viscosity, which impose greater limitations on PEG transport within the wood. Consequently, a smaller amount of PEG entered the wood during the same impregnation period, resulting in a lower WPG [52]. The WPG of the PEG600/PEG6000 treatment group in two stages was intermediate between those of the PEG600 and PEG6000 single-stage treatment groups.
From the macroscopic appearance, numerous fine cracks were observed on both the radial and transverse surfaces of the water control group, indicating relatively poor surface integrity. In the PEG600 treatment group and the PEG600/PEG6000 treatment group in two stages, the number of fine cracks on both surfaces was markedly reduced, and the overall morphology was relatively well preserved. In contrast, locally wider cracks were still observed on the transverse surface of the PEG6000 treatment group.
Distinct differences in surface color were also observed among the treatment groups. As shown in Figure 7b, compared with the water control group, the PEG600 treatment group exhibited the largest total color difference, with a ΔE* value of 11.76, mainly characterized by decreased lightness and increased redness and yellowness. The PEG6000 treatment group showed the smallest total color difference, with a ΔE* value of 7.32, and its color change was mainly characterized by increased lightness. This may be because high-molecular-weight PEG has relatively limited mobility and is more likely to remain near the wood surface. Since it is a white solid at room temperature, its presence may increase the surface lightness of the specimens. The PEG600/PEG6000 treatment group in two stages had a total color difference of 8.83, with lightness closest to that of the water control group, while the main color change was an increase in yellowness.
Overall, the PEG600/PEG6000 treatment group in two stages showed a relatively moderate WPG, together with relatively well-preserved macroscopic morphology and limited color change, indicating a favorable balance between PEG retention and preservation of macroscopic appearance.

3.3.4. Analysis of Specimen Microstructure

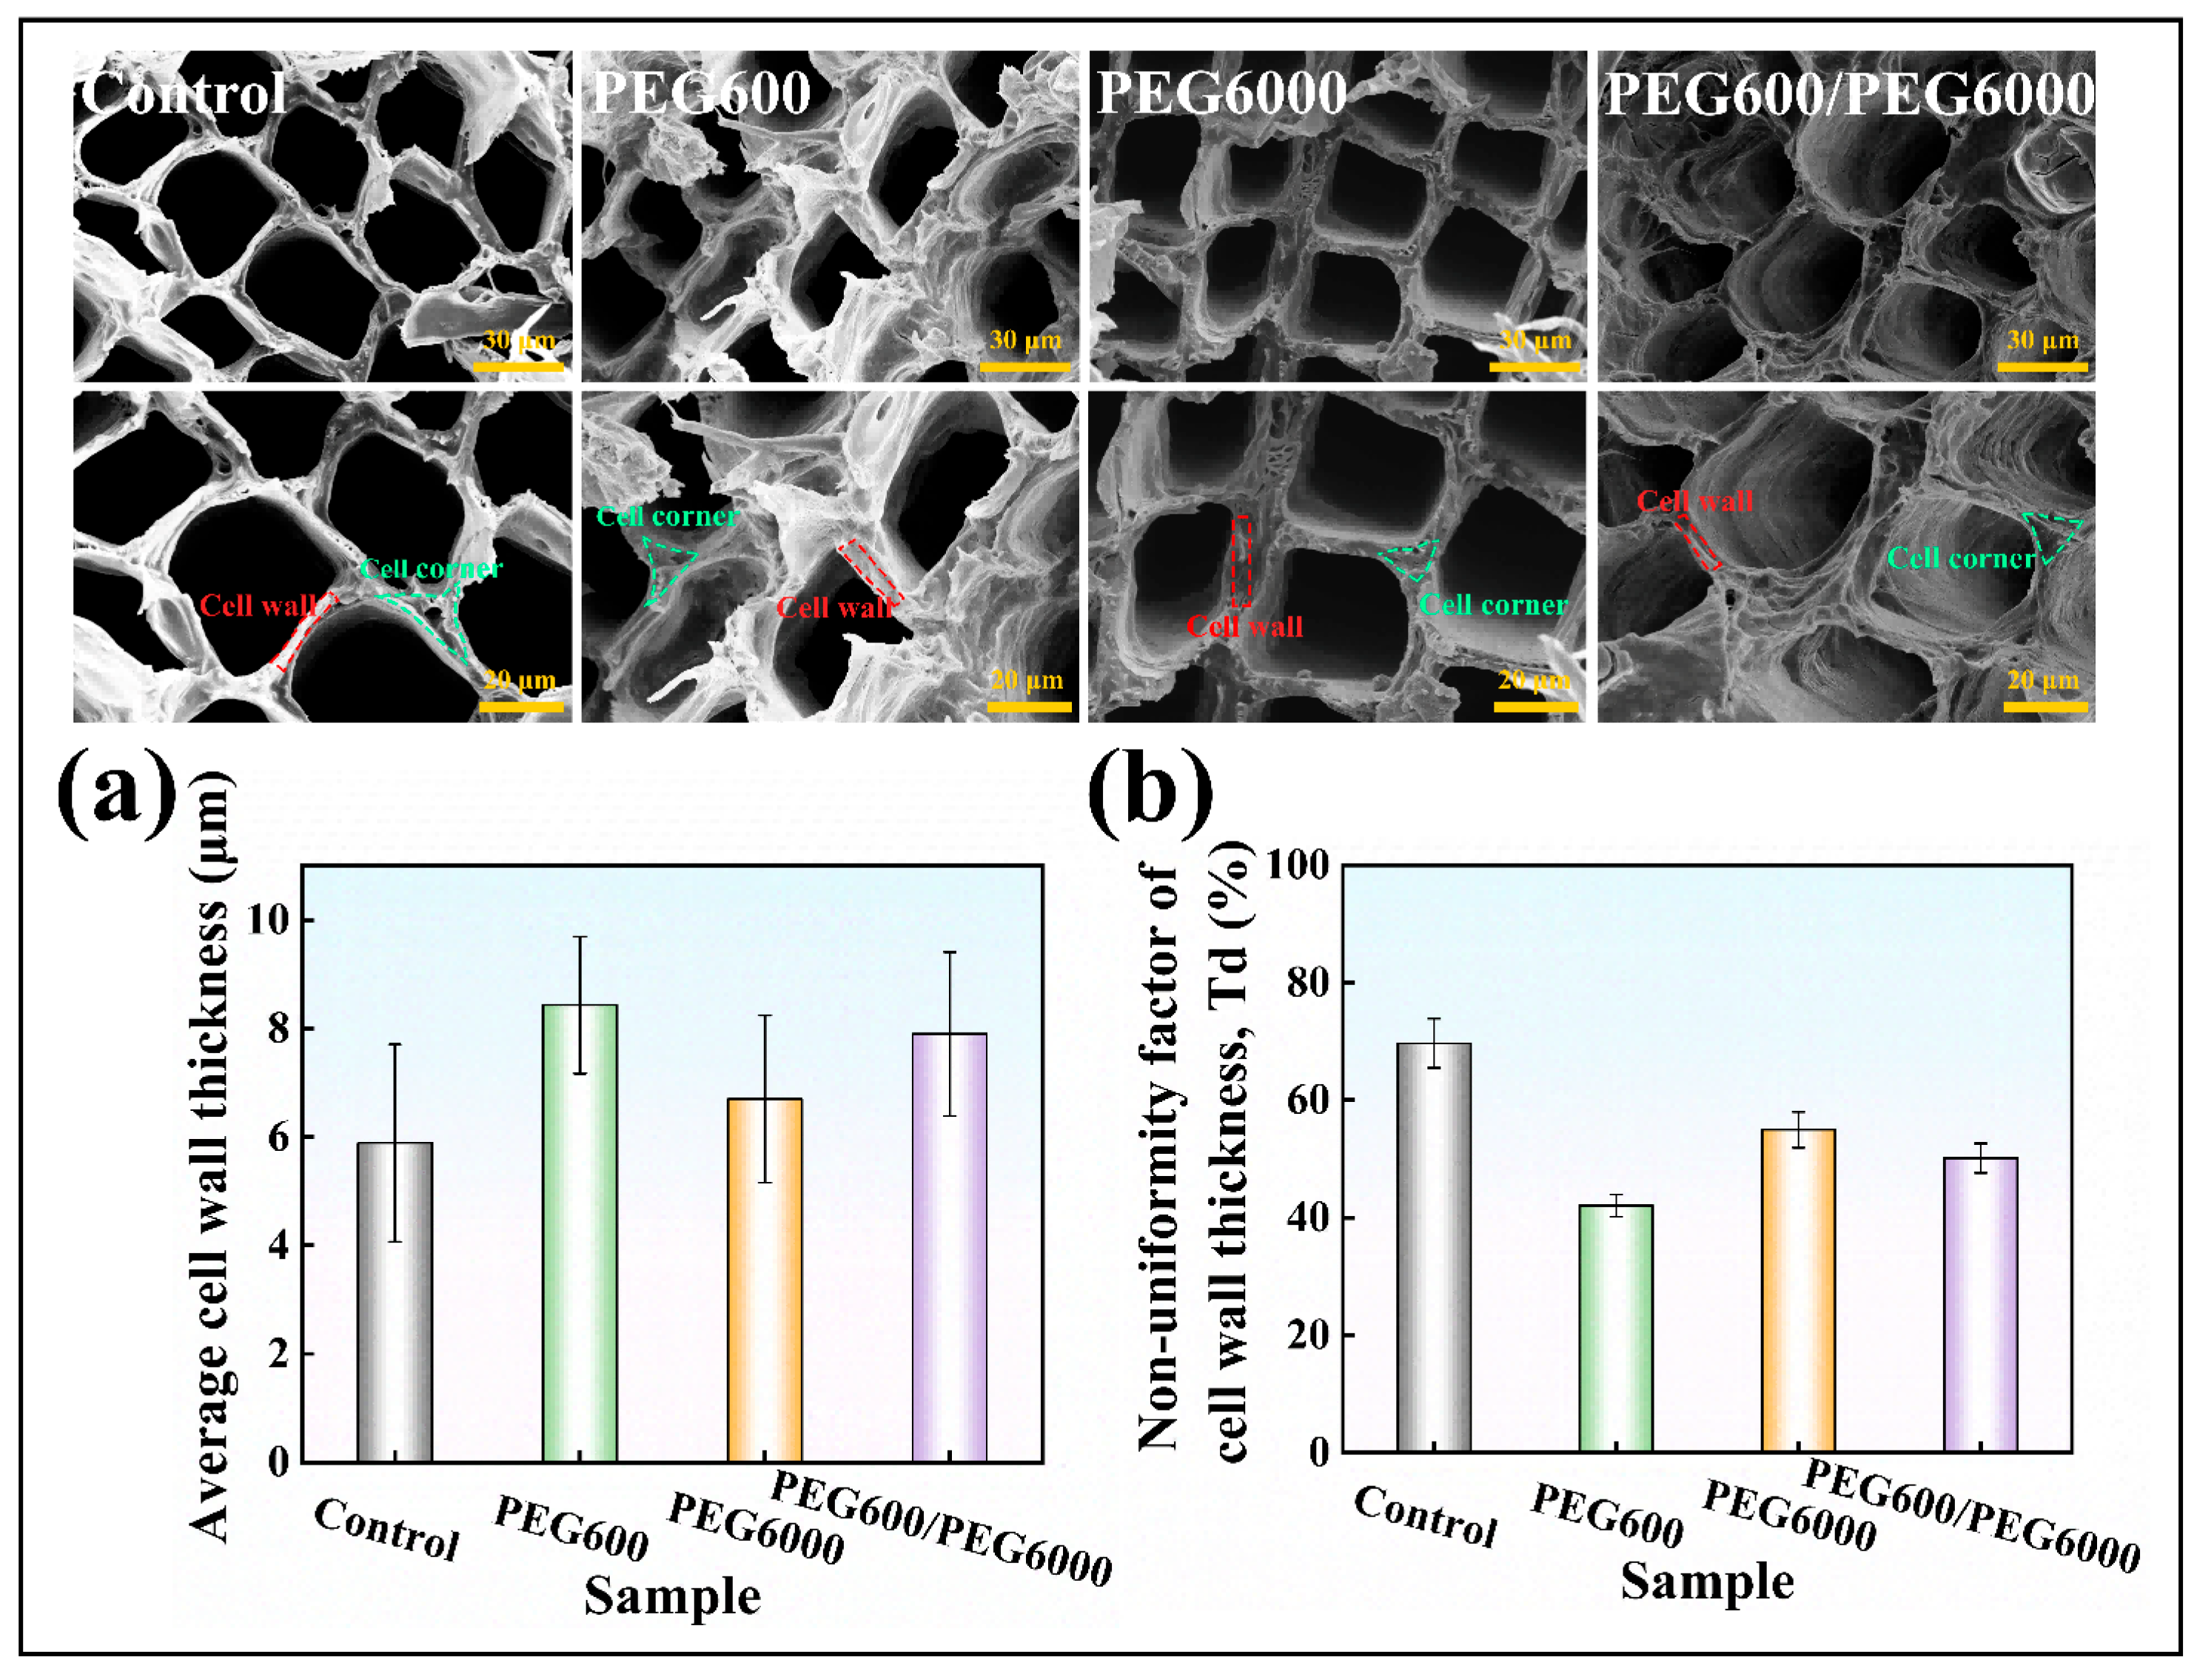
To further evaluate the effects of different treatment methods on the microstructure of artificially aged waterlogged wood, the transverse surface morphology of the specimens was observed by scanning electron microscopy, and the cell wall thickness and cell wall thickness nonuniformity coefficient in the earlywood tracheid region were quantitatively analyzed based on the SEM images, as shown in Figure 8. The SEM images showed that, in the water control group, some cell walls were bent toward the cell lumina, and local voids were visible in the cell corner regions, indicating a certain degree of cell wall bending and local structural deformation after freeze drying. The quantitative results in Figure 8a,b show that the water control group had the lowest cell wall thickness, only 5.89 μm, and the highest thickness nonuniformity coefficient, reaching 69.69%. These results are consistent with the SEM observations, indicating that the microstructure of the water control group was poorly preserved after freeze drying and that its cell wall thickness distribution was the least uniform.
This was mainly because the hydrothermal treatment caused substantial losses of hemicellulose and lignin. The loss of hemicellulose weakened the cell wall matrix structure, making the cell walls more susceptible to bending and local deformation during freeze drying [53]. At the same time, the reduction in lignin content weakened the bonding stability of the cell corner regions, making these regions more prone to the formation of local voids [54]. In addition, no PEG was introduced into the water control group to provide filling and structural support for these degraded regions, resulting in more pronounced microstructural deformation.
In contrast, all PEG treatment groups showed less pronounced bending of the cell walls toward the cell lumina and fewer local voids in the cell corner regions. In addition, the cell wall thickness was higher and the thickness nonuniformity coefficient was lower in all PEG treatment groups than in the water control group. These results indicate that PEG treatment helped reduce cell wall bending and local structural deformation, thereby improving the preservation of the wood microstructure after freeze drying.
Further comparison among the PEG treatment groups showed that the PEG600 group had the highest cell wall thickness, at 8.43 μm, and the lowest thickness nonuniformity coefficient, at 42.08%. The corresponding values were 6.70 μm and 54.95% for the PEG6000 group and 7.90 μm and 50.14% for the PEG600/PEG6000 treatment group in two stages. In the PEG600 group, PEG was retained mainly in the cell wall region, and the overall amount of retained PEG was relatively high, which could enhance filling and support within the cell walls and thereby help maintain a greater cell wall thickness. At the same time, the widespread fine pores within the cell walls allowed PEG to provide relatively uniform filling at different locations, resulting in more consistent preservation of cell wall morphology and therefore a lower thickness nonuniformity coefficient. In contrast, in the PEG6000 group, the penetration of PEG into the fine pores of the cell walls was relatively limited, and the overall amount of PEG retained within the wood was lower. These factors may have limited the filling and supporting effects of PEG on the cell walls, resulting in a relatively smaller cell wall thickness. At the same time, the limited penetration of PEG6000 into the fine pores of the cell walls may have resulted in differences in the degree of filling and support among different cell wall regions, leading to less consistent preservation of the cell wall morphology and consequently a relatively higher thickness nonuniformity coefficient.

3.3.5. Analysis of Dimensional Stability

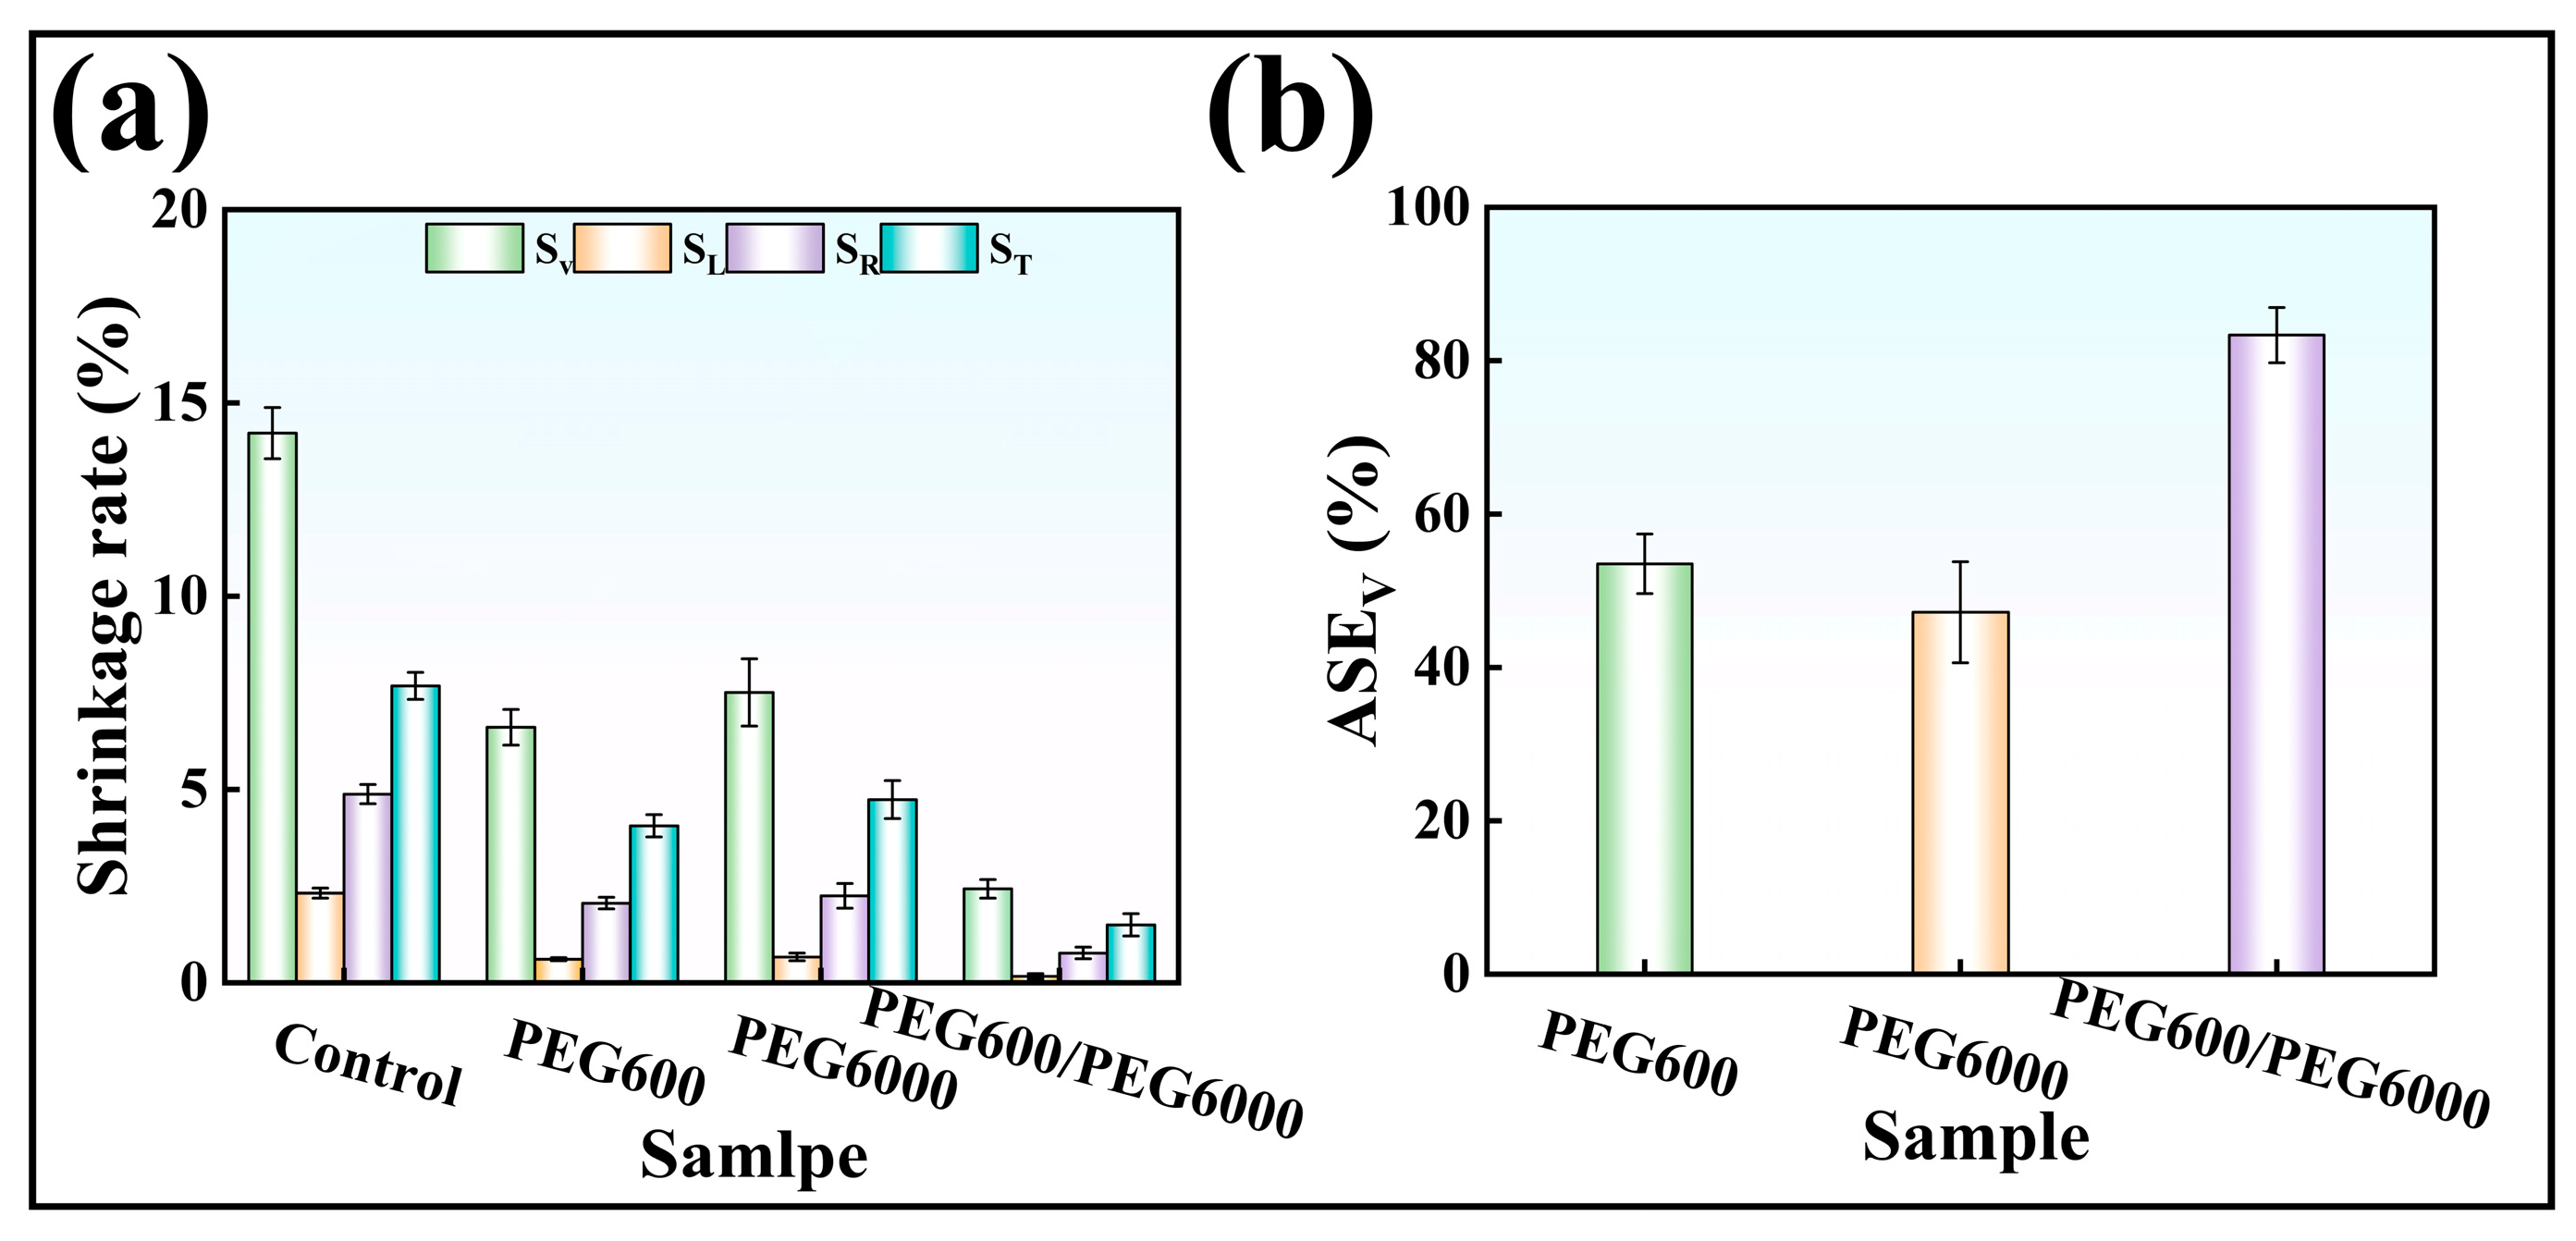
The longitudinal, radial, tangential, and volume shrinkage of the specimens after freeze drying under different treatment methods are shown in Figure 9a. As shown in the figure, the water control group exhibited the highest volume shrinkage after freeze drying, at 14.22%. After PEG treatment, both the directional shrinkage and volume shrinkage were markedly reduced, indicating that PEG consolidation helped improve the overall dimensional retention of artificially aged waterlogged wood after freeze drying. Further comparison among the PEG treatment groups showed that the volume shrinkage values of the PEG600 and PEG6000 groups were 6.61% and 7.51%, respectively, and their ASE values relative to the water control group were 53.52% and 47.19%, respectively. The PEG600/PEG6000 treatment group in two stages exhibited the lowest volume shrinkage, at only 2.43%, and the highest ASE, at 82.91%.
This may be attributed to the combined effects of PEG spatial distribution and overall retention after the two-stage treatment. As indicated by the Raman analysis described above, the complementary distribution of PEG with different molecular weights contributed to a more uniform spatial distribution within the wood cellular structure, which may have provided more consistent filling and support across different structural regions. In addition, the relatively high WPG of this group indicates that a substantial amount of PEG was retained within the wood, providing sufficient material for structural filling and support. Together, these effects may have contributed to reducing structural shrinkage and deformation during freeze drying, ultimately resulting in the lowest volume shrinkage.

3.3.6. Analysis of Moisture Stability

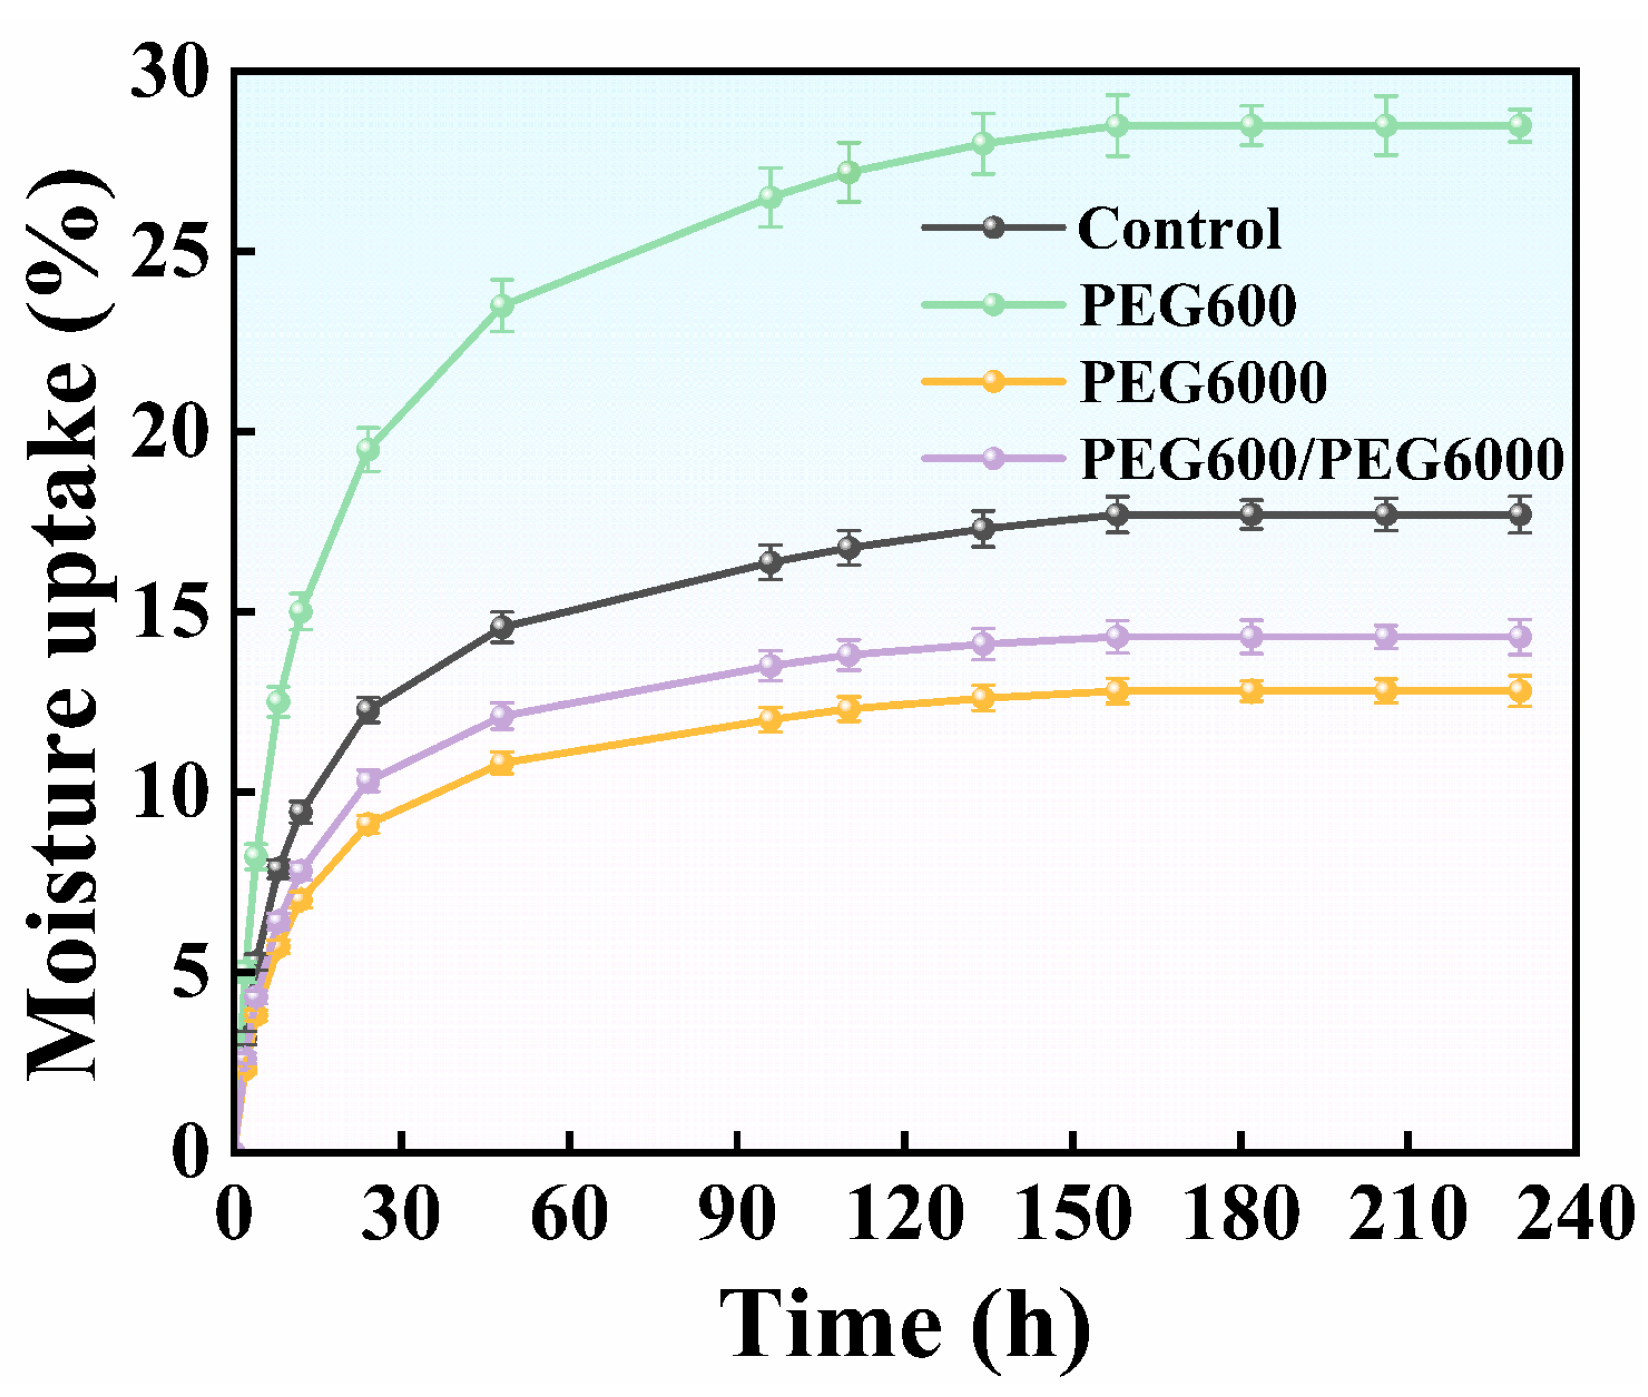
The changes in moisture uptake of specimens subjected to different treatment methods at 85% RH are shown in Figure 10. As shown in the figure, the moisture uptake of all groups increased with increasing exposure time and gradually approached a stable level after 158 h. At 230 h, the moisture uptake values of the PEG6000 group and the PEG600/PEG6000 treatment group in two stages were 12.8% and 14.3%, respectively, both lower than the 17.7% observed for the water control group. In contrast, the PEG600 group exhibited the highest moisture uptake, at 28.5%.
This may be because PEG600 has shorter molecular chains and therefore contains a greater number of PEG molecules at the same mass, resulting in a relatively higher abundance of terminal hydroxyl groups and providing more hydrogen bonding sites for water molecules. In addition, the relatively high PEG retention in the PEG600 group further enhanced its hygroscopicity [55,56]. Together, these factors may account for the highest moisture uptake observed in the PEG600 group under high-humidity conditions [57]. In contrast, PEG6000 has a higher molecular weight and therefore contains fewer terminal hydroxyl groups per unit mass. In addition, its overall PEG retention was relatively low. Together, these factors may account for the lowest moisture uptake observed in the PEG6000 group under high-humidity conditions [58].

3.3.7. Analysis of Relative Bending Performance

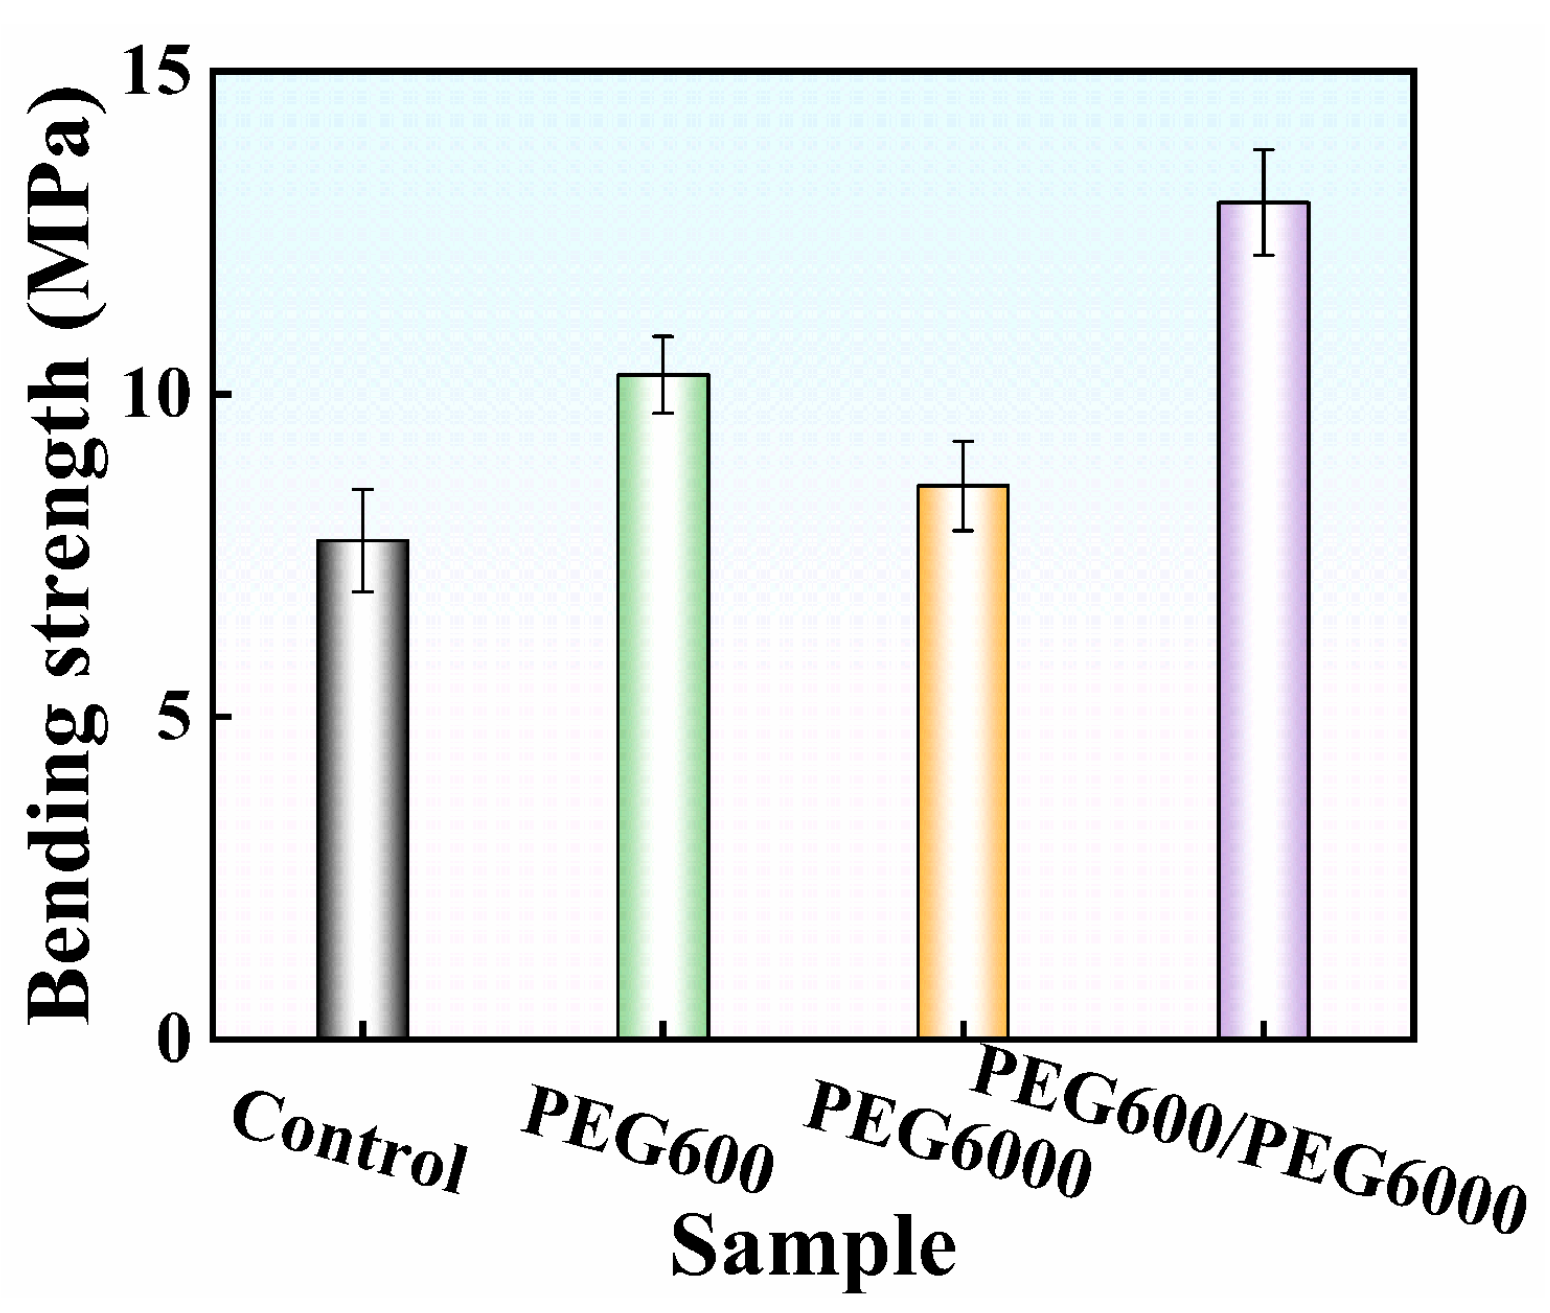
Figure 11 shows the bending strength of specimens after freeze drying under different treatment methods, which was used to compare the relative bending performance among the treatment groups. As shown in the figure, the water control group exhibited the lowest bending strength, at 7.73 MPa. This was mainly because this group did not receive the structural reinforcement provided by PEG treatment. As shown by the preceding microstructural analysis, the water control group had the smallest cell wall thickness and the most nonuniform thickness distribution, making stress concentration more likely to occur in structurally weak regions during loading and thereby reducing the bending strength.
After PEG treatment, the bending strength of the specimens increased compared with that of the water control group. One-way ANOVA showed that the treatment method had a significant effect on bending strength (p < 0.05). Among the PEG treatment groups, the PEG600/PEG6000 treatment group in two stages exhibited the highest bending strength, at 12.97 MPa, representing an increase of 67.79% compared with the water control group. This may be related to the more uniform spatial distribution of PEG within the wood after the two-stage treatment, while its relatively high overall retention may have provided more consistent and sufficient structural support for the degraded wood. In addition, this group maintained relatively thick cell walls with relatively low thickness nonuniformity, providing a better load-bearing basis for the cell walls. These factors may have contributed to more effective load transfer and reduced local stress concentration during loading, thereby contributing to the relatively high bending strength of this group [59].

3.4. Study Limitations and Future Perspectives

Although the present study optimized the key parameters of two-stage PEG impregnation and systematically evaluated the treatment performance and associated mechanisms, several limitations remain and warrant further investigation. First, in addition to the intrinsic properties of PEG, its distribution within wood is also closely related to wood species, the initial condition of the wood, and the impregnation procedure. Wood of different species and initial conditions may differ in internal structure and permeability, while impregnation conditions such as temperature, treatment duration, and treatment sequence may further affect PEG transport and distribution within the wood. The present study was conducted using artificially aged, severely degraded, and fully waterlogged Mongolian Scots pine under fixed two-stage impregnation conditions, with PEG600 applied in the first stage followed by PEG6000 in the second stage; the reverse sequence was not comparatively evaluated. Therefore, the applicability of the observed PEG distribution characteristics and the influence of treatment sequence remain to be further clarified. Future comparative studies involving different wood species, initial conditions, and impregnation conditions, particularly different treatment sequences, could further clarify their effects on PEG distribution and treatment performance.
Second, although the wood obtained using the artificial aging method in this study exhibited clear characteristics of severe degradation, naturally degraded archeological wood is also affected by long-term environmental processes such as microbial activity and mineral deposition, and may therefore exhibit more complex chemical and structural heterogeneity. Therefore, the artificially aged wood used in this study cannot fully substitute for naturally degraded archeological wood. Future studies will further evaluate the treatment using naturally degraded archeological wood.
Third, although the moisture uptake of the treated specimens was evaluated under 85% RH for 230 h, the present study did not assess the long-term stability of PEG within the wood. In particular, possible PEG migration or redistribution during prolonged exposure to high relative humidity or repeated wetting and drying cycles was not investigated. Therefore, the long-term retention of PEG and the dimensional stability of the treated wood under fluctuating environmental conditions remain to be further clarified. Future studies should evaluate PEG migration and redistribution, together with the associated dimensional changes, during prolonged high-humidity exposure and repeated wetting and drying cycles.

4. Conclusions

In this study, artificially aged waterlogged wood was used as the model material. A Box–Behnken response surface design was employed, with Sv after freeze drying as the response, to optimize the molecular weights and solution mass fractions of low- and high-molecular-weight PEG and to determine the optimal parameter combination for PEG impregnation in two stages. On this basis, the effects of different PEG treatment methods were comprehensively evaluated in terms of chemical structure and crystalline phase characteristics, PEG spatial distribution, WPG, macroscopic appearance, color, microstructure, dimensional stability, moisture stability, and relative bending performance. The main conclusions are as follows:
  • After hydrothermal treatment with 3 wt.% NaOH, the MWC of the wood increased from 154.5% to 526.3%, while the BD decreased from 0.433 g/cm3 to 0.162 g/cm3. Meanwhile, the hemicellulose and lignin contents decreased markedly, whereas the relative proportion of cellulose and CrI increased. These results indicate that the prepared artificially aged waterlogged wood exhibited clear characteristics of severe degradation and could serve as a model material for subsequent PEG impregnation and freeze-drying treatment.
  • The Box–Behnken response surface analysis showed that the established quadratic regression model had good fitting performance and predictive reliability. The interactions between the molecular weight of low-molecular-weight PEG and its solution mass fraction, as well as between the molecular weight of high-molecular-weight PEG and its solution mass fraction, had significant effects on Sv. A 35.7 wt.% PEG600 solution and a 37.5 wt.% PEG6000 solution were ultimately identified as the optimal parameter combination for impregnation in two stages. Under this parameter combination, the model predicted an Sv of 2.34%, while the validation experiment yielded an Sv of 2.43%.
  • PEG with different molecular weights exhibited different spatial distribution characteristics within the wood. PEG600 was distributed mainly in the cell wall regions, whereas PEG6000 was distributed in the cell wall regions and some cell lumen regions, with relatively pronounced enrichment in some lumina. After PEG600/PEG6000 treatment in two stages, the spatial distribution of PEG within the wood cellular structure tended to become more uniform. The treatment group in two stages also exhibited relatively well-preserved macroscopic morphology and good microstructural preservation, with a total color difference of ΔE* = 8.83, indicating a relatively small overall color change.
  • PEG600/PEG6000 treatment in two stages improved the overall performance of artificially aged waterlogged wood after freeze drying. This group exhibited the lowest Sv, at 2.43%, and the highest ASE, at 82.91%. After exposure to 85% RH for 230 h, its moisture uptake was 14.3%, lower than the 17.7% of the water control group. Its bending strength reached 12.97 MPa, representing an increase of 67.79% compared with the water control group. Overall, PEG treatment in two stages improved dimensional stability while also maintaining favorable moisture stability and relative bending performance, resulting in good overall treatment performance.

Author Contributions

Conceptualization, M.N.; methodology, M.N. and J.Q.; formal analysis, M.N. and J.Q.; investigation, M.N.; resources, J.Z. and H.L.; writing—original draft preparation, M.N.; supervision, J.Z. and H.L.; funding acquisition, J.Z. All authors have read and agreed to the published version of the manuscript.

Funding

This research was funded by the Central Government-Guided Local Science and Technology Development Fund Project, grant number 2024ZY-JCYJ-04-06; the Shaanxi Province Technology Innovation Guidance Special Project, grant number 2024QY-SZX-04; and the National Natural Science Foundation of China, grant number U2574210.

Data Availability Statement

The raw data supporting the conclusions of this article will be made available by the authors on request.

Conflicts of Interest

The authors declare no conflicts of interest.

References

  1. Kim, Y. Evaluating environmental factors using microclimate survey and computer fluid dynamics analysis of Korean traditional wooden architectural cultural heritage: Focusing on the Kim Myeong-KwanGotaek. Herit. Sci. 2023, 11, 100. [Google Scholar] [CrossRef] [Scilit]
  2. Gadd, G.M.; Fomina, M.; Pinzari, F. Fungal biodeterioration and preservation of cultural heritage, artwork, and historical artifacts: Extremophily and adaptation. Microbiol. Mol. Biol. Rev. 2024, 88, e00200-22. [Google Scholar] [CrossRef] [Scilit] [PubMed]
  3. Chen, J.; Liu, S.; Yin, L.; Cao, H.; Xi, G.; Zhang, Z.; Liu, J.; Luo, R.; Han, L.; Yin, Y.; et al. Non-destructive preservation state estimation of waterlogged archaeological wooden artifacts. Spectrochim. Acta A Mol. Biomol. Spectrosc. 2023, 285, 121840. [Google Scholar] [CrossRef] [Scilit] [PubMed]
  4. Broda, M.; Jakes, J.E.; Li, L.; Antipova, O.A. Archeological wood conservation with selected organosilicon compounds studied by XFM and nanoindentation. Wood Sci. Technol. 2023, 57, 1277–1298. [Google Scholar] [CrossRef] [Scilit]
  5. Han, L.; Guo, J.; Tian, X.; Jiang, X.; Yin, Y. Evaluation of PEG and sugars consolidated fragile waterlogged archaeological wood using nanoindentation and ATR-FTIR imaging. Int. Biodeterior. Biodegrad. 2022, 170, 105390. [Google Scholar] [CrossRef] [Scilit]
  6. Braovac, S.; Kutzke, H. The presence of sulfuric acid in alum-conserved wood—Origin and consequences. J. Cult. Herit. 2012, 13, S203–S208. [Google Scholar] [CrossRef] [Scilit]
  7. Broda, M.; Mazela, B.; Radka, K. Methyltrimethoxysilane as a stabilising agent for archaeological waterlogged wood differing in the degree of degradation. J. Cult. Herit. 2019, 35, 129–139. [Google Scholar] [CrossRef] [Scilit]
  8. Mastouri, A.; Efhamisisi, D.; Tarmian, A.; Esposito Corcione, C.; Gholinejad Pirbazari, A. Silanes for conservation of archaeological woods using modeled birch wood: Antifungal, physical-chemical and TGA studies. Sci. Rep. 2025, 15, 28815. [Google Scholar] [CrossRef] [Scilit] [PubMed]
  9. Yang, T.; Mei, C. Effects of hemicellulose removal combined with polyethylene glycol impregnation on dimensional stability of wood. Wood Mater. Sci. Eng. 2023, 18, 933–942. [Google Scholar] [CrossRef] [Scilit]
  10. Christ, M.; Flaig, N.; Müller, M. Influence of polyethylene glycol and various carboxylic acids on the physical and mechanical properties of beech wood (Fagus sylvatica) and Scots pine wood (Pinus sylvestris). Wood Mater. Sci. Eng. 2025, 20, 361–381. [Google Scholar] [CrossRef] [Scilit]
  11. Walsh, Z.; Janeček, E.R.; Jones, M.; Scherman, O.A. Natural polymers as alternative consolidants for the preservation of waterlogged archaeological wood. Stud. Conserv. 2017, 62, 173–183. [Google Scholar] [CrossRef] [Scilit]
  12. Stelzner, I.; Stelzner, J.; Fischer, B.; Hamann, E.; Zuber, M.; Schuetz, P. A multi-technique and multiscale comparative study on the efficiency of conservation methods for the stabilisation of waterlogged archaeological pine. Sci. Rep. 2024, 14, 8681. [Google Scholar] [CrossRef] [Scilit] [PubMed]
  13. Stelzner, J.; Gwerder, D.; Pohmann, R.; Schuetz, P.; Muskalla, W.; Wittköpper, M.; Schmidt-Ott, K.; Stelzner, I. Stabilisation of waterlogged archaeological wood: The analysis of structural and dimensional changes of different conservation methods using magnetic resonance imaging and X-ray micro-computed tomography. Sci. Rep. 2025, 15, 38481. [Google Scholar] [CrossRef] [Scilit] [PubMed]
  14. Jensen, P.; Schnell, U. The implications of using low molecular weight PEG for impregnation of waterlogged archaeological wood prior to freeze drying. In Proceedings of the 9th ICOM Group on Wet Organic Archaeological Materials Conference, Copenhagen, Denmark, 7–11 June 2004; Hoffmann, P., Strætkvern, K., Spriggs, J.A., Gregory, D., Eds.; ICOM: Bremerhaven, Germany, 2005; pp. 279–308. [Google Scholar]
  15. Stelzner, J.; Stelzner, I.; Martinez-Garcia, J.; Gwerder, D.; Wittköpper, M.; Muskalla, W.; Cramer, A.; Heinz, G.; Egg, M.; Schuetz, P. Stabilisation of waterlogged archaeological wood: The application of structured-light 3D scanning and micro computed tomography for analysing dimensional changes. Herit. Sci. 2022, 10, 60. [Google Scholar] [CrossRef] [Scilit] [PubMed]
  16. Cook, C.; Grattan, D.W. A method of calculating the concentration of PEG for freeze-drying waterlogged wood. In Proceedings of the 4th ICOM-CC Group on Wet Organic Archaeological Materials Conference; Hoffmann, P., Ed.; ICOM-CC: Bremerhaven, Germany, 1990; pp. 239–252. [Google Scholar]
  17. Liu, X.; Tu, X.; Ma, W.; Zhang, C.; Huang, H.; Varodi, A.M. Consolidation and dehydration of waterlogged archaeological wood from Site Huaguangjiao No.1. Forests 2022, 13, 1919. [Google Scholar] [CrossRef] [Scilit]
  18. Stagno, V.; Mankinen, O.; Mailhiot, S.; Telkki, V.-V.; Capuani, S. Comprehensive characterization of waterlogged archaeological wood by NMR relaxometry, diffusometry, micro-imaging and cryoporometry. Phys. Chem. Chem. Phys. 2024, 26, 27189–27208. [Google Scholar] [CrossRef] [Scilit] [PubMed]
  19. Zhou, Y.; Du, J.; Wang, X.; Zhang, W.; Wang, K.; Han, X.; Li, N. Cocktail therapy for waterlogged archaeological wood: Improving the effectiveness of PEG on air-drying by adding APTES and trifluoromethyl phenylboronic acid. npj Herit. Sci. 2025, 13, 625. [Google Scholar] [CrossRef] [Scilit]
  20. Majka, J.; Zborowska, M.; Fejfer, M.; Waliszewska, B.; Olek, W. Dimensional stability and hygroscopic properties of PEG treated irregularly degraded waterlogged Scots pine wood. J. Cult. Herit. 2018, 31, 133–140. [Google Scholar] [CrossRef] [Scilit]
  21. Kılıç, N.; Kılıç, A.G. Evaluation of the polyethylene glycol impregnation and vacuum freeze-drying method for waterlogged archaeological wood: Conservation of the Yenikapı 1 shipwreck. Stud. Conserv. 2024, 69, 336–347. [Google Scholar] [CrossRef] [Scilit]
  22. Wang, Y.; Liu, L.; Wu, S.; Li, Z.; Ma, Q. Reassessment of the Penglai III shipwreck and reflections on the wooden artifacts conservation. npj Herit. Sci. 2025, 13, 196. [Google Scholar] [CrossRef] [Scilit]
  23. Babiński, L. Investigations on pre-treatment prior to freeze-drying of archaeological pine wood with abnormal shrinkage anisotropy. J. Archaeol. Sci. 2011, 38, 1709–1715. [Google Scholar] [CrossRef] [Scilit]
  24. GB/T 1927.4-2021; Test Methods for Physical and Mechanical Properties of Small Clear Wood Specimens—Part 4: Determination of Moisture Content. Standards Press of China: Beijing, China, 2021.
  25. GB/T 1927.5-2021; Test Methods for Physical and Mechanical Properties of Small Clear Wood Specimens—Part 5: Determination of Density. Standards Press of China: Beijing, China, 2021.
  26. Kılıç, N. Determining the condition of waterlogged archaeological woods and iron nails from the Yenikapı 17 shipwreck using multiple analytical techniques. npj Herit. Sci. 2025, 13, 64. [Google Scholar] [CrossRef] [Scilit]
  27. Babiński, L.; Izdebska-Mucha, D.; Waliszewska, B. Evaluation of the state of preservation of waterlogged archaeological wood based on its physical properties: Basic density vs. wood substance density. J. Archaeol. Sci. 2014, 46, 372–383. [Google Scholar] [CrossRef] [Scilit]
  28. Li, W.; Lin, Y.-C.J.; Chen, Y.-L.; Zhou, C.; Li, S.; De Ridder, N.; Oliveira, D.M.; Zhang, L.; Zhang, B.; Wang, J.P.; et al. Woody plant cell walls: Fundamentals and utilization. Mol. Plant 2024, 17, 112–140, Erratum in Mol. Plant 2025, 18, 909–910. [Google Scholar] [CrossRef] [Scilit] [PubMed]
  29. Barnett, J.R.; Bonham, V.A. Cellulose microfibril angle in the cell wall of wood fibres. Biol. Rev. 2004, 79, 461–472. [Google Scholar] [CrossRef] [Scilit] [PubMed]
  30. Koskela, S.; Zha, L.; Wang, S.; Yan, M.; Zhou, Q. Hemicellulose content affects the properties of cellulose nanofibrils produced from softwood pulp fibres by LPMO. Green Chem. 2022, 24, 7137–7147. [Google Scholar] [CrossRef] [Scilit]
  31. Qin, S.; Chen, Y.; Tao, S.; Zhang, C.; Qin, X.; Chen, P.; Qi, H. High recycling performance of holocellulose paper made from sisal fibers. Ind. Crops Prod. 2022, 176, 114389. [Google Scholar] [CrossRef] [Scilit]
  32. Le Normand, M.; Moriana, R.; Ek, M. Structural features of lignin–hemicellulose–pectin orchestrate a tailored enzyme cocktail for potential applications in bark biorefineries. Green Chem. 2023, 25, 5660–5676. [Google Scholar] [CrossRef] [Scilit]
  33. Liu, D.; Qian, J.; Xu, J.; Carpita, N.C.; McCann, M.C.; Yang, H. Pectin-associated mannans and xylans play distinct roles in cell-cell adhesion in pine and poplar wood. Ind. Crops Prod. 2022, 184, 115054. [Google Scholar] [CrossRef] [Scilit]
  34. Yi, L.; Cao, K.; Hess, D.W.; Zhang, L.; Chai, X.; Xu, K.; Xie, L. Solvent- and catalyst-free in situ esterification of citric acid and mannitol: Synergistically enhancing the dimensional stability and mechanical strength of poplar wood. Forests 2026, 17, 551. [Google Scholar] [CrossRef] [Scilit]
  35. Ebaid, M.; El-dek, S.I.; Shehata, N. Sustainable cellulose nanofibers for management of pharmaceutical residues in water. Arab. J. Sci. Eng. 2025, 50, 20825–20850. [Google Scholar] [CrossRef] [Scilit]
  36. Su, Y.; Wang, L.; Yao, Z.; Zhang, Q.; Chen, Z.; Duan, J.; Ye, T.; Yao, J. Hybrid laser cleaning of carbon deposits on N52B30 engine piston crowns: Multi-objective optimization via response surface methodology. Materials 2025, 18, 3626. [Google Scholar] [CrossRef] [Scilit] [PubMed]
  37. Esteves, B.; Velez Marques, A.; Domingos, I.; Pereira, H. Chemical changes of heat treated pine and eucalypt wood monitored by FTIR. Maderas Cienc. Tecnol. 2013, 15, 245–258. [Google Scholar] [CrossRef] [Scilit]
  38. Qin, Y.; Chen, K.; Zhang, H.; Luo, X.; Liang, S.; Tian, C.; Wang, J.; Zhang, L. Structure-property correlation of poly(ethylene glycol)-based form-stable phase change materials with different crosslinking structure. Sol. Energy Mater. Sol. Cells 2019, 203, 110192. [Google Scholar] [CrossRef] [Scilit]
  39. Stern, T. Deciphering the triple-peak C-O-C stretching FTIR absorbance consistently occurring in semicrystalline PEG. Polymers 2025, 17, 2199. [Google Scholar] [CrossRef] [Scilit] [PubMed]
  40. Gullapalli, R.P.; Mazzitelli, C.L. Polyethylene glycols in oral and parenteral formulations: A critical review. Int. J. Pharm. 2015, 496, 219–239. [Google Scholar] [CrossRef] [Scilit] [PubMed]
  41. Pecoraro, E.; Macchioni, N.; Musina, G.; Cantisani, E.; Longo, S.; Novello, M.; Pizzo, B. Investigations into the efflorescence of the treated wood of the Iulia Felix Roman wreck and effects of environmental conditions on its state. Forests 2026, 17, 627. [Google Scholar] [CrossRef] [Scilit]
  42. Xu, X.; Garemark, J.; Ram, F.; Wang, Z.; Li, Y. Metallic wood through deep-cell-wall metallization: Synthesis and applications. ACS Appl. Mater. Interfaces 2024, 16, 22433–22442. [Google Scholar] [CrossRef] [Scilit] [PubMed]
  43. Sknepnek, A.; Filipović, S.; Pavlović, V.B.; Mirković, N.; Miletić, D.; Gržetić, J.; Mirković, M. Effects of synthesis parameters on structure and antimicrobial properties of bacterial cellulose/hydroxyapatite/TiO2 polymer–ceramic composite material. Polymers 2024, 16, 470. [Google Scholar] [CrossRef] [Scilit] [PubMed]
  44. Fülöp, I.; Gyéresi, Á.; Szabó-Révész, P.; Aigner, Z. Solid dispersions of flufenamic acid with PEG 4000 and PEG 6000. Farmacia 2011, 59, 60–69. [Google Scholar]
  45. Shang, M.; Wei, Y.; Zhou, H.; Wu, T.; Wang, K.; Chen, H.; Fang, B.; Zhao, Y. Study on aging behavior of polyethylene glycol under three wavelengths of ultraviolet light irradiation. RSC Adv. 2023, 13, 34576–34586. [Google Scholar] [CrossRef] [Scilit] [PubMed]
  46. Marlina, D.; Novita, M.; Anwar, M.T.; Kusumo, H.; Sato, H. Raman spectra of polyethylene glycol/cellulose acetate butyrate biopolymer blend. J. Phys. Conf. Ser. 2021, 1869, 012006. [Google Scholar] [CrossRef] [Scilit]
  47. Tewes, T.J.; Kaba, A.; Schacher, F.H.; Bockmühl, D.P. A combined Raman spectroscopy and chemometrics study of the interaction of water-soluble polymers with microorganisms. Spectrosc. J. 2025, 3, 7. [Google Scholar] [CrossRef] [Scilit]
  48. Abreu-Rejón, A.D.; Herrera-Kao, W.; May-Pat, A.; Ávila-Ortega, A.; Rodríguez-Fuentes, N.; Uribe-Calderón, J.A.; Cervantes-Uc, J.M. Effect of PEG grafting density on surface properties of polyurethane substrata and the viability of osteoblast and fibroblast cells. J. Mater. Sci. Mater. Med. 2022, 33, 45. [Google Scholar] [CrossRef] [Scilit] [PubMed]
  49. Jones, S.P.P.; Slater, N.K.H.; Jones, M.; Ward, K.; Smith, A.D. Investigating the processes necessary for satisfactory freeze-drying of waterlogged archaeological wood. J. Archaeol. Sci. 2009, 36, 2177–2183. [Google Scholar] [CrossRef] [Scilit]
  50. Reinprecht, L.; Repák, M. Beech wood thermally modified in the melt of polyethylene glycol. BioResources 2022, 17, 652–672. [Google Scholar] [CrossRef] [Scilit]
  51. Wu, W.; Supper, M.; Rausch, M.H.; Kaspereit, M.; Fröba, A.P. Mutual diffusivities of binary mixtures of water and poly(ethylene) glycol from heterodyne dynamic light scattering. Int. J. Thermophys. 2022, 43, 177. [Google Scholar] [CrossRef] [Scilit]
  52. Abbasov, H. Hydration numbers of polyethylene glycols based on a new viscosity model. ChemistrySelect 2023, 8, e202301576. [Google Scholar] [CrossRef] [Scilit]
  53. Liu, R.; Sun, Y.; Meng, F.; Wang, Y.; Zhai, F.; Li, Q. The effect of hemicellulose pre-extraction on the wood viscoelasticity and its implications on the fiber separation mechanism in chemi-mechanical pulping. Biomass Bioenergy 2023, 177, 106949. [Google Scholar] [CrossRef] [Scilit]
  54. Wang, X.; Shi, S.Q. Bioinspired self-flowing wood chemical treatment. Nat. Commun. 2025, 16, 542. [Google Scholar] [CrossRef] [Scilit] [PubMed]
  55. Servesh, A.; Kumar, S.L.; Govindaraju, S.; Tabassum, S.; Prasad, J.R.; Kumar, N.; Ramaraj, S.G. Recent advances in polyethylene glycol as a dual-functional agent in heterocycle synthesis: Solvent and catalyst. Polym. Adv. Technol. 2024, 35, e6433. [Google Scholar] [CrossRef] [Scilit]
  56. Villani, E.; Popescu, C.-M.; Jancelewicz, M.; Stagno, V.; Capuani, S.; Broda, M. Sodium alginate as a green consolidant for waterlogged wood—A preliminary study. Forests 2025, 16, 325. [Google Scholar] [CrossRef] [Scilit]
  57. Li, J.; Ma, E. The influence of partial chemical component removal on water state at high relative humidity and cell wall saturation state. Ind. Crops Prod. 2023, 200, 116878. [Google Scholar] [CrossRef] [Scilit]
  58. Wang, Q.; Feng, X.; Liu, X. Advances in historical wood consolidation and conservation materials. BioResources 2023, 18, 6680–6723. [Google Scholar] [CrossRef] [Scilit]
  59. Guo, D.; Guo, N.; Fu, F.; Yang, S.; Li, G.; Chu, F. Preparation and mechanical failure analysis of wood-epoxy polymer composites with excellent mechanical performances. Compos. Part B Eng. 2022, 235, 109748. [Google Scholar] [CrossRef] [Scilit]
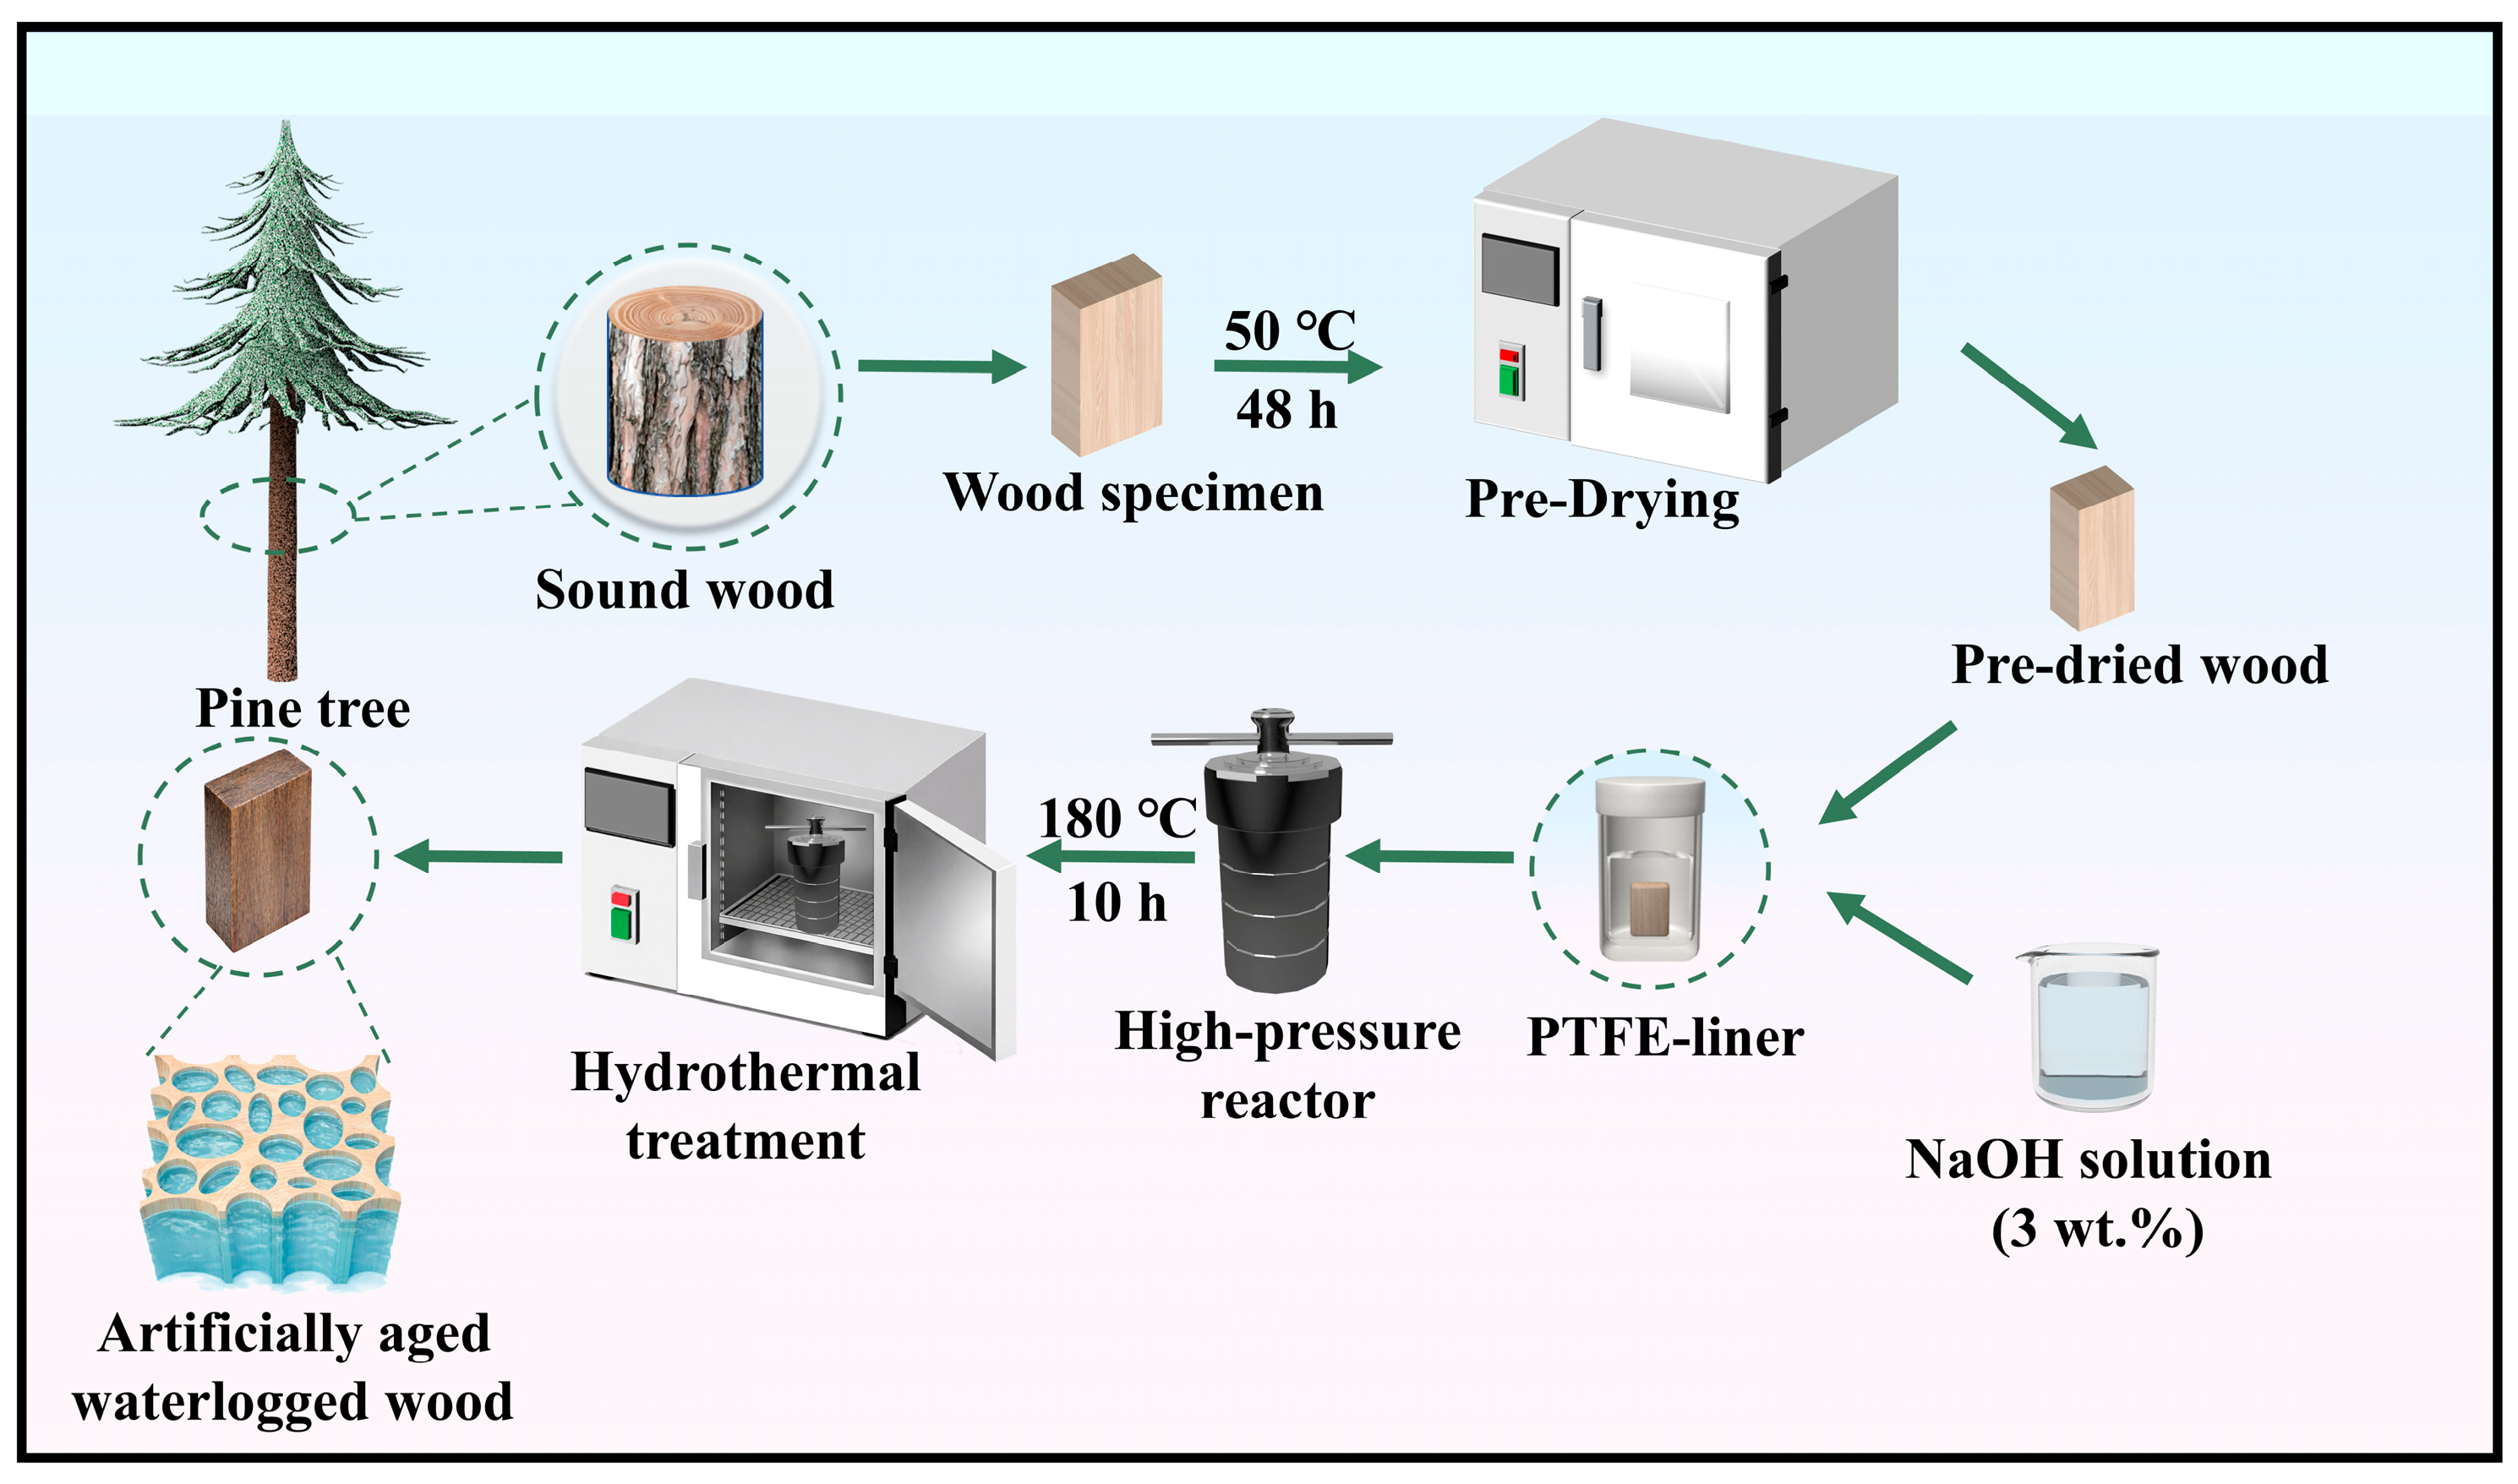
Figure 1. Preparation procedure for artificially aged waterlogged wood specimens.
Forests 17 01200 g001
Figure 2. Characterization of the degradation state of unaged wood and artificially aged waterlogged wood: (a) basic density and maximum water content; (b) chemical composition; (c) relative crystallinity index of cellulose; (d) X-ray diffraction patterns.
Forests 17 01200 g002
Figure 3. Fitting performance and residual diagnostics of the Sv response surface model: (a) relationship between model predicted and experimental values; where the square symbols represent the data points and the solid line indicates equal predicted and experimental values; (b) distribution of model residuals.
Forests 17 01200 g003
Figure 4. Response surface and contour plots showing the effects of interactions among different factors on Sv: (a,a1) interaction between A and B; (b,b1) interaction between A and C; (c,c1) interaction between A and D; (d,d1) interaction between B and C; (e,e1) interaction between B and D; (f,f1) interaction between C and D. Panels (a–f) show the response surface plots, and panels (a1–f1) show the corresponding contour plots. The color gradient represents the magnitude of Sᵥ, with blue indicating lower values and red indicating higher values.
Forests 17 01200 g004
Figure 5. FTIR spectra and XRD patterns of specimens subjected to different treatment methods: (a) FTIR spectra; (b) XRD patterns.
Forests 17 01200 g005
Figure 6. Raman characterization of specimens subjected to different PEG treatment methods: (a) Raman mapping image of the PEG600 group; (b) Raman mapping image of the PEG6000 group; (c) Raman mapping image of the PEG600/PEG6000 treatment group in two stages; (d) Raman spectra. The red plus symbols in panels (a–c) indicate the selected locations from which the displayed Raman spectra were obtained.
Forests 17 01200 g006
Figure 7. Macroscopic appearance of the radial and transverse surfaces of specimens after freeze drying under different treatment methods, together with (a) WPG and (b) color differences relative to the water control group.
Forests 17 01200 g007
Figure 8. Transverse surface microstructure of specimens after freeze drying under different treatment methods, together with (a) average cell wall thickness and (b) cell wall thickness nonuniformity coefficient.
Forests 17 01200 g008
Figure 9. Shrinkage and dimensional stability of specimens after freeze drying under different treatment methods: (a) volume shrinkage (Sv), longitudinal shrinkage (SL), radial shrinkage (SR), and tangential shrinkage (ST) and (b) anti-shrink efficiency (ASE).
Forests 17 01200 g009
Figure 10. Moisture uptake of specimens after freeze drying under different treatment methods at 85% RH.
Forests 17 01200 g010
Figure 11. Bending strength of specimens after freeze drying under different treatment methods. Data are presented as mean ± standard deviation (n = 3).
Forests 17 01200 g011
Table 1. Factors and coded levels used in the response surface design.
FactorSymbolLow Level (−1)Center Level (0)High Level (+1)
Low-molecular-weight PEG grade APEG400PEG600PEG800
High-molecular-weight PEG grade BPEG4000PEG6000PEG8000
Low-molecular-weight PEG solution concentration (wt.%)C293541
High-molecular-weight PEG solution concentration (wt.%)D283644
Table 2. Box–Behnken experimental design matrix and Sv results.
No.ABC (wt.%)D (wt.%)Sv (%)
1400400035363.30
2800400035363.41
3400800035363.09
4800800035363.22
5600600029283.47
6600600041283.34
7600600029443.28
8600600041443.08
9400600035283.29
10800600035283.37
11400600035442.99
12800600035443.15
13600400029363.32
14600800029363.21
15600400041363.21
16600800041363.04
17400600029363.45
18800600029363.17
19400600041362.91
20800600041363.43
21600400035283.34
22600800035283.57
23600400035443.39
24600800035442.83
25600600035362.41
26600600035362.37
27600600035362.32
28600600035362.30
Table 3. Analysis of variance and model evaluation for the Sv model.
SourceSum of SquaresDegrees of FreedomMean SquareF-Valuesp-Values
Model3.49140.249473.67<0.0001
A0.043210.043212.760.0034
B0.085010.085025.110.0002
C0.066010.066019.500.0007
D0.229610.229667.83<0.0001
AB0.000110.00010.02950.8662
AC0.160010.160047.26<0.0001
AD0.001610.00160.47260.5039
BC0.000910.00090.26590.6148
BD0.156010.156046.09<0.0001
CD0.001210.00120.36190.5578
A21.1011.10325.18<0.0001
B21.2011.20354.27<0.0001
C21.1911.19350.32<0.0001
D21.3211.32388.75<0.0001
Residual0.0440130.0034
Lack of Fit0.0366100.00371.480.4125
R20.9876Predicted R20.9366C.V. (%)1.87
Adjusted R20.9741Adeq Precision27.4056Standard deviation0.0582
Disclaimer/Publisher’s Note: The statements, opinions and data contained in all publications are solely those of the individual author(s) and contributor(s) and not of MDPI and/or the editor(s). MDPI and/or the editor(s) disclaim responsibility for any injury to people or property resulting from any ideas, methods, instructions or products referred to in the content.