Article

Predicting Climate-Driven Habitat Suitability and Identifying Environmental Associations of Ancient Trees of Four Dominant Ficus Species on Hainan Island, China

1
School of Tropical Agriculture and Forestry, Hainan University, Haikou 570228, China
2
Hainan Academy of Forestry (Hainan Academy of Mangrove), Haikou 571100, China
3
Haikou Wetland Protection Engineering Technology Research and Development, Haikou 571100, China
4
Central-South Forestry and Planning Institute, National Forestry and Grassland Administration, Changsha 410014, China
*
Authors to whom correspondence should be addressed.
Forests 2026, 17(10), 1174; https://doi.org/10.3390/f17101174
Submission received: 11 August 2026 / Revised: 20 September 2026 / Accepted: 24 September 2026 / Published: 1 October 2026
(This article belongs to the Special Issue Modeling of Forest Dynamics and Species Distribution)

Abstract

Hainan Island supports abundant tropical ancient Ficus trees owing to its distinctive hydrothermal conditions and long-term human–environment interactions, yet the environmental factors associated with their distributions and responses to future climate change remain insufficiently understood. This study focused on the ancient trees of four dominant Ficus species on Hainan Island—Ficus microcarpa, F. altissima, F. benjamina, and F. virens—using systematically surveyed occurrence records and 59 candidate variables representing climate, soil, topography, anthropogenic activity, and typhoon disturbance. Two parameter-optimized MaxEnt frameworks were developed. The Environmental Association Model (EAM) incorporated climatic, soil, topographic, anthropogenic, and typhoon-related variables to identify factors associated with the current distributions of these ancient trees, whereas the Natural-Environment Projection Model (NEPM) included climatic, soil, and topographic variables to estimate potential habitat suitability under current conditions and SSP126 and SSP585 scenarios for the 2050s and 2070s; only climatic variables were updated in future projections. Under the EAM framework, population density was the key variable associated with the modeled distributions of all four ancient-tree groups, accounting for 65.3%, 46.1%, 39.6%, and 26.3% of the model contribution for ancient F. microcarpa, F. altissima, F. benjamina, and F. virens, respectively. Climatic and soil variables showed species-specific effects; topographic variables contributed mainly to ancient F. altissima and F. virens, whereas typhoon impact intensity contributed only slightly to ancient F. benjamina. Under current climatic conditions, total suitable habitat ranged from 7771.31 to 10,489.97 km2. Ancient F. microcarpa had the largest total suitable area, ancient F. benjamina the smallest, and ancient F. altissima the largest highly suitable area. Highly suitable habitats were concentrated mainly in northern and northwestern Hainan, with scattered central patches. Under future scenarios, the total and highly suitable habitats of ancient F. benjamina generally expanded, particularly under SSP585. In contrast, those of ancient F. microcarpa, F. altissima, and F. virens generally contracted, with substantial losses of highly suitable habitat; ancient F. virens faced the greatest habitat-loss risk. SSP585 intensified contraction for ancient F. microcarpa and F. virens, whereas ancient F. altissima showed more complex, scenario-dependent changes. Sensitivity analyses using alternative regularization settings supported these overall trends. These findings support conservation zoning, habitat restoration, germplasm preservation, and climate-adaptive management of ancient Ficus trees on Hainan Island.

1. Introduction

Ancient trees are defined as those 100 years and older, excluding individuals in man-made commercial forests intended mainly for timber. Trees aged 100–299 years are considered Grade III, those 300–499 years as Grade II, and trees 500 years and older as Grade I [1]. Ancient trees are not only “green cultural relics” that preserve information on climate change and vegetation evolution in terrestrial ecosystems [2], but also important carriers for maintaining ecosystem stability [3], conserving biodiversity [4], and transmitting regional culture [5,6]. They therefore possess irreplaceable ecological, scientific, cultural, and landscape values.
Hainan Island supports some of the densest and most diverse tropical rainforests among China’s islands. These forests remain relatively well preserved and represent an important reservoir of tropical biodiversity and genetic resources [7]. Due to Hainan’s unique island biogeography, varied topography, and heterogeneous hydrothermal conditions, the island provides an ideal environment for the evolution and growth of Ficus species. This has resulted in the formation of abundant and highly diverse tropical ancient Ficus resources. However, the rapid development of the Hainan Free Trade Port, accelerated regional urbanization, intensifying human activities, and the increasing frequency of extreme weather events such as typhoons and thunderstorms have placed ancient Ficus trees on Hainan Island under increasing pressure, resulting in habitat fragmentation, declining tree growth, and greater human disturbance [8]. Some individuals have shown signs of growth decline and health deterioration [9]. As human activities become more frequent, climate change intensifies, and natural disasters recur, the scientific and effective conservation of ancient Ficus trees has become an urgent priority.
In recent years, species distribution models have become important tools in biogeographical research and have been widely applied in biodiversity conservation under global environmental change [10]. Among these models, MaxEnt is one of the most commonly used ecological niche models because of its high predictive accuracy, stability, and computational efficiency [11,12,13]. It has been widely used to predict and evaluate the suitable habitats of various tree species, such as Cupressus gigantea, Rhus typhina, Acer mandshuricum, Robinia pseudoacacia, and Pinus massoniana [14,15,16,17,18]. These studies have demonstrated that MaxEnt can effectively identify potential suitable habitats and key environmental factors influencing habitat suitability, thereby providing scientific support for tree species conservation and ecological management.
With increasing attention to ancient tree conservation in China, some scholars have applied MaxEnt to predict the suitable habitat distribution of ancient trees and to identify the major environmental factors affecting their habitat suitability [19,20,21,22]. For example, previous studies have selected ancient tree species from Qinghai Province, Hainan Island, and the Yangtze River Basin to analyze their suitable habitat distribution and major influencing factors. These studies indicate that species distribution models are useful for understanding the spatial distribution patterns of ancient trees and for supporting targeted conservation and management. However, existing studies have mainly focused on resource inventories or single-region assessments, while systematic assessments of habitat suitability and environmental variables influencing ancient Ficus trees remain limited.
Hainan Island is rich in ancient tree resources; however, relevant studies remain relatively limited. Existing studies have primarily examined the current condition of ancient tree resources [23,24,25], whereas studies on the environmental associations and climate-driven habitat suitability of ancient Ficus trees remain limited. Moreover, conventional species distribution models generally assume an equilibrium between species occurrence and environmental conditions, which may not hold for ancient trees because their present distributions also reflect historical planting, cultural protection, settlement history, and land-use change [26,27,28]. Consequently, models based solely on natural environmental predictors may inadequately represent ancient-tree occurrence and should not be directly interpreted as species-level climatic niches. To address this limitation, this study used two complementary MaxEnt frameworks: an Environmental Association Model (EAM), which incorporated climatic, soil, topographic, anthropogenic, and typhoon-related variables to identify environmental associations with current ancient-tree occurrence, and a Natural-Environment Projection Model (NEPM), which used climatic, soil, and topographic variables to estimate climate-driven potential habitat suitability under current and future scenarios. Accordingly, this study employed MaxEnt v3.4.4 and ArcGIS 10.8, with the ancient trees of four dominant Ficus species on Hainan Island as study species. Specifically, this study aimed to answer two questions: (1) which environmental variables are most strongly associated with their current occurrence, and (2) how their suitable habitats may change under current and future climate scenarios. To address these questions, we evaluated five categories of environmental variables, including climatic, soil, topographic, anthropogenic, and typhoon-related variables. This study further identified the key environmental variable for each of the four dominant Ficus species and analyzed species-specific changes in the area and spatial distribution of suitable habitats under current climatic conditions and future climate scenarios. The results provide a scientific basis for habitat conservation and management and offer practical guidance for the systematic conservation of ancient Ficus trees and tropical ancient tree resources in Hainan Province.

2. Materials and Methods

2.1. Overview of the Study Area

The research site is Hainan Island, an island situated in the northern part of the South China Sea, ranging from 18°10′ to 20°10′ N and 108°37′ to 111°03′ E. The island covers an area of approximately 33,900 km2 [29], making it the second largest island in China and an administrative part of Hainan Province. This figure corresponds to the administrative boundary of Hainan Island, which was used as the modeling mask in this study. This island has a mountainous central region, while the surrounding coastal regions are at lower elevations, with Wuzhi Mountain and Yingge Ridge forming the two main uplift zones. The topography of the island shows a characteristic concentric and stratified arrangement, mainly consisting of mountains, hills, terraces, and plains. Hainan Island has a tropical monsoon climate [30], characterized by warm conditions throughout the year, the absence of a distinct cold season, abundant rainfall and heat occurring in the same season, distinct dry and wet seasons, and rich hydrothermal resources. These favorable environmental conditions have supported the development of abundant ancient tree resources. According to the second survey of ancient and notable trees in Hainan Province, a total of 18,755 ancient and notable trees were recorded [9]. Among them, 6619 were ancient Ficus trees, accounting for 35.29% of the total.

2.2. Research Methods

2.2.1. Collection and Processing of Distribution Data for the Ancient Trees of Four Dominant Ficus Species

In this study, the ancient trees of four dominant Ficus species were selected as focal species, including Ficus microcarpa (3589 individuals), Ficus altissima (1982 individuals), Ficus benjamina (577 individuals), and Ficus virens (325 individuals), which together accounted for 6473 trees, or approximately 97.79% of all 6619 ancient Ficus trees recorded on Hainan Island. The occurrence records of these ancient trees were obtained from the Second National Survey of Ancient and Notable Trees in China, based on the systematic census conducted by the forestry authorities of Hainan Province. The occurrence records of each species were imported into ArcGIS 10.8, and records located outside the administrative boundary of Hainan Island were removed. To reduce the influence of spatial clustering and spatial autocorrelation caused by uneven recording density, the “Trim duplicate occurrences” tool in ENMTools v1.3 was applied [31], and only one ancient-tree occurrence record was retained within each 30″ × 30″ grid cell. The final numbers of occurrence records used for model construction were 1714 for ancient F. microcarpa, 1138 for ancient F. altissima, 365 for ancient F. benjamina, and 214 for ancient F. virens (Figure 1). Because MaxEnt is a presence-only modeling framework, these occurrence records were treated as presence-only data, and no abundance weighting was applied. Although this procedure reduced spatial aggregation among occurrence records, it could not completely eliminate potential sampling-accessibility bias.

2.2.2. Collection and Processing of Environmental Variable Data

In this study, 59 candidate environmental variables were initially selected (Table 1), including 19 climatic variables, 34 soil variables, 2 topographic variables, 3 human activity variables, and 1 typhoon-related variable. The climatic data used for modeling included bioclimatic variables for the current period (1970–2000) and two future periods: 2041–2060 (2050s) and 2061–2080 (2070s), all with a spatial resolution of 30″. For future climate conditions, two shared socioeconomic pathway scenarios, SSP126 and SSP585, from the BCC-CSM2-MR model under the CMIP6 framework were selected. BCC-CSM2-MR was developed by the Beijing Climate Center of the China Meteorological Administration and performs well in simulating the East Asian monsoon and regional climate over China. This study used BCC-CSM2-MR as a single GCM for future projections; therefore, the future projections are conditional on this model and do not capture structural uncertainty among GCMs. SSP126 represents a low-emission pathway, whereas SSP585 represents a high-emission pathway. These data were obtained from the WorldClim database (http://www.worldclim.org/, accessed on 10 February 2026) at a spatial resolution of 30″. Soil variable data were obtained from the National Cryosphere Desert Data Center (http://www.ncdc.ac.cn, accessed on 10 February 2026), also with a spatial resolution of 30″. Topographic variable data were collected from the Geospatial Data Cloud (https://www.gscloud.cn, accessed on 10 February 2026), with a spatial resolution of 1 km. Human activity variables included nighttime light data, land use data, and population density (PD) data. The nighttime light data were based on the 2023 NPP-VIIRS annual composite nighttime light dataset, which was provided by the Earth Observation Group (EOG) at the Colorado School of Mines (https://eogdata.mines.edu/, accessed on 10 February 2026) and had a spatial resolution of 500 m. The land use data came from the 2025 China 30 m annual land cover dataset, developed by Professor Xin Huang’s team at Wuhan University and accessed through the Zenodo open platform [32]. Population density data for 2024 were obtained from the LandScan platform of Oak Ridge National Laboratory (ORNL) (https://landscan.ornl.gov/, accessed on 10 February 2026), with a spatial resolution of 1 km. The typhoon data were derived from the China offshore typhoon track dataset from 1949 to 2020. This dataset includes information on the actual path, intensity, air pressure, and maximum sustained wind speed near the typhoon center of each typhoon, and was obtained from Earth Resources Data (https://www.gis5g.com/, accessed on 10 February 2026).
The environmental datasets used in this study were derived from different temporal periods because the predictors represented ecological processes operating at different temporal scales and temporally matched datasets were not consistently available. The bioclimatic variables for the current period were represented by the 1970–2000 climatological normals, thereby characterizing the long-term climatic background of Hainan Island. The typhoon impact intensity index summarized cumulative typhoon disturbance during 1949–2020. Soil and topographic variables were treated as relatively stable environmental attributes at the spatial and temporal scales considered in this study. In contrast, the most recent available nighttime-light, land-cover, and population-density datasets were used to characterize the contemporary spatial pattern of anthropogenic influence. Because the present distribution of ancient trees reflects the cumulative effects of long-term environmental filtering, historical planting, settlement development, and continued human protection, these recent anthropogenic variables were interpreted as contemporary spatial correlates of anthropogenic influence rather than as exact representations of conditions throughout the entire lifespan of individual trees.
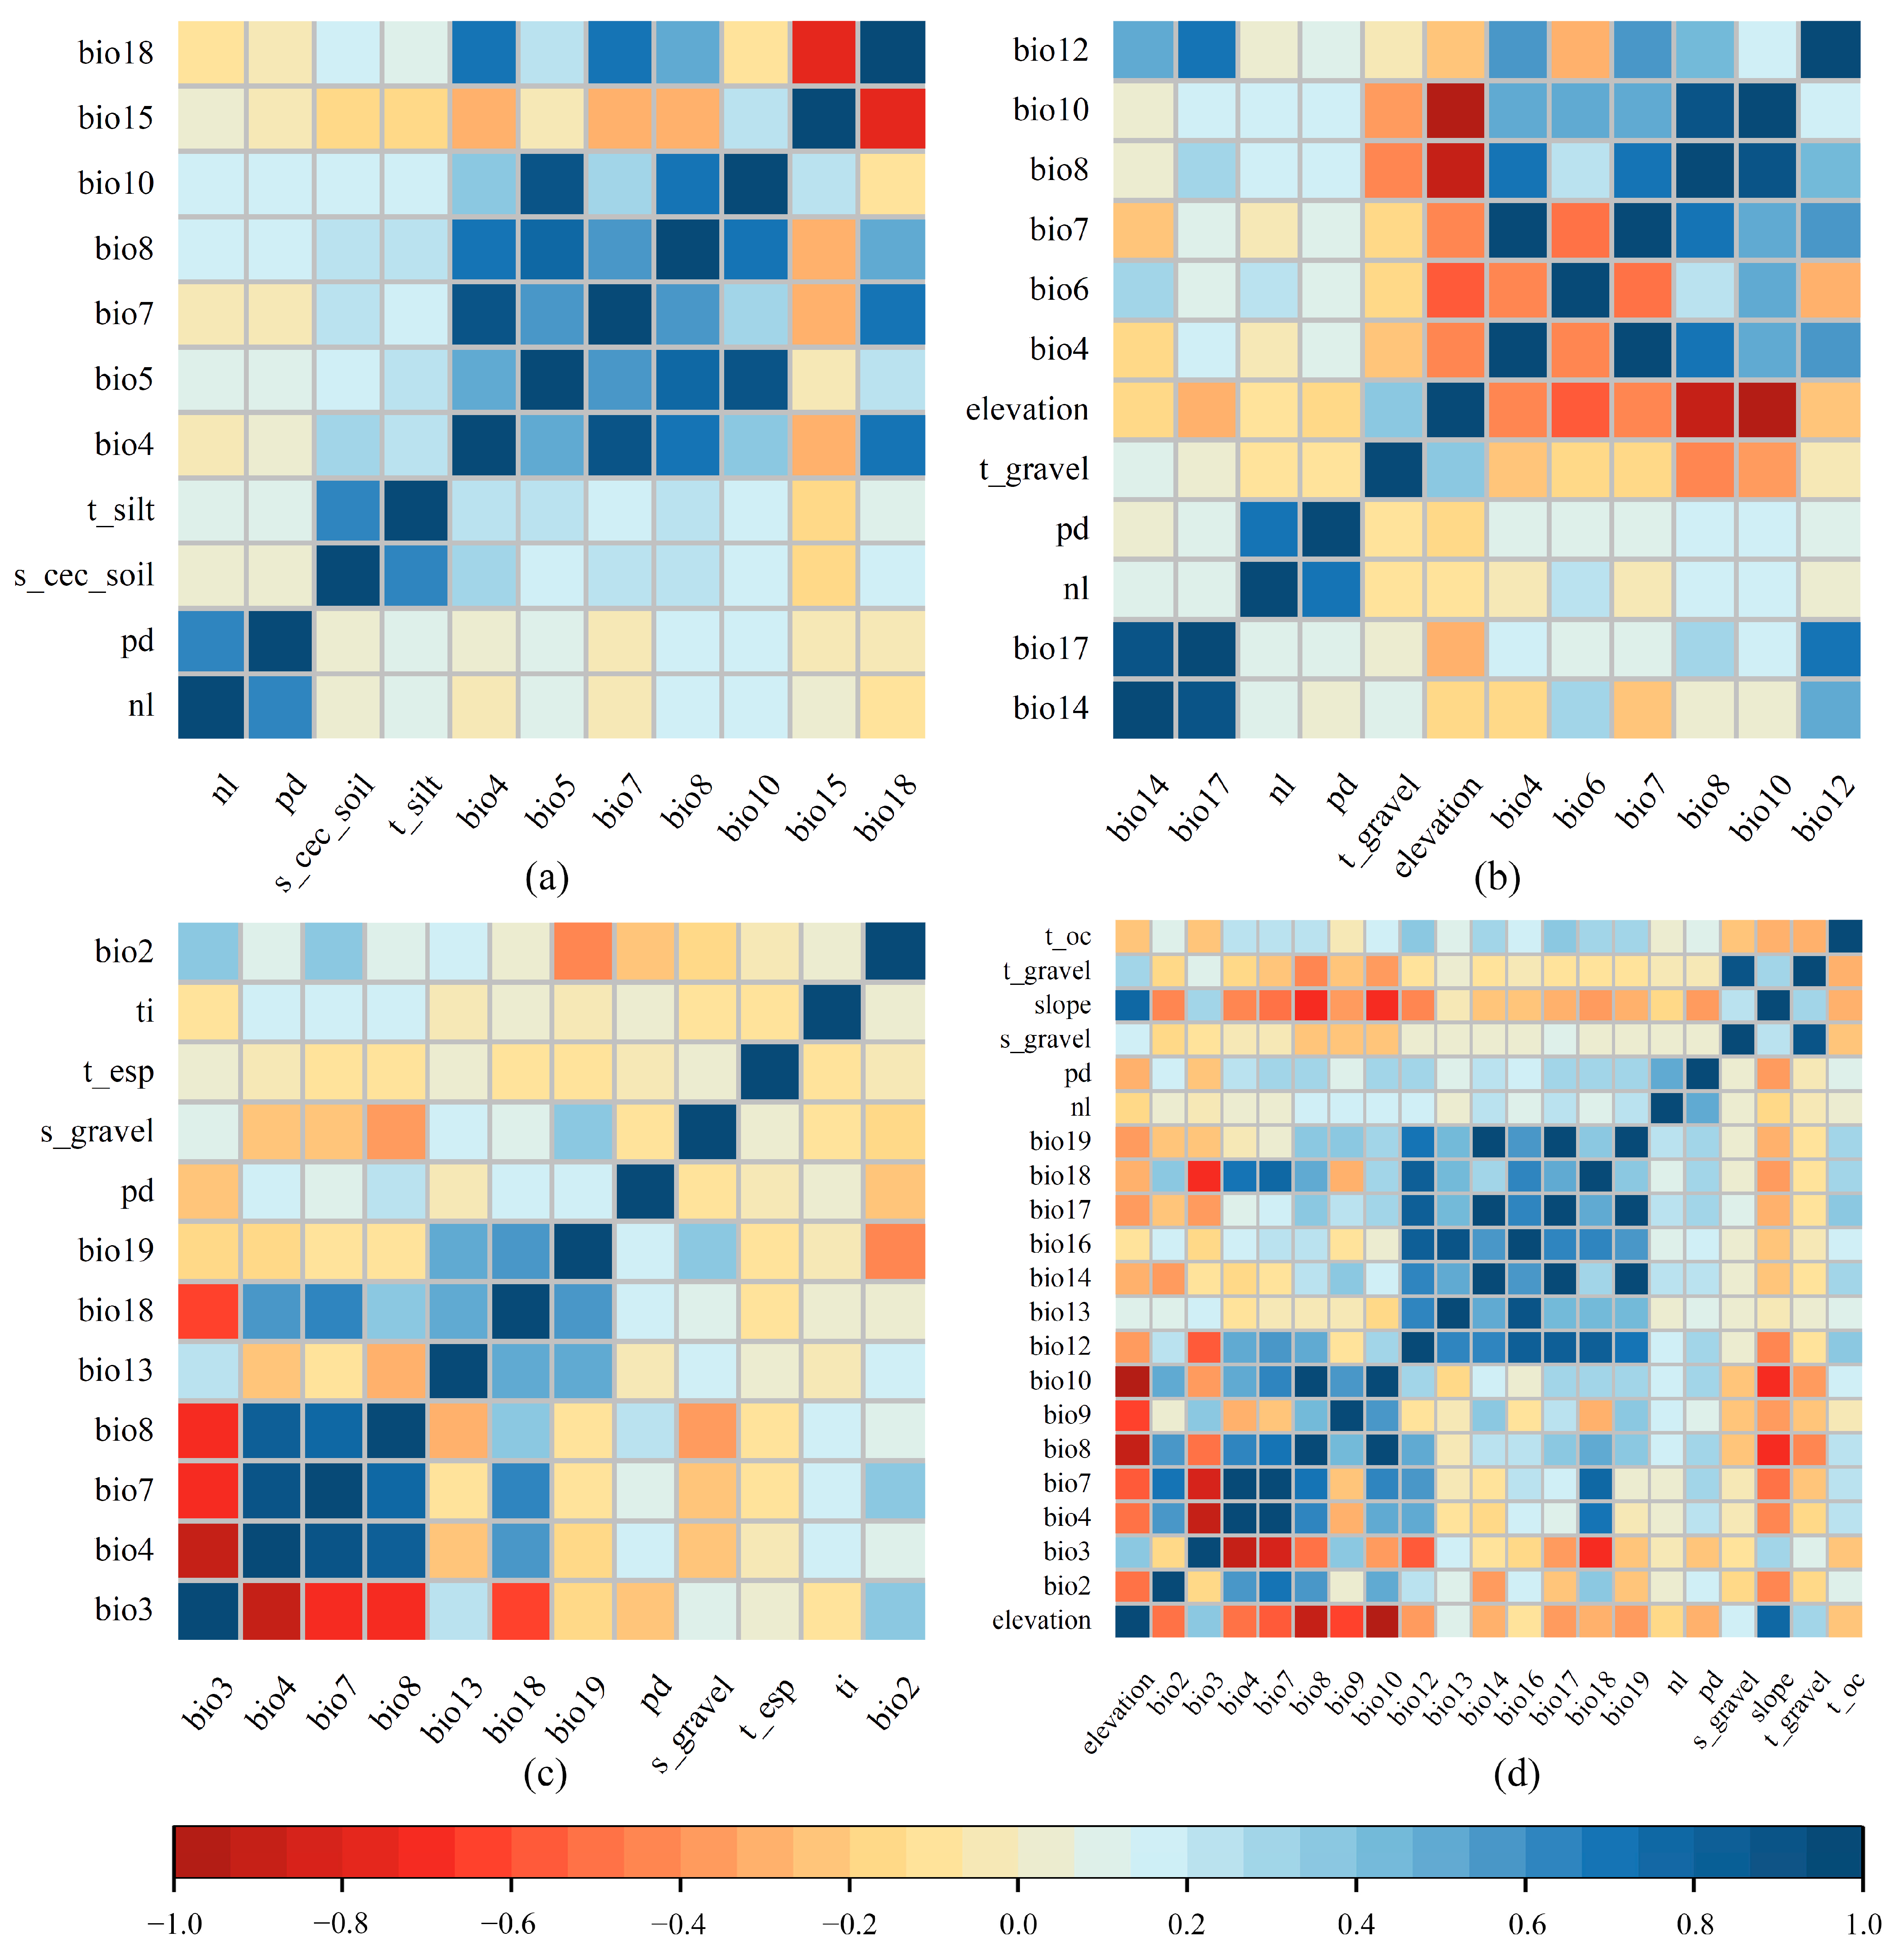
All environmental variables were loaded into ArcGIS 10.8. The coordinate system was standardized to the WGS 1984 geographic coordinate system, and raster rows, columns, and extent were standardized using the “Extract by Mask” tool. To ensure spatial consistency among predictors, all raster datasets were resampled to a uniform spatial resolution of 30″. Different resampling methods were applied according to variable characteristics. Continuous variables, including climatic variables, soil physicochemical properties, anthropogenic variables, topographic variables, and typhoon-related variables, were resampled using bilinear interpolation, whereas categorical variables, including soil texture classes and land-use classification, were resampled using the nearest-neighbor method to preserve the original category information. To reduce multicollinearity and redundancy among modeling predictors, variable selection was performed for all categories of environmental variables [33]. In this study, preliminary modeling experiments were performed with the default parameter settings of the MaxEnt model. These experiments were based on 59 initially selected environmental variables and occurrence records for the ancient trees of four dominant Ficus species. Environmental variables with contribution rates lower than 1% were excluded [34]. The retained variables were extracted at each ancient-tree occurrence point using ArcGIS 10.8. Pearson correlation analyses were subsequently performed only among retained continuous variables using the “correlation” tool in ENMTools [31]. To reduce the influence of multicollinearity among predictors, variable pairs with strong correlations (|r| > 0.80) were considered highly correlated, and between the two correlated variables, the one with the lower ranking based on the first-round contribution rate was removed [35]. The categorical variables retained after the first-round contribution-based screening were not subjected to Pearson correlation analysis because they represented discrete environmental classes rather than continuous gradients. In this study, only two species models retained one categorical variable after the first-round screening; therefore, no further secondary screening was conducted for categorical variables. After these procedures, the final species-specific variable sets were determined and used for subsequent MaxEnt modeling.

2.2.3. Parameter Optimization of the MaxEnt Model

To enhance the predictive accuracy of the model, the “ENMeval” package (v2.0.4) in R version 4.4.3 was used for parameter tuning of the MaxEnt model [36]. The optimization focused mainly on the regularization multiplier (RM) and feature combinations (FC) [37]. For parameter tuning, the leave-one-out jackknife partition in ENMeval v2.0.4 (partition.method = “jackknife”) was used. In this optimization process, RM values were set from 0.5 to 4.0 at 0.5 increments. This produced eight RM settings. The FC settings included five feature types: hinge (H), linear (L), product (P), quadratic (Q), and threshold (T). Six feature combinations were selected, including H, L, LQ, LQH, LQHP, and LQHPT. These RM and FC settings generated 48 parameter combinations for model testing. The corrected Akaike Information Criterion (AICc) was used to evaluate model fit and complexity of different parameter combinations. Lower AICc values indicate a better balance between model fit and complexity. Thus, the optimal parameter combination was that with delta AICc = 0, which was used for subsequent model construction [38].

2.2.4. MaxEnt Model Construction and Accuracy Evaluation

Species-specific MaxEnt models were constructed using MaxEnt v3.4.4 and the occurrence records for the ancient trees of four dominant Ficus species and the environmental variables retained after screening. Two model types were developed for different purposes: the Environmental Association Model (EAM) and the Natural-Environment Projection Model (NEPM). The EAM incorporated natural environmental, anthropogenic, and typhoon-related variables to assess their associations with ancient-tree occurrence. In contrast, the NEPM included only climatic, soil, and topographic variables for current and future habitat-suitability projections, excluding anthropogenic and typhoon-related variables. In future projections, only climatic variables were updated, whereas soil and topographic variables were held constant. Therefore, future habitat maps are conditional on static non-climatic predictors. During future projections, environmental extrapolation was permitted, with clamping enabled in MaxEnt to limit predictions outside the range of environmental conditions represented in the calibration data. In addition, Multivariate Environmental Similarity Surface (MESS) analysis was performed to quantify the similarity between future environmental conditions and the multivariate environmental space represented by the model calibration data. Negative MESS values indicate that at least one environmental variable falls outside the calibration range, thereby identifying areas characterized by potentially non-analog environmental conditions and increased extrapolation uncertainty [39].
In the MaxEnt modeling framework, presence-only occurrence records were combined with randomly generated background points. For each species and model type, MaxEnt automatically generated up to 10,000 background points within the modeling extent. The background extent was defined as the entire Hainan Island, which corresponds to the region where occurrence records were collected and environmental conditions were evaluated. All species models used the same background extent to ensure comparability among predictions. For each species and model type, 75% of the occurrence records were randomly selected as the training set, while the remaining 25% were used as the test set following commonly adopted practices in MaxEnt-based species distribution modeling [40]. Response curves and jackknife tests were enabled to evaluate variable importance and response patterns, and predictions were generated using logistic output. Each model was run with 10 bootstrap replicates to improve the stability of the results. The feature combination (FC) and regularization multiplier (RM) followed the optimized settings, while the remaining parameters were maintained at their default values. Final predictions were obtained by averaging the outputs of the 10 replicate runs.
Model performance was evaluated using the area under the receiver operating characteristic curve (AUC), the difference between training and test AUC values (AUCdiff), and the 10th-percentile training-presence omission rate (OR10). AUC was used to assess model discriminatory ability, with higher values indicating better separation between suitable and unsuitable habitats [41]. AUCdiff was calculated to evaluate the consistency between training and test performance, with smaller differences indicating reduced overfitting and better model generalization [42]. OR10 was used to assess potential model overfitting, with omission rates close to the theoretical expectation of 0.10 indicating appropriate model complexity, whereas substantially higher values may indicate increased overfitting risk [43].
To evaluate the robustness of future habitat suitability projections under different climate change scenarios, a sensitivity analysis was conducted by varying the regularization multiplier (RM) while keeping the optimized feature combination (FC) unchanged. Specifically, alternative models were constructed using higher RM values than the optimal setting, whereas the occurrence data, environmental variables, projection scenarios, and other model parameters remained unchanged. Future habitat suitability projections under the SSP126 and SSP585 scenarios were compared among different RM settings based on changes in predicted suitable habitat area. The robustness of future projections was evaluated by determining whether different RM settings resulted in consistent conclusions regarding habitat suitability changes under future climate scenarios.

2.2.5. Classification of Habitat Suitability for the Ancient Trees of Four Dominant Ficus Species

The averaged logistic output from the 10 MaxEnt replicate runs of the NEPM was imported into ArcGIS 10.8 and used as the habitat suitability index (p), with values ranging from 0 to 1. To characterize spatial gradients in the predicted habitat suitability of the ancient trees of four dominant Ficus species, the continuous suitability predictions were reclassified following Liu et al. [44]. For the ancient trees of each Ficus species, the species-specific maximum test sensitivity plus specificity threshold (MTSPS) derived from the current NEPM was used to distinguish suitable from unsuitable habitat, while fixed thresholds of 0.5 and 0.7 were used to further divide suitable habitat into different suitability levels. The MTSPS threshold for each species was calculated from the averaged logistic output of the 10 bootstrap replicates of the current NEPM. This threshold was then consistently applied to the current prediction and all future projections for that species. For each Ficus species, habitat suitability was classified into four categories: unsuitable habitat (p < MTSPS), low-suitability habitat (MTSPS ≤ p < 0.5), moderately suitable habitat (0.5 ≤ p < 0.7), and highly suitable habitat (p ≥ 0.7). This classification was used to characterize the spatial distribution of potential habitat suitability under current and future climate conditions and to calculate the area and proportion of each suitability category. The fixed thresholds of 0.5 and 0.7 were used as operational cutoffs to further classify suitable habitats into moderate- and high-suitability categories and to facilitate consistent spatial description across scenarios. These thresholds were not interpreted as species-specific biological limits.
For analyses of overall habitat change, the same species-specific MTSPS threshold was consistently applied to the current prediction and all future climate projections for each ancient-tree group, thereby converting the continuous suitability predictions into binary suitable–unsuitable habitat maps [45,46]. The MTSPS thresholds were 0.3759 for ancient F. microcarpa trees, 0.4475 for ancient F. altissima trees, 0.3458 for ancient F. benjamina trees, and 0.3271 for ancient F. virens trees. For each species, the corresponding threshold was consistently applied to the current prediction and all future climate projections. Grid cells with suitability values equal to or greater than the species-specific threshold were classified as suitable habitat, whereas those below the threshold were classified as unsuitable habitat. Finally, SDMtoolbox v2.6 for ArcMap 10.8 was used to identify areas of habitat expansion, contraction, persistent suitability, and persistent unsuitability for ancient trees of the four dominant Ficus species [47]. Expansion areas are those that are currently unsuitable but future suitable; contraction areas are currently suitable but future unsuitable; persistent suitable areas are suitable in both current and future; and persistent unsuitable areas are unsuitable in both current and future.
To quantify changes in habitat area under future climate scenarios, the relative change in habitat area compared with current climatic conditions was calculated as
R i = A i , f − A i , c A i , c × 100 %
Here, Ri represents the percentage change in the area of habitat category i, and Ai,c and Ai,f represent the areas of the same habitat category under current and future climatic conditions, respectively. For total suitable habitat, the difference between future and current suitable habitat areas corresponds to the net habitat change, calculated from the balance between habitat expansion and contraction. For highly suitable habitat, the same formula was applied directly to the corresponding areas under current and future conditions. Positive values of Ri indicate an increase in habitat area, whereas negative values indicate a decrease.

2.2.6. Identification of the Key Environmental Variable

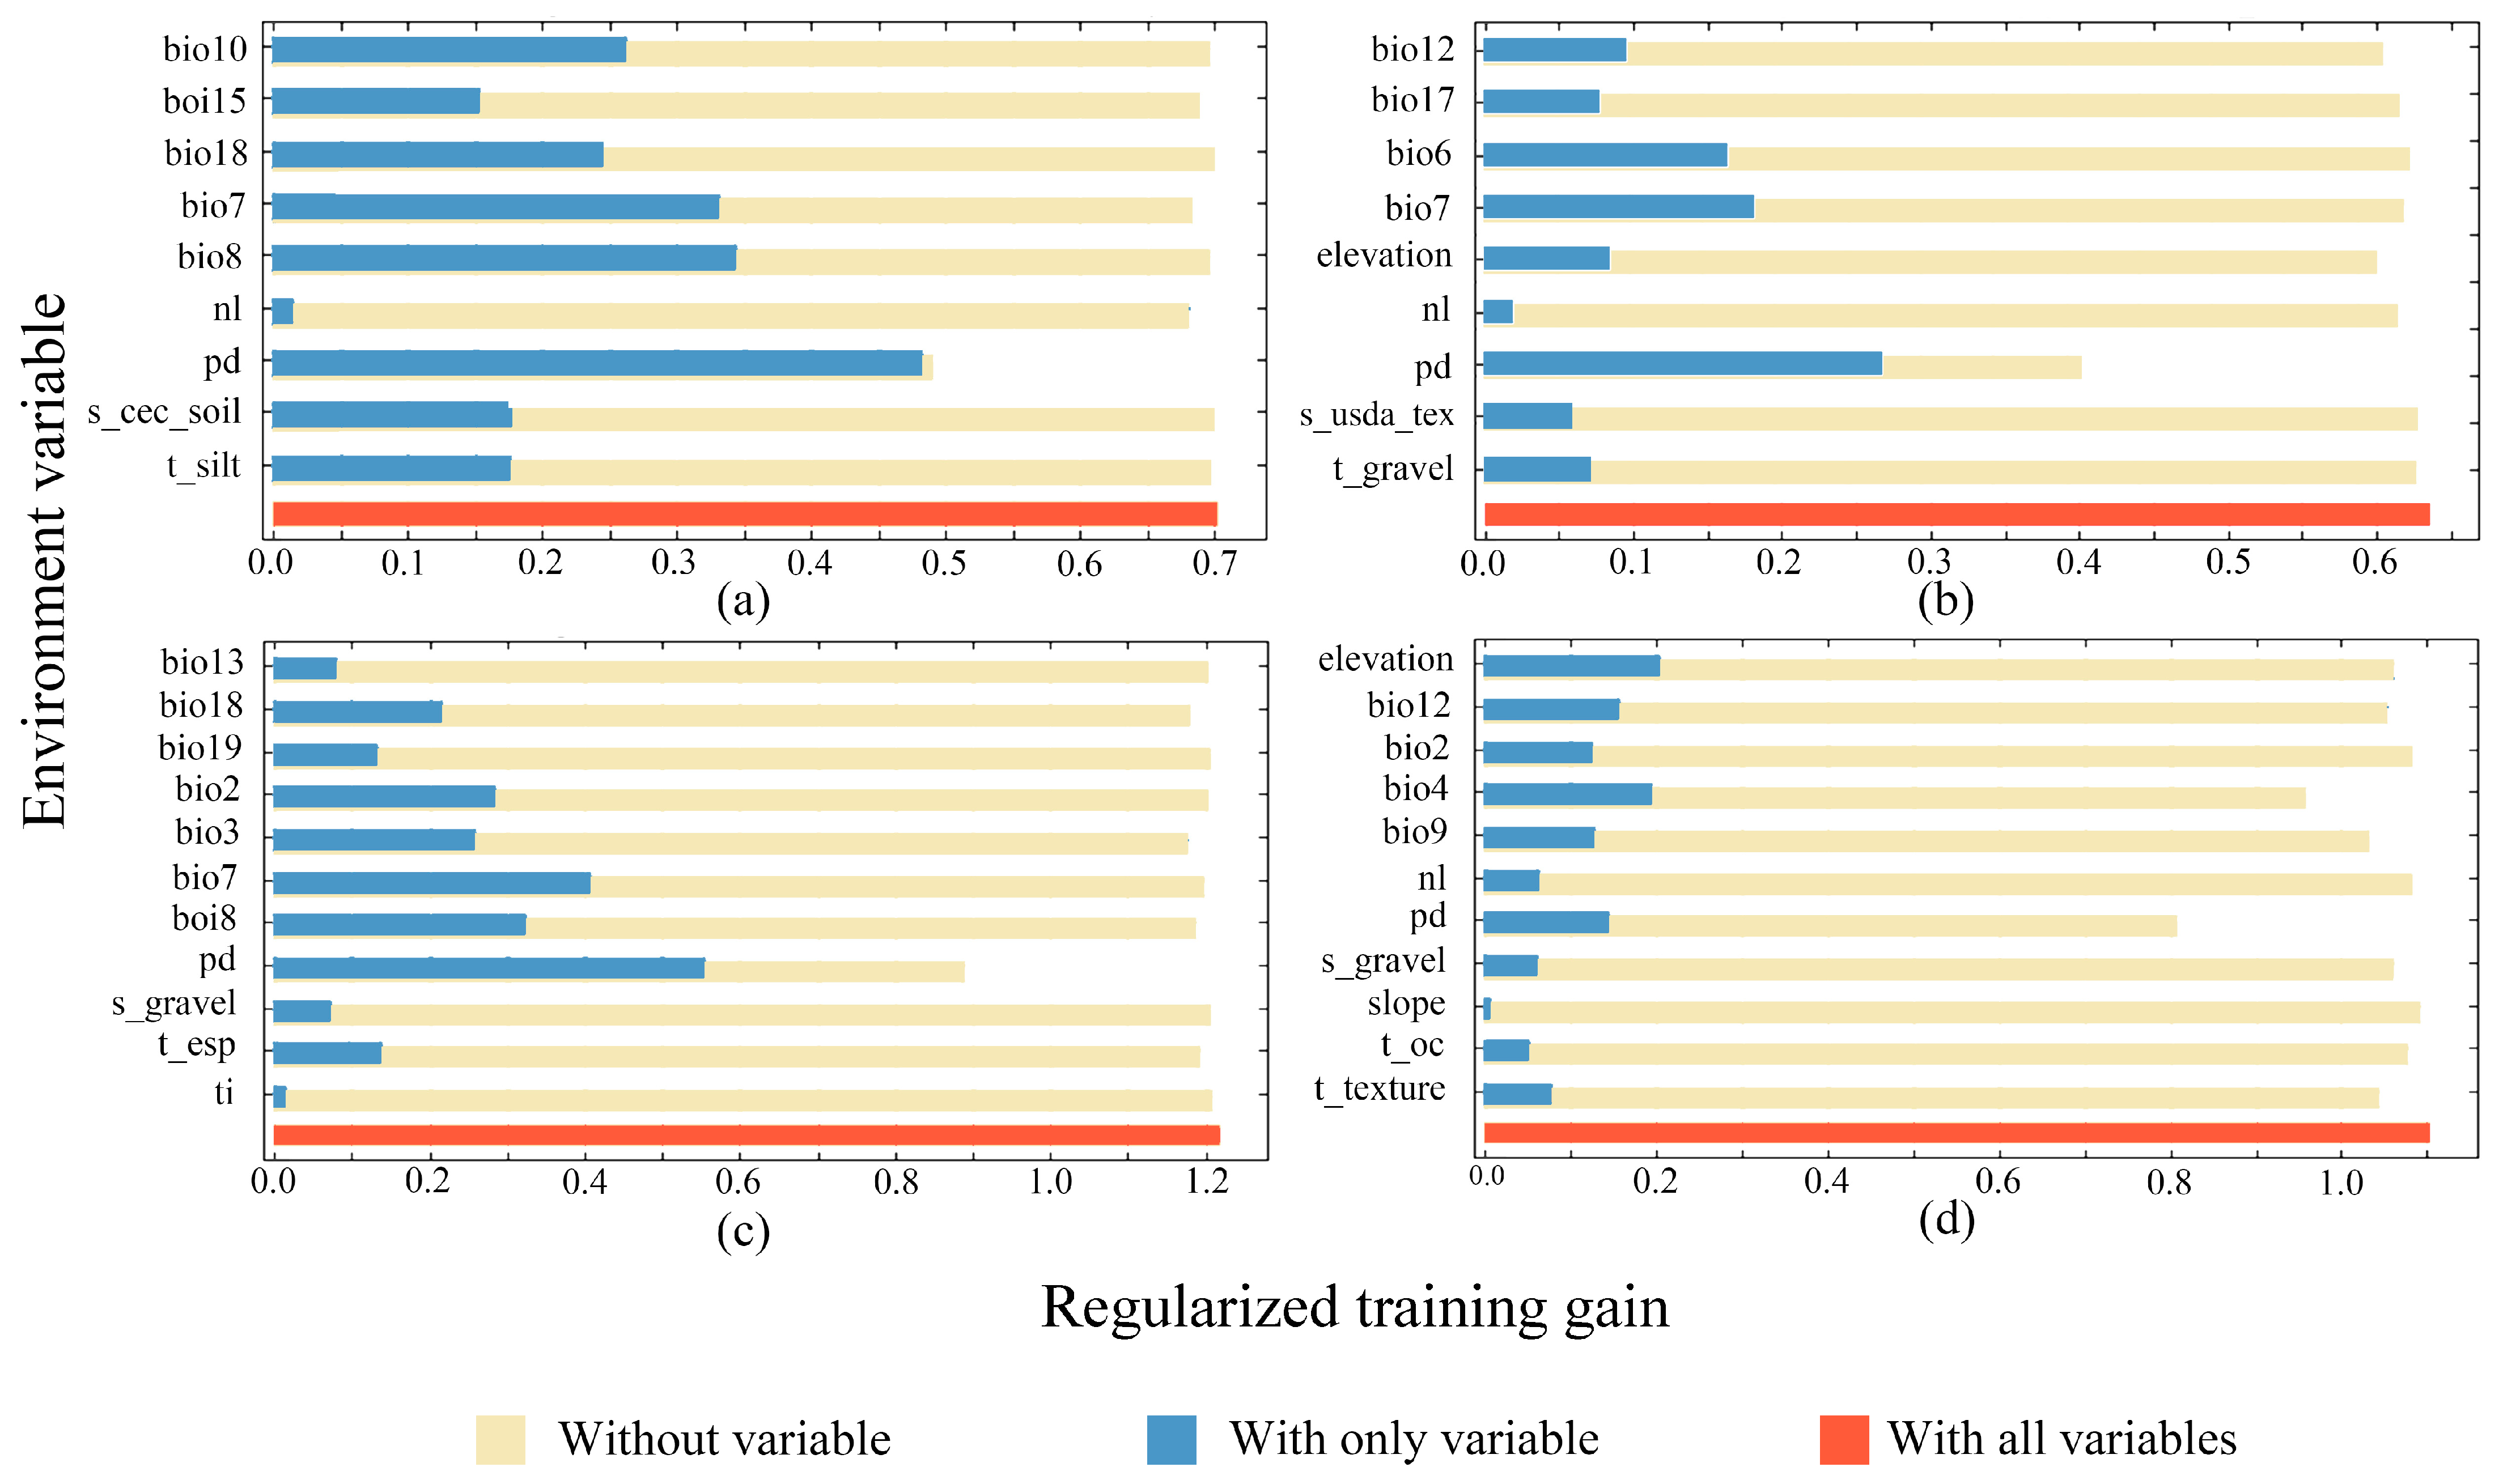
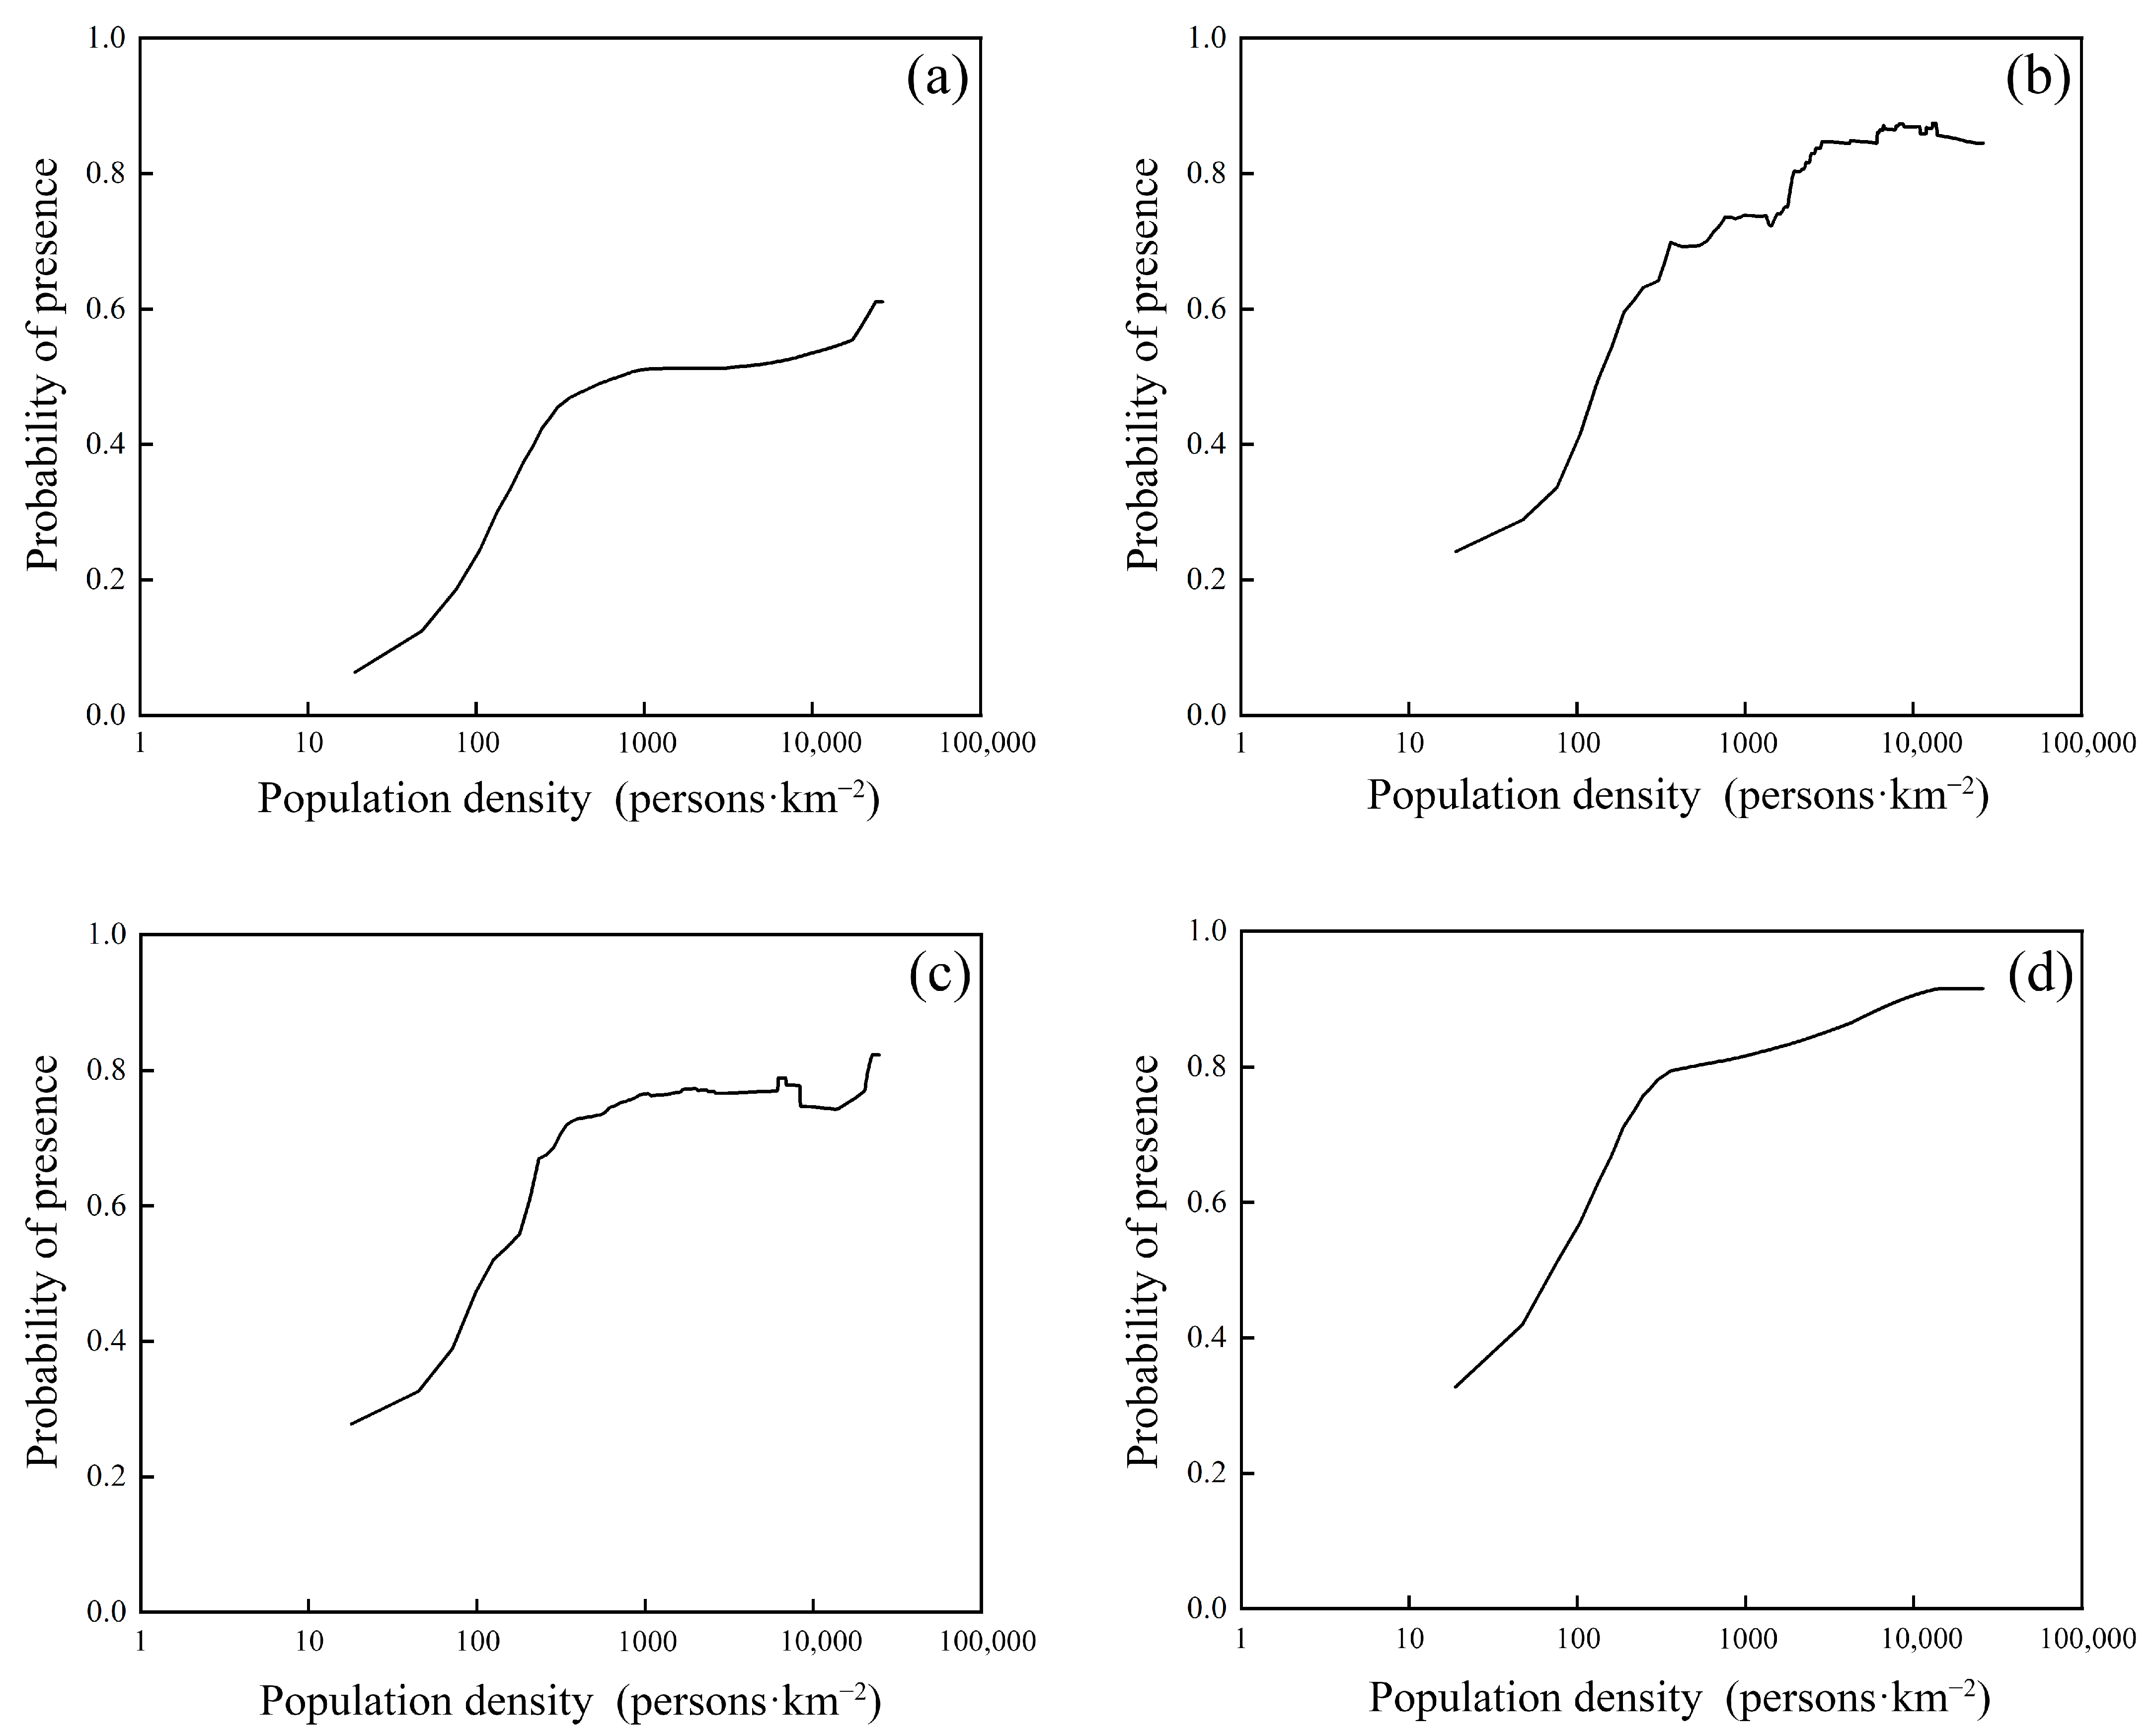
In this study, one key environmental variable was identified for each species-specific EAM based on percentage contribution and jackknife test results. Percentage contribution was used to assess the relative importance of each variable, while the jackknife test compared the regularized training gains obtained when each variable was used alone, omitted, or included with all variables. When percentage contribution and jackknife results produced inconsistent rankings, the variable whose omission caused the greatest reduction in regularized training gain was identified as the key environmental variable, because it contained the most unique predictive information not provided by the remaining variables [48]. Response curves were used to characterize the relationship between the species-specific key environmental variable and the predicted probability of presence for each of the four dominant Ficus species.

2.2.7. Construction of the Typhoon Impact Intensity Index

To quantify typhoon disturbance, this study constructed a typhoon impact intensity index (TI). The index was calculated at a spatial resolution of 30″, with each grid cell representing one unit of analysis. For each typhoon event, the typhoon impact intensity of each grid cell was estimated as the product of the total length of the typhoon track within that grid cell and the maximum sustained wind speed near the typhoon center. Finally, the impact intensities from all typhoon events during the study period were summed for each grid cell. The accumulated values were then normalized using the min-max method. This produced a grid-scale typhoon impact intensity index. All spatial operations were performed in ArcGIS 10.8.
The raw cumulative typhoon impact intensity of each grid cell was calculated as
S i = ∑ j = 1 n L ij × V ij
Here, Si denotes the raw cumulative typhoon impact intensity of the i-th 30″ × 30″ grid cell in the study area; i represents a standard grid cell within the entire area of Hainan Island; j denotes an individual typhoon event that passed over Hainan Island during 1949–2020; and n is the total number of typhoon events that passed through the study area during the study period. Lij represents the transit path length of the j-th typhoon within the i-th grid cell, measured in kilometers; if the typhoon did not pass through that grid cell, Lij was assigned a value of 0. Vij represents the maximum sustained wind speed near the typhoon center of the j-th typhoon when passing through the i-th grid cell, measured in m·s−1; if the typhoon did not pass through that grid cell, Vij was assigned a value of 0.
T I i = S i − S min S max − S min
Here, TIi denotes the normalized typhoon impact intensity index of the i-th grid cell, ranging from 0 to 1, Si represents the raw typhoon impact intensity index of the i-th grid cell, and Smax and Smin are the maximum and minimum values, respectively, of the raw typhoon impact intensity index within the study area.
The typhoon impact intensity index was calculated by combining typhoon-track length within the study area with maximum central wind speed. Track length was used to represent the spatial extent or cumulative exposure of a location to typhoon influence, whereas maximum wind speed represented typhoon intensity. Their product was therefore used as a relative proxy integrating typhoon exposure and intensity at the island scale. This index was intended to characterize relative spatial differences in typhoon disturbance rather than to directly quantify damage to individual ancient trees.

3. Results

3.1. Results of Environmental Variable Selection

The Pearson correlation analysis results for the initially screened environmental variables are presented in Figure 2. The environmental variables retained after the second screening step are summarized in Table 2. Ultimately, 9, 9, 11, and 11 variables were retained under the EAM for F. microcarpa, F. altissima, F. benjamina, and F. virens, respectively, while 7, 7, 9, and 9 variables were retained under the NEPM for the respective species for subsequent MaxEnt model construction.

3.2. Optimal Model Parameters and Accuracy Assessment

The optimal parameter combinations and model evaluation results for the habitat suitability models of the ancient trees of four dominant Ficus species are presented in Table 3. Under the optimized parameter settings, the AUC values of both training and test datasets were consistently above 0.7 across all models, with most values exceeding 0.8, indicating satisfactory discriminatory performance. The AUC values of the test datasets ranged from 0.7333 to 0.8947, suggesting that the optimized models maintained good predictive performance across different model types and species.
The differences between training and test AUC values (AUCdiff) were relatively small, ranging from 0.0050 to 0.0411, indicating limited performance degradation from model calibration to independent evaluation. In addition, the OR10 values of all models were close to the theoretical expectation of 0.10 (0.0962–0.0992), suggesting that the optimized parameter combinations effectively controlled model complexity and minimized potential overfitting.

3.3. Contributions of Environmental Variables to Habitat Suitability Models for the Ancient Trees of Four Dominant Ficus Species

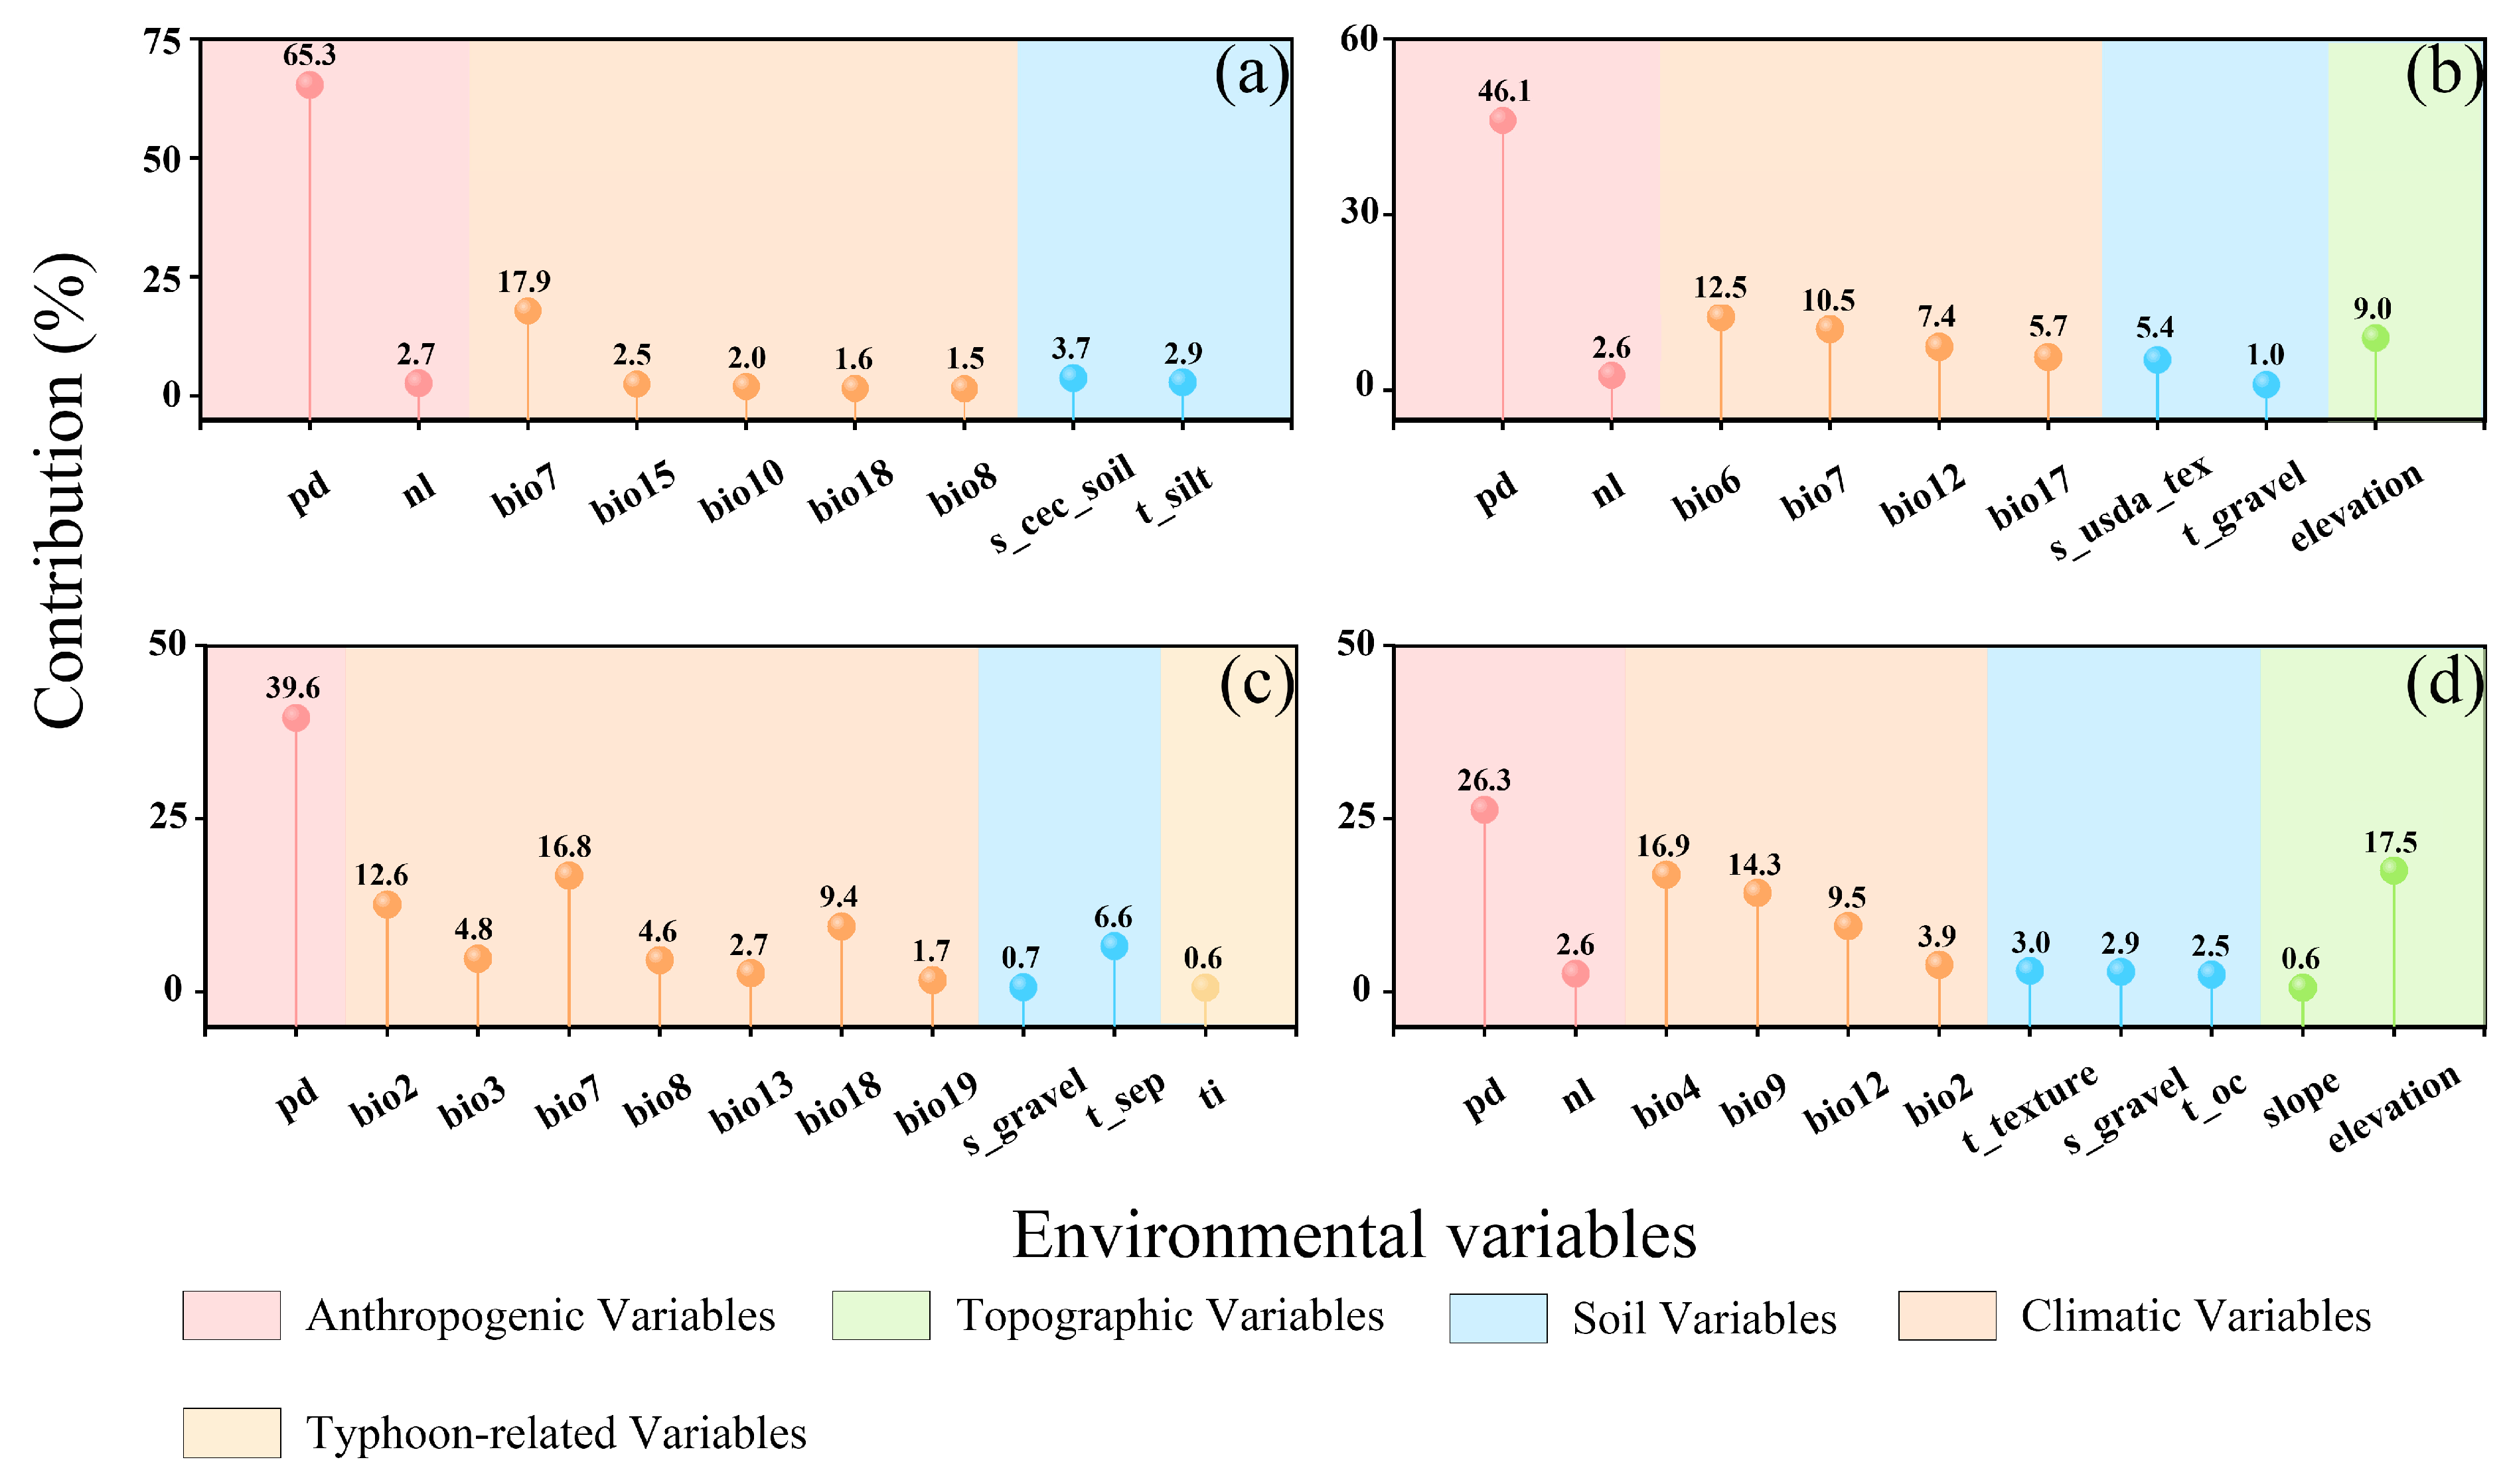
Under the EAM framework, as shown in Figure 3 and Figure 4, based on the combined results of percentage contribution and the jackknife test, population density (PD) was identified as a key environmental variable associated with the model-predicted distributions of ancient F. microcarpa, F. altissima, F. benjamina, and F. virens, with contribution rates of 65.3%, 46.1%, 39.6%, and 26.3%. As illustrated in Figure 5, ancient F. microcarpa, F. altissima, F. benjamina, and F. virens exhibited generally similar response patterns to population density (PD). For the ancient trees of four dominant Ficus species, the predicted probability of presence increased markedly at relatively low PD levels, after which the rate of increase gradually diminished and the response curves tended to level off at higher PD values.
Climate variables contributed 25.5%, 36.1%, 52.6%, and 44.6% to the models for ancient Ficus microcarpa, F. altissima, F. benjamina, and F. virens, respectively. Specifically, temperature-related variables accounted for 21.4%, 23.0%, 38.8%, and 35.1%, whereas precipitation-related variables contributed 4.1%, 13.1%, 13.8%, and 9.5%, respectively. Soil variables contributed 6.6%, 6.4%, 7.3%, and 8.4% to the four species models, respectively. Topographic variables contributed to the models for ancient F. altissima and F. virens, with total contributions of 9.0% and 18.1%, respectively. Typhoon-related variables contributed to only the model for ancient F. benjamina, with a total contribution of 0.6%.

3.4. Potentially Suitable Habitats for the Ancient Trees of Four Dominant Ficus Species on Hainan Island Under the Current Climate Scenario

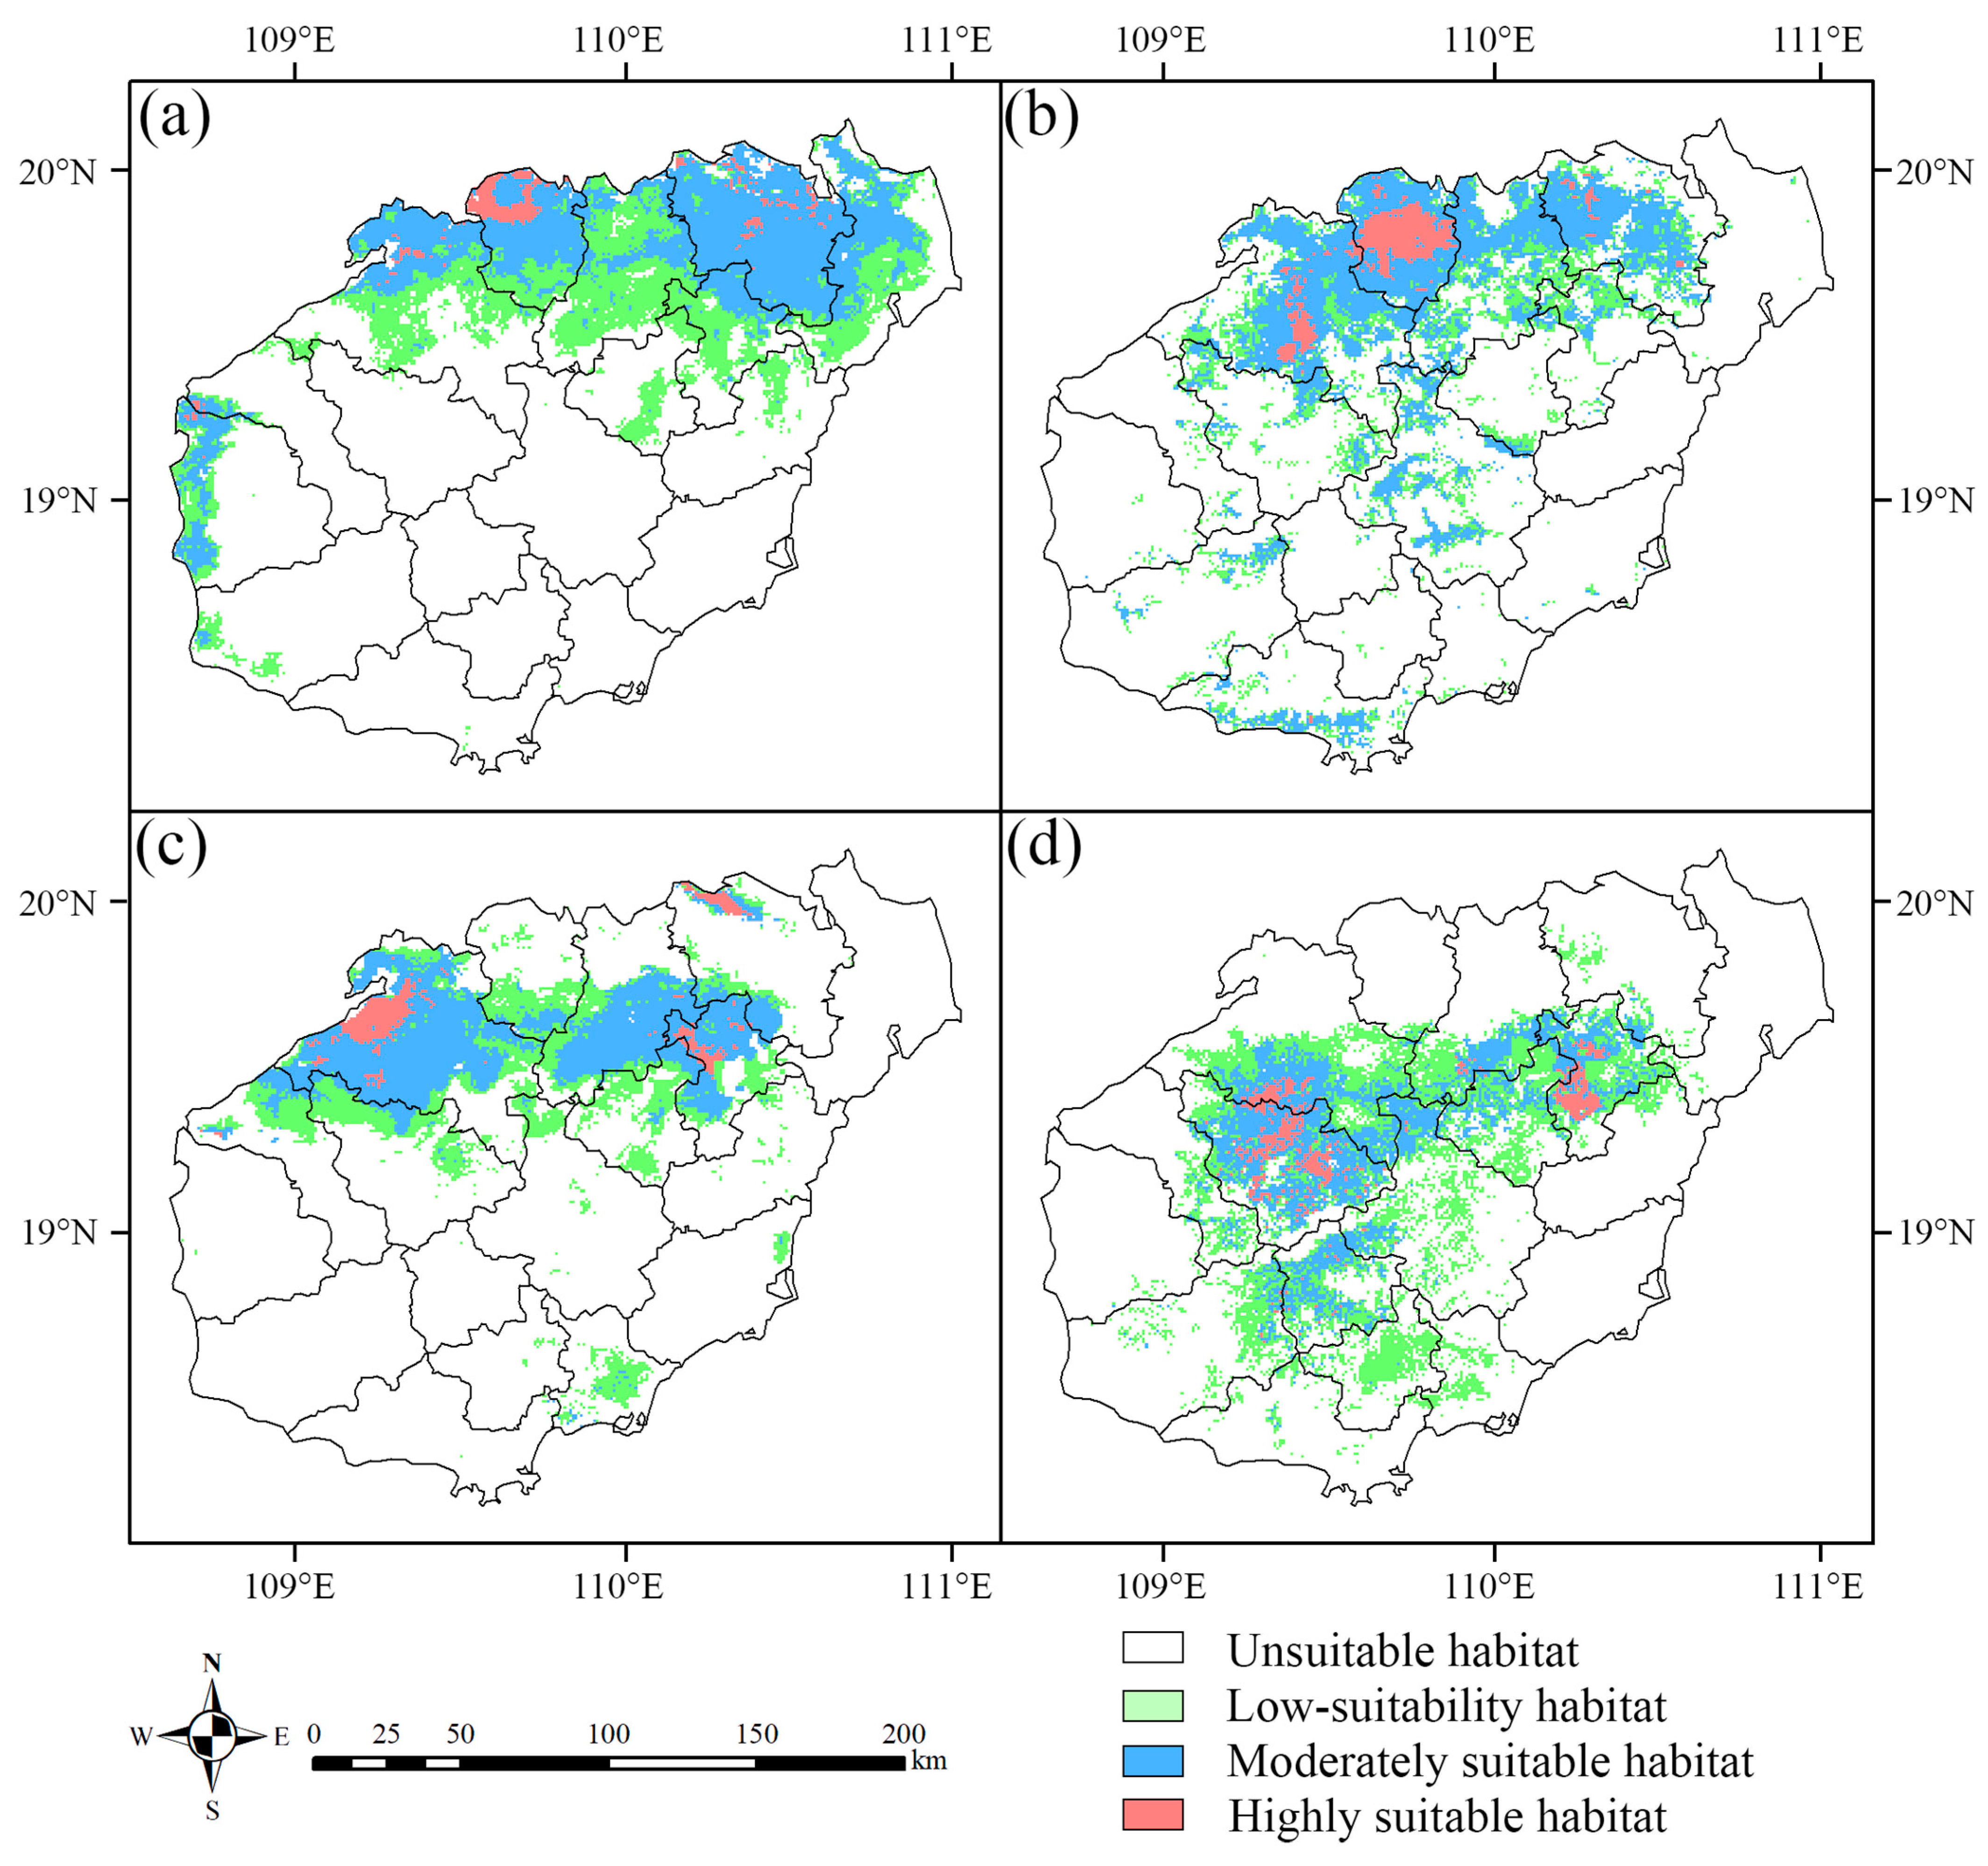
Under the NEPM framework, as shown in Figure 6 and Table 4, under current climatic conditions, clear interspecific differences were observed in the extent and suitability composition of potential habitats for the ancient trees of four dominant Ficus species. The predicted total suitable habitat areas ranged from 7771.31 to 10,489.97 km2, corresponding to 22.9%–30.9% of the modeling extent. Ancient F. microcarpa trees had the largest total suitable habitat area (10,489.97 km2, 30.9% of the modeling extent), followed by ancient F. virens (9232.17 km2, 27.2%) and F. altissima trees (8749.29 km2, 25.8%), whereas ancient F. benjamina trees had the smallest total suitable habitat area (7771.31 km2, 22.9%). These differences indicate species-specific patterns in modeled habitat suitability across Hainan Island.
Based on the adopted suitability classification scheme, species-specific differences were observed in the extent and spatial distribution of highly suitable habitat. Ancient F. altissima trees had the largest highly suitable habitat area, covering 663.15 km2 and accounting for 1.96% of the total area of Hainan Island. These habitats were mainly concentrated in Chengmai County in northern Hainan and Danzhou City in northwestern Hainan. Ancient F. virens trees had the second-largest highly suitable habitat area, covering 597.84 km2 (1.76% of the island), and were mainly distributed in northwestern Hainan and Ding’an County in the north-central part of the island. The highly suitable habitat areas of ancient F. benjamina and F. microcarpa trees were 478.04 and 371.98 km2, accounting for 1.41% and 1.10% of the total area of Hainan Island, respectively. Highly suitable habitats for ancient F. benjamina trees were mainly concentrated in Danzhou City and Ding’an County, whereas those for ancient F. microcarpa trees were mainly distributed in Haikou City and Lingao County. Overall, highly suitable habitats for the ancient trees of four dominant Ficus species were concentrated primarily in northern and northwestern Hainan, with additional scattered patches in the central part of the island and relatively limited distribution in southern Hainan.

3.5. Projected Changes in Suitable Habitat Areas for the Ancient Trees of Four Dominant Ficus Species Under Future Climate Scenarios

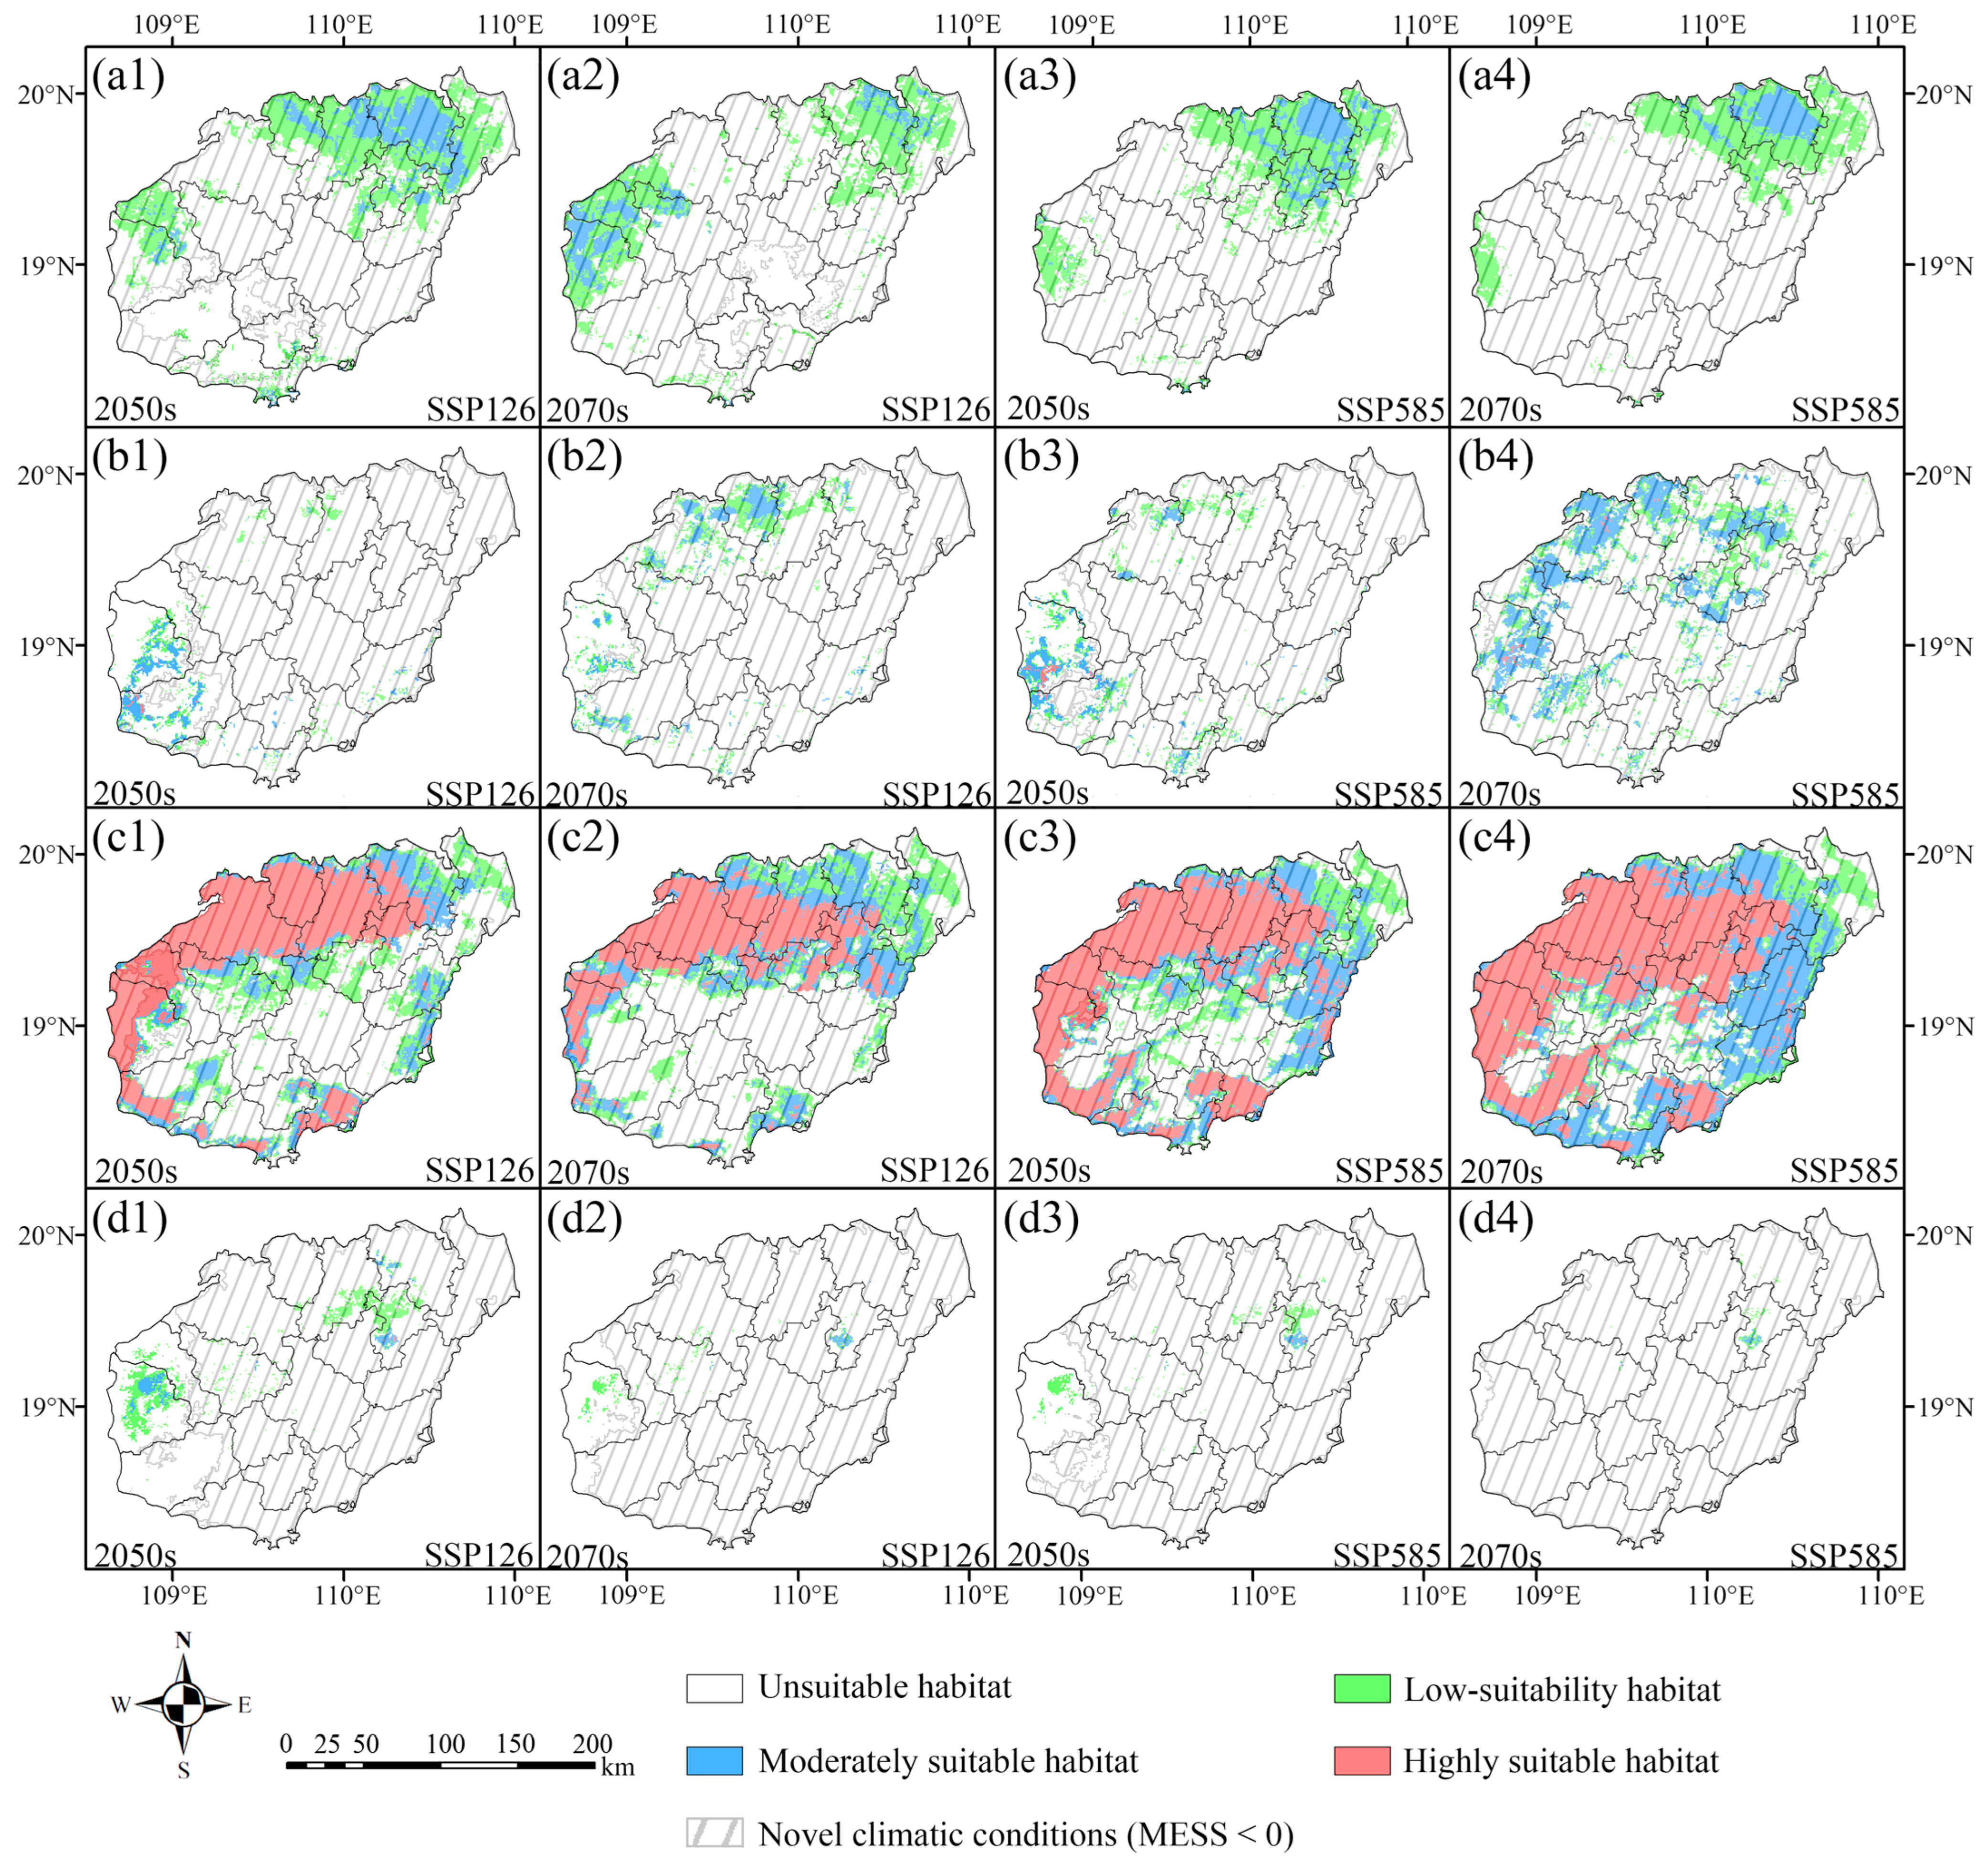
Under the NEPM framework, the potential suitable habitats for the ancient trees of four dominant Ficus species were projected to change markedly under future climate scenarios (Figure 7). The highly suitable habitats of ancient F. microcarpa, F. altissima, and F. virens trees generally showed declining tendencies under both SSP126 and SSP585. For ancient F. microcarpa trees, highly suitable habitat was projected to be absent under all future scenarios. Ancient F. virens trees showed a similarly pronounced declining tendency, with only small areas of highly suitable habitat projected to remain in the 2050s and none identified by the model in the 2070s under either scenario. Ancient F. altissima trees were projected to retain limited highly suitable habitat under most future scenarios, with the largest reduction occurring under SSP126 in the 2070s, when the highly suitable habitat area decreased from 663.15 to 2.43 km2, representing a 99.6% reduction. In contrast, the highly suitable habitat of ancient F. benjamina trees showed a pronounced expansion tendency under both climate scenarios, reaching its largest projected extent under SSP585 in the 2070s, when the area increased from 478.04 to 14,513.90 km2.
The ancient trees of four dominant Ficus species were projected to exhibit different temporal patterns in their total suitable habitat areas. For ancient F. microcarpa trees, the total suitable habitat area showed a projected declining tendency over time under both SSP126 and SSP585. A similar declining tendency was projected for ancient F. virens trees under both scenarios. For ancient F. altissima trees, the total suitable habitat area was projected to decrease in the 2050s and partially recover by the 2070s under both SSP126 and SSP585. Ancient F. benjamina trees were projected to show an initial increase followed by a decrease under SSP126, while an increasing tendency was projected under SSP585.
To evaluate the uncertainty associated with future projections, MESS analysis was conducted for each climate scenario. Regions with MESS values below zero, indicating potential environmental extrapolation, were explicitly marked with diagonal hatching in Figure 7. These regions represent areas where future climatic conditions extend beyond the environmental range characterized by the current occurrence records and therefore involve greater projection uncertainty.

3.6. Projected Changes in the Spatial Distribution Patterns of Suitable Habitats for the Ancient Trees of Four Dominant Ficus Species on Hainan Island Under Future Climate Scenarios

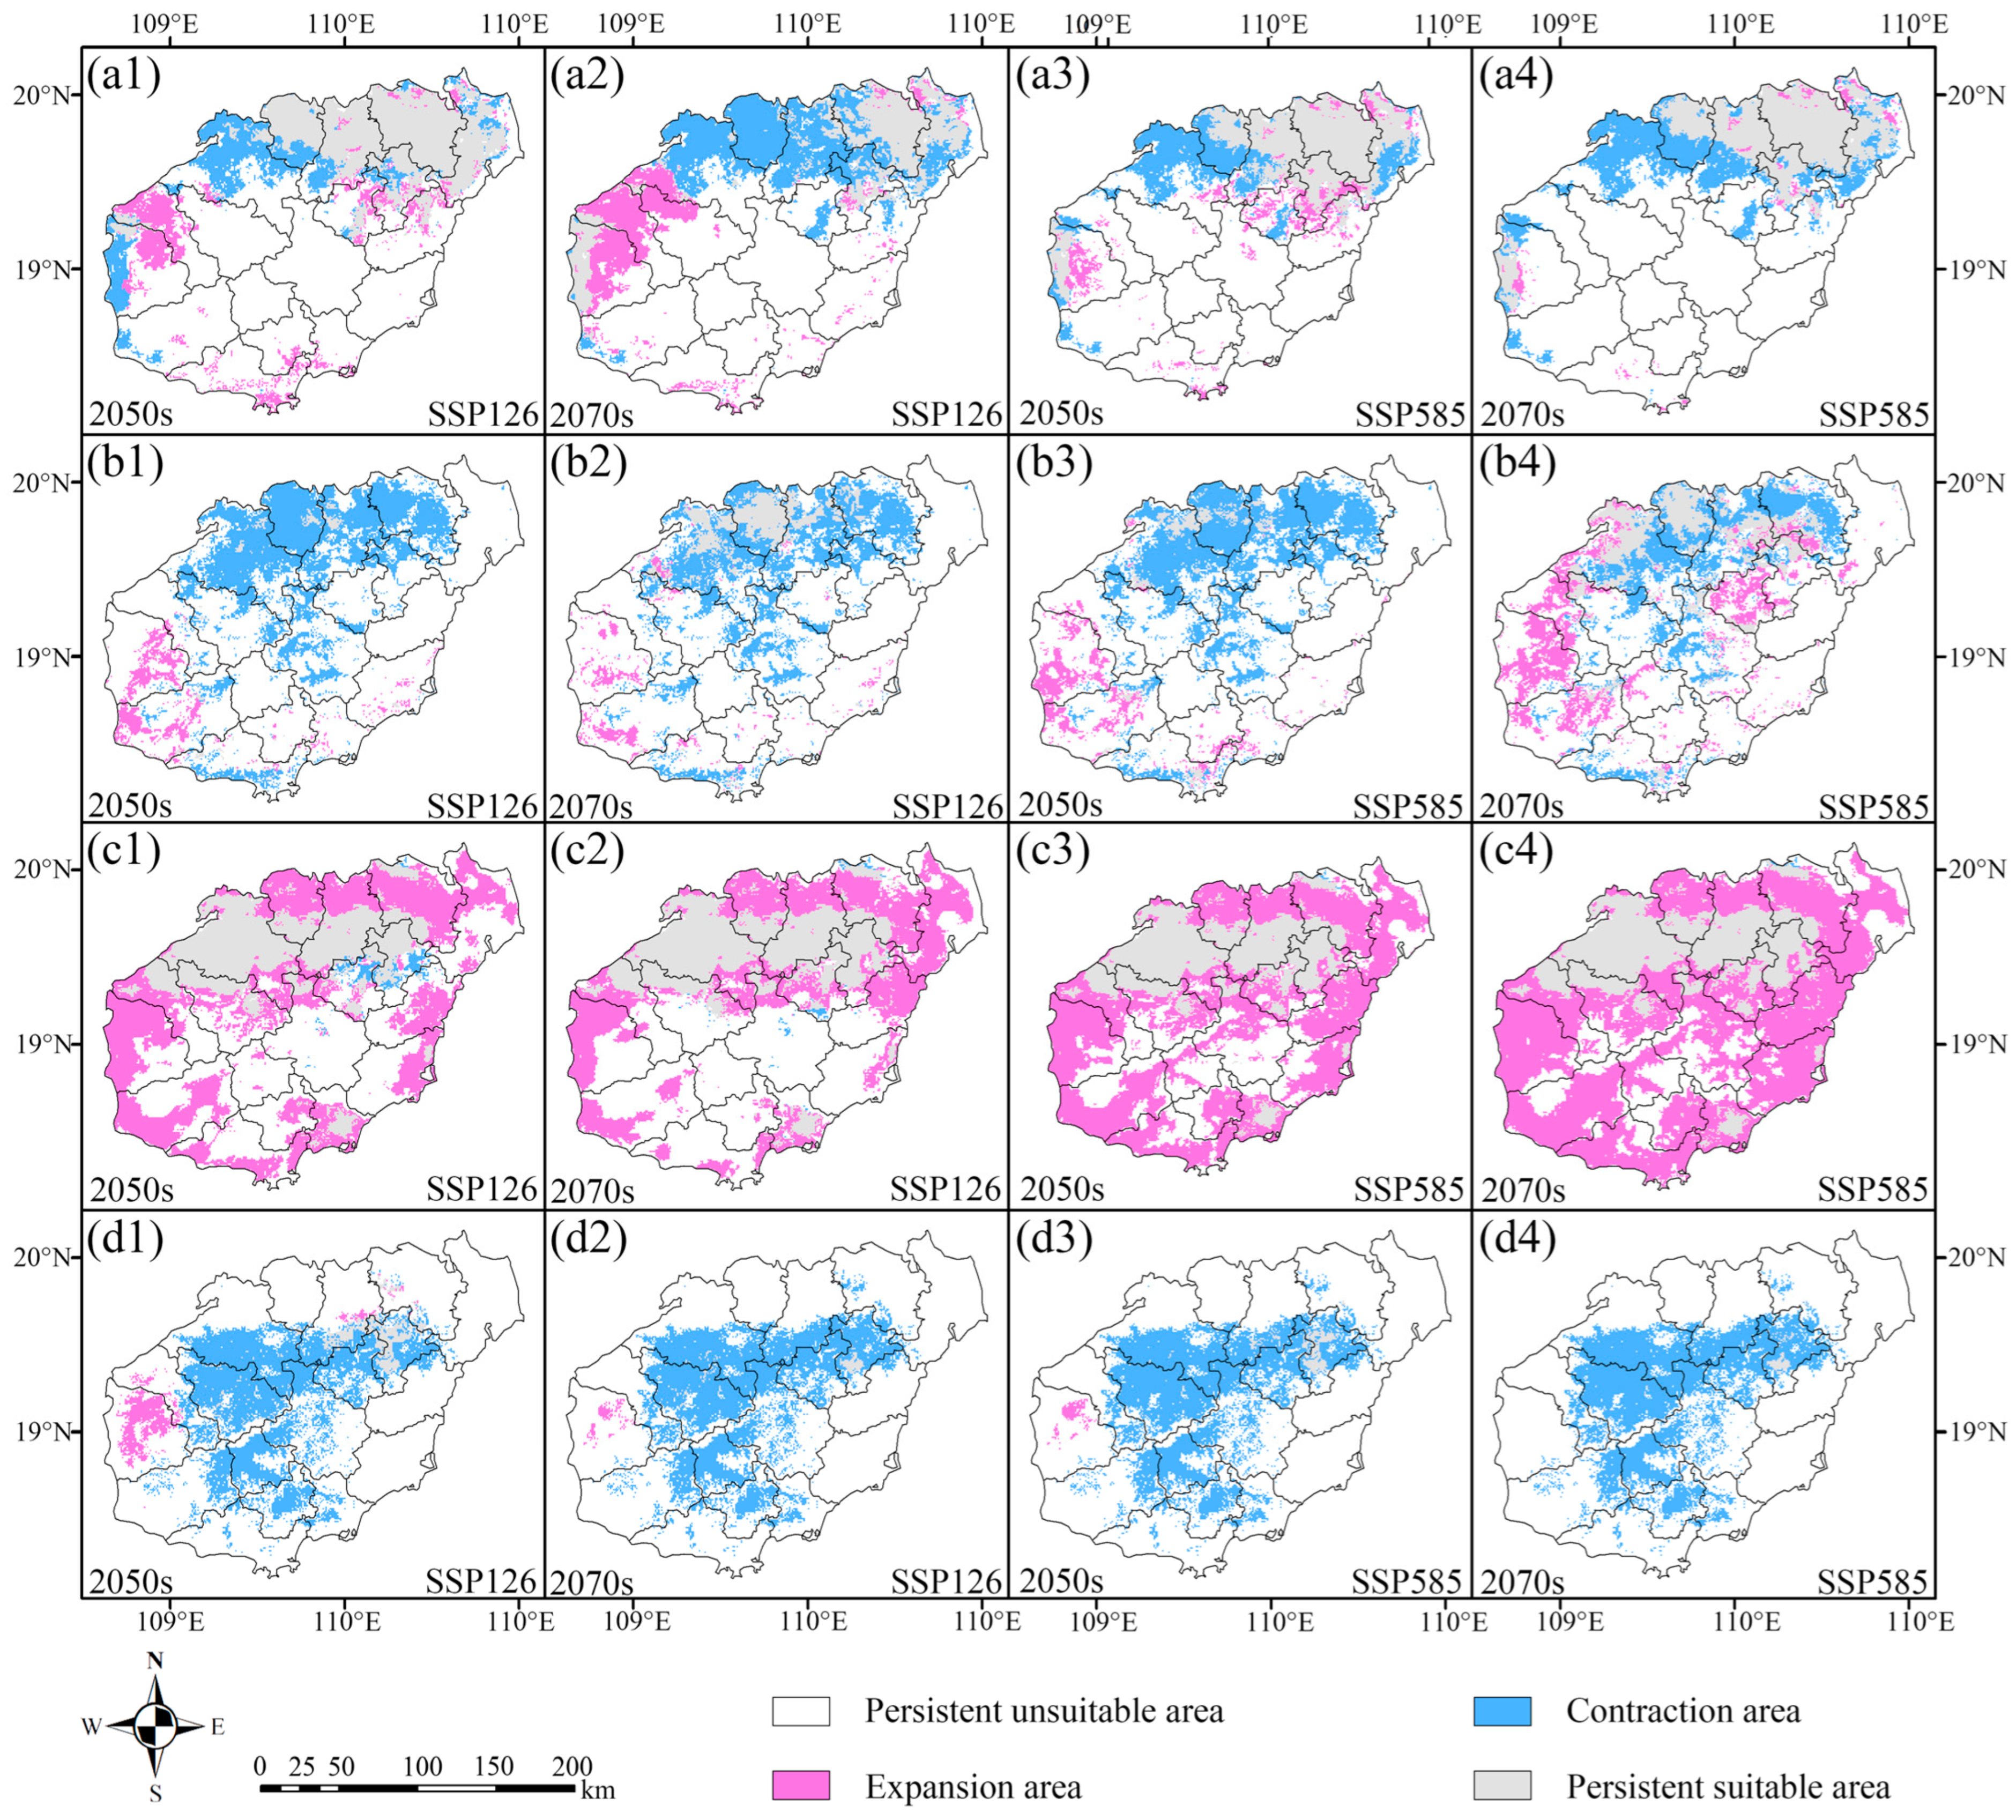
Under the NEPM framework, the potential suitable habitats for the ancient trees of four dominant Ficus species were projected to change markedly under future climate scenarios (Figure 8). Ancient F. benjamina trees showed a clear tendency toward habitat expansion under both SSP126 and SSP585, with only limited areas of contraction. Newly suitable habitats expanded extensively across northern, western, southern, and eastern Hainan Island and became increasingly continuous over time. The largest expansion was projected under SSP585 in the 2070s, when the suitable habitat area increased from 7771.3 to 27,181.9 km2, representing a 249.8% increase relative to the current extent.
Ancient F. microcarpa trees were generally projected to experience habitat contraction. Contraction areas were concentrated mainly in northern and northeastern Hainan Island, whereas newly suitable habitats occurred primarily in western and southwestern regions, with a few scattered patches elsewhere. Habitat loss became greater over time, and the largest reduction occurred under SSP585 in the 2070s, when the suitable habitat area decreased by 40.7% relative to the current extent.
Ancient F. altissima trees also showed an overall contraction of potential suitable habitat, but the magnitude of change differed markedly among scenarios and periods. Contraction was concentrated mainly in northern and central Hainan Island, whereas newly suitable habitats occurred primarily in western and southwestern regions. In the 2050s, suitable habitat decreased by 81.9% under SSP126 and 72.7% under SSP585. By the 2070s, the reduction remained 66.2% under SSP126, whereas under SSP585 it decreased to 10.5%, accompanied by a clear increase in newly suitable areas.
Ancient F. virens trees showed the strongest and most persistent habitat contraction among the four species. Contraction was widespread across central and northern Hainan Island, whereas newly suitable habitats were restricted mainly to small areas in western Hainan. Habitat loss increased over time and was generally greater under SSP585 than under SSP126. By the 2070s under SSP585, newly suitable habitat was nearly absent, and the suitable habitat area declined from 9232.2 to 140.4 km2, corresponding to a 98.5% reduction.
Sensitivity analysis results showed that the overall directions of projected habitat change for the ancient trees of four dominant Ficus species were generally consistent across different RM settings (Supplementary Table S5). Ancient F. benjamina trees retained a pronounced expansion tendency across parameter combinations, with substantial increases still occurring under some scenarios. In contrast, ancient F. microcarpa, F. altissima, and F. virens trees predominantly showed habitat contraction, with ancient F. virens trees consistently exhibiting severe, and in some cases near-extreme, reductions in suitable habitat. The sensitivity models reproduced the major patterns of strong expansion in ancient F. benjamina trees and pronounced contraction in ancient F. virens trees, indicating that these changes were not driven by a single RM setting and further supporting the stability of the overall projected trends and major response patterns.

4. Discussion

4.1. Environmental Associations of Habitat Suitability for the Ancient Trees of Four Dominant Ficus Species

Under the EAM framework, population density (PD) emerged as a key environmental variable of habitat suitability for the ancient trees of four dominant Ficus species on Hainan Island, ranking first in all four species models. The positive response of predicted suitability to PD likely reflects the long-term coupling between the ancient trees of four dominant Ficus species and human settlements rather than an inherent ecological preference for urbanized environments. In southern China, Ficus trees have long been planted or retained in fengshui forests, villages, towns, and areas surrounding temples [9,49]. Their cultural symbolism, broad crowns, shading function, and value as wildlife habitat encourage local communities to protect and maintain old individuals [50]. Comparable studies in China have shown that the persistence of large old trees in human-dominated landscapes is jointly shaped by population density, settlement history, urban planning, and local protection practices [26,28,51]. The concentration of the ancient trees of four dominant Ficus species in densely populated areas may therefore be attributed to historical planting, reduced felling, and continued community stewardship [28]. This interpretation is consistent with the positive association between population density and ancient-tree occurrence reported for the volcanic lava region of northern Hainan [30].
The climatic variables associated with predicted habitat suitability differed among the ancient trees of four dominant Ficus species, although temperature-related variables generally showed stronger associations with predicted suitability than precipitation-related variables. At the individual-variable level, temperature annual range (bio7) was associated with predicted suitability for F. microcarpa and F. benjamina. For F. altissima, the minimum temperature of the coldest month (bio6) and temperature annual range (bio7) were the climatic variables most strongly associated with predicted suitability. By contrast, temperature seasonality (bio4) and the mean temperature of the driest quarter (bio9) were most strongly associated with predicted suitability for F. virens. These patterns suggest that habitat suitability among the four species is associated with different components of thermal variation, including temperature extremes, annual temperature fluctuations, and seasonal thermal conditions. The reported association of temperature-related variables with ancient F. altissima in Guangxi similarly supports the role of thermal conditions in predicting its suitable habitats [52]. Functional-trait and niche differentiation have also been documented among Ficus species and may partly account for the differences in the contributions of temperature variables among species models [53]. The association of individual precipitation variables with predicted suitability also varied among species. For F. altissima, annual precipitation (bio12) and precipitation of the driest quarter (bio17) were associated with predicted suitability, suggesting that both annual water availability and seasonal precipitation may be associated with its habitat suitability. Precipitation of the warmest quarter (bio18) was associated with predicted suitability for F. benjamina, whereas annual precipitation (bio12) was associated with predicted suitability for F. virens. In contrast, precipitation seasonality (bio15) and precipitation of the warmest quarter (bio18) were less strongly associated with predicted suitability for F. microcarpa. These species-specific patterns may be related to differences in drought tolerance, water-use strategies, and physiological responses to hydrothermal stress among Ficus species [54,55].
Soil variables were retained in all four species models, although their cumulative contributions were relatively limited, ranging from 6.4% in F. altissima to 8.4% in F. virens. Variations in cation exchange capacity, gravel and silt contents, and exchangeable sodium are associated with soil water retention, nutrient availability, aeration, and root penetration, and may consequently be associated with the establishment and long-term persistence of ancient trees [21,56,57]. However, no single soil variable consistently showed a high contribution across the four species models, suggesting that soil conditions may be associated with habitat-suitability patterns in combination with climatic and topographic variables. Topographic variables were retained in the models for ancient F. altissima and F. virens trees. Elevation represents an integrated environmental gradient associated with variation in temperature, precipitation, solar radiation, soil properties, and water availability, all of which may be related to plant distribution patterns [58]. In addition, slope and terrain complexity are associated with local drainage, soil development, and microclimatic conditions. For ancient trees occurring in human-dominated landscapes, topography may also be associated with site accessibility and management intensity, although this relationship was not directly evaluated in the present study [59]. Topographic heterogeneity may therefore be associated with the distribution of the ancient trees of four dominant Ficus species through its associations with both local environmental conditions and human accessibility.
Given that Hainan Island is frequently affected by typhoons [60], the typhoon impact intensity index was included as a relative proxy for typhoon exposure, calculated as the product of typhoon-track length and maximum sustained wind speed near the typhoon center, to assess its association with the models for ancient Ficus trees. This variable was excluded during variable screening from the models for ancient F. microcarpa, F. altissima, and F. virens trees, and made only a minor contribution to the model for ancient F. benjamina trees. Compared with population density and climatic, soil, and topographic variables, typhoon impact intensity therefore showed a relatively low model contribution to the four species models at the island scale. This result does not necessarily imply that typhoons have little ecological influence on the ancient trees of four dominant Ficus species. Rather, typhoon impacts may be expressed more strongly through damage to individual trees and local populations than through broad-scale habitat-suitability patterns. The extent of tropical-cyclone damage varies among species and individuals according to tree size, growth form, pre-existing structural damage, wind exposure, and local topography [61,62]. Typhoons may consequently affect the structural stability, growth, health, and persistence of individual ancient trees. In some Ficus species, aerial roots that reach the ground can thicken and provide additional structural support for large branches, potentially increasing resistance to wind-induced structural failure [63]. It should be noted that the typhoon impact intensity index was designed as a relative proxy for broad-scale typhoon exposure rather than as a direct measure of tree-level damage. The product of track length and maximum sustained wind speed integrates exposure and intensity into a relative proxy; wind speed was derived from the same typhoon-track dataset using a consistent definition (maximum sustained wind speed near the typhoon center), and is therefore comparable across events in definition, although the temporal and spatial scales of wind-speed records are not identical among all events. Independent spatially explicit historical data on typhoon-induced damage to ancient Ficus trees were unavailable, preventing direct validation of the index. In addition, the index considered only typhoon-track length and maximum central wind speed and did not fully account for wind duration, rainfall, local topographic exposure, or individual tree condition. Therefore, its limited contribution should be interpreted cautiously and may partly reflect the simplified construction of the index rather than a genuinely weak effect of typhoons on ancient Ficus trees.

4.2. Distribution Patterns of Suitable Habitats for the Ancient Trees of Four Dominant Ficus Species and Their Responses to Climate Change

Under the NEPM framework, the modeled suitable habitats of the ancient trees of four dominant Ficus species under current climatic conditions exhibited distinct patterns in overall spatial extent and the distribution of highly suitable areas. A larger total suitable habitat area did not necessarily correspond to a larger area of highly suitable habitat. These two indicators describe different aspects of modeled habitat suitability: total suitable habitat represents the potential spatial extent of suitable environmental conditions, whereas highly suitable habitat identifies areas with comparatively high predicted suitability. Both indicators are therefore needed to characterize the habitat patterns of ancient trees of the four dominant Ficus species.
Highly suitable habitats were concentrated mainly in northern and northwestern Hainan Island, while those in the central mountainous region were relatively fragmented. This spatial pattern may be associated with the combined effects of natural environmental conditions and long-term human activities. A nationwide analysis of 682,730 large old trees in China showed that their diversity and density were associated not only with climatic and topographic conditions but also with population characteristics and settlement history, highlighting the long-term influence of human–environment interactions on ancient-tree distributions [26]. Huang et al. [27] similarly found that villages and other human-dominated landscapes can serve as refugia for large old trees, with sacred-tree and fengshui-tree traditions, customary regulations, and family institutions contributing to their persistence. The concentration of highly suitable habitats in northern and northwestern Hainan may therefore reflect the combined influence of environmental conditions, historical planting, selective retention, and cultural protection. This spatial pattern is also broadly consistent with the distribution of ancient trees across Hainan Island reported by Q. Li et al. [64].
Under the NEPM framework, the modeled suitable habitats for the ancient trees of four dominant Ficus species were projected to follow strongly contrasting trajectories under future climate scenarios. Suitable habitats for ancient F. benjamina trees were projected to expand under both SSP126 and SSP585, whereas those for ancient F. microcarpa, F. altissima, and F. virens trees were generally projected to contract. Species-specific responses to the same climate scenarios have also been reported for forest trees more broadly [65]. Similar differences have been observed within Ficus: Fungjanthuek et al. [66] projected a contraction in the suitable range of F. squamosa, whereas that of F. heterostyla increased slightly but became more fragmented. These findings support the conclusion that closely related Ficus species may show contrasting changes in modeled habitat suitability because of differences in their climatic associations.
Among the three contraction-dominated species, ancient F. virens trees showed little potential for habitat expansion, and their suitable habitats were projected to undergo the most severe losses, particularly under SSP585. Ancient F. microcarpa and F. altissima trees retained some newly suitable areas, but these localized gains were insufficient to offset their overall habitat contraction. The simultaneous occurrence of extensive losses and localized gains indicates a spatial reorganization of suitable habitats rather than a uniform retreat. Comparable patterns of overall contraction accompanied by limited regional expansion have also been reported for other Ficus species [66].
Changes in highly suitable habitat were not always consistent with changes in total suitable habitat. For ancient F. microcarpa, F. altissima, and F. virens trees, highly suitable habitats generally declined more strongly than total suitable habitats. This indicates that areas with the highest predicted suitability may be lost even where some moderately or marginally suitable areas remain. Conversely, both total and highly suitable habitats for ancient F. benjamina trees were projected to expand substantially. The projected expansion but increasing fragmentation of suitable habitat for F. heterostyla reported by Fungjanthuek et al. [66] similarly shows that changes in total suitable area do not necessarily correspond to equivalent changes in the spatial continuity or level of habitat suitability.
Comparisons between SSP126 and SSP585 further demonstrated that stronger climate forcing did not result in a uniform directional response across the ancient trees of four dominant Ficus species. Habitat contraction was generally more pronounced under SSP585 for ancient F. microcarpa and F. virens trees, whereas habitat expansion became more extensive for ancient F. benjamina trees. Ancient F. altissima trees exhibited a more complex response, with SSP585 resulting in relatively weaker overall habitat contraction and greater expansion of suitable habitats than SSP126 during some future periods. Therefore, higher emission scenarios did not simply lead to greater habitat loss across all ancient trees of four dominant Ficus species, but instead highlighted divergent and species-specific responses to future climate change. Similar scenario-dependent and species-specific responses have also been reported for forest trees and other Ficus species [65,66].
The weaker projected contraction of suitable habitats for ancient F. microcarpa and F. virens trees under SSP126 suggests that a lower-emission pathway may reduce habitat-loss pressure for some vulnerable ancient Ficus species. Previous studies have shown that early greenhouse-gas mitigation can reduce projected losses of species’ climatic ranges and that limiting warming to 1.5 °C rather than 2 °C substantially lowers the risk of severe range loss among plants [67,68]. However, the effects were not uniform among the ancient trees of four dominant Ficus species. SSP126 reduced the projected expansion of suitable habitat for ancient F. benjamina trees and did not consistently produce more favorable outcomes for ancient F. altissima trees. Lower-emission pathways may therefore alleviate projected habitat deterioration for some ancient Ficus species, but the magnitude and direction of this effect remain species dependent.

4.3. Recommendations for the Conservation of Ancient Ficus Tree Resources on Hainan Island

The warm and humid climate of Hainan Island, together with its long history of human settlement and traditional practices of ancient-tree protection, has fostered and preserved abundant ancient Ficus tree resources. However, the long-term persistence of ancient trees is influenced by the combined effects of climatic, ecological, and anthropogenic factors [21]. Based on the findings of this study, future climate change may lead to the contraction of suitable habitats or the decline in habitat quality for most ancient Ficus trees, with marked differences among species and climate scenarios. Therefore, the conservation of ancient Ficus trees on Hainan Island should integrate the protection of existing ancient individuals, the maintenance of suitable habitats, and the long-term continuity of species resources. In light of these considerations, the following recommendations are proposed:
Recommendations (2) and (3) are based on NEPM habitat-suitability projections, whereas recommendation (1) and the operational measures within (2) and (3) represent general management practices.
(1)
A community-based protection mechanism should be established for individual ancient trees. Many ancient Ficus trees on Hainan Island are distributed near villages, temples, roads, and other human settlements, and their long-term persistence is closely related to local cultural recognition and community protection. Therefore, a community-based responsibility system should be established for individual ancient trees and their surrounding habitats, with clear responsibilities for routine inspection, health monitoring, and maintenance. Regular management should include soil improvement, pest and disease control, drainage maintenance, tree support, and the control of construction, excavation, surface hardening, and soil compaction within root zones. Meanwhile, ancient-tree conservation could be incorporated into local cultural interpretation and environmental education. However, tourism and cultural activities should remain within the carrying capacity of ancient trees and their habitats to avoid additional disturbance to tree crowns, root systems, and surrounding microhabitats.
(2)
It is also necessary to establish a zone-based conservation system according to habitat stability. Based on current habitat suitability and projected changes under future climate scenarios, conservation spaces could be divided into core conservation areas, priority restoration areas, and future cultivation areas. Core conservation areas should cover habitats that are currently highly suitable, together with areas projected to remain stable under future climate scenarios. In these areas, development activities that may damage ancient trees or alter local soil and hydrological conditions should be strictly restricted. Priority restoration areas could include habitats where suitability is expected to decline or fragmentation is projected to increase. Here, soil and hydrological conditions should be restored, anthropogenic disturbance should be reduced, and ecological connectivity among suitable habitat patches should be improved. For ancient trees with declining growth vigor, targeted rejuvenation measures should be implemented on the basis of individual health assessments. The last type of conservation space could be defined as future cultivation areas, where habitats are projected to remain or become suitable under future climate scenarios. These areas could be used for cultivating successor trees, establishing ex situ conservation populations, and preserving germplasm resources. Propagation materials should preferably be collected from healthy ancient trees representing different local populations so as to maintain genetic diversity and avoid excessive dependence on a small number of parent trees.
(3)
Species- and scenario-specific conservation strategies should be developed. Ancient F. microcarpa, F. altissima, and F. virens trees are generally projected to experience habitat contraction under future climate scenarios. Conservation priority should therefore be given to areas where currently highly suitable habitats overlap with habitats projected to remain suitable in the future, as these areas may provide relatively stable conditions for the long-term persistence of existing ancient trees. Among the three species, ancient F. virens trees face the greatest projected habitat loss, particularly under SSP585. For this species, protection and management of the remaining suitable habitats should be strengthened, accompanied by germplasm collection, artificial propagation, and the establishment of ex situ conservation or backup populations. Although ancient F. microcarpa and F. altissima trees may gain some newly suitable habitats, their overall habitat changes remain dominated by contraction. Conservation planning should therefore consider not only changes in total suitable habitat but also the substantial loss of highly suitable habitats. Ancient F. benjamina trees show considerable potential for habitat expansion under both future climate scenarios. Newly suitable areas may provide candidate sites for cultivating successor trees, planting native trees, and implementing ecological restoration, subject to field verification of local environmental and management conditions. However, the projected expansion of suitable habitat should not be interpreted as a reduction in the conservation value of existing ancient individuals. Ancient trees possess irreplaceable historical, cultural, genetic, and ecological values, and their in situ protection should remain the primary conservation objective.
Overall, the conservation of ancient Ficus tree resources on Hainan Island should shift from the isolated maintenance of individual ancient trees toward an integrated system combining community participation, spatial zoning, species-specific management, germplasm preservation, and climate-adaptive cultivation. Such a system could simultaneously protect existing ancient trees, maintain the stability of their surrounding habitats, and ensure the long-term continuity of ancient Ficus tree resources.

4.4. Limitations and Future Perspectives

Several limitations should be acknowledged. First, MaxEnt assumes that species–environment relationships remain relatively stable over time, but it does not explicitly account for phenotypic plasticity, local adaptation, population renewal, or dispersal capacity. Because ancient trees generally have long generation times and slow natural regeneration, excluding these biological processes may result in either overestimation or underestimation of future habitat suitability. Future studies should incorporate demographic renewal, genetic diversity, physiological tolerance, and dispersal constraints into modeling frameworks to better represent the long-term responses of ancient Ficus trees to climate change. Second, although the occurrence records used in this study were obtained from a systematic governmental inventory rather than opportunistic observations, potential accessibility-related sampling bias cannot be completely excluded. Ancient trees located near settlements, roads, temples, or other easily accessible areas may have a higher probability of being surveyed and recorded than those occurring in remote regions. The occurrence data were spatially filtered to reduce the influence of clustered records; however, this procedure cannot fully correct accessibility-related bias. Future studies incorporating explicit survey-effort information, accessibility indices, or independent field surveys may further evaluate and reduce the potential influence of sampling bias. Third, the spatial resolution used in this study was 30″, approximately 1 km. Although this resolution is suitable for identifying broad distribution patterns across Hainan Island, it may not fully capture fine-scale variation in microclimate, soil moisture, topography, and human disturbance around individual ancient trees. Finally, in the future projections of the NEPM, only climatic variables were updated, whereas soil and topographic variables were held constant; anthropogenic and typhoon-related variables were not included in the projection framework. In addition, future climate projections were based on a single GCM, BCC-CSM2-MR, and therefore do not capture structural uncertainty among climate models. Although this model performs well over China, the projected area changes should be interpreted as climate-driven potential changes conditional on this model rather than precise forecasts. Because MESS values were negative across most of the modeling extent under all future scenarios (Figure 7), the projected area changes for the ancient trees of four dominant Ficus species fall largely within non-analog climate space. These changes should be interpreted as relative directions of habitat change rather than as precise area estimates, and they are influenced by clamping and extrapolation uncertainty. Overall, the projected changes primarily reflect potential responses to climate change under otherwise static natural environmental conditions and do not account for future changes in land use, population distribution, or typhoon disturbance. Future studies could incorporate dynamic anthropogenic and disturbance scenarios, multiple global climate models, and projected changes in typhoon regimes within an integrated modeling framework. Multi-model ensemble projections and independent field validation would further help quantify projection uncertainty and provide a more robust basis for conservation zoning, germplasm preservation, habitat restoration, and successor-tree cultivation.

5. Conclusions

This study used two parameter-optimized MaxEnt frameworks to investigate the ancient trees of four dominant Ficus species on Hainan Island. The Environmental Association Model (EAM) was used to identify environmental factors associated with the current distributions of ancient Ficus microcarpa, F. altissima, F. benjamina, and F. virens trees, whereas the Natural-Environment Projection Model (NEPM) was used to evaluate their potential habitat suitability under current and future climate conditions. The main conclusions are as follows:
(1)
Population density was identified as a key environmental variable in the models for the ancient trees of four dominant Ficus species and was positively associated with their model-predicted geographic distributions, although its contribution varied among species. Climatic and soil variables also contributed to all four species models, although their relative contributions differed among species. Topographic variables contributed to the models for ancient F. altissima and F. virens trees, whereas the typhoon-related variable made only a minor contribution to the model for ancient F. benjamina trees.
(2)
Under current climatic conditions, the ancient trees of four dominant Ficus species differed markedly in both total suitable habitat and highly suitable habitat. Ancient F. microcarpa trees had the largest total suitable habitat, whereas ancient F. altissima trees had the largest highly suitable habitat. Highly suitable habitats for the ancient trees of four dominant Ficus species were concentrated mainly in northern and northwestern Hainan Island.
(3)
Under the assumption that non-climatic variables were held constant, future changes in suitable habitats were strongly species- and climate-scenario-specific. The total and highly suitable habitats of ancient F. benjamina trees were projected to expand under both scenarios, with greater expansion under SSP585. In contrast, ancient F. microcarpa, F. altissima, and F. virens trees generally showed habitat contraction and substantial losses of highly suitable habitats. Habitat loss for ancient F. microcarpa and F. virens trees was more severe under SSP585, whereas ancient F. altissima trees showed more complex scenario-dependent changes. Sensitivity analyses using alternative regularization settings reproduced the major directions of habitat change, supporting the robustness of these overall projected trends.
Overall, conservation efforts should prioritize currently highly suitable and climatically stable habitats, particularly for species projected to undergo substantial habitat contraction. Species-specific measures, including habitat restoration, germplasm conservation, successor-tree cultivation, and long-term monitoring, are needed to support the persistence of ancient Ficus resources on Hainan Island under future environmental change.

Supplementary Materials

The following supporting information can be downloaded at: https://www.mdpi.com/article/10.3390/f17101174/s1, Tables S1–S4: Pearson correlation matrices of environmental variables for the ancient trees of four dominant Ficus species (corresponding to the heatmaps in Figure 2); Table S5: Sensitivity analysis results of projected habitat changes for the ancient trees of four dominant Ficus species under different regularization multiplier (RM) settings; Tables S6–S9: Detailed results of MaxEnt model parameter optimization under the EAM framework for the ancient trees of four dominant Ficus species; Tables S10–S13: Detailed results of MaxEnt model parameter optimization under the NEPM framework for the ancient trees of four dominant Ficus species; Table S14: Summary of retained occurrence records for the ancient trees of four dominant Ficus species after spatial autocorrelation filtering; Table S15: Detailed information on the environmental variables used for modeling the ancient trees of four dominant Ficus species; Table S16: Detailed statistics of suitable habitat areas for the ancient trees of four dominant Ficus species under current and future climate scenarios; Table S17: Detailed statistics of habitat area changes (expansion, contraction, persistent unsuitable, and persistent suitable areas) for the ancient trees of four dominant Ficus species under future climate scenarios.

Author Contributions

Methodology, J.Z., J.L. and W.L.; Software, J.L. and W.L.; Validation, R.W., J.Z. and S.D.; Formal analysis, J.Z.; Investigation, H.Y., R.W., L.L., B.Z., J.Z., S.D., J.L., W.L. and Y.L.; Writing—original draft, J.Z.; Writing—review & editing, J.Z., J.L. and W.L.; Visualization, J.Z., W.L., J.L. and Y.L.; Supervision, W.L. and J.L.; Funding acquisition, W.L. and J.L. All authors have read and agreed to the published version of the manuscript.

Funding

This research was funded by the Hainan Provincial Natural Science Foundation of China (No. 423MS021) and the National Natural Science Foundation of China (No. 32660419).

Data Availability Statement

The data presented in this study are available upon request from the corresponding author. Due to privacy reasons, these data are not publicly available.

Conflicts of Interest

The authors declare no conflicts of interest.

References

  1. State Council of the People’s Republic of China. Regulations on the Protection of Ancient and Notable Trees. State Council Decree No. 800; State Council of the People’s Republic of China: Beijing, China, 2025. [Google Scholar]
  2. Blicharska, M.; Mikusiński, G. Incorporating social and cultural significance of large old trees in conservation policy. Conserv. Biol. 2014, 28, 1558–1567. [Google Scholar] [CrossRef] [Scilit] [PubMed]
  3. Lindenmayer, D.B. Conserving large old trees as small natural features. Biol. Conserv. 2017, 211, 51–59. [Google Scholar] [CrossRef] [Scilit]
  4. Wenk, E.H.; Falster, D.S. Quantifying and understanding reproductive allocation schedules in plants. Ecol. Evol. 2015, 5, 5521–5538. [Google Scholar] [CrossRef] [Scilit] [PubMed]
  5. Kang, X.; Meng, H.; Lu, J.; Zhu, J. Resource composition and spatial distribution characteristics of ancient and famous trees in the Lijiang River basin. Guangxi Sci. 2024, 31, 1076–1088. [Google Scholar]
  6. Zhao, P.; Ren, Z. Distribution and cultural value of old tree resources in Xinzhou city. J. Arid Land Resour. Environ. 2023, 37, 150–156. [Google Scholar]
  7. Li, J.; Li, J.; Xiong, C. Valuation and multi scenario simulation of ecosystem services in National Park of Hainan tropical rainforest. Acta Ecol. Sin. 2026, 46, 3985–3998. [Google Scholar]
  8. Zuo, J.; Zhang, L.; Chen, B.; Hu, Y.; Zhang, B.; Raza, S.A.; Zhang, S.; Ruan, L. A cost-benefit synergistic framework for balancing ecological importance and vulnerability in island conservation. Int. J. Digit. Earth 2026, 19, 2625557. [Google Scholar] [CrossRef] [Scilit]
  9. Lin, L.; Chen, F.; Huang, C.; Hong, W.; Zhang, M. Resources and growth characteristics of ancient Ficus trees in Hainan Province. For. Resour. Manag. 2023, 3, 121–127. [Google Scholar]
  10. Li, D.; Li, T.; Xue, W.; Xia, Y.; Wang, Z. Prediction and analysis of potential habitat distribution of Taxus wallichiana var. chinensis under climate change: A case study of Hubei Province. Ecol. Environ. Sci. 2025, 34, 1398–1409. [Google Scholar]
  11. Phillips, S.J.; Anderson, R.P.; Schapire, R.E. Maximum entropy modeling of species geographic distributions. Ecol. Model. 2006, 190, 231–259. [Google Scholar] [CrossRef] [Scilit]
  12. Zhang, X.; Zhao, J.; Li, Z.; Wang, M.; Chen, H. Prediction of the potential suitable areas of Amaranthus palmeri in China based on four ecological niche models. Plant Prot. 2023, 49, 73–82. [Google Scholar]
  13. Zhao, Y. Predicting Potential Suitable Habitats of Chinese fir Under Different Climatic Scenarios Based on Ecological Niche Models. Master’s Thesis, Central South University of Forestry & Technology, Changsha, China, 2022. [Google Scholar]
  14. Gao, W.; Hu, X.; Sun, S.; Zhang, J.; Meng, P.; Cai, J. Prediction of the distribution of Robinia pseudoacacia in China under future climate using an optimized MaxEnt model. Sci. Silvae Sin. 2025, 61, 104–116. [Google Scholar]
  15. Lyu, Y.; Pan, W.; Rao, X.; Liu, H. Prediction of potential suitable habitats of Rhus typhina in China based on an optimized MaxEnt model. J. Biosaf. 2025, 34, 249–257. [Google Scholar]
  16. Tian, X.; Wei, H.; Xie, S.; Chu, Q.; Yang, J.; Zhang, Y.; Xiao, S.; Tang, Z.; Liu, Y.; Li, D. Potential geographical distribution of Acer in Northeast China based on the MaxEnt model. Ecol. Environ. Sci. 2024, 33, 509–519. [Google Scholar]
  17. Zeng, W.; Wang, D.; Ye, C.; Gong, Y.; Wang, Y.; Zhang, Q. Prediction of potential distribution of Cupressus gigantea W. C. Cheng & L. K. Fu in China based on optimized MaxEnt modeling. Plant Sci. J. 2025, 43, 52–62. [Google Scholar]
  18. He, Y.; Ma, J.; Chen, G. Potential geographical distribution and its multi-factor analysis of Pinus massoniana in China based on MaxEnt model. Ecol. Indic. 2023, 154, 110790. [Google Scholar] [CrossRef] [Scilit]
  19. Liu, P. Geographical Distribution Changes and Conservation Strategies of Suitable Habitats for Ancient Trees in the Yangtze River Basin Under Climate Change. Master’s Thesis, Nanjing Agricultural University, Nanjing, China, 2023. [Google Scholar]
  20. Qiu, H.; Chen, C. Habitat suitability evaluation of ancient ginkgo trees in Changsha based on random forest and MaxEnt model. J. Cent. South Univ. For. Technol. 2024, 44, 87–97. [Google Scholar]
  21. Wan, J.-Z.; Li, Q.-F.; Wei, G.-L.; Yin, G.-J.; Wei, D.-X.; Song, Z.-M.; Wang, C.-J. The effects of the human footprint and soil properties on the habitat suitability of large old trees in alpine urban and periurban areas. Urban For. Urban Green. 2020, 47, 126520. [Google Scholar] [CrossRef] [Scilit]
  22. Chen, Z.; Zhong, Y.; Yang, Z.; He, R. Habitat suitability assessment for eight ancient tree species on Hainan Island under climate change. J. Cent. South Univ. For. Technol. 2026, 46, 89–100. [Google Scholar]
  23. Dai, B. Study on Characteristics and Protection Strategies of Old and Famous Tree Resources in Hainan Province. Master’s Thesis, Hainan University, Haikou, China, 2020. [Google Scholar]
  24. Luo, W.; Mo, S.; Chen, H.; Xu, H. Investigation and analysis of ancient trees in Jianfengling National Forest Park, Hainan. J. Fujian For. Sci. Technol. 2020, 47, 101–105. [Google Scholar]
  25. Zhuo, F.; Lin, L.; Yang, X.; Chen, L.; Wang, R. Analysis on resource characteristics of ancient trees of Antiaris toxicaria in Hainan. Hortic. Seed 2023, 43, 4–6. [Google Scholar]
  26. Liu, J.; Lindenmayer, D.B.; Yang, W.; Ren, Y.; Campbell, M.J.; Wu, C.; Luo, Y.; Zhong, L.; Yu, M. Diversity and density patterns of large old trees in China. Sci. Total Environ. 2019, 655, 255–262. [Google Scholar] [CrossRef] [Scilit] [PubMed]
  27. Huang, L.; Tian, L.; Zhou, L.; Jin, C.; Qian, S.; Jim, C.Y.; Lin, D.; Zhao, L.; Minor, J.; Coggins, C.; et al. Local cultural beliefs and practices promote conservation of large old trees in an ethnic minority region in southwestern China. Urban For. Urban Green. 2020, 49, 126584. [Google Scholar] [CrossRef] [Scilit]
  28. Tian, P.; Liu, Y.; Lyu, W.; Wang, H. Exploring influential factors on biomass and diversity of ancient trees in human-dominated regions: A case study in Guangdong Province, China. J. Clean. Prod. 2024, 480, 143965. [Google Scholar] [CrossRef] [Scilit]
  29. Xie, C.; Yan, J.; Liu, D.; Jim, C.Y. Diversity and abundance of large old trees in Hainan Island: Spatial analysis and environmental correlations. Biotropica 2024, 56, e13391. [Google Scholar] [CrossRef] [Scilit]
  30. Yang, H.; Liu, Y.; Wang, R.; Li, W.; Lei, J. Analysis of the spatial distribution pattern and influencing factors of ancient trees in the volcanic lava area of Northern Qionghai based on GIS and GWR. Ecol. Environ. Sci. 2026, 35, 403–413. [Google Scholar]
  31. Qiao, S.; Wang, Y.; Chen, Y.; Zhao, Y.; Zeng, W.; Jin, S.; Gao, M. Study on the influence of climate change on the distribution and future change of five Litsea species. Acta Ecol. Sin. 2025, 45, 3401–3420. [Google Scholar]
  32. Yang, J.; Huang, X. The 30 m annual land cover datasets and its dynamics in China from 1985 to 2025. In Data Set; Zenodo: Geneva, Switzerland, 2026. [Google Scholar]
  33. Guo, L.; Zhang, C.; Gong, X.; Ma, X.; Cao, Y.; Wang, B.; Yang, J. Prediction of potential suitable area of Picea neoveitchii and the influence of future climate changes on its distribution based on the optimized model. J. West China For. Sci. 2024, 53, 39–46. [Google Scholar]
  34. Li, H.; Yin, X.; Wang, Y.; Tang, J. Prediction of the distribution of rare and endangered Dipterocarpaceae tree species in China and research on priority conservation areas. J. Cent. South Univ. For. Technol. 2026, 46, 80–90. [Google Scholar]
  35. Dormann, C.F.; Elith, J.; Bacher, S.; Buchmann, C.; Carl, G.; Carré, G.; García Márquez, J.R.; Gruber, B.; Lafourcade, B.; Leitão, P.J.; et al. Collinearity: A review of methods to deal with it and a simulation study evaluating their performance. Ecography 2013, 36, 27–46. [Google Scholar] [CrossRef] [Scilit]
  36. Kass, J.M.; Muscarella, R.; Galante, P.J.; Bohl, C.L.; Buitrago-Pinilla, G.E.; Boria, R.A.; Soley-Guardia, M.; Anderson, R.P. ENMeval 2.0: Redesigned for customizable and reproducible modeling of species’ niches and distributions. Methods Ecol. Evol. 2021, 12, 1602–1608. [Google Scholar] [CrossRef] [Scilit]
  37. Phillips, S.J.; Anderson, R.P.; Dudík, M.; Schapire, R.E.; Blair, M.E. Opening the black box: An open-source release of Maxent. Ecography 2017, 40, 887–893. [Google Scholar] [CrossRef] [Scilit]
  38. Lyu, Z.; Zhu, X.; Ye, X.; Wen, G.; Jiang, T.; Lai, W.; Shi, C.; Huang, Q.; Zhang, G. Impacts of climate change on the suitable habitats and spatial migration of Tetraena mongolica. Acta Ecol. Sin. 2024, 44, 1164–1176. [Google Scholar]
  39. Elith, J.; Kearney, M.; Phillips, S. The art of modelling range-shifting species. Methods Ecol. Evol. 2010, 1, 330–342. [Google Scholar] [CrossRef] [Scilit]
  40. Wang, Y.; Ren, X.; Wang, K.; Lin, W.; Wang, P.; Liu, Z.; Zhang, H.; Zhou, N. Maxent model-based prediction of the potential distribution of Fritillaria taipaiensis P. Y. Li. Sci. Rep. 2025, 15, 20837. [Google Scholar] [CrossRef] [Scilit] [PubMed]
  41. Swets, J.A. Measuring the accuracy of diagnostic systems. Science 1988, 240, 1285–1293. [Google Scholar] [CrossRef] [Scilit] [PubMed]
  42. Warren, D.L.; Seifert, S.N. Ecological niche modeling in Maxent: The importance of model complexity and the performance of model selection criteria. Ecol. Appl. 2011, 21, 335–342. [Google Scholar] [CrossRef] [Scilit] [PubMed]
  43. Radosavljevic, A.; Anderson, R.P. Making better Maxent models of species distributions: Complexity, overfitting and evaluation. J. Biogeogr. 2014, 41, 629–643. [Google Scholar] [CrossRef] [Scilit]
  44. Liu, Y.; Chen, S.; Zhang, H.; Luo, H.; Hu, J.; Liu, S. Optimized MaxEnt model predicts potential suitable habitats of Bidens bipinnata in China under climate change scenario. Front. Plant Sci. 2025, 16, 1702523. [Google Scholar] [CrossRef] [Scilit] [PubMed]
  45. Liu, C.; Newell, G.; White, M. On the selection of thresholds for predicting species occurrence with presence-only data. Ecol. Evol. 2016, 6, 337–348. [Google Scholar] [CrossRef] [Scilit] [PubMed]
  46. Liu, C.; White, M.; Newell, G. Selecting thresholds for the prediction of species occurrence with presence-only data. J. Biogeogr. 2013, 40, 778–789. [Google Scholar] [CrossRef] [Scilit]
  47. Brown, J.L.; Bennett, J.R.; French, C.M. SDMtoolbox 2.0: The next generation Python-based GIS toolkit for landscape genetic, biogeographic and species distribution model analyses. PeerJ 2017, 5, e4095. [Google Scholar] [CrossRef] [Scilit] [PubMed]
  48. York, E.M.; Butler, C.J.; Lord, W.D. Global decline in suitable habitat for Angiostrongylus (= Parastrongylus) cantonensis: The role of climate change. PLoS ONE 2014, 9, e103831. [Google Scholar] [CrossRef] [Scilit] [PubMed][Green Version]
  49. Wei, D.; Zheng, C.; Ye, G.; Shen, F.; Chen, P. Resource distribution and culture elements of ancient trees in Guangdong Province. J. Northwest For. Univ. 2021, 36, 181–187. [Google Scholar]
  50. Lin, Y.; Shui, W.; Feng, J.; Wu, C.; Jiang, C. Study on the impact of the canopy shade of Ficus trees and human physiological health based on a field experiment in high temperature. Chin. Landsc. Archit. 2025, 41, 31–38. [Google Scholar]
  51. Lai, P.Y.; Jim, C.Y.; Tang, G.D.; Hong, W.J.; Zhang, H. Spatial differentiation of heritage trees in the rapidly-urbanizing city of Shenzhen, China. Landsc. Urban Plan. 2019, 181, 148–156. [Google Scholar] [CrossRef] [Scilit]
  52. Gu, H.; Chen, Y.; Zhang, Q. Assessment of suitability evaluation for Ficus altissima Blume ancient trees in different climatic environments in Guangxi, China. Front. Plant Sci. 2025, 16, 1613723. [Google Scholar] [CrossRef] [Scilit] [PubMed]
  53. Lasky, J.R.; Yang, J.; Zhang, G.; Cao, M.; Tang, Y.; Keitt, T.H. The role of functional traits and individual variation in the co-occurrence of Ficus species. Ecology 2014, 95, 978–990. [Google Scholar] [CrossRef] [Scilit] [PubMed]
  54. Chen, H.; Geekiyanage, N.; Wen, B.; Cao, K.-F.; Goodale, U.M. Regeneration responses to water and temperature stress drive recruitment success in hemiepiphytic fig species. Tree Physiol. 2021, 41, 358–370. [Google Scholar] [CrossRef] [Scilit] [PubMed]
  55. Yang, J.; Fan, H.; He, Y.; Wang, G.; Cao, M.; Swenson, N.G. Functional genomics and co-occurrence in a diverse tropical tree genus: The roles of drought- and defence-related genes. J. Ecol. 2024, 112, 575–589. [Google Scholar] [CrossRef] [Scilit]
  56. Zhu, K.; Dai, J.; Pang, J.; Han, X.; Zuo, X.; Peng, J. Inventory and characteristic analysis for ancient and famous tree resources in Mangshi, Yunnan Province. For. Resour. Manag. 2020, 1, 22–29. [Google Scholar]
  57. Qi, N.; Cui, J.; Xiao, H.; Li, C.; Ding, X.; Wang, Y.; Feng, H.; Zhang, J.; Chen, X.; Lang, T.; et al. Impacts of climate change and human activity on the potential distribution of Xanthoceras sorbifolium Bunge in China. Ind. Crops Prod. 2025, 235, 121707. [Google Scholar] [CrossRef] [Scilit]
  58. Maharjan, S.K.; Sterck, F.J.; Raes, N.; Poorter, L. Temperature and soils predict the distribution of plant species along the Himalayan elevational gradient. J. Trop. Ecol. 2022, 38, 58–70. [Google Scholar] [CrossRef] [Scilit]
  59. Lundbäck, M.; Persson, H.; Häggström, C.; Nordfjell, T. Global analysis of the slope of forest land. Forestry 2021, 94, 54–69. [Google Scholar] [CrossRef] [Scilit]
  60. Lu, G.; Wang, W.; Zheng, M.; Cai, Q. Spatial and temporal distribution characteristics of typhoon precipitation in Hainan. Trans. Atmos. Sci. 2015, 38, 710–715. [Google Scholar]
  61. Ostertag, R.; Silver, W.L.; Lugo, A.E. Factors affecting mortality and resistance to damage following hurricanes in a rehabilitated subtropical moist forest. Biotropica 2005, 37, 16–24. [Google Scholar] [CrossRef] [Scilit]
  62. Ibanez, T.; Bauman, D.; Aiba, S.-I.; Arsouze, T.; Bellingham, P.J.; Birkinshaw, C.; Birnbaum, P.; Curran, T.J.; DeWalt, S.J.; Dwyer, J.; et al. Damage to tropical forests caused by cyclones is driven by wind speed but mediated by topographical exposure and tree characteristics. Glob. Change Biol. 2024, 30, e17317. [Google Scholar] [CrossRef] [Scilit] [PubMed]
  63. Moles, A.T.; Jagdish, A.; Wu, Y.; Gooley, S.; Dalrymple, R.L.; Feng, P.; Auld, J.; Badgery, G.; Balding, M.; Bell, A.; et al. From dangerous branches to urban banyan: Facilitating aerial root growth of Ficus rubiginosa. PLoS ONE 2019, 14, e0226845. [Google Scholar] [CrossRef] [Scilit] [PubMed]
  64. Li, Q.; Yuan, J.; Cao, Q.; Padullés Cubino, J.; Nizamani, M.M.; Zhu, M.; Wang, G.; Bai, Y.; Wang, H. Habitat heterogeneity and socioeconomic factors shape the spatial patterns of ancient trees on Hainan, China. J. For. Res. 2026, 37, 88. [Google Scholar] [CrossRef] [Scilit]
  65. Dyderski, M.K.; Paź, S.; Frelich, L.E.; Jagodziński, A.M. How much does climate change threaten European forest tree species distributions? Glob. Change Biol. 2018, 24, 1150–1163. [Google Scholar] [CrossRef] [Scilit] [PubMed]
  66. Fungjanthuek, J.; Huang, M.-J.; Hughes, A.C.; Huang, J.-F.; Chen, H.-H.; Gao, J.; Peng, Y.-Q. Ecological niche overlap and prediction of the potential distribution of two sympatric Ficus (Moraceae) species in the Indo-Burma region. Forests 2022, 13, 1420. [Google Scholar] [CrossRef] [Scilit]
  67. Warren, R.; VanDerWal, J.; Price, J.; Welbergen, J.A.; Atkinson, I.; Ramirez-Villegas, J.; Osborn, T.J.; Jarvis, A.; Shoo, L.P.; Williams, S.E.; et al. Quantifying the benefit of early climate change mitigation in avoiding biodiversity loss. Nat. Clim. Change 2013, 3, 678–682. [Google Scholar] [CrossRef] [Scilit]
  68. Warren, R.; Price, J.; Graham, E.; Forstenhaeusler, N.; VanDerWal, J. The projected effect on insects, vertebrates, and plants of limiting global warming to 1.5°C rather than 2°C. Science 2018, 360, 791–795. [Google Scholar] [CrossRef] [Scilit] [PubMed]
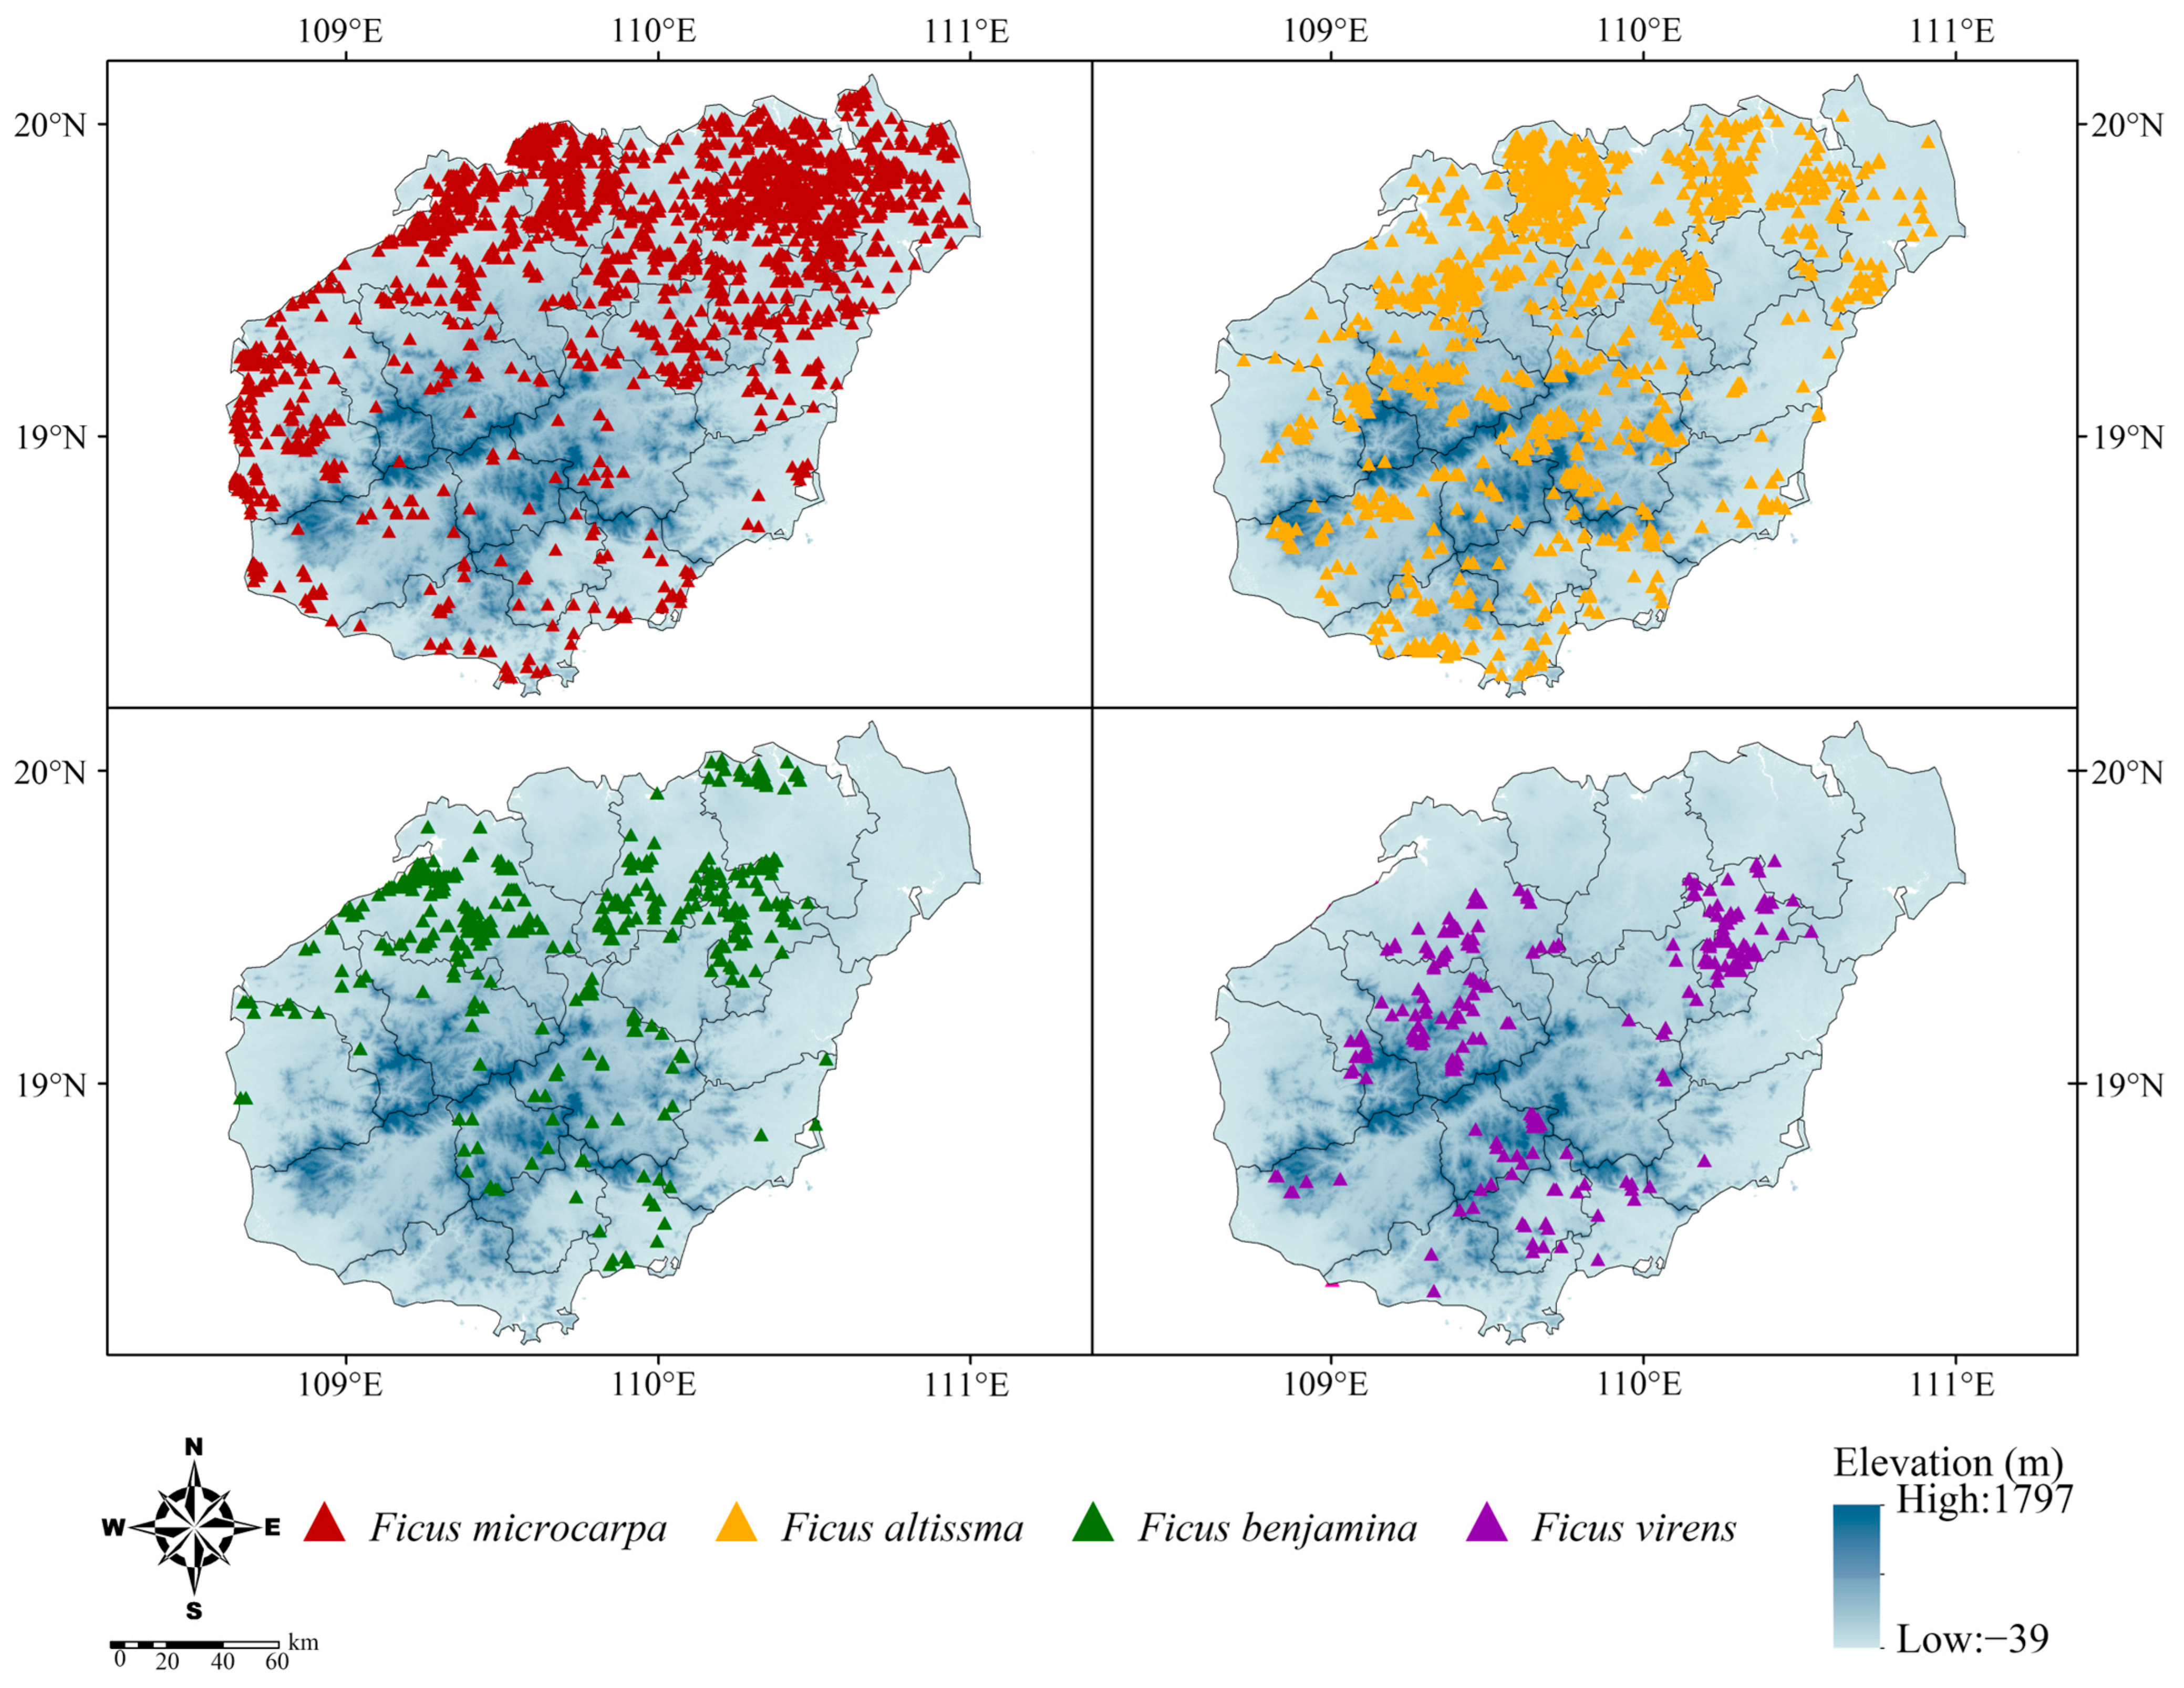
Figure 1. Spatial distribution of valid occurrence records for the ancient trees of four dominant Ficus species on Hainan Island.
Forests 17 01174 g001
Figure 2. Pearson correlation heatmap of the preliminarily screened environmental variables for the ancient trees of four dominant Ficus species: (a) Ficus microcarpa, (b) F. altissima, (c) F. benjamina, and (d) F. virens.
Forests 17 01174 g002
Figure 3. Contribution rates of environmental variables for the ancient trees of four dominant Ficus species: (a) Ficus microcarpa, (b) F. altissima, (c) F. benjamina, and (d) F. virens, based on the percentage contribution output from the MaxEnt models.
Forests 17 01174 g003
Figure 4. Jackknife test scores of environmental variables in the potential distribution models for the ancient trees of four dominant Ficus species: (a) Ficus microcarpa, (b) F. altissima, (c) F. benjamina, and (d) F. virens.
Forests 17 01174 g004
Figure 5. Response curves of the key environmental variable influencing the distribution for the ancient trees of four dominant Ficus species: (a) Ficus microcarpa, (b) F. altissima, (c) F. benjamina, and (d) F. virens.
Forests 17 01174 g005
Figure 6. Potentially suitable habitat distribution for the ancient trees of four dominant Ficus species on Hainan Island under current climatic conditions: (a) Ficus microcarpa, (b) F. altissima, (c) F. benjamina, and (d) F. virens.
Forests 17 01174 g006
Figure 7. Projected distribution of suitable habitats for the ancient trees of four dominant Ficus species under the SSP126 and SSP585 climate scenarios for the 2050s and 2070s: (a1–a4) Ficus microcarpa, (b1–b4) F. altissima, (c1–c4) F. benjamina, and (d1–d4) F. virens.
Forests 17 01174 g007
Figure 8. Changes in the spatial patterns of suitable habitats for the ancient trees of four dominant Ficus species under the SSP126 and SSP585 climate scenarios for the 2050s and 2070s: (a1–a4) Ficus microcarpa, (b1–b4) F. altissima, (c1–c4) F. benjamina, and (d1–d4) F. virens.
Forests 17 01174 g008
Table 1. Preselected environmental variables.
Variable CategoryNo.AbbreviationEnvironmental VariableUnit
Climatic Variables1bio1Mean Annual Temperature°C
2bio2Mean Diurnal Range°C
3bio3Isothermality-
4bio4Temperature Seasonality-
5bio5Maximum Temperature of Warmest Month°C
6bio6Minimum Temperature of Coldest Month°C
7bio7Temperature Annual Range °C
8bio8Mean Temperature of Wettest Quarter°C
9bio9Mean Temperature of Driest Quarter°C
10bio10Mean Temperature of Warmest Quarter°C
11bio11Mean Temperature of Coldest Quarter°C
12bio12Annual Precipitationmm
13bio13Precipitation of Wettest Monthmm
14bio14Precipitation of Driest Monthmm
15bio15Precipitation Seasonality-
16bio16Precipitation of Wettest Quartermm
17bio17Precipitation of Driest Quartermm
18bio18Precipitation of Warmest Quartermm
19bio19Precipitation of Coldest Quartermm
Soil Variables20t_usda_texTopsoil USDA Texture Class-
21t_textureTopsoil Texture-
22t_tebTopsoil Exchangeable Basescmol·kg−1
23t_siltTopsoil Silt Contentwt%
24t_sandTopsoil Sand Contentwt%
25t_ref_bulkTopsoil Bulk Densitykg·dm−3
26t_ph_h2oTopsoil pH-
27t_ocTopsoil Organic Carbon Contentwt%
28t_gravelTopsoil Gravel Contentvol%
29t_espTopsoil Exchangeable Sodium Percentage%
30t_eceTopsoil Electrical ConductivitydS·m−1
31t_clayTopsoil Clay Contentwt%
32t_cec_soilTopsoil Cation Exchange Capacitycmol·kg−1
33t_cec_clayTopsoil Clay Cation Exchange Capacitycmol·kg−1
34t_caso4Topsoil CaSO4 Contentwt%
Soil Variables35t_caco3Topsoil CaCO3 Contentwt%
36t_bsTopsoil Base Saturation%
37s_usda_texSubsoil USDA Texture Class-
38s_tebSubsoil Exchangeable Basescmol·kg−1
39s_siltSubsoil Silt Contentwt%
40s_sandSubsoil Sand Contentwt%
41s_ref_bulkSubsoil Reference Bulk Densitykg·dm−3
42s_ph_h2oSubsoil pH-
43s_ocSubsoil Organic Carbon Contentwt%
44s_gravelSubsoil Gravel Contentvol%
45s_espSubsoil Exchangeable Sodium Percentage%
46s_eceSubsoil Electrical ConductivitydS·m−1
47s_claySubsoil Clay Contentwt%
48s_cec_soilSubsoil Cation Exchange Capacitycmol·kg−1
49s_cec_claySubsoil Clay Cation Exchange Capacitycmol·kg−1
50s_caso4Subsoil CaSO4 Contentwt%
51s_caco3Subsoil CaCO3 Contentwt%
52s_bsSubsoil Base Saturation%
53awc_classSoil Available Water Capacity%
Anthropogenic Variables54pdPopulation Densitypersons·km−2
55luLand Use Classification-
56nlNighttime Light Intensity-
Topographic Variables57elevationElevationm
58slopeSlope°
Typhoon-related Variables59tiTyphoon Impact Intensity Index-
Table 2. Environmental variables retained after Pearson correlation screening for the four Ficus species under the Environmental Association Model (EAM) and Natural Environmental Predictor Model (NEPM).
Model TypeSpeciesEnvironmental Variables
EAMFicus microcarpabio7, bio8, bio10, bio15, bio18, s_cec_soil, t_silt, pd, nl
EAMFicus altissimabio6, bio7, bio12, bio17, s_usda_tex, t_gravel, pd, nl, elevation
EAMFicus benjaminabio2, bio3, bio7, bio8, bio13, bio18, bio19, s_gravel, t_esp, pd, ti
EAMFicus virensbio2, bio4, bio9, bio12, s_gravel, t_oc, t_texture, pd, nl, elevation, slope
NEPMFicus microcarpabio7, bio8, bio10, bio15, bio18, s_cec_soil, t_silt
NEPMFicus altissimabio6, bio7, bio12, bio17, s_usda_tex, t_gravel, elevation
NEPMFicus benjaminabio2, bio3, bio7, bio8, bio13, bio18, bio19, s_gravel, t_esp
NEPMFicus virensbio2, bio4, bio9, bio12, s_gravel, t_oc, t_texture, elevation, slope
Table 3. Optimal parameter combinations and performance metrics of the optimized MaxEnt models (EAM and NEPM) for ancient trees of four dominant Ficus species.
Model TypeSpeciesRMFCAUC (Training)AUC (Test)OR10AUCdiff
EAMFicus microcarpa0.5LQH0.8235 ± 0.00240.8185 ± 0.00860.0992 ± 0.00050.0050
EAMFicus altissima0.5LQHPT0.8292 ± 0.00550.7941 ± 0.01330.0989 ± 0.00080.0351
EAMFicus benjamina1LQHPT0.9187 ± 0.00460.8947 ± 0.01960.0974 ± 0.00170.0240
EAMFicus virens2.5LQHPT0.9013 ± 0.00870.8882 ± 0.01870.0962 ± 0.00400.0131
NEPMFicus microcarpa0.5LQHPT0.8059 ± 0.00610.7826 ± 0.00680.0988 ± 0.00070.0233
NEPMFicus altissima0.5LQHPT0.7683 ± 0.00640.7333 ± 0.02000.0992 ± 0.00050.0350
NEPMFicus benjamina1.5LQHPT0.8654 ± 0.00930.8243 ± 0.01560.0971 ± 0.00200.0411
NEPMFicus virens2.5LQHPT0.8653 ± 0.00940.8393 ± 0.01940.0981 ± 0.00200.0260
Table 4. Statistics of suitable habitat areas for the ancient trees of four dominant Ficus species under current climatic conditions; the modeling extent is approximately 33,900 km2; percentages of the modeling extent are reported in the text.
SpeciesUnsuitable Habitat (km2)Low-Suitability Habitat (km2)Moderately Suitable Habitat (km2)Highly Suitable Habitat (km2)Total Area of Suitable Habitat (km2)
Ficus microcarpa23,410.034729.545388.45371.9810,489.97
Ficus altissima25,150.712829.895256.24663.158749.29
Ficus benjamina26,128.693263.494029.78478.047771.31
Ficus virens24,667.835250.263384.07597.849232.17
Disclaimer/Publisher’s Note: The statements, opinions and data contained in all publications are solely those of the individual author(s) and contributor(s) and not of MDPI and/or the editor(s). MDPI and/or the editor(s) disclaim responsibility for any injury to people or property resulting from any ideas, methods, instructions or products referred to in the content.