Article

Dynamics and Driving Factors of Soil Carbon Fractions in Corethrodendron scoparium (Fisch. & C. A. Mey.) Fisch. & Basiner. Sand-Fixing Plantations at the South Edge of Tengger Desert, Northwestern China

1
College of Forestry, Gansu Agricultural University, Lanzhou 730070, China
2
Gansu Academy of Forestry, Lanzhou 730020, China
3
Gansu Desert Control Research Institute, Lanzhou 730070, China
*
Author to whom correspondence should be addressed.
Forests 2025, 16(9), 1499; https://doi.org/10.3390/f16091499
Submission received: 24 August 2025 / Revised: 17 September 2025 / Accepted: 21 September 2025 / Published: 22 September 2025
(This article belongs to the Special Issue The Role of Forests in Carbon Cycles, Sequestration, and Storage)

Abstract

Establishing artificial sand-fixing plantations is a key strategy for combating land desertification and enhancing soil carbon sequestration in arid regions. To evaluate the effects of Corethrodendron scoparium (Fisch. & C. A. Mey.) Fisch. & Basiner. plantations on soil carbon storage along the southern edge of the Tengger Desert, a systematic investigation of the 0–100 cm soil profile was conducted, using mobile sand dunes as the control (CK). The study analyzed dynamic changes in soil carbon fractions and their driving factors during the succession of C. scoparium plantations. After 40 years of vegetation restoration, total soil carbon, soil inorganic carbon (SIC), and soil organic carbon (SOC) contents increased by 0.87-, 0.77-, and 1.27-fold, respectively, while the Carbon Pool Management Index improved by 1.40-fold. Following 10 years of restoration, SIC content, as well as the ratios of particulate organic carbon/SOC, inert organic carbon (IOC)/SOC, and heavy-fraction organic carbon/SOC, increased with soil depth. In contrast, SOC content, the absolute amounts of SOC fractions, and the ratios of dissolved organic carbon/SOC, easily oxidizable organic carbon/SOC, light-fraction organic carbon/SOC, and mineral-associated organic carbon (MAOC)/SOC all showed decreasing trends with depth. Overall, C. scoparium plantations enhanced the contents of both labile and stable SOC fractions. The proportions of IOC and MAOC within SOC rose from 52.21% and 34.19% to 60.96% and 45.51%, respectively, indicating greater stability of the soil carbon pool. Structural equation modeling and redundancy analysis revealed that soil pH, bulk density, and soil water content were significantly negatively correlated with carbon fractions, whereas total nitrogen, vegetation cover, C/N ratio, electrical conductivity, available phosphorus, and alkali-hydrolyzable nitrogen were identified as the main drivers of carbon fraction variation.

1. Introduction

Arid desert regions are experiencing extensive land degradation driven by unsustainable land use practices and climate change [1,2]. This degradation destabilizes soil carbon pools and leads to significant losses of organic carbon, thereby reducing soil quality, disrupting ecosystem functioning, and undermining biodiversity, ultimately threatening regional sustainability [3,4,5]. Soil carbon pools consist of two primary forms: soil inorganic carbon (SIC) and soil organic carbon (SOC). In arid and semi-arid environments, SIC typically dominates due to its larger storage capacity compared with SOC [6,7]. Notably, arid zones cover approximately 45.36% of Earth’s terrestrial surface [8], underscoring their critical role in global carbon cycling. SOC originates from plant, animal, and microbial residues at various stages of decomposition and can be categorized according to several criteria: (1) by density, light-fraction organic carbon (LFOC) and heavy-fraction organic carbon (HFOC); (2) by particle size, particulate organic carbon (POC, >53 μm) and mineral-associated organic carbon (MAOC, <53 μm); and (3) by stability and decomposition rate, stable fractions such as inert organic carbon (IOC), HFOC, and MAOC, and labile fractions including dissolved organic carbon (DOC), easily oxidizable organic carbon (EOC), LFOC, and POC [9,10,11,12,13]. Differences also exist between ancient and modern desert soils. Paleosols generally contain higher levels of organic matter and trace elements than present-day desert soils [14]. Regarding soil texture, Liu et al. [15] reported that in the Tengger Desert, mean grain size was relatively coarse during the early Holocene, became finer during the mid-Holocene, and coarsened again in the late Holocene.
The spatiotemporal distribution of soil carbon fractions is governed by a complex interplay of factors, including soil type, vegetation succession, topographic position, canopy cover, land-use practices, and environmental stressors [13,16,17,18,19]. The carbon pool management index (CPMI), first introduced by Blair [18], has been widely applied to assess the impacts of land management. For instance, Lv et al. [20] reported that after converting farmland in arid river valleys to Zanthoxylum bungeanum plantations, the CPMI within the 0–100 cm soil depth increased with plantation age. Similarly, Li et al. [21] observed that understory removal increased the CPMI, although it did not enhance the carbon lability index. Despite these insights, systematic evaluations of CPMI along restoration chronosequences of artificial sand-fixing vegetation in arid regions remain limited. While numerous studies have examined soil carbon fractions, most have concentrated on forest [13,22] and agricultural ecosystems [17,23], typically restricted to surface soils and focused on either active or stable fractions in isolation. Even in arid sandy areas, investigations of afforestation effects on soil carbon pools have largely emphasized changes in SOC and SIC. These studies indicate that vegetation rehabilitation on mobile sand dunes has substantial potential to sequester both SOC and SIC in semiarid deserts. However, the spatiotemporal dynamics of multicomponent organic carbon, including both labile and stable fractions, as well as inorganic carbon, and their collective influence on CPMI evolution remain poorly understood in artificial Corethrodendron scoparium (Fisch. & C. A. Mey.) Fisch. & Basiner. sand-fixing plantations along the southern margin of the Tengger Desert, an ecologically critical barrier zone.
Since the 1990s, afforestation with xerophytic shrubs has been a central strategy for combating desertification in the sandy regions of northern China, producing significant ecological benefits [1,19]. Numerous studies have demonstrated that establishing sand-fixing vegetation effectively promotes vegetation recovery, reverses land degradation, and enhances SOC accumulation in arid ecosystems [1,13,19]. C. scoparium (commonly known as “flower stick”) is a representative pioneer species widely used for sand stabilization in desert regions. It is broadly distributed across sandy deserts such as the Ulan Buh, Tengger, Badain Jaran, and Gurbantunggut, valued for both its ecological restoration potential and economic uses (e.g., forage and fuelwood). Moreover, it has a lifespan exceeding 70 years, making it a particularly durable species for long-term ecological management.
In this study, artificial C. scoparium vegetation with different restoration ages in the Babusha area of Gulang County, located at the southern margin of the Tengger Desert, was selected as the research object. Using a space-for-time substitution approach, variations in soil carbon fractions, vegetation restoration characteristics, the CPMI, and soil physicochemical properties were analyzed. It is hypothesized that SIC, SOC, as well as labile and stable carbon fractions, increase with the restoration age of C. scoparium plantations; additionally, the proportion of stable carbon fractions rises continuously over time in the arid regions of northwestern China. The objectives were to: (1) elucidate the dynamic changes in carbon fractions during the succession of C. scoparium sand-fixing plantations; and (2) identify the key driving factors influencing soil carbon fractions following sand-fixing afforestation, while assessing the extent to which afforestation affects these fractions.

2. Materials and Methods

2.1. Study Area

The study was conducted in the Babusha region of Gulang County, Gansu Province, China (102°50′–103°54′ E, 37°20′–37°90′ N), situated at the southern margin of the Tengger Desert and the eastern end of the Hexi Corridor. The area falls within a temperate continental arid climate zone, with an average elevation of 1760 m. It is characterized by extreme aridity, strong solar radiation, and pronounced diurnal temperature fluctuations. The mean annual temperature is 6.6 °C, with average annual precipitation of 175 mm and potential evaporation approaching 3000 mm. The geomorphology of the region includes mobile dunes, semi-stabilized and stabilized dunes, dry riverbeds, and aeolian-eroded landscapes. Groundwater resources are severely constrained, with water tables often deeper than 60 m, resulting in pronounced imbalances in water supply and distribution.
The regional vegetation is dominated by xerophytic shrubs and herbaceous species. The principal shrub taxa include Asterothamnus centrali-asiaticus Novopokr., Nitraria tangutorum Bobrov., Artemisia ordosica Krasch., and Reaumuria songarica (Pall.) Maxim. The herbaceous flora is primarily composed of species such as Stipa breviflora Griseb., Convolvulus ammannii Desr., Oxytropis aciphylla Ledeb., Psammochloa villosa (Trin.) Bor., Cornulaca alaschanica C. P. Tsien & G. L. Chu., Cleistogenes serotina (L.) Keng., Grubovia dasyphylla (Fisch. & C. A. Mey.) Freitag & G. Kadereit., Echinops gmelinii Turcz., Artemisia scoparia Waldst. & Kit., Stipa caucasica subsp. Glareosa (P. A. Smirn.) Tzvelev., Astragalus melilotoides Pall., Corispermum squarrosum L., and Aster hispidus Thunb. In addition, the main species used for artificial sand fixation in the region are C. scoparium and Caragana korshinskii Kom.

2.2. Experimental Design

In July 2024, a chronosequence design was employed to evaluate the effects of restoration age on ecosystem characteristics in the Babusha region. Five representative site types were selected: mobile sand dunes (serving as the control, CK) and artificial C. scoparium sand-fixing plantations aged 5, 10, 30, and 40 years (Figure 1, Table 1). Site selection was based on restoration history, accessibility, and uniformity of terrain and soil substrate. All sites were located on flat terrain (slope < 5°), with minimal anthropogenic disturbance and comparable vegetation structure. To minimize climatic variability and environmental heterogeneity under the space-for-time substitution approach, all sites were situated within a 5 km radius. This spatial homogenization ensured that observed differences could be attributed primarily to restoration age rather than external environmental gradients. At each site, three replicate shrub plots (20 m × 20 m) were established using a stratified random layout, with a minimum separation of 50 m to ensure data independence and avoid spatial autocorrelation. Within each shrub plot, five 1 m × 1 m subplots were randomly positioned for herbaceous vegetation surveys. Vegetation parameters recorded included species composition, percent cover, individual density, average height, and crown width (for shrubs).

2.3. Sampling and Indicator Measurement Methods

2.3.1. Sampling Methods

Determination of vegetation biomass (VB): VB was measured using the harvest method. Within each shrub quadrat, healthy individuals with average crown width and height, free from damage, were selected as standard plants. For each shrub species, three representative individuals were sampled per plot. Both aboveground and belowground fractions (to a depth of 100 cm) were collected and weighed fresh in the field. The aboveground biomass (branches, stems, and leaves) and belowground biomass were further separated into main and lateral roots. Approximately 200 g of each component was subsampled and sealed in paper envelopes for laboratory analysis. For the herbaceous layer, all aboveground biomass within each 1 m × 1 m subplot was clipped at ground level, while belowground biomass was extracted from the 0–30 cm soil depth. These samples were also sealed and transported to the laboratory. All plant materials were oven-dried at 80 °C for 48 h to constant weight and subsequently weighed to determine dry biomass.
Soil sampling methods: Within each 20 m × 20 m shrub plot, five sampling points were established using the five-point (cross) sampling method. At each point, undisturbed soil cores were collected with a stainless-steel ring knife (100 cm3) at six depth intervals: 0–5 cm, 5–20 cm, 20–40 cm, 40–60 cm, 60–80 cm, and 80–100 cm. The 0–5 cm layer was selected due to its high sensitivity to vegetation inputs and disturbances [24,25]. The 5–20 cm and 20–40 cm layers, which contain abundant shrub [24] and herbaceous roots [26,27], were targeted because root turnover strongly influences SOC fractions. The deeper layers (40–100 cm) were included to assess SIC accumulation and long-term SOC stabilization, which are particularly relevant in arid sandy soils [28,29]. This stratification follows approaches widely adopted in previous arid and semi-arid studies [29,30]. The fresh weight of each core was measured in the field, after which samples were oven-dried in the laboratory to determine soil bulk density (BD) and gravimetric moisture content. In parallel, fresh soil samples were collected from each depth layer. Coarse roots and gravel (>2 mm diameter) were manually removed, and the remaining soil was homogenized using the quartering method to generate one composite sample per depth per plot (n = 6). All samples were transported to the laboratory under refrigerated conditions, air-dried at room temperature, and sieved through mesh sizes appropriate for subsequent analyses. These processed samples were then used to determine soil carbon content and a range of physicochemical properties.

2.3.2. Index Determination and Methods

Methods for the determination of soil carbon fractions: DOC was extracted with 0.5 mol L−1 K2SO4 at a soil-to-solution ratio of 1:4 [31]. EOC was measured using the potassium permanganate oxidation-colorimetric method [22]. LFOC and HFOC were separated by sodium iodide density fractionation [23]. SOC was quantified using a Multi N/C 3100 TOC analyzer (Analytik Jena, Jena, Germany). POC and MAOC were separated with the dispersion-sieving method, using sodium hexametaphosphate as the dispersing agent [32]. IOC was determined by the sulfuric acid hydrolysis method [33]. SIC was calculated as the difference between total carbon (TC) and SOC.
Methods for determining soil physical and chemical properties: TC and total nitrogen (TN) contents were measured using an elemental analyzer (Vario MACRO, Elementar, Langenselbold, Germany). Soil pH was determined with a Sartorius PB-10 pH meter at a soil-to-water ratio of 1:2.5. Total potassium (TK) was analyzed by NaOH fusion, available potassium (AK) was extracted with 1 mol L−1 NH4OAc, and slowly available potassium (SK) was extracted with 1 mol L−1 hot HNO3; all potassium fractions were quantified by flame photometry following acid digestion. Alkaline hydrolyzable nitrogen (AN) was determined using the alkaline hydrolysis diffusion method with a German Planed Titrette titrator (Planed Titrette Titrator, Brand, Wertheim, Germany). Ammonium nitrogen (NH4+-N) and nitrate nitrogen (NO3-N) were extracted with 1 mol L−1 KCl and analyzed using a continuous flow system (AutoAnalyzer 3, SEAL Analytical, Norderstedt, Germany). Total phosphorus (TP) was determined by the H2SO4-HClO4 digestion method, while available phosphorus (AP) was extracted with 0.5 mol L−1 NaHCO3; both were quantified using the molybdenum-antimony colorimetric method. Soil electrical conductivity (EC) was measured with a DDSJ-308F conductivity meter (Shanghai Yidi Scientific Instrument Co., Ltd., Shanghai, China).

2.3.3. CPMI Assessment

The calculation of CPMI-related indicators followed the methods described by Li et al. [22] and Jiang et al. [34], and is summarized as follows. Mobile sand dunes without artificial sand-fixing vegetation were used as the reference condition.
Steady-state carbon:
SC = SOC − EOC
Carbon activity:
A = EOC/SC
Activity index:
AI = A/A0 (where A0 is the activity value in the reference site)
Carbon pool index:
CPI = SOC/SOC0 (where SOC0 is the SOC content in the reference site)
CPMI:
CPMI = AI × CPI × 100%
where SOC is the total soil organic carbon, and EOC is the easily oxidizable organic carbon.

2.3.4. Data Calculation and Analysis

Species diversity was assessed using a suite of ecological indices that capture different aspects of community structure, including species richness, abundance, and evenness. The indices and their mathematical formulations are as follows:
Species richness:
R = S
Shannon–Wiener diversity index (H) [35]:
H =   p i × ln p i
Simpson diversity index (D) [36]:
D = 1 p i 2
Pielou’s evenness index (J) [37]:
J = ( P i × ln P i ) / ln S
Community ecological dominance index (DI) [37]:
DI = p i 2
In these formulas, S denotes the number of species in the sample plot; N represents the total number of individuals in the plot; Ni is the number of individuals belonging to species i; and Pi is the proportion of individuals of species i relative to the total, calculated as Pi = Ni/N.
All data presented in figures and tables are expressed as means ± standard error (SE). One-way analysis of variance was used to test for differences in soil physicochemical properties and carbon fractions across restoration years and soil depth layers. Post hoc comparisons were conducted using the least significant difference test at a significance level of p = 0.05. Pearson correlation analysis was applied to assess relationships among soil and vegetation indicators. To further investigate the interactions between vegetation restoration characteristics, soil physicochemical properties, and soil carbon fractions, a partial least squares structural equation model (PLS-SEM) was constructed. Redundancy analysis (RDA) was also employed to evaluate the influence of vegetation and soil variables on soil carbon fractions. All statistical analyses were carried out using SPSS 27.0 (IBM Corp., New York, NY, USA), Origin 2021 (OriginLab Corp., Northampton, MA, USA), Canoco 5.0 (Microcomputer Power, Ithaca, NY, USA), and the “plspm” package in R version 4.4.2.

3. Results

3.1. Vegetation Restoration Characteristics and Soil Physicochemical Properties in Artificial C. Scoparium Sand-Fixing Plantations

As shown in Table 2, soils in the study area were weakly alkaline across all sites. Compared with the CK, longer restoration durations of C. scoparium significantly increased TN, NH4+-N, NO3-N, SK, herbaceous cover, vegetation cover (VC), and herbaceous biomass (p < 0.05). In contrast, soil pH and BD decreased significantly with restoration age (p < 0.05). TP, EC, the C/N ratio, shrub cover, species diversity indices (H, D, J), shrub biomass, and VB showed an initial increase followed by a decline. Conversely, TK, AN, and DI declined during the early stages of restoration but gradually increased in later stages.

3.2. Spatiotemporal Dynamics of Soil Organic and Inorganic Carbon

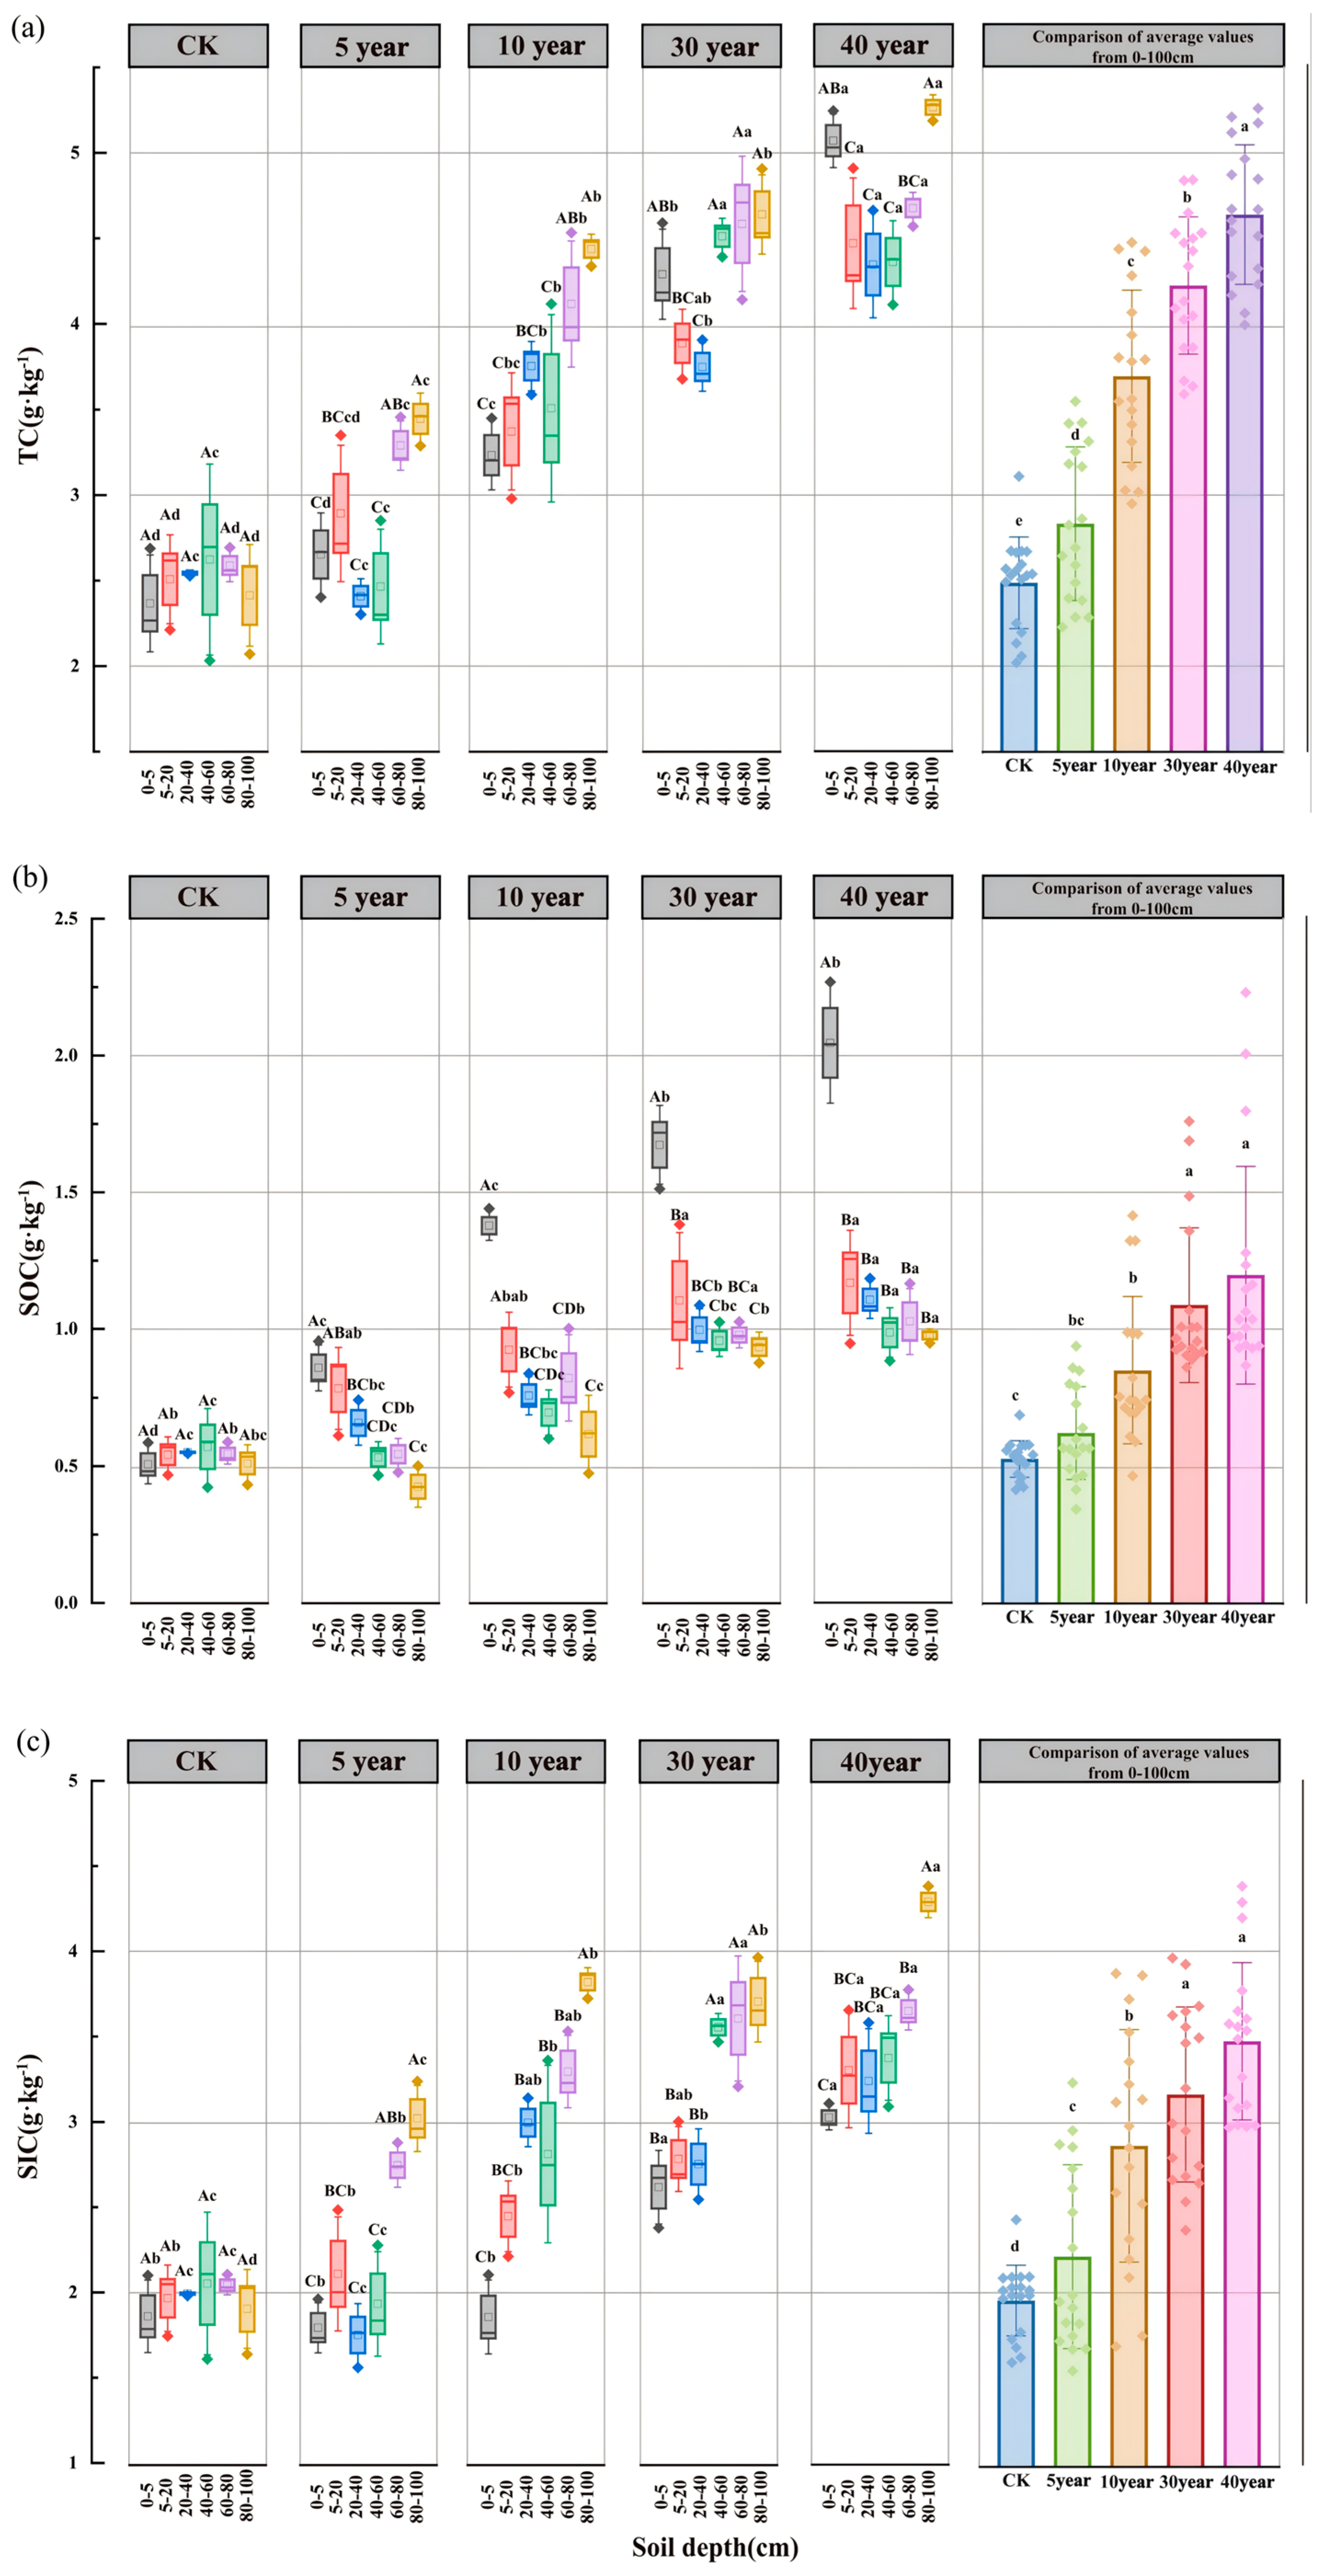
As shown in Figure 2, chronosequence analysis revealed that within the 0–100 cm soil profile, mean TC contents in the 5-, 10-, 30-, and 40-year plantations were 1.14, 1.49, 1.71, and 1.87 times higher than those in the CK, respectively (Figure 2a). Similarly, mean SOC contents were 1.18, 1.61, 2.06, and 2.27 times higher (Figure 2b), while mean SIC contents were 1.13, 1.43, 1.61, and 1.77 times greater than those in the mobile dune (Figure 2c). Overall, TC, SOC, and SIC consistently increased with restoration age.
Soil carbon fractions exhibited clear vertical stratification. In the control site (CK), TC, SIC, and SOC contents did not vary significantly with depth. In contrast, SIC content in C. scoparium sand-fixing plantations increased significantly with depth across all restoration years (p < 0.05), whereas SOC content decreased significantly (p < 0.05), with relatively higher concentrations at the 60–80 cm layer (Figure 2b,c). In 5- and 10-year plantations, TC content showed no consistent depth-dependent trend, while in 30- and 40-year stands, TC peaked in the 80–100 cm layer, displaying a V-shaped distribution with increasing depth (Figure 2a).

3.3. Spatiotemporal Dynamics of SOC Fractions and Their Proportional Distribution

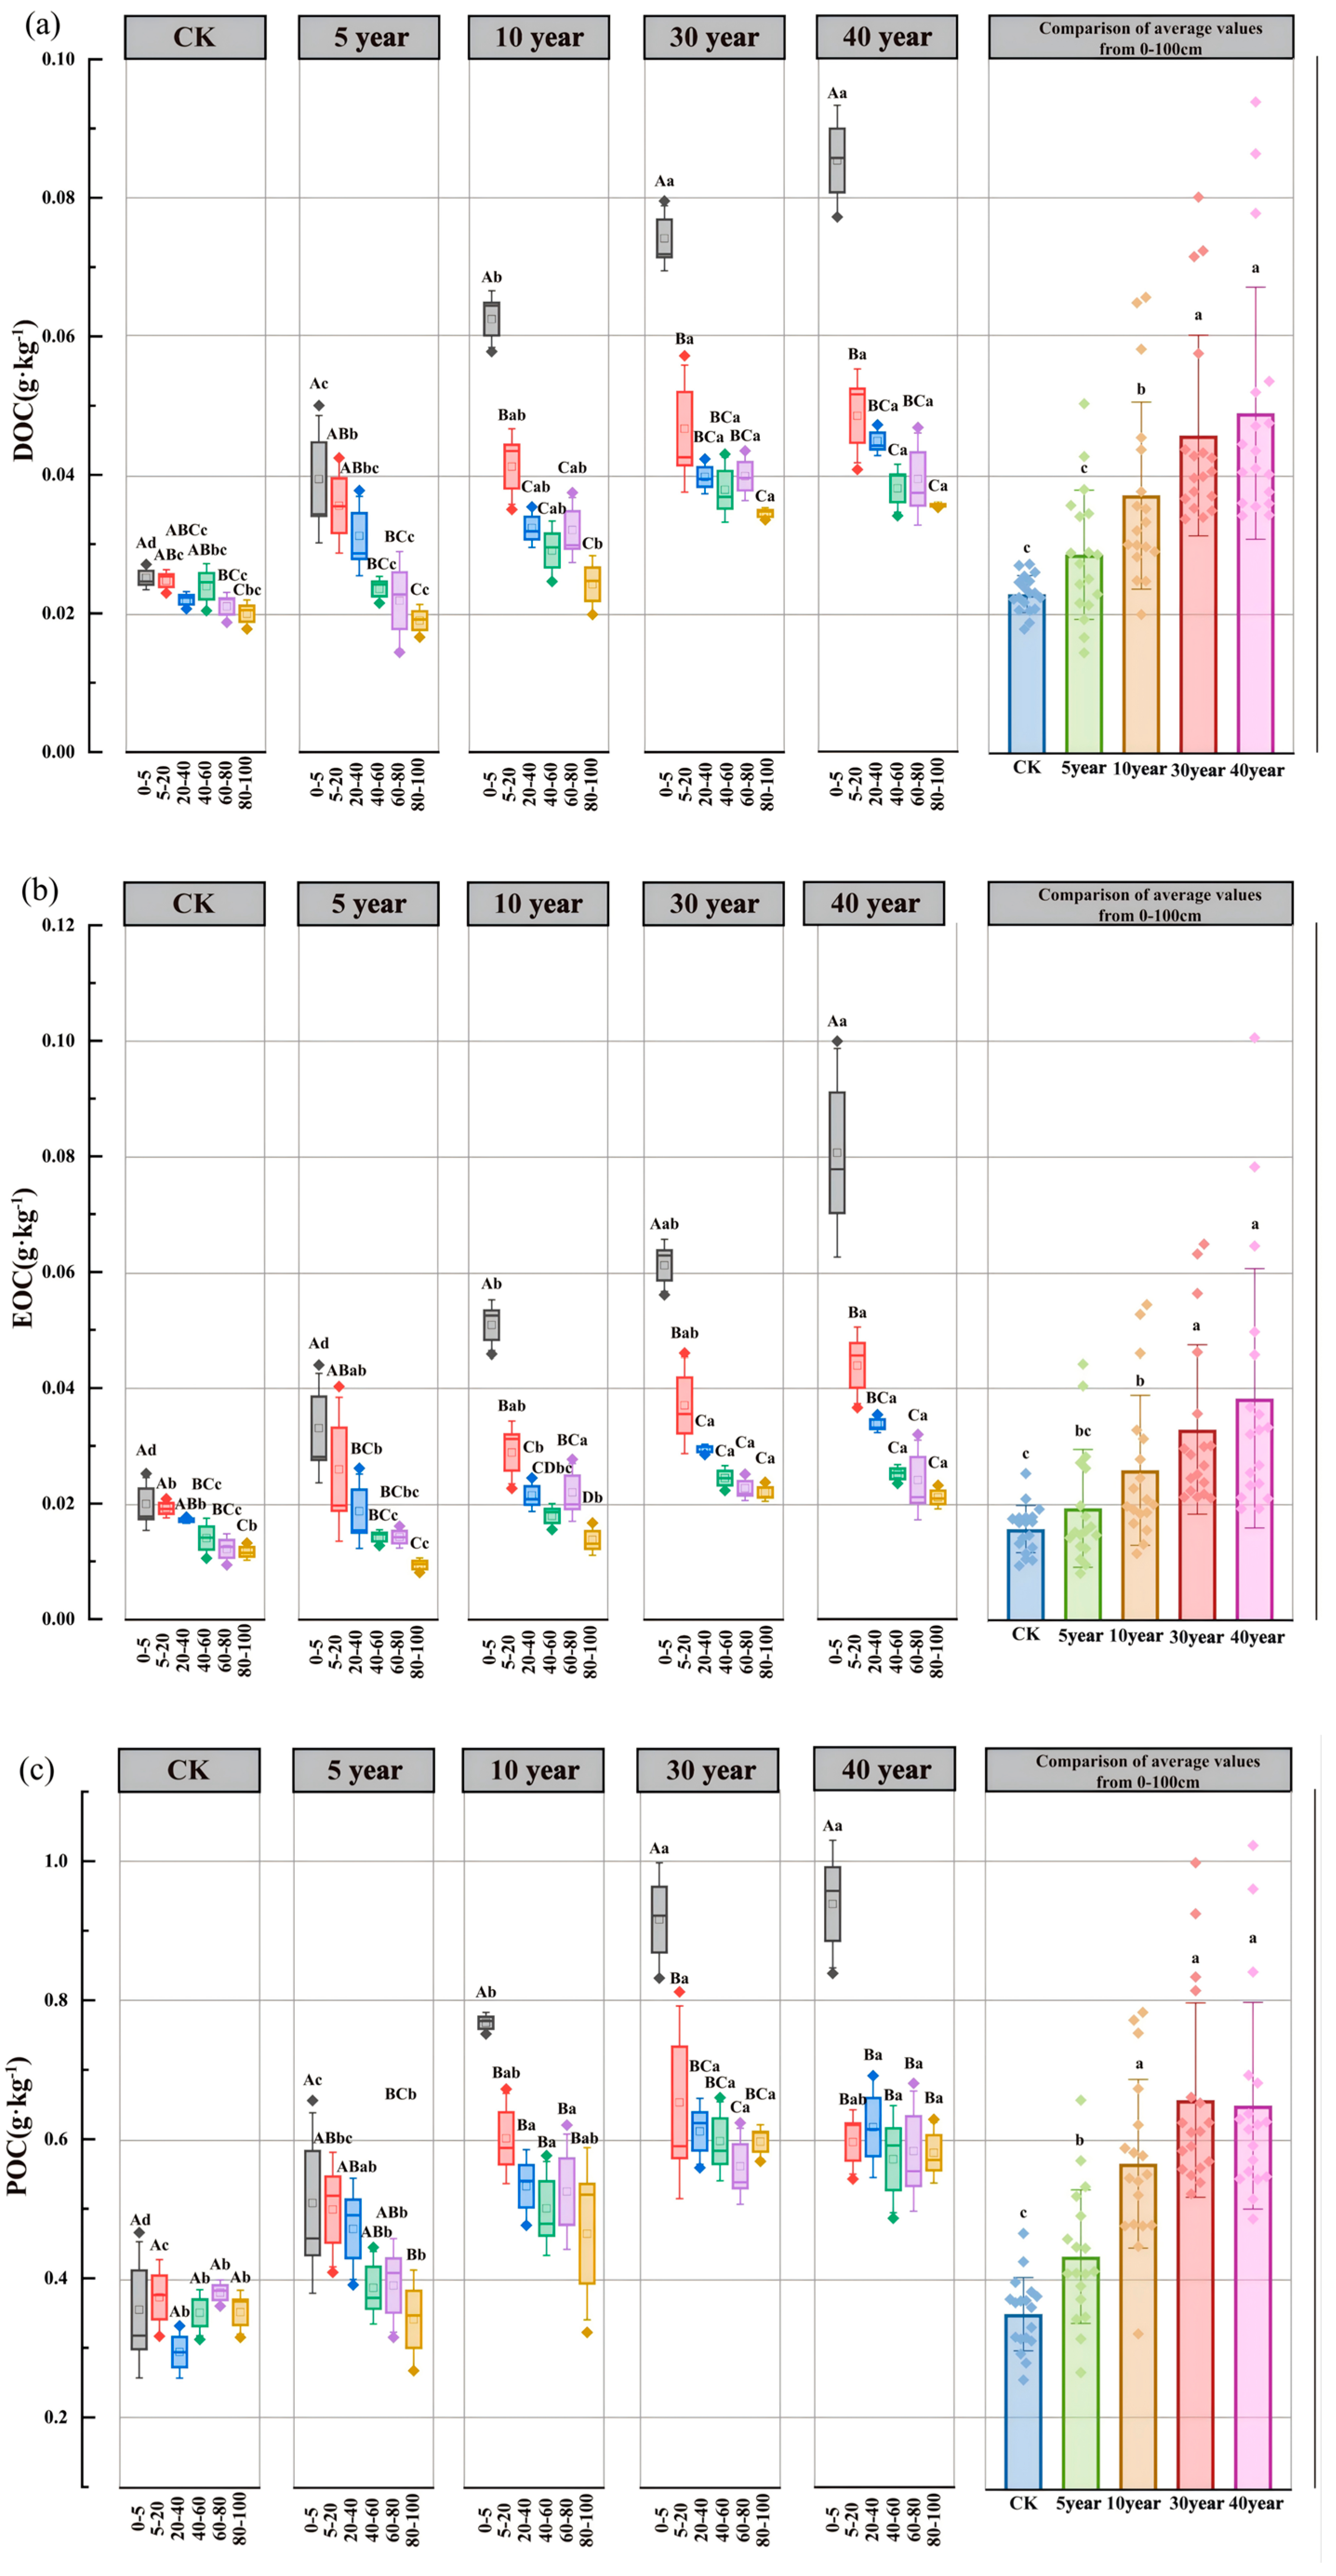
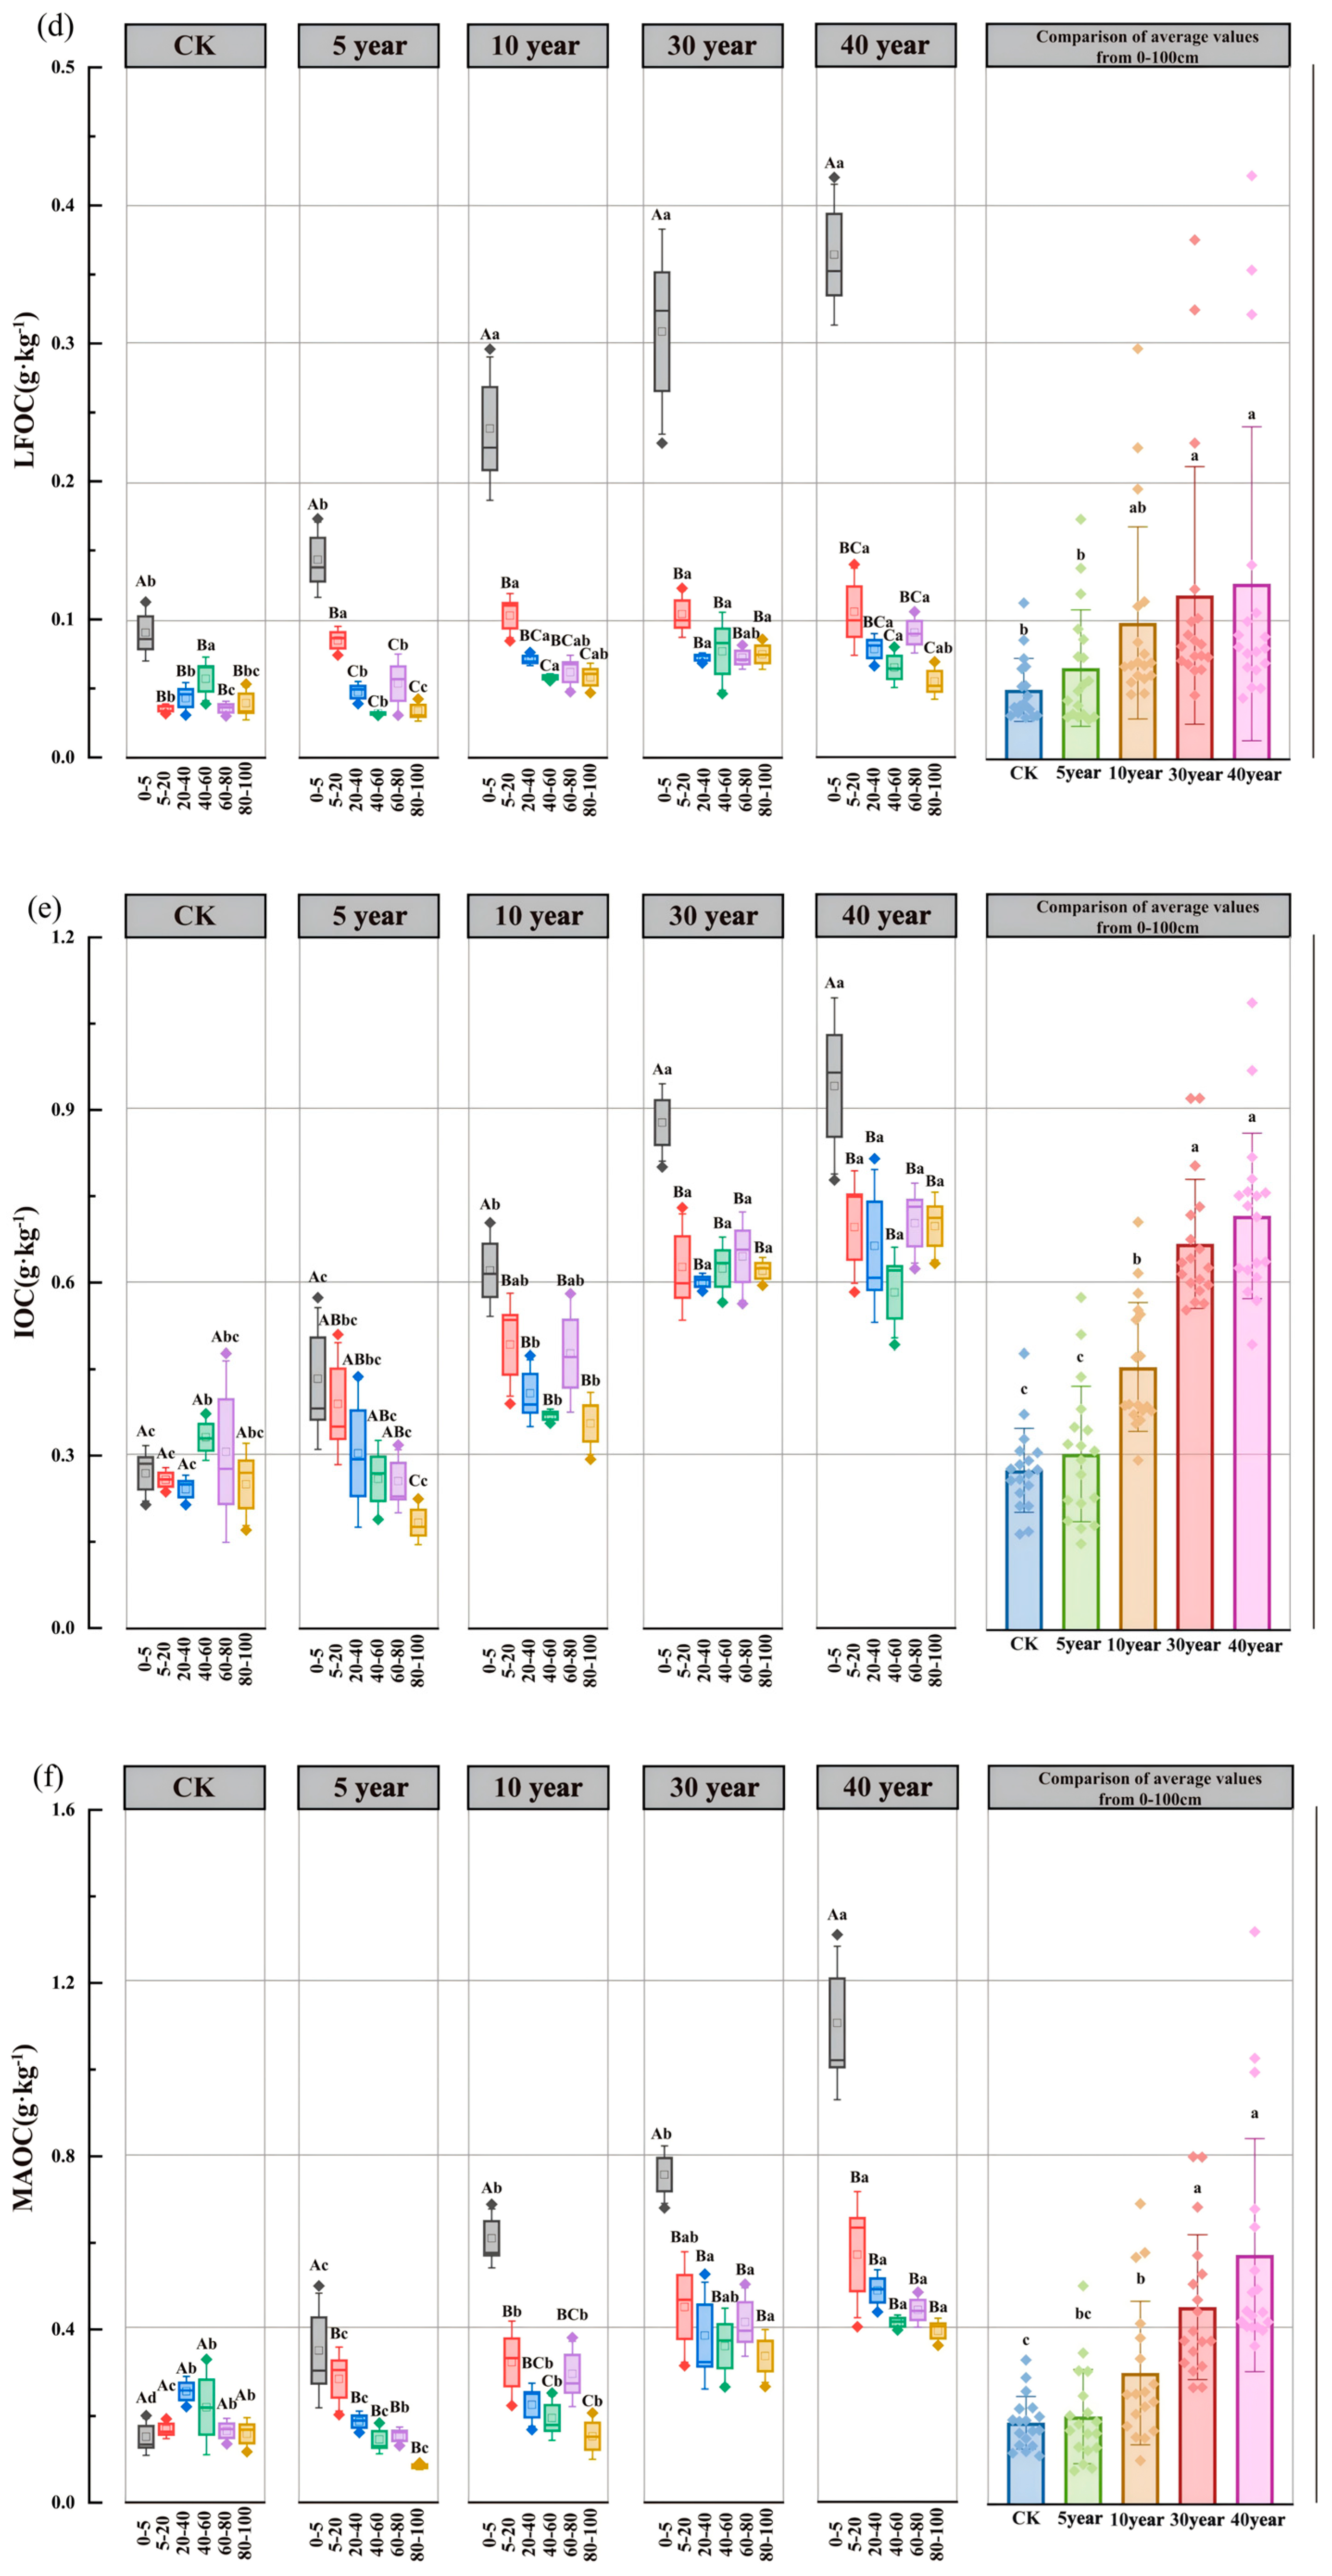
The contents of soil labile organic carbon fractions exhibited pronounced spatiotemporal variability (Figure 3). Chronosequence analysis showed that all labile organic carbon fractions increased significantly with the restoration age of C. scoparium plantations. Specifically, DOC content increased from 0.020–0.025 g·kg−1 in mobile sand dunes (CK) to 0.036–0.085 g·kg−1 after 40 years of restoration (Figure 3a). EOC content rose from 0.012–0.020 g·kg−1 to 0.021–0.081 g·kg−1 (Figure 3b). POC content increased from 0.35–0.38 g·kg−1 to 0.58–0.94 g·kg−1 (Figure 3c), while LFOC content rose from 0.035–0.090 g·kg−1 to 0.055–0.36 g·kg−1 (Figure 3d). The greatest increases occurred in the surface layer (0–5 cm), with all changes being statistically significant (p < 0.05). Among the fractions, the overall content followed the order: POC > EOC > LFOC > DOC. Spatially, in CK plots, DOC, EOC, and LFOC contents generally declined with increasing soil depth, while POC exhibited no clear vertical trend. In contrast, in C. scoparium plantations (5–40 years), all labile carbon fractions (DOC, EOC, POC, LFOC) showed strong surface accumulation, with peak values in the 0–5 cm layer followed by significant declines with depth (p < 0.05).
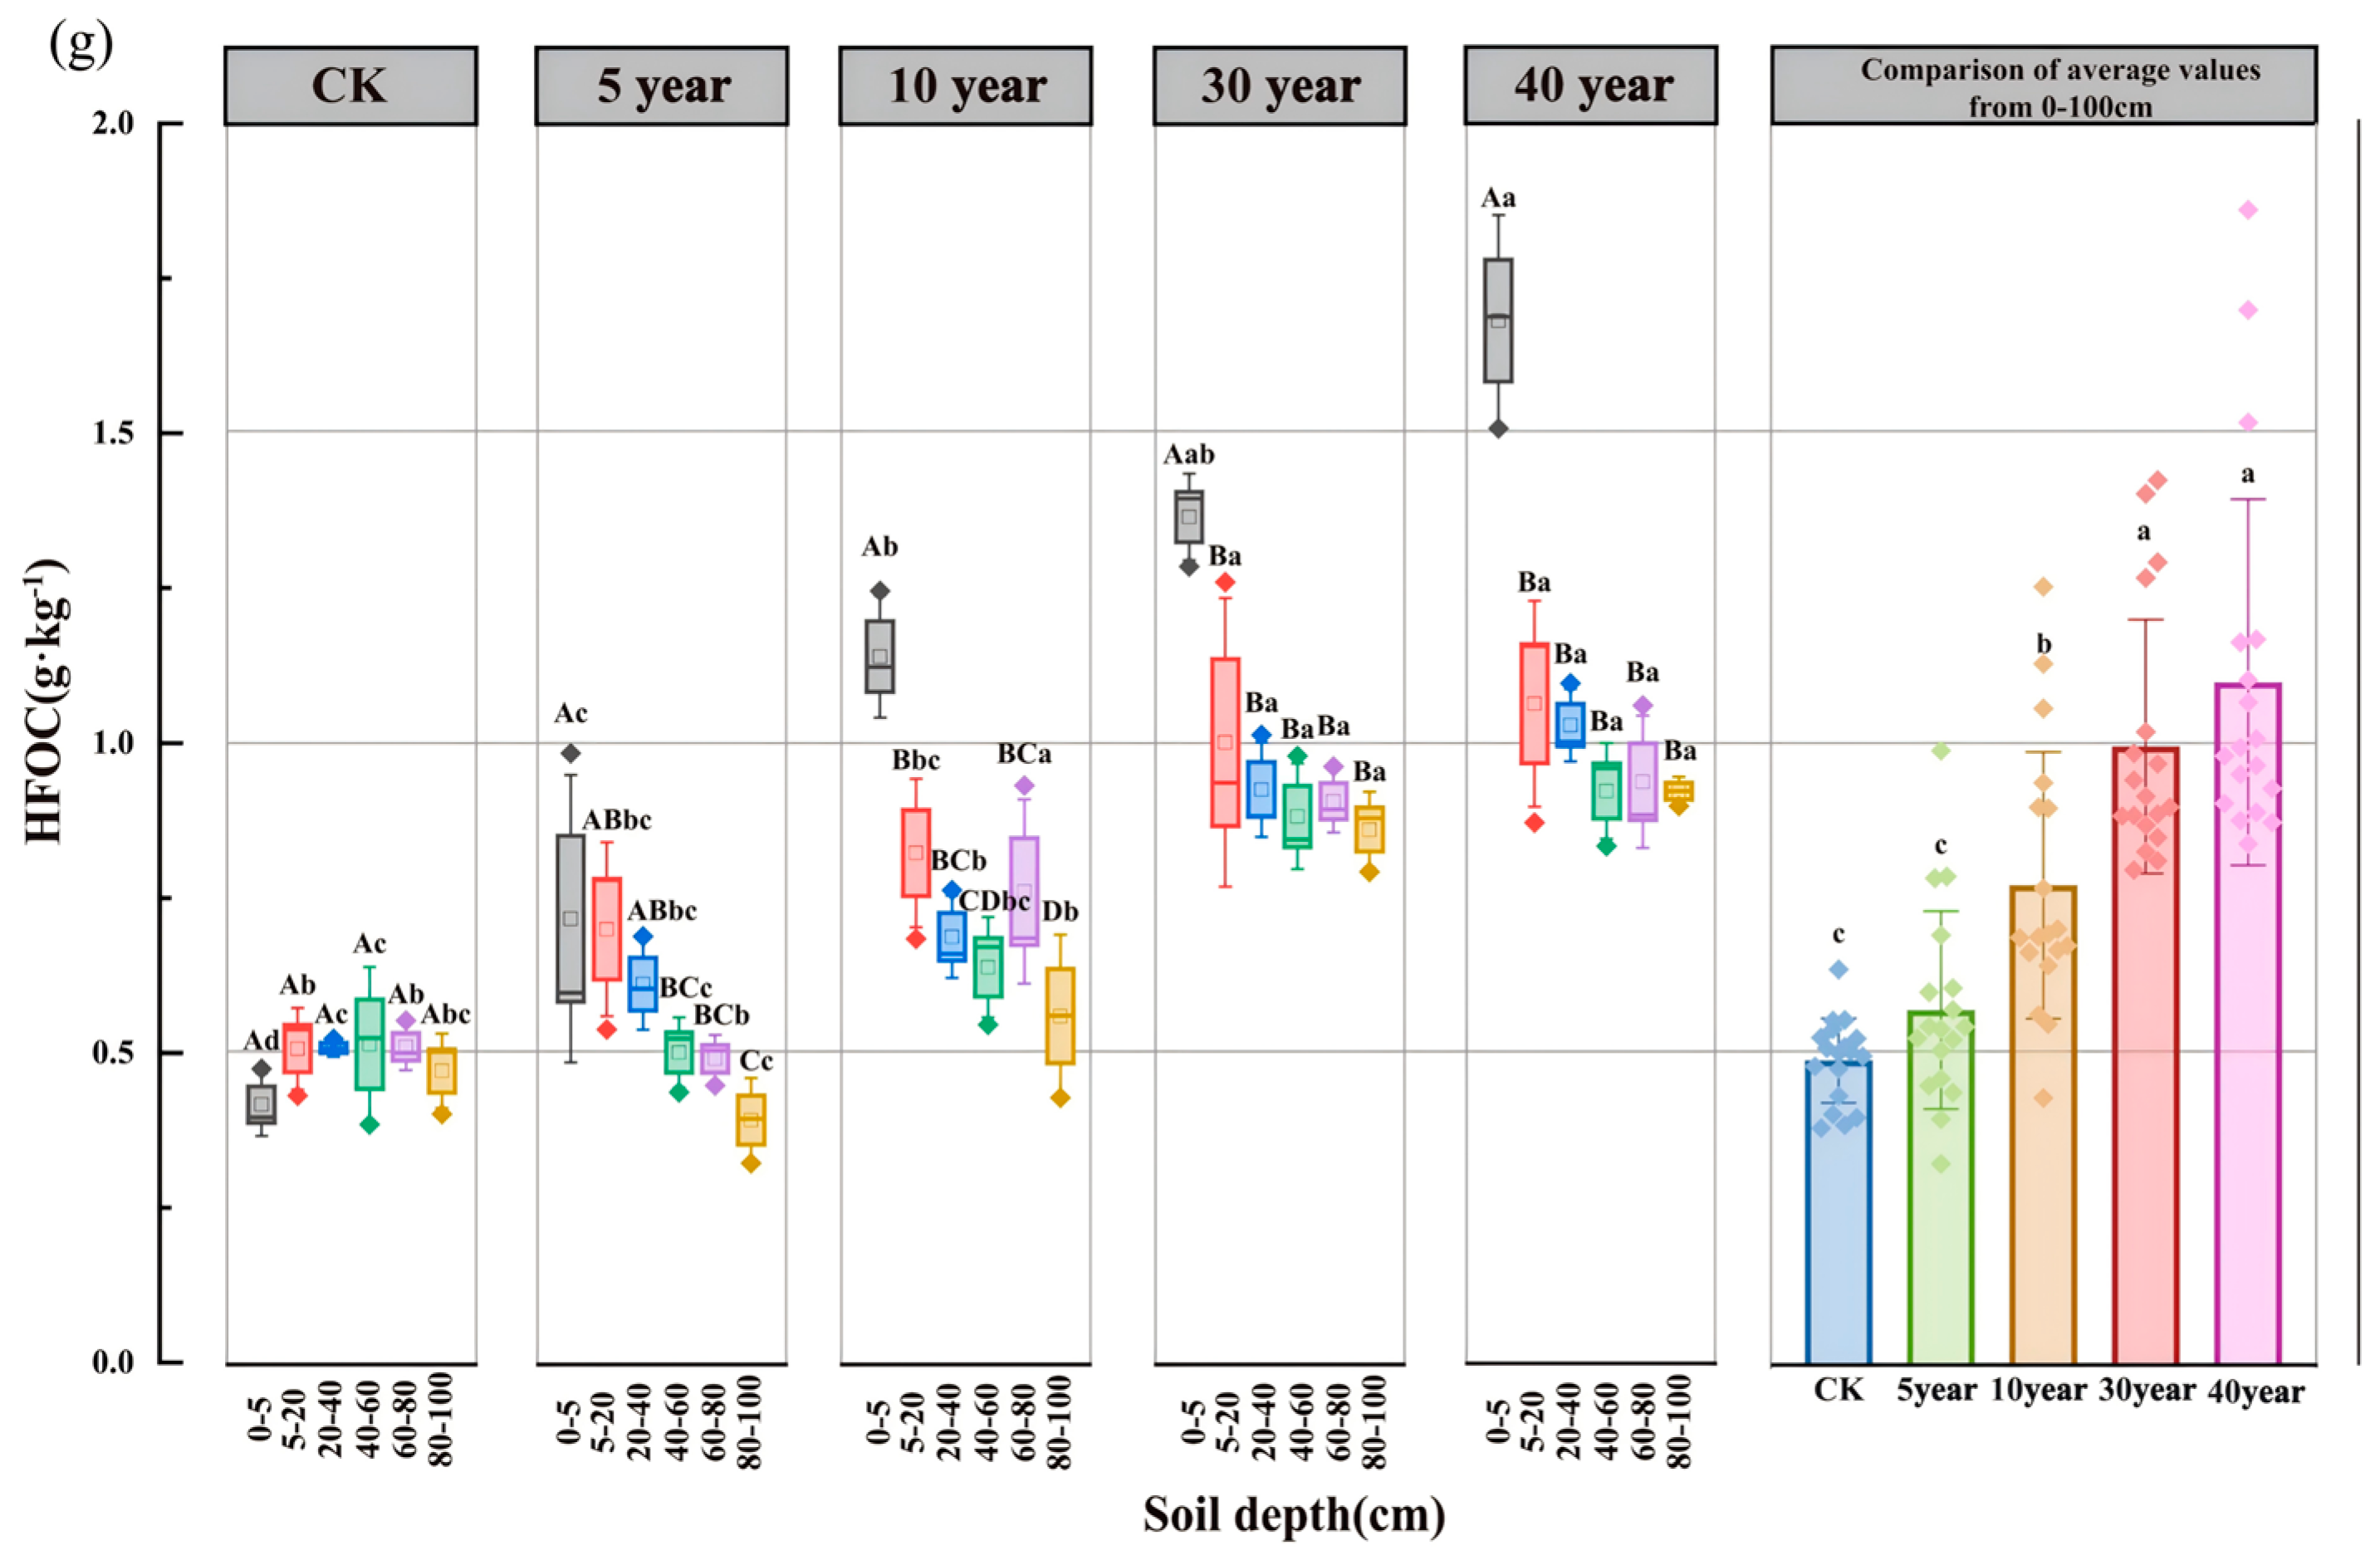
During the vegetation restoration process, the content of the stable carbon fraction IOC increased from 0.25–0.33 g·kg−1 in the CK to 0.58–0.94 g·kg−1 after 40 years of restoration in the C. scoparium sand-fixing plantations (Figure 3e). Similarly, MAOC increased from 0.15–0.26 g·kg−1 to 0.40–1.11 g·kg−1 (Figure 3f), while HFOC rose from 0.42–0.51 g·kg−1 to 0.92–1.68 g·kg−1 (Figure 3g). Overall, their contents followed the order: HFOC > IOC > MAOC. The spatial distribution of stable carbon fractions also varied significantly (Figure 3). In the mobile sand dunes, these fractions showed no consistent depth-dependent pattern. In contrast, in the C. scoparium sand-fixing plantations, their contents generally decreased with increasing soil depth, with relatively higher levels of MAOC and IOC observed at the 60–80 cm layer.
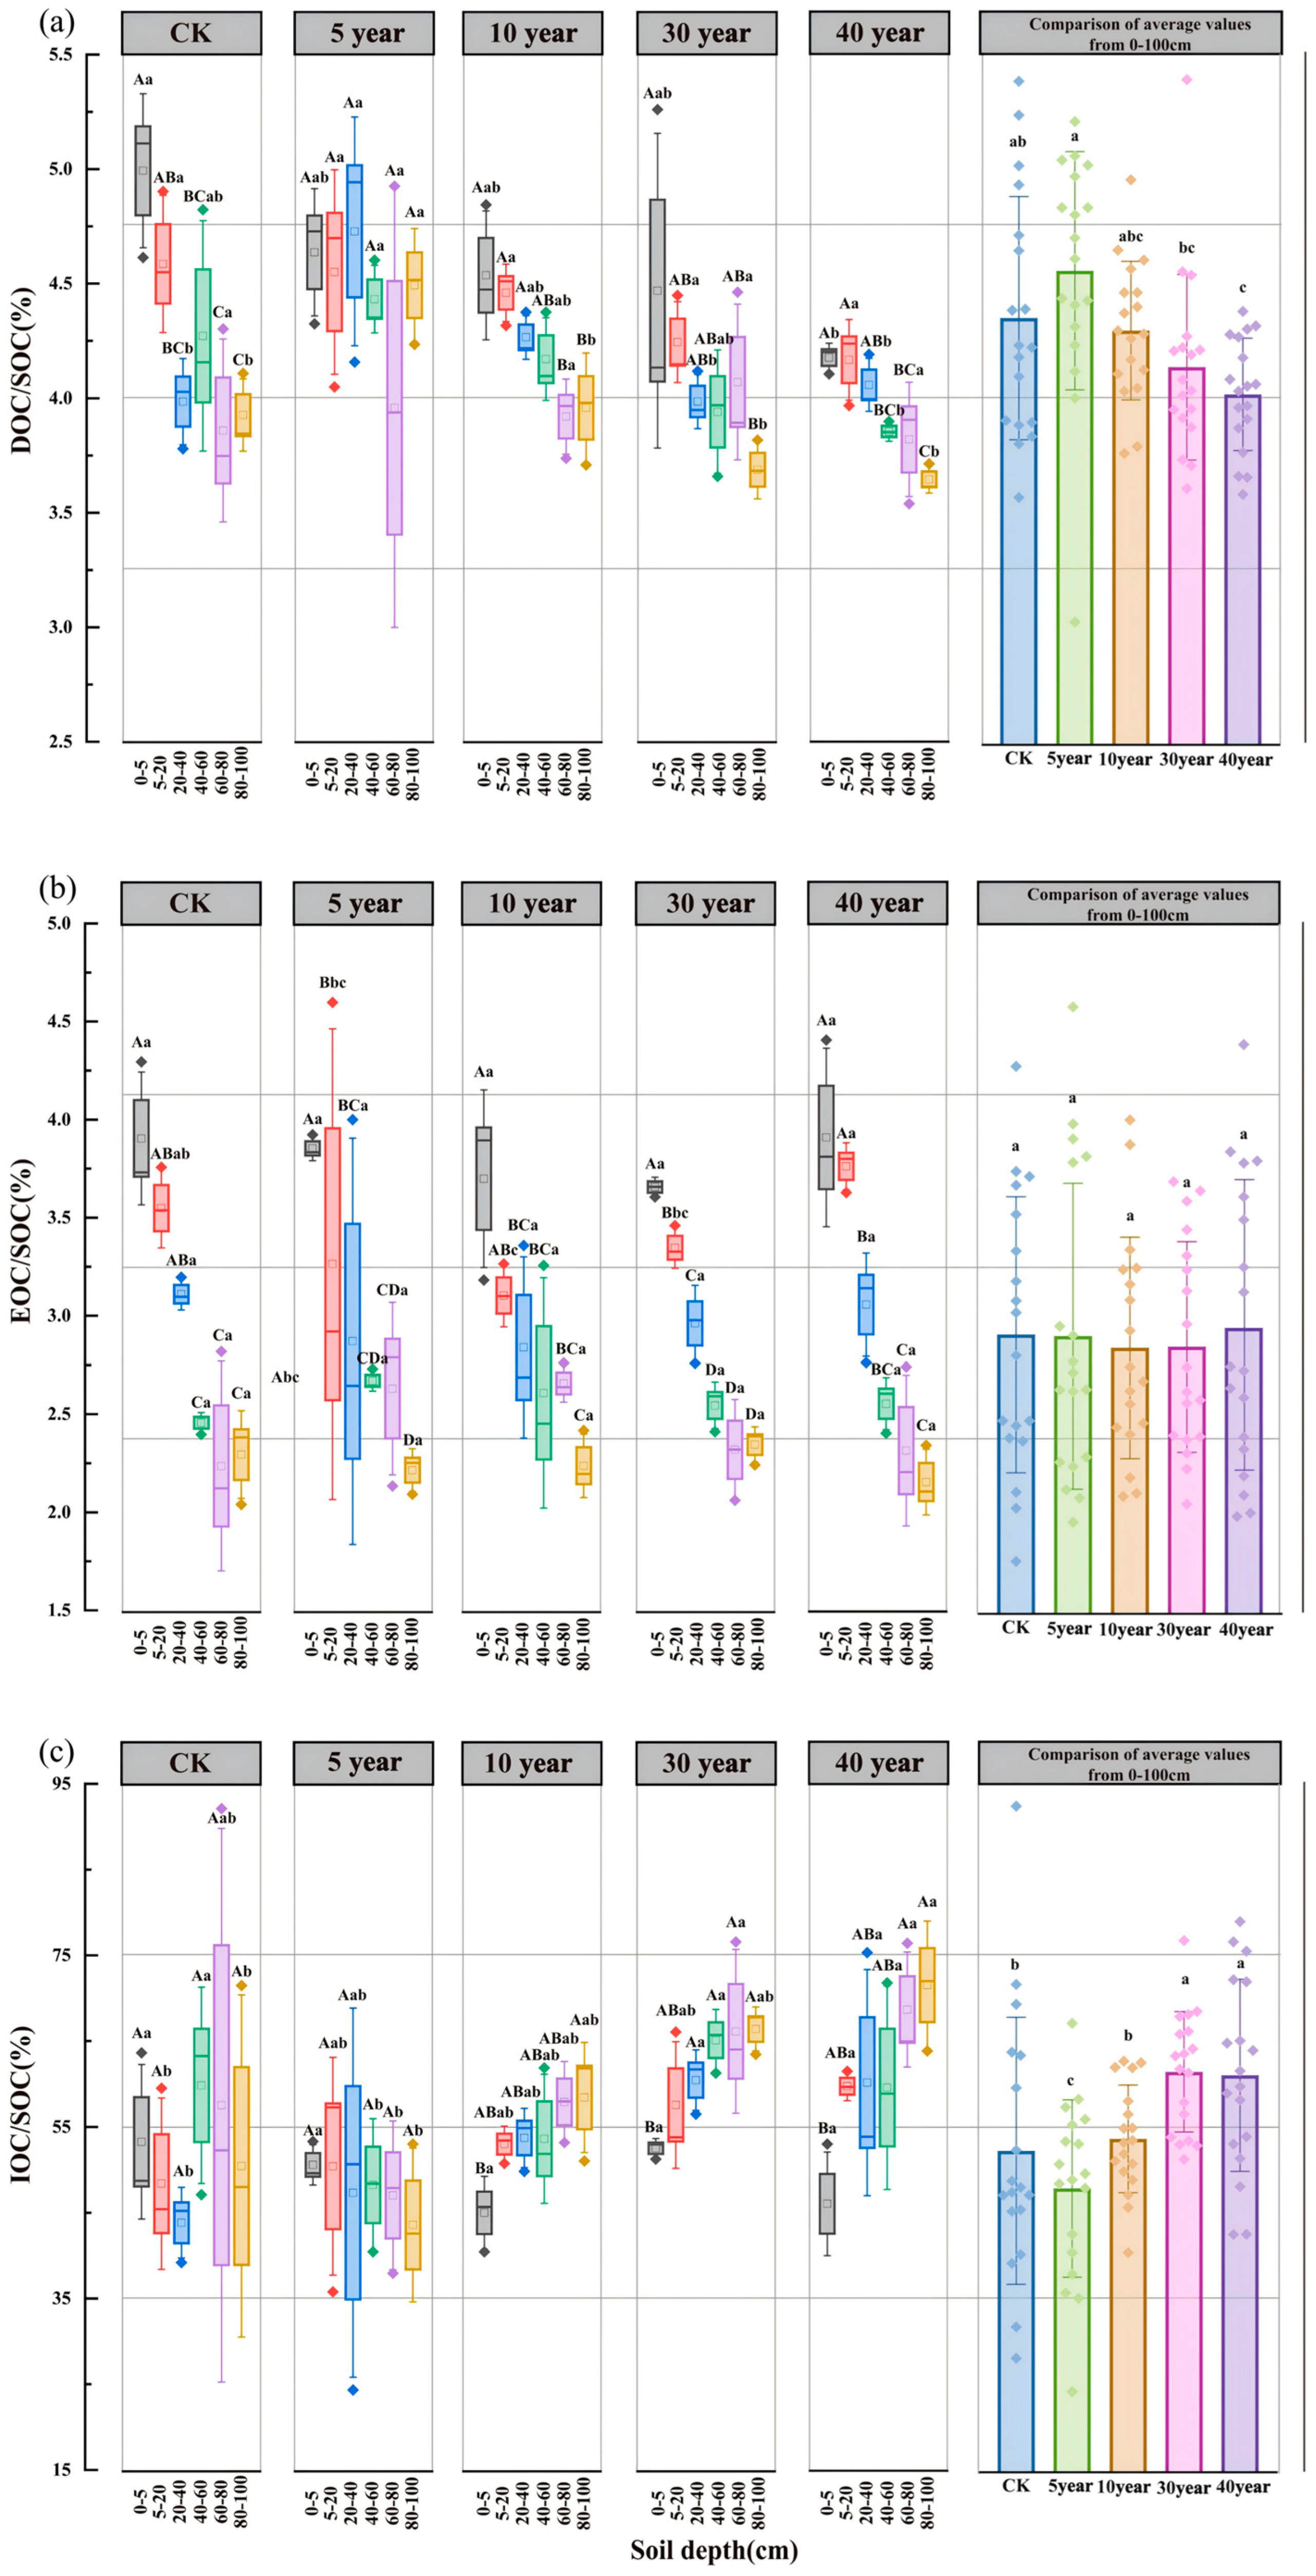
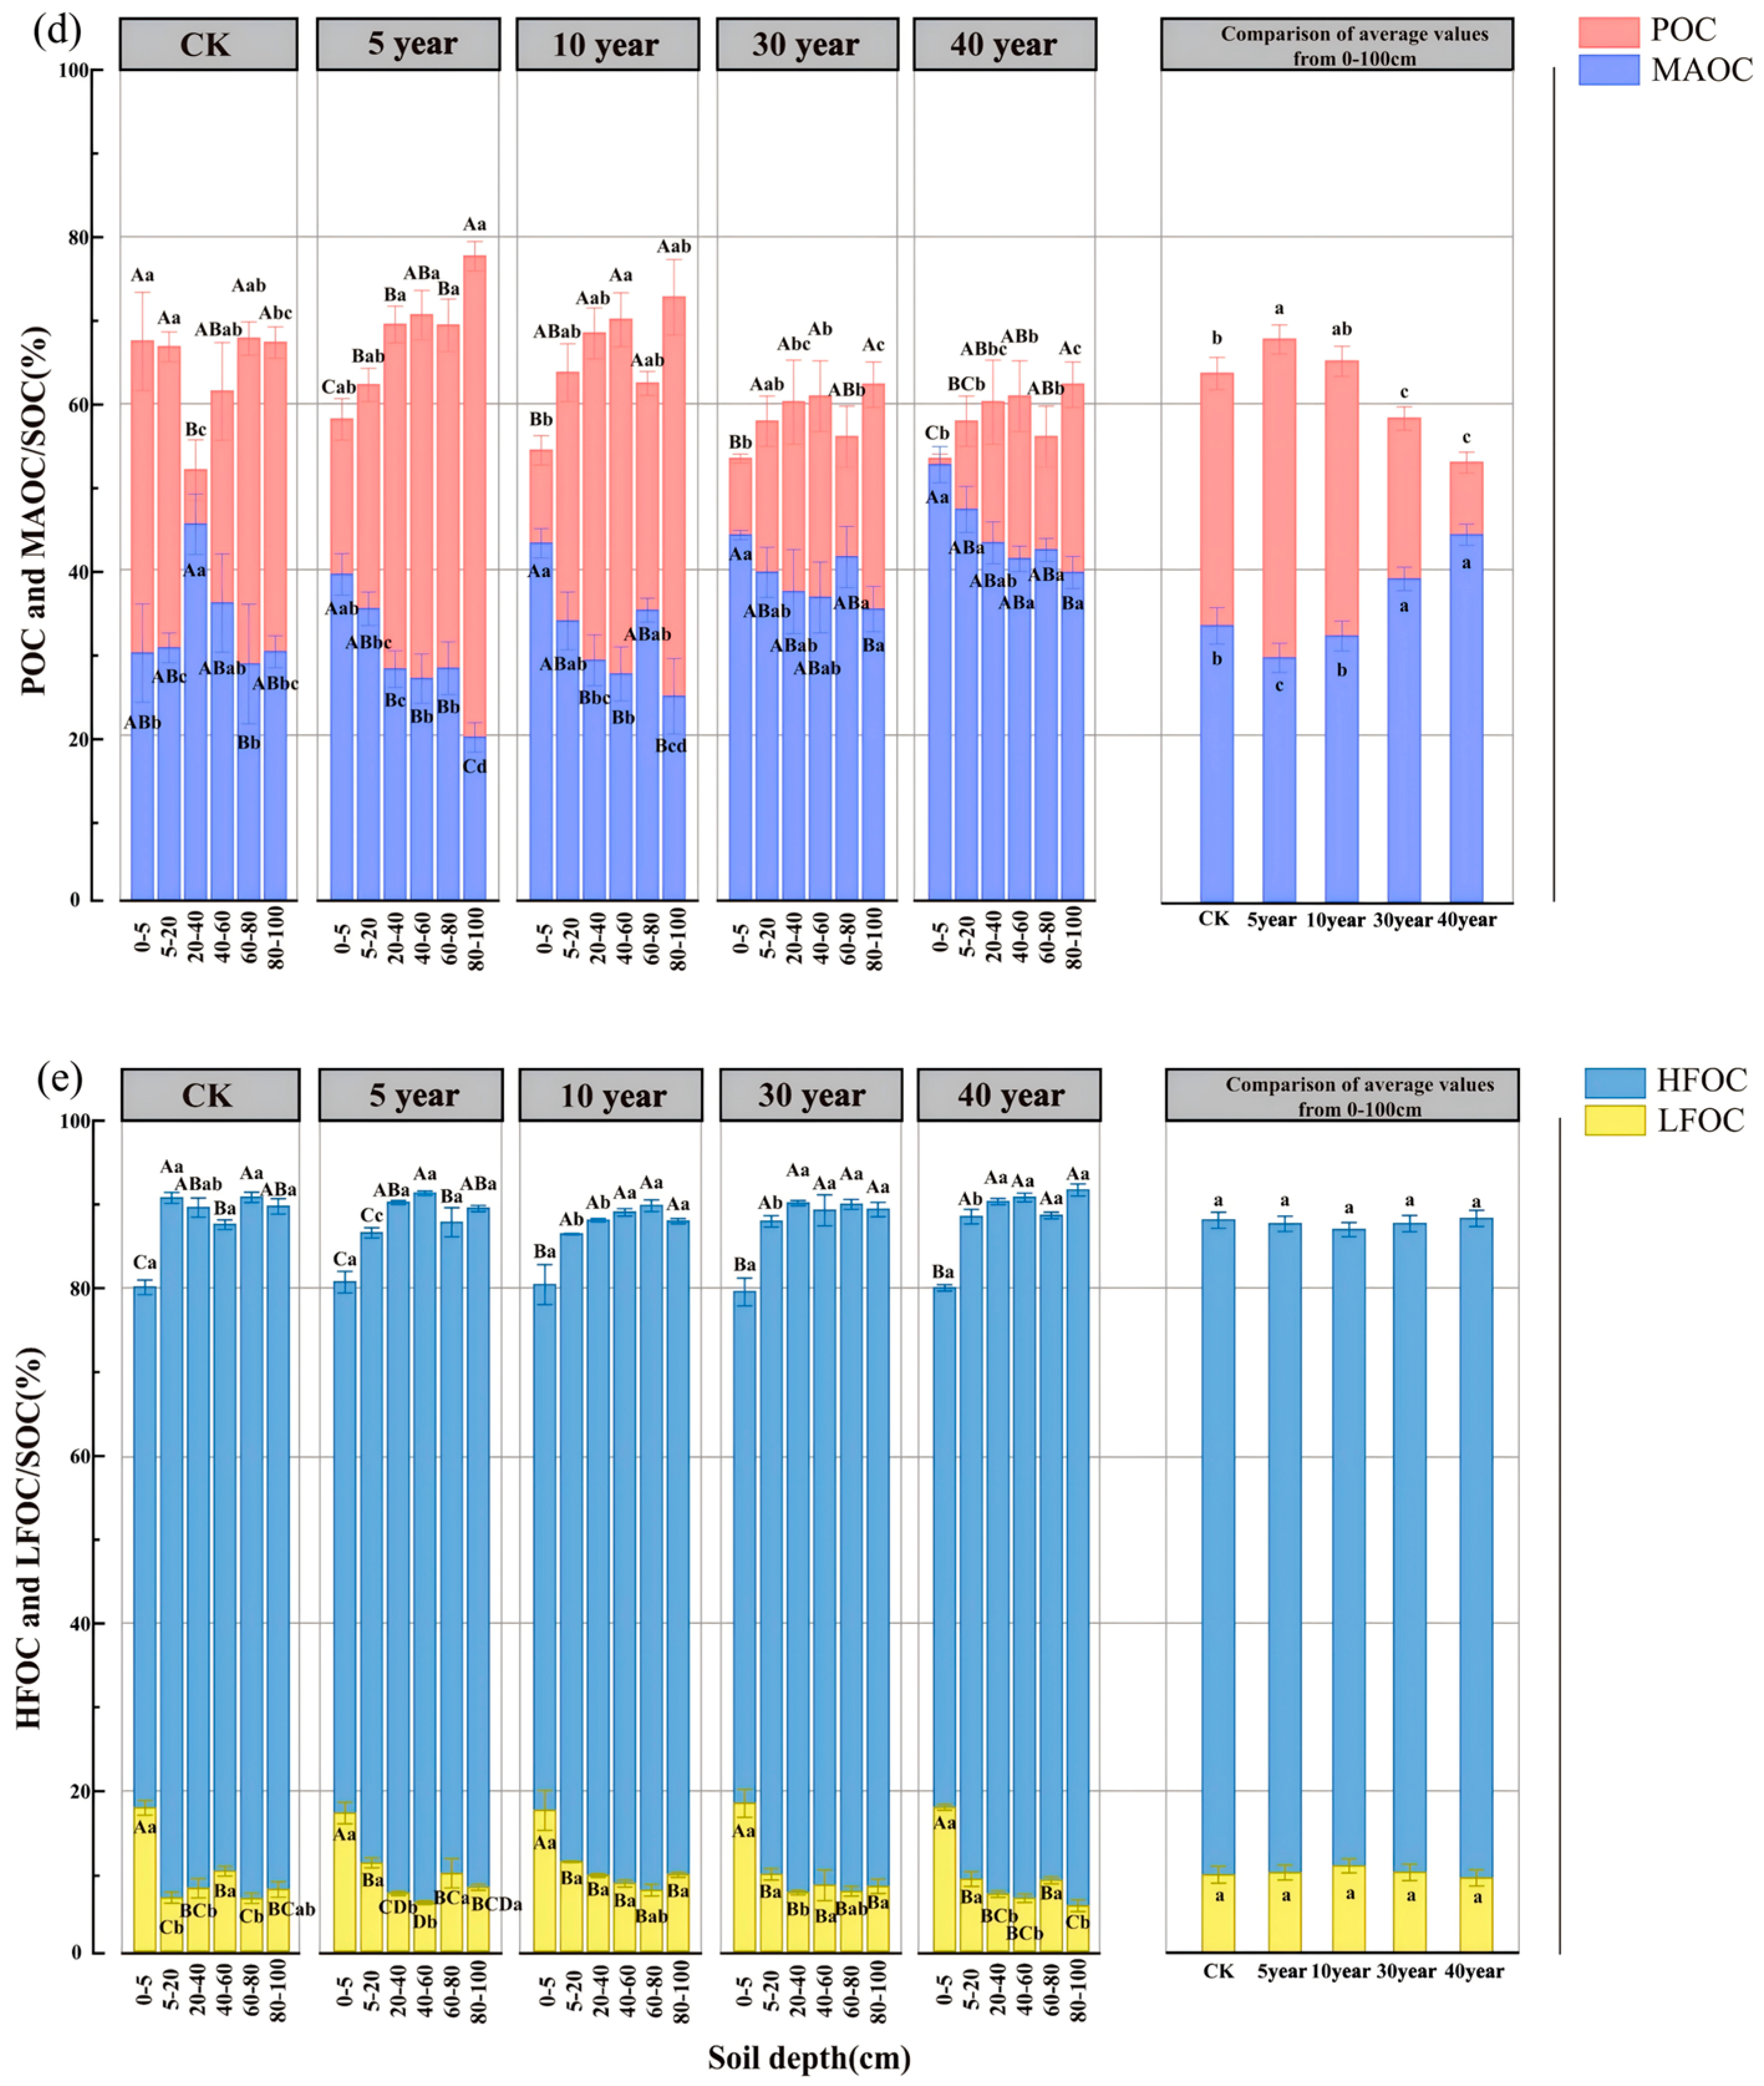
As shown in Figure 4, the relative contributions of different carbon fractions to the SOC pool varied considerably, following the order: HFOC > POC > IOC > MAOC > LFOC > DOC > EOC. Chronosequence analysis revealed distinct temporal dynamics. With increasing restoration age of the C. scoparium sand-fixing plantations, the mean proportions of DOC/SOC, POC/SOC, and LFOC/SOC in the 0–100 cm soil profile initially increased and then declined (Figure 4a,d,e). In contrast, EOC/SOC showed no significant temporal trend (Figure 4b), while IOC/SOC, MAOC/SOC, and HFOC/SOC first decreased and subsequently increased at later restoration stages (Figure 4c–e).
Spatially, in the CK site, DOC/SOC, EOC/SOC, and LFOC/SOC ratios peaked in the 0–5 cm layer and declined significantly with depth (p < 0.05). POC/SOC displayed a V-shaped vertical pattern, while HFOC/SOC reached its minimum in the surface layer (0–5 cm; p < 0.05). No consistent depth-dependent trend was observed for IOC/SOC, whereas MAOC/SOC showed a unimodal distribution, with the highest values at 20–40 cm depth. In the C. scoparium sand-fixing plantations, DOC/SOC exhibited no clear trend in 5-year-old stands but declined significantly with depth in the 10-, 30-, and 40-year plantations (Figure 4a). EOC/SOC, MAOC/SOC, and LFOC/SOC ratios all decreased with increasing depth (Figure 4b,d,e), whereas IOC/SOC and POC/SOC increased (Figure 4c,d). Consistent with the CK site, the HFOC/SOC ratio was lowest in the 0–5 cm layer across all plantation ages (Figure 4e).

3.4. Characteristics of Carbon Pool Management Indices in C. scoparium Sand-Fixing Plantations Across Restoration Chronosequences

As shown in Table 3, the soil CPMI within the 0–100 cm profile increased significantly with the restoration age of C. scoparium plantations compared to mobile sand dunes (CK) (p < 0.05). Specifically, relative to CK, SC content increased by 0.16-, 0.57-, 1.05-, and 1.25-fold; CPI by 0.18-, 0.65-, 1.11-, and 1.36-fold; and CPMI by 0.28-, 0.73-, 1.06-, and 1.49-fold in the 5-, 10-, 30-, and 40-year plantations, respectively (p < 0.05). In contrast, A and AI showed no significant variation across restoration stages (p > 0.05). These results suggest that improvements in soil carbon pool quality during sand-fixing vegetation succession are primarily driven by the accumulation of stable carbon fractions rather than by increases in carbon pool activity.

3.5. Effects of Soil Physicochemical Properties and Vegetation Restoration Characteristics on Soil Carbon Fractions

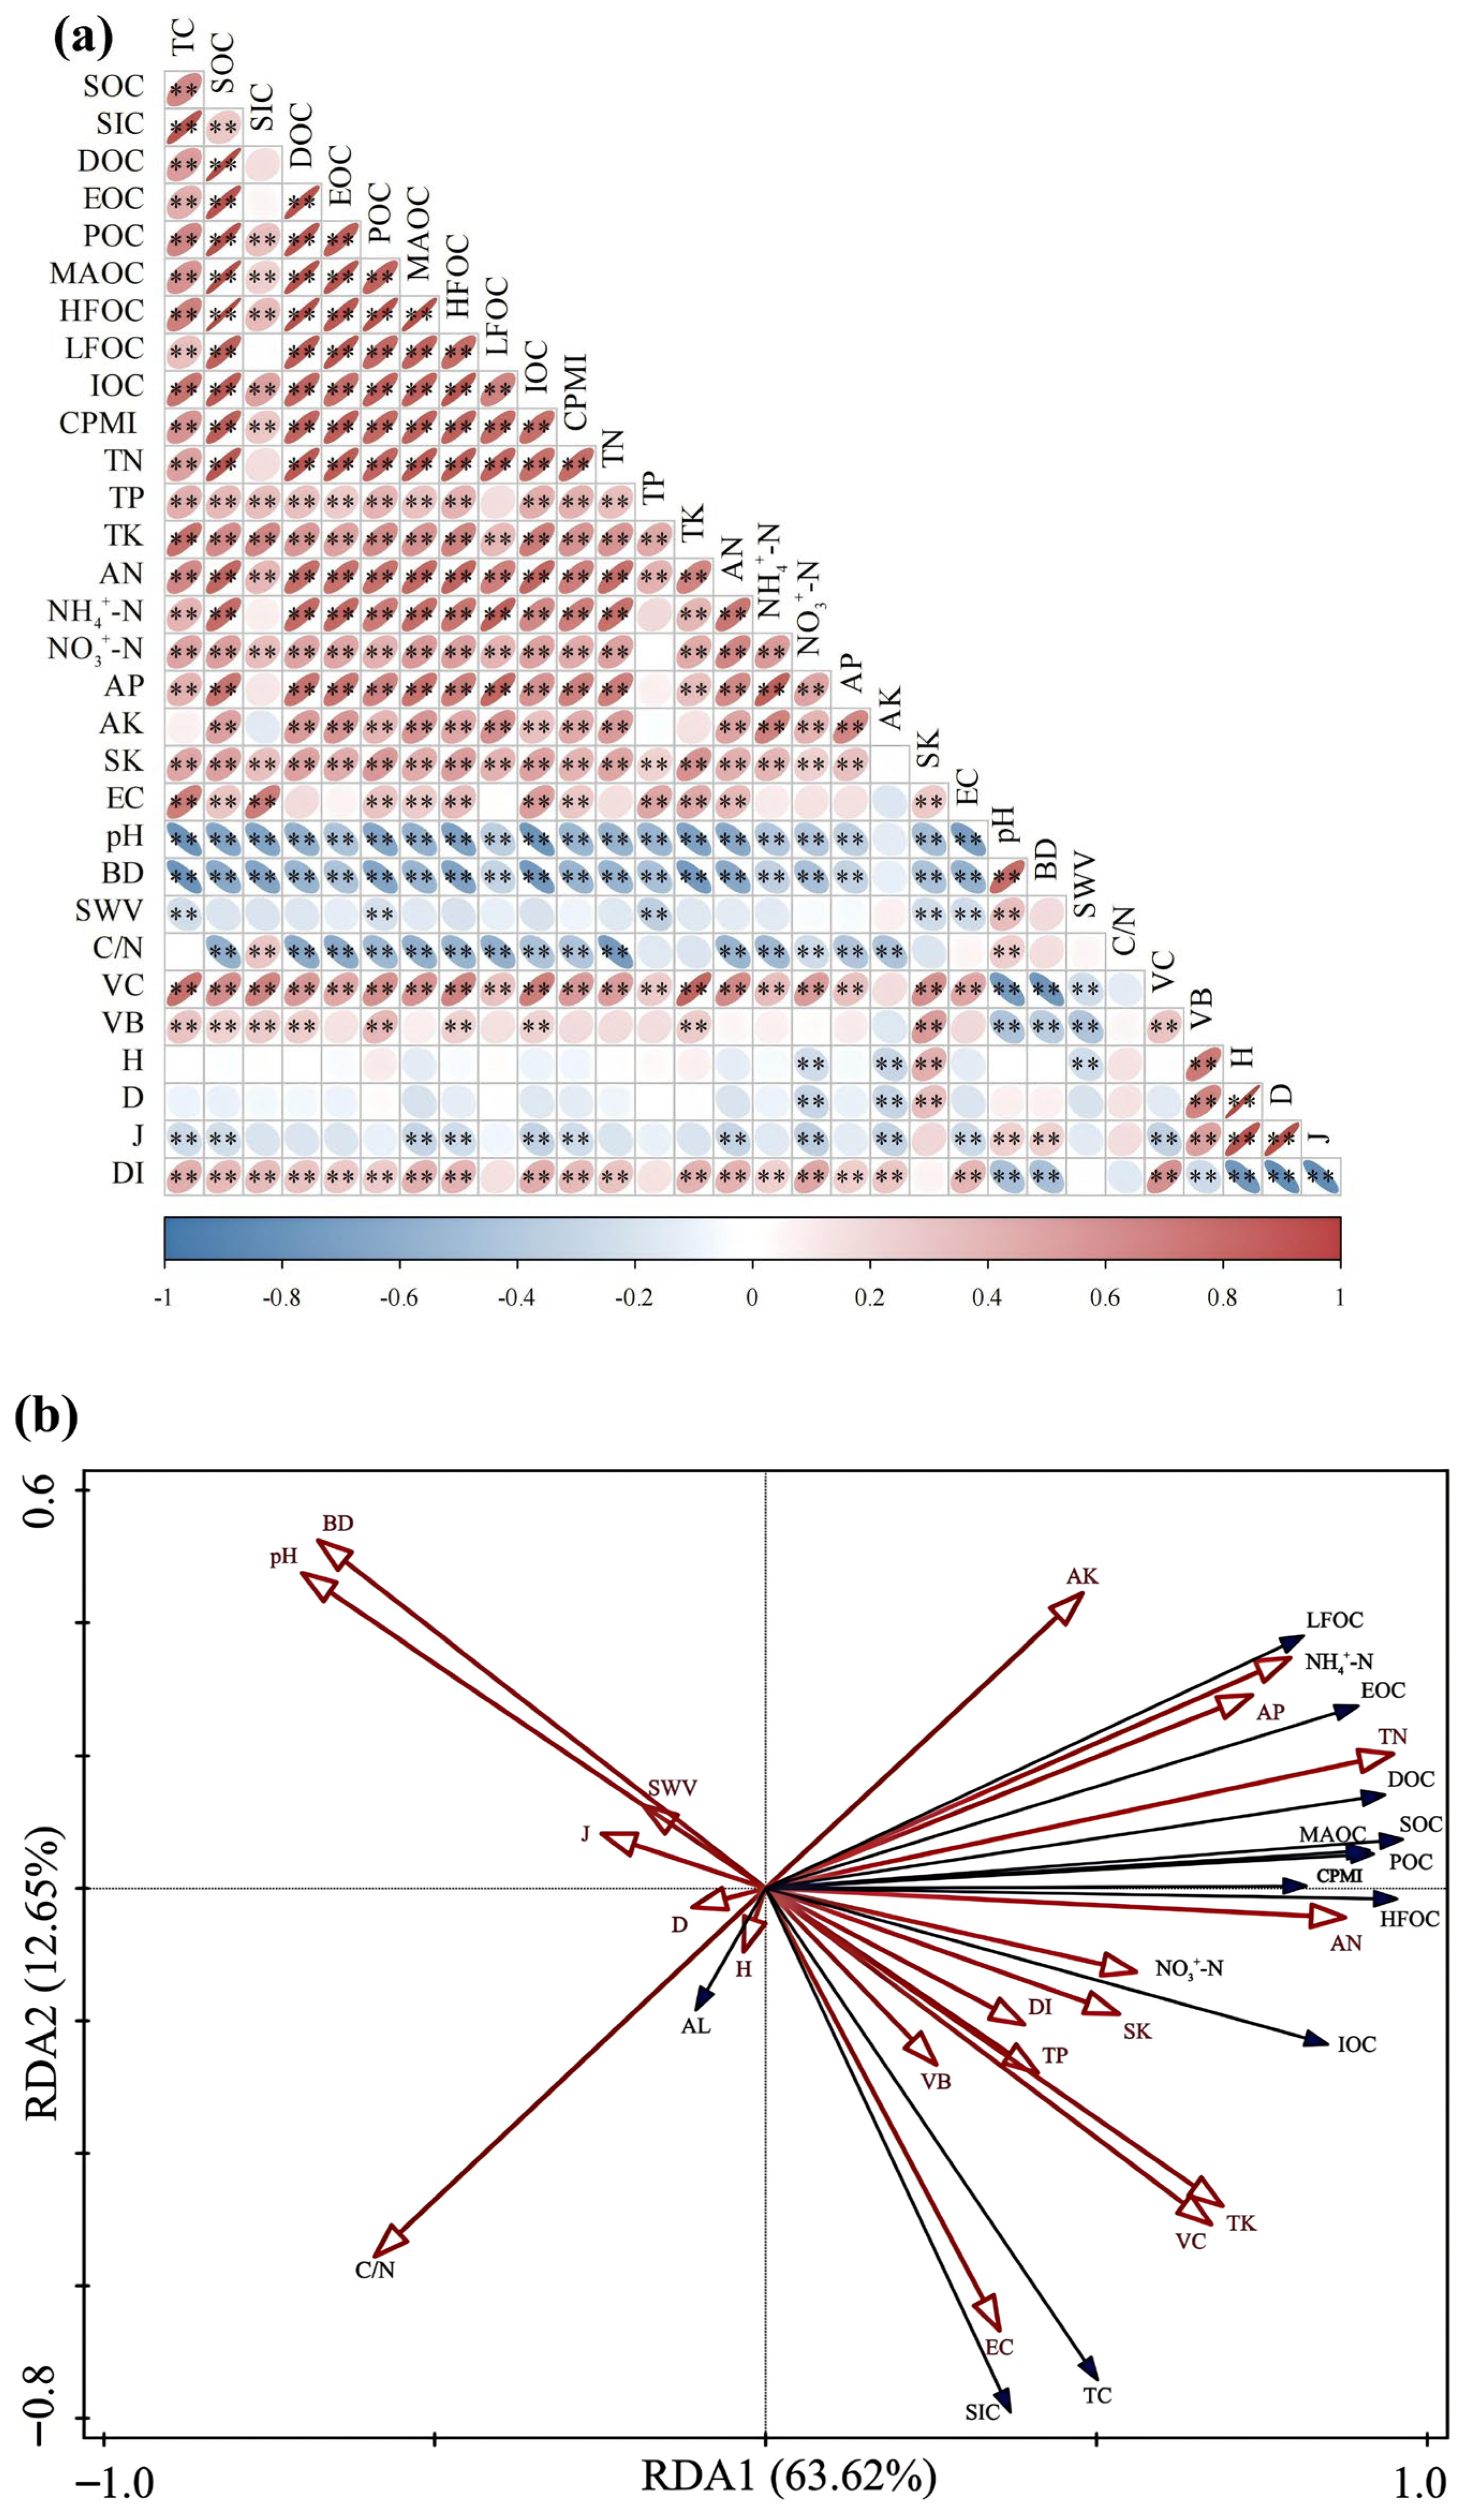
The effects of vegetation restoration characteristics and soil physicochemical properties on soil carbon fractions in the 0–100 cm profile are shown in Figure 5. Correlation analysis (Figure 5a) and RDA (Figure 5b) revealed highly significant positive correlations (p < 0.01) between TC, SOC, and all measured organic carbon fractions (DOC, EOC, POC, MAOC, LFOC, HFOC, IOC), as well as the CPMI. SIC was also strongly and positively correlated with SOC, POC, MAOC, HFOC, IOC, and CPMI (p < 0.01). With respect to soil physicochemical properties, all carbon fractions (TC, SOC, SIC, and their components) and CPMI were significantly positively correlated with TK, AN, NO3-N, SK, and VC (p < 0.01). Additionally, TC showed significant positive correlations with TN, TP, NH4+-N, AP, EC, VB, and DI (p < 0.01). SIC was significantly positively correlated with TP, EC, the C/N ratio, VB, and DI (p < 0.01). SOC was strongly positively correlated with TN, TP, NH4+-N, AP, AK, EC, VB, and DI (p < 0.01), but negatively correlated with the C/N ratio (p < 0.01). Similarly, all SOC fractions (DOC, EOC, POC, MAOC, LFOC, HFOC, IOC) and CPMI were positively correlated with TN, TP, NH4+-N, AP, AK, VB, and DI, and negatively correlated with the C/N ratio. Notably, all carbon fractions and CPMI exhibited significant negative correlations with soil pH, BD, and SWV.
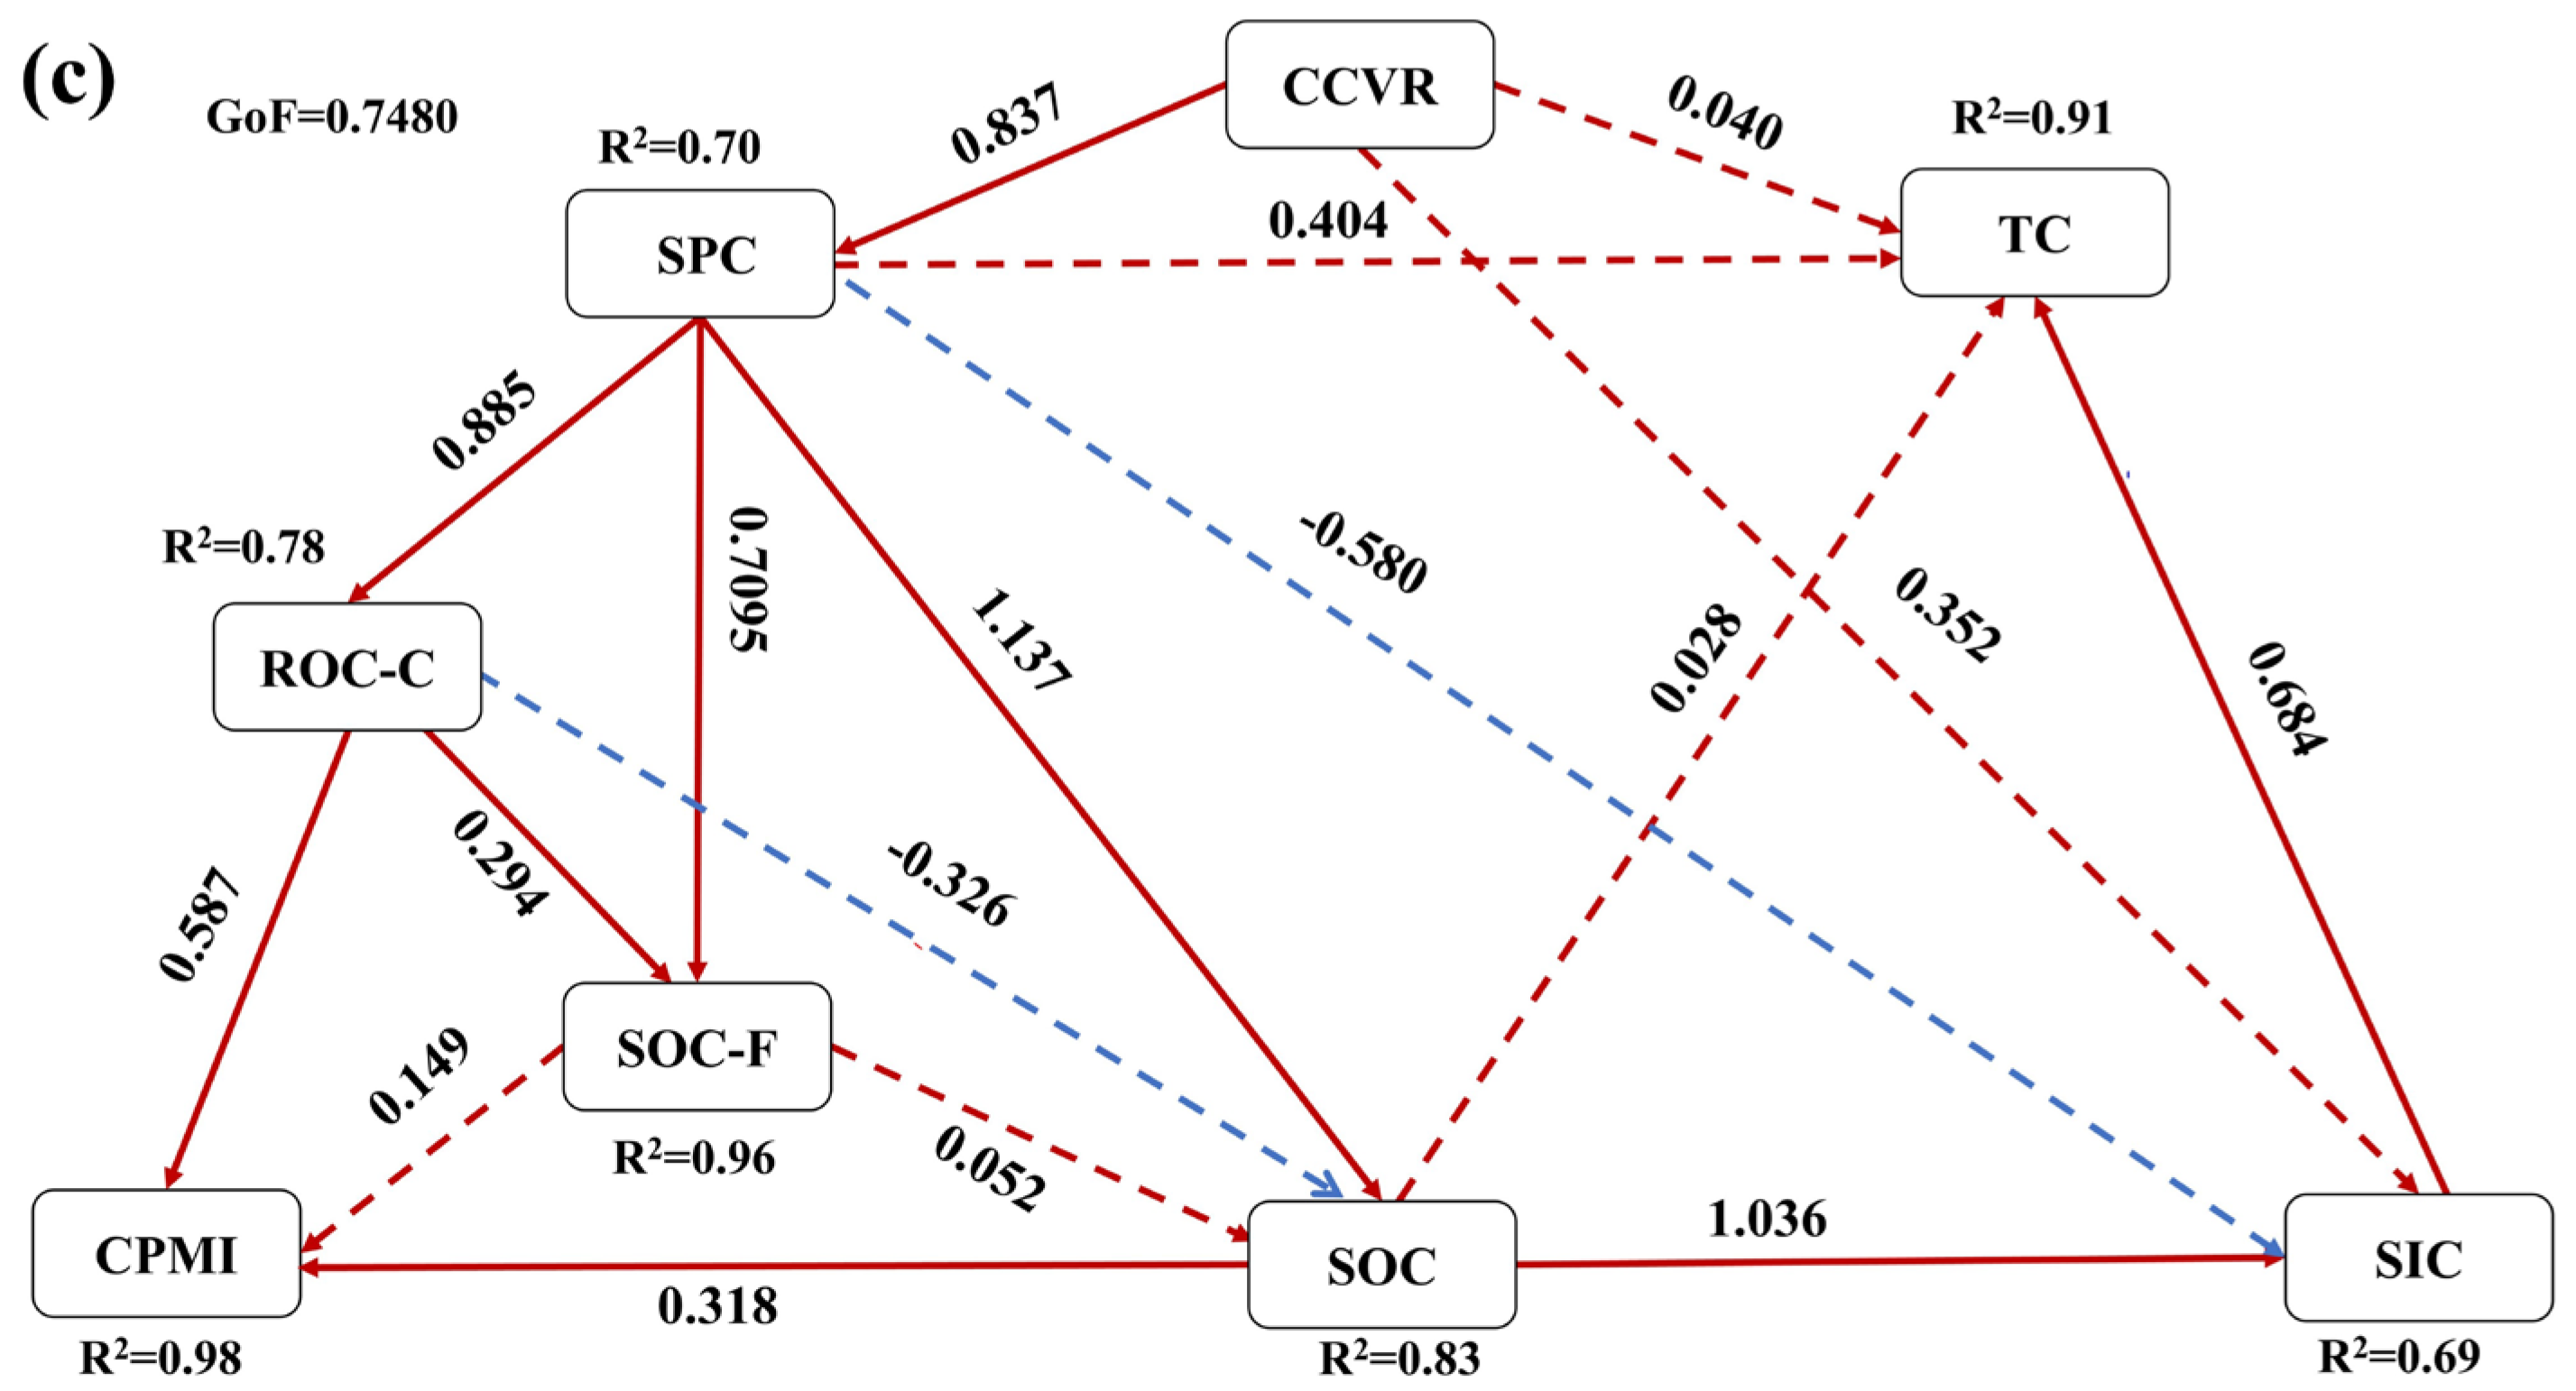
Path analysis using PLS-SEM (Figure 5c; model goodness-of-fit = 0.75) demonstrated that C. scoparium restoration enhanced TC accumulation primarily through vegetation–soil interactions. The dominant pathway was that increases in CCVR improved SPC, which, in turn, promoted SOC accumulation; subsequently, the mutual transformation between SOC and SIC further contributed to TC enrichment. The direct effect of CCVR on TC was 0.040, while the indirect effect was 0.690, yielding a total effect of 0.730. SPC exerted a direct effect of 0.404 and an indirect effect of 0.133, for a total effect of 0.537. SOC exerted a direct effect of 0.028 and an indirect effect of 0.665, for a total effect of 0.692. Overall, CCVR improved SPC, thereby creating favorable soil conditions for the accumulation of SOC, ROC-C, and SOC-F. The increase in these carbon pool fractions served as the core driving force behind the enhancement of the CPMI, forming a clear functional pathway: “CCVR → SPC improvement → carbon content accumulation → CPMI enhancement.”
Among all predictors, TN had the strongest influence on soil carbon fractions, accounting for 57.7% of the total explanatory power, followed by BD and VC. Collectively, TN, BD, VC, the C/N ratio, EC, AP, and AN were identified as the key drivers regulating soil carbon fraction dynamics and CPMI (p < 0.05; Table 4). These results highlight that both soil physicochemical properties and vegetation attributes play critical roles in shaping carbon fraction dynamics and promoting carbon content accumulation.

4. Discussion

4.1. Effects of Artificial C. scoparium Sand-Fixing Plantations on SOC, SIC, and CPMI

In the Sahel region of Africa, large-scale restoration initiatives such as the Great Green Wall have demonstrated that afforestation and agroforestry can effectively enhance SOC, improve soil fertility, and support local livelihoods [38]. Similarly, in the southwestern United States, shrubland and grassland restoration projects have reported increases in soil carbon storage, although strong interannual variability in precipitation constrains the stability of carbon sequestration [39]. The findings from the Tengger Desert contribute to a broader understanding of how afforestation in drylands can function as an effective strategy for strengthening carbon sinks under diverse environmental and socio-ecological conditions. Forty years after the establishment of C. scoparium sand-fixing plantations, compared with mobile sand dunes (CK), SOC content in the 0–5 cm soil depth increased by 3.85-fold, while TC and SIC contents in the 80–100 cm layer increased by 2.18- and 2.25-fold, respectively (Figure 2). On average, TC, SOC, and SIC contents in the 0–100 cm profile were 1.87-, 2.16-, and 1.77-fold higher, respectively, than those in CK (Figure 2). These results are consistent with the findings of Jia et al. [40], Gao et al. [41], and Huang et al. [42], confirming that artificial C. scoparium sand-fixing plantations significantly enhance carbon sequestration and sink capacity. Notably, the TC and SOC contents in C. scoparium plantations were lower than those in Haloxylon ammodendron (C. A. Mey.) Bunge., C. korshinskii, and Tamarix chinensis Lour. plantations, but much higher than in Calligonum mongolicum Turcz. and Nitraria tangutorum Bobrov. communities [19].
The observed patterns, namely, the increase in SOC content with the age of C. scoparium sand-fixing plantations and the surface accumulation of SOC, can largely be attributed to aboveground litter inputs and root exudates as primary carbon sources [1,10,17]. Following the establishment of C. scoparium, community coverage and ecological dominance increased markedly (Table 2), species diversity improved, and the production of litter and root exudates rose accordingly. In addition, the canopy of C. scoparium reduces wind speed and suppresses wind erosion, thereby improving the microenvironment for desert vegetation and enhancing the ecosystem’s capacity to capture atmospheric dust. The SOC and fine particulate matter carried by this dust provide supplementary carbon inputs [1,43]. At the same time, the establishment of sand-fixing vegetation facilitates the formation of biological soil crusts [25], which, together with plant litter, serve as the principal contributors to SOC in surface soils.
The accumulation of SIC can be explained by multiple mechanisms. Vegetation reconstruction promotes the transformation along the pathway “SOM → SOC → CO2 → Ca2+ precipitation” by enhancing soil respiration and facilitating the conversion of SOC to SIC [44,45]. Compared with dryland, grasses offer three main advantages: (1) They support a more active microbial community [46]; (2) they display stronger physiological responses to rainfall pulses [47]; and (3) they substantially enhance the accumulation of ions such as calcium (Ca2+) and magnesium (Mg2+) [44,48]. In addition, wind-driven processes, such as aeolian sand transport, directly contribute to SIC formation through dust deposition, as the dust contains 2%–5% Ca2+/Mg2+ [49,50]. Although topsoil erosion typically depletes calcium carbonate (CaCO3) reserves [51], sand-fixing vegetation mitigates particle migration by increasing canopy cover and improving dust interception. Groundwater chemistry and dissolution-precipitation cycles further regulate carbonate accumulation [44], particularly in deeper soil where water movement and ionic composition exert greater influence [52]. Moreover, microbial community structure and activity play a pivotal role in SOC transformation, shaping the balance between labile and stable fractions through decomposition, stabilization, and mineral–organic interactions [53,54]. These synergistic mechanisms collectively elevate the concentration of mineral elements in the soil, thereby reinforcing the contribution of the “CO2–plant–soil” system to the SIC pool [49]. Ultimately, this process promotes the direct precipitation of carbonates driven by the increased partial pressure of CO2 within the soil.
In this study, SIC content increased with soil depth (Figure 2c), a vertical distribution pattern consistent with findings from arid and semi-arid regions [55], but distinct from that observed in agricultural ecosystems [56]. The deep enrichment of SIC can be attributed to several factors. First, CO2 released from deep root and microbial respiration elevates subsurface CO2 concentrations, thereby supplying sufficient bicarbonate and carbonate ions for pedogenic carbonate formation [57,58]. Second, the high porosity of sandy soils under arid conditions enhances water infiltration [59], and the downward movement of soil water further promotes carbonate leaching, migration, and subsequent precipitation at depth. Third, alkaline conditions (pH > 7) accelerate CaCO3 formation and favor the redistribution of inorganic carbon into deeper soil [55,60,61]. Moreover, as soil depth increases, soil structure becomes denser and less permeable, creating a physical barrier that limits carbonate leaching losses [59] and promotes carbon retention at depth. Importantly, in arid desert regions, SOC content is extremely low [62,63], and SIC therefore dominates the total soil carbon pool (Figure 2). This predominance reflects the dual constraints of limited water availability, which suppresses microbial activity and delays SOC accumulation and turnover [64], and the weakly alkaline, highly porous sandy soil environment, which favors long-term SIC sequestration [64,65,66].
As a comprehensive indicator of soil quality evolution, the CPMI reflects the simultaneous enhancement of organic carbon availability and soil fertility when its value increases [18,22,34]. In this study, SC, CPI, and CPMI all increased progressively with the age of C. scoparium sand-fixing plantations (Table 4), whereas soil carbon pool activity remained relatively stable. This suggests that the establishment of C. scoparium plantations in arid desert regions not only improves the overall quality of the soil carbon pool but also strengthens the sustainability of ecosystem functions by enhancing nutrient cycling efficiency. These results highlight the important role of afforestation in mitigating climate change impacts in drylands, where both organic and inorganic carbon pools act synergistically to enhance carbon sequestration under warming and drying conditions.

4.2. Effects of Artificial C. scoparium Sand-Fixing Plantations on SOC Fractions and Their Proportions

The spatiotemporal variation in DOC, EOC, LFOC, POC, IOC, MAOC, and HFOC contents within the 0–100 cm soil profile (Figure 3) closely mirrored the trends observed for SOC, with the most pronounced increases occurring in the surface layers. This consistency indicates that the establishment of C. scoparium sand-fixing plantations promotes the accumulation of both labile and stable carbon pools, particularly in upper soil horizons. These results are consistent with previous studies showing that long-term vegetation restoration enhances the buildup of multiple SOC fractions in arid regions [67,68,69]. The relative proportions of labile versus stable organic carbon fractions provide important insight into carbon pool stability. A higher proportion of labile carbon generally reflects lower stability, whereas greater contributions from stable fractions indicate enhanced SOC stabilization [70]. In this study, DOC/SOC and POC/SOC ratios declined significantly with increasing plantation age, while IOC/SOC and MAOC/SOC ratios increased (Figure 4). This pattern suggests a progressive shift from labile to stable carbon forms during vegetation recovery, thereby indicating improved carbon sequestration stability over time.
Vertical distribution patterns further reinforced these distinctions: DOC/SOC, LFOC/SOC, and EOC/SOC ratios declined with depth, whereas HFOC/SOC and IOC/SOC ratios increased (Figure 4). This indicates that surface soils are enriched in labile carbon, while deeper layers accumulate more stable forms. Notably, MAOC/SOC ratios (0.41–0.54) were consistently lower than POC/SOC ratios (0.46–0.59), a trend that contrasts with patterns commonly reported in non-desert ecosystems [71] (Figure 4d). Several factors may account for this discrepancy: (1) The coarse-textured, sandy substrates of desert soils contain inherently low amounts of clay and silt, limiting mineral–organic matter associations and thereby constraining MAOC formation [71]. However, vegetation restoration can improve soil texture by increasing clay and silt fractions, which enhances mineral accessibility and promotes MAOC accumulation [72]. (2) The arid climate, characterized by low precipitation and chronic drought stress, suppresses microbial activity and delays the mineralization-humification processes required for MAOC formation, leading instead to preferential accumulation of POC [10,32]. (3) Compared with mobile sand dunes, soil pH in C. scoparium plantations declined significantly (Table 2), and this acidification may influence MAOC dynamics by altering microbial community composition and associated metabolic functions [71,72,73].
Interestingly, MAOC/SOC values decreased with depth, whereas POC/SOC values showed the opposite trend, contrary to the patterns of other stable and labile carbon fractions (Figure 4d). This indicates that in surface layers, where microbial biomass and activity are highest, POC is more efficiently transformed into MAOC through mineral associations [73,74]. These findings highlight that no single fraction can fully capture changes in SOC composition; instead, a comprehensive assessment of both labile and stable fractions is required to elucidate the mechanisms of carbon stabilization under vegetation restoration.

4.3. Drivers of Soil Carbon Fraction Dynamics and CPMI in C. scoparium Sand-Fixing Plantations

This study revealed positive correlations among soil carbon fractions, as well as between these fractions and the CPMI in artificial C. scoparium plantations (Figure 5a,b). This indicates that labile and stable carbon fractions maintain a dynamic balance through microbially mediated chemical transformations [72,73,74,75], collectively regulating SOC turnover. Moreover, under specific environmental conditions, bidirectional transformations between SIC and SOC may occur [76,77], further underscoring the complexity and interdependence of carbon cycling processes in arid desert ecosystems. Taken together, these findings highlight CPMI as a valuable index for assessing soil carbon pool quality in this region.
The synergistic evolution of vegetation restoration and soil physicochemical properties played a pivotal role in regulating the dynamics of soil carbon fractions and CPMI (Figure 5b,c). This finding indicates that C. scoparium sand-fixing plantations enhance carbon accumulation efficiency by optimizing vegetation structure and improving the soil environment. RDA identified TN, BD, VC, C/N, EC, AP, and AN as key drivers of SOC sequestration and CPMI improvement (Table 4). Among these, nitrogen and phosphorus, critical nutrients that limit plant productivity, microbial activity, and organic matter decomposition rates [78,79], increased significantly with restoration age (Table 2), thereby stimulating microbial proliferation, accelerating organic matter turnover, and promoting carbon accumulation [80]. Soil carbon fractions and CPMI in C. scoparium plantations exhibited highly significant negative correlations with soil BD and pH (Figure 5a,b). This suggests that reductions in soil pH, BD, and SWV help mitigate carbon loss, consistent with findings from other ecosystems [80,81,82]. Soil water content influences carbon pools via two main pathways: (i) by promoting vegetation growth and thus organic matter input, while simultaneously regulating soil aeration, microbial activity, and SOC mineralization rates [83]; and (ii) by combining with CO2 to form carbonic acid, which accelerates the carbonation of calcium, magnesium, and other cations [41]. Moreover, soils with near-neutral to slightly alkaline pH (6–8) typically support enhanced microbial activity, facilitating the turnover of labile carbon [22]. Meanwhile, decreasing BD improves soil porosity, root penetration, and microbial processes, ultimately promoting organic matter mineralization and SOC accumulation [82].
EC showed a significant positive correlation with SIC (Figure 5b), which contrasts with the findings of Raj Setia et al. [84], who reported reduced SIC under saline conditions. This difference may be attributed to the relatively low salinity levels observed in C. scoparium plantations (64.88–166.22 μS·cm−1) (Table 2). In arid regions, low salinity can promote carbon accumulation by enhancing microbial activity and stimulating litter decomposition [85]. Moreover, under alkaline conditions, CO2 released from SOC decomposition is buffered by the soil, preventing inorganic carbon dissolution and instead facilitating carbonate precipitation through the availability of soluble carbonates [6,86]. Increased VC further enriches SOC by enhancing litter deposition and root exudation (Table 2). Climatic variability also plays an important role in regulating carbon fraction dynamics. In arid environments, large diurnal temperature ranges may mediate SOC–SIC interconversion by altering soil respiration rates: higher daytime temperatures accelerate SOC mineralization, while cooler nighttime temperatures favor carbonate precipitation [87]. Precipitation, the primary limiting factor for ecosystem development in deserts, directly regulates the solubility and mobility of mineral and inorganic carbon [88]. Consequently, strong temperature fluctuations and low rainfall in hyperarid regions reinforce the dominance of SIC within the carbon pool. Although the analyses were based on 20 × 20 m2 plots, the plots represent the typical soil and vegetation conditions of C. scoparium plantations along the southern margin of the Tengger Desert. Therefore, the results provide mechanistic insights into soil carbon dynamics that can cautiously be extrapolated to the landscape scale, offering a scientific basis for regional afforestation strategies and carbon management in arid sandy ecosystems.
In summary, vegetation restoration through C. scoparium sand-fixing plantations markedly enhances desert soil carbon content and CPMI by improving both vegetation community structure and soil physicochemical conditions. Nevertheless, the regulatory mechanisms remain complex. To advance understanding, future research should integrate soil microbial dynamics with hydrological processes to clarify the biogeochemical pathways that govern carbon pool transformation in arid ecosystems.

4.4. Research Limitations and Perspectives

This study comprehensively investigated the dynamics of soil carbon fractions across different vegetation restoration stages and identified the key factors regulating their variation, thereby providing new insights into the role of C. scoparium sand-fixing forests in enhancing soil carbon pools in desert ecosystems. Temporally, this research did not capture short-term responses to extreme climatic events, seasonal variations, or centennial-scale dynamics that determine the long-term stability of desert carbon sinks. Mechanistically, the study lacked quantitative assessments of specific carbon cycling processes, did not fully address the functional coupling between microbial communities and carbon transformation, and only partially considered the interactions among multiple environmental drivers. Future studies should incorporate interannual climatic variability, microbial processes, and isotopic tracing (e.g., 14C) to better quantify carbon turnover and strengthen the integration of results into international carbon accounting frameworks. In addition, advancing mechanistic studies on carbon cycling and developing coupled vegetation–soil–microbial models will be essential to deepen understanding of carbon stabilization pathways and to provide stronger scientific foundations for sustainable land management and climate policy in arid regions.

5. Conclusions

The results partially supported the initial hypothesis: With increasing restoration age, the contents of SIC, SOC, and their respective fractions, as well as the proportions of stable carbon fractions and the CPMI, showed significant increases. SOC, along with the DOC/SOC, EOC/SOC, LFOC/SOC, and MAOC/SOC ratios, declined with soil depth, whereas SIC and the POC/SOC, IOC/SOC, and HFOC/SOC ratios exhibited increasing trends with depth. These dynamic shifts in soil carbon fractions and CPMI were primarily regulated by vegetation–soil interaction mechanisms. Among the influencing factors, TN, BD, VC, C/N, EC, AP, and AN emerged as key drivers of variation, while soil pH, BD, and SWV were identified as major constraints on soil carbon accumulation.
Overall, the establishment of C. scoparium sand-fixing plantations markedly increases the carbon content of aeolian sandy soils, enhances the stability of soil carbon pools, promotes nutrient cycling, and improves overall soil quality. This practice therefore represents an effective strategy for carbon sequestration and sink enhancement in arid desert regions. Importantly, the findings provide key parameters for carbon accounting under the IPCC AFOLU framework, offering a scientific basis for evidence-based evaluations of afforestation-driven carbon sequestration. Future research should focus on quantifying the relative contributions of different sand-fixing practices to soil carbon fractions at broader spatial scales and integrating these findings with regional climate and carbon modeling approaches to strengthen landscape-level carbon management strategies.

Author Contributions

Conceptualization: L.S. and Q.M.; methodology: L.S. and. Q.M.; software: L.S.; validation: R.M., L.W., F.C., G.W., R.W. and Q.W.; investigation: L.S., Q.M., R.M., L.W., F.C., G.W., R.W. and Q.W.; writing—original draft: L.S.; data curation: L.S., Q.M., R.M., L.W., F.C., G.W., R.W. and Q.W.; visualization: L.S. and. Q.M.; writing—review and editing: L.S. and Q.M.; supervision: R.M.; project administration: Q.M. All authors have read and agreed to the published version of the manuscript.

Funding

This research was funded by the National Key Research and Development Program of China (2024YFD2201105), Gansu Provincial Key Research and Development Program (24YFFA040), National Natural Science Foundation of China (No. 32160410), Gansu Provincial Forestry and Grassland Bureau Innovation Project for Desert Control (2023-ZS-01), Scientific and Technological Support for Grassland Ecological Restoration and Management in Gansu Province, China (LCJ20210028).

Data Availability Statement

The data presented in this study are available on request from the corresponding authors.

Conflicts of Interest

The authors declare that the research was conducted in the absence of any commercial or financial relationships that could be construed as potential conflicts of interest.

References

  1. Li, X.J.; Li, Y.F.; Xie, T.; Chang, Z.Q.; Li, X.R. Recovery of soil carbon and nitrogen stocks following afforestation with xerophytic shrubs in the Tengger Desert, North China. Catena 2022, 214, 106277. [Google Scholar] [CrossRef]
  2. Reynolds, J.F.; Smith, D.M.S.; Lambin, E.F.; Turner, B.L., 2nd; Mortimore, M.; Batterbury, S.P.J.; Downing, T.E.; Dowlatabadi, H.; Fernandez, R.J.; Herrick, J.E.; et al. Global desertification: Building a science for dryland development. Science 2007, 316, 847–851. [Google Scholar] [CrossRef] [PubMed]
  3. Huang, J.P.; Yu, H.P.; Guan, X.D.; Wang, G.Y.; Guo, R.X. Accelerated dryland expansion under climate change. Nat. Clim. Chang. 2016, 6, 166–171. [Google Scholar] [CrossRef]
  4. Maestre, F.T.; Benito, B.M.; Berdugo, M.; Concostrina-Zubiri, L.; Delgado-Baquerizo, M.; Eldridge, D.J.; Guirado, E.; Gross, N.; Kéfi, S.; Le Bagousse-Pinguet, Y.; et al. Biogeography of global drylands. New Phytol. 2021, 231, 540–558. [Google Scholar] [CrossRef]
  5. Minasny, B.; Malone, B.P.; McBratney, A.B.; Angers, D.A.; Arrouays, D.; Chambers, A.; Chaplot, V.; Chen, Z.S.; Cheng, K.; Das, B.S.; et al. Soil carbon 4 per mille. Geoderma 2017, 292, 59–86. [Google Scholar] [CrossRef]
  6. Shi, Y.; Baumann, F.; Ma, Y.; Song, C.; Kühn, P.; Scholten, T.; He, J.S. Organic and inorganic carbon in the topsoil of the Mongolian and Tibetan grasslands: Pattern, control and implications. Biogeosciences 2012, 9, 2287–2299. [Google Scholar] [CrossRef]
  7. Schlaepfer, D.R.; Bradford, J.B.; Lauenroth, W.K.; Munson, S.M.; Tietjen, B.; Hall, S.A.; Wilson, S.D.; Duniway, M.C.; Jia, G.; Pyke, D.A.; et al. Climate change reduces extent of temperate drylands and intensifies drought in deep soils. Nat. Commun. 2017, 8, 14196. [Google Scholar] [CrossRef]
  8. Lal, R. Carbon Cycling in Global Drylands. Curr. Clim. Chang. Rep. 2019, 5, 221–232. [Google Scholar] [CrossRef]
  9. Zhao, S.X.; Ta, N.; Li, Z.H.; Yang, Y.; Zhang, X.; Liu, D.; Zhang, A.; Wang, X.D. Varying pyrolysis temperature impacts application effects of biochar on soil labile organic carbon and humic fractions. Appl. Soil Ecol. 2018, 123, 484–493. [Google Scholar] [CrossRef]
  10. Prescott, C.E.; Vesterdal, L. Decomposition and transformations along the continuum from litter to soil organic matter in forest soils. For. Ecol. Manag. 2021, 498, 119522. [Google Scholar] [CrossRef]
  11. Kang, M.P.; Zhao, C.Z.; Ma, M.; Li, X.Y. Characteristics of soil organic carbon fractions in four vegetation communities of an inland salt marsh. Carbon Bal. Manag. 2024, 19, 3. [Google Scholar] [CrossRef] [PubMed]
  12. Lavallee, J.M.; Soong, J.L.; Cotrufo, M.F. Conceptualizing soil organic matter into particulate and mineral-associated forms to address global change in the 21st century. Glob. Change Biol. 2020, 26, 261–273. [Google Scholar] [CrossRef]
  13. Han, X.; Liu, X.; Li, Z.W.; Li, J.; Yuan, Y.L.; Li, H.; Zhang, L.; Liu, S.N.; Wang, L.X.; You, C.M.; et al. Characteristics of Soil Organic Carbon Fractions and Stability Along a Chronosequence of Cryptomeria japonica var. sinensis Plantation in the Rainy Area of Western China. Forests 2022, 13, 1663. [Google Scholar] [CrossRef]
  14. Retallack, G.J. Carboniferous fossil plants and soils of an early tundra ecosystem. Palalso 1999, 14, 324–336. [Google Scholar] [CrossRef]
  15. Liu, L.; Zhang, D.; Yang, X.; Zong, H.; Fu, X.; Zheng, J. Evolution of aeolian activities in the Tennger Desert during the Holocene: Comprehensive research based on geological records and simulated data. Quat. Sci. 2024, 44, 394–415. [Google Scholar]
  16. Azam, A.; Akhtar, M.S.; Rukh, S.; Mehmood, A.; Imran, M.; Khan, A.; Qayyum, A.; Ahmad, W.; Gurmani, A.R. Changes in Soil Organic Carbon Fractions Across a Loess Toposequence. J. Soil Sci. Plant Nutr. 2020, 20, 1193–1202. [Google Scholar] [CrossRef]
  17. Li, C.J.; Ran, M.; Song, L.Y.; Zhang, Y.Y.; Li, A.W.; Shi, W.J.; Li, W.D.; Cheng, J.L.; Zhao, B.; Luo, Y.L.; et al. Temperature effects on cropland soil particulate and mineral-associated organic carbon are governed by agricultural land-use types. Geoderma 2024, 448, 116942. [Google Scholar] [CrossRef]
  18. Blair, G.; Lefroy, R.; Lisle, L. Soil carbon fractions based on their degree of oxidation, and the development of a carbon management index for agricultural systems. Aust. J. Agric. Res 1995, 46, 1459–1466. [Google Scholar] [CrossRef]
  19. Ma, Q.L.; Wang, X.Y.; Chen, F.; Wei, L.Y.; Zhang, D.K.; Jin, H.J. Carbon Sequestration Characteristics of Typical Sand-Fixing Plantations in the Shiyang River Basin of Northwest China. Forests 2024, 15, 1548. [Google Scholar] [CrossRef]
  20. Lv, C.; Saba, T.; Wang, J.; Hui, W.; Kang, X.; Xie, Y.; Wang, K.; Wang, H.; Gong, W. Conversion effects of farmland to Zanthoxylum bungeanum plantations on soil organic carbon fractions in the arid valley of the upper reaches of the yangtze river, china. Catena 2022, 217, 106523. [Google Scholar] [CrossRef]
  21. Li, Z.; Guo, B.; Zhou, Y.; Li, T.; Shao, M.a. Forest management practices can increase the soil organic carbon sequestration potential of Robinia pseudoacacia plantations in the Loess Plateau. Soil Sci. Soc. Am. J. 2025, 89, e70082. [Google Scholar] [CrossRef]
  22. Li, H.X.; Man, X.L.; Cai, T.J. Long-term effects of thinning on soil organic carbon fractions and carbon pool management indices in secondary forests of heavily burned areas. J. Environ. Manag. 2024, 371, 123273. [Google Scholar] [CrossRef] [PubMed]
  23. Janzen, H.H.; Campbell, C.A.; Brandt, S.A.; Lafond, G.P.; Townley-Smith, L. Light-Fraction Organic Matter in Soils from Long-Term Crop Rotations. Soil Sci. Soc. Am. J. 1992, 56, 1799–1806. [Google Scholar] [CrossRef]
  24. Fan, B.; Zhang, A.; Yang, Y.; Ma, Q.; Li, X.; Zhao, C. Long-Term Effects of Xerophytic Shrub Haloxylon ammodendron Plantations on Soil Properties and Vegetation Dynamics in Northwest China. PLoS ONE 2016, 11, e0168000. [Google Scholar] [CrossRef]
  25. Zhou, X.J.; An, X.L.; De Philippis, R.; Ye, C.R.; Ke, T.; Zhang, Y.R.; Chen, L.Z. The facilitative effects of shrub on induced biological soil crust development and soil properties. Appl. Soil Ecol. 2019, 137, 129–138. [Google Scholar] [CrossRef]
  26. Gao, X.; Liu, X.; Ma, L.; Wang, R. Root vertical distributions of two Artemisia species and their relationships with soil resources in the Hunshandake desert, China. Ecol. Evol. 2020, 10, 3112–3119. [Google Scholar] [CrossRef] [PubMed]
  27. Li, Z.; Tian, Y.; Song, M.; Yu, M.; Li, X.; Zhang, Y.; Huang, J.; Su, Z.; Sun, S.; Dai, H. Competition between shrubs and grasses in a shrub-encroached temperate grassland: Implications from nitrogen acquisition. Biol. Fertil. Soils 2025, 61, 1129–1144. [Google Scholar] [CrossRef]
  28. Cong, M.; Zhang, Z.; Zhao, G.; Dong, X.; Wang, W.; Mu, Z.; Tariq, A.; Graciano, C.; Sardans, J.; Peñuelas, J.; et al. Shrub Afforestation Increases Microbial-Derived Carbon in Arid Regions. Land Degrad. Dev. 2025, 36, 4691–4702. [Google Scholar] [CrossRef]
  29. Gao, Y.; Tian, J.; Pang, Y.; Liu, J. Soil Inorganic Carbon Sequestration Following Afforestation Is Probably Induced by Pedogenic Carbonate Formation in Northwest China. Front. Plant Sci. 2017, 8, 1282. [Google Scholar] [CrossRef]
  30. Lai, Z.; Jin, A.; Feng, W.; She, W.; Lang, T.; Liu, Z. Comparative Carbon Allocation and Soil Carbon Storage in Three Revegetated Shrublands in the Mu Us Desert. Forests 2025, 16, 586. [Google Scholar] [CrossRef]
  31. Jones, D.; Willett, V. Experimental evaluation of methods to quantify dissolved organic nitrogen (DON) and dissolved organic carbon (DOC) in soil. Soil Biol. Biochem. 2006, 38, 991–999. [Google Scholar] [CrossRef]
  32. Cotrufo, M.F.; Ranalli, M.G.; Haddix, M.L.; Six, J.; Lugato, E. Soil carbon storage informed by particulate and mineral-associated organic matter. Nat. Geosci. 2019, 12, 989–994. [Google Scholar] [CrossRef]
  33. Leavitt, S.W.; Follett, R.F.; Paul, E.A. Estimation of the slow and fast cycling soil organic carbon fractions from 6 N HCl hydrolysis. Radiocarbon 1996, 38, 230–231. [Google Scholar] [CrossRef]
  34. Jiang, X.; Xu, D.; Rong, J.; Ai, X.; Ai, S.; Su, X.; Sheng, M.; Yang, S.; Zhang, J.; Ai, Y. Landslide and aspect effects on artificial soil organic carbon fractions and the carbon pool management index on road-cut slopes in an alpine region. Catena 2021, 199, 105094. [Google Scholar] [CrossRef]
  35. Shannon, C.E. A Mathematical Theory of Communication. Bell Syst. Tech. J. 1948, 27, 623–656. [Google Scholar] [CrossRef]
  36. Simpson, E.H. Measurement of Diversity. Nature 1949, 163, 688. [Google Scholar] [CrossRef]
  37. Pielou, E.C. Species-diversity and pattern-diversity in the study of ecological succession. J. Theor. Biol. 1966, 10, 370–383. [Google Scholar] [CrossRef]
  38. Bayala, J.; Sanou, J.; Bazié, H.R.; Coe, R.; Kalinganire, A.; Sinclair, F.L. Regenerated trees in farmers’ fields increase soil carbon across the Sahel. Agroforest. Syst. 2020, 94, 401–415. [Google Scholar] [CrossRef]
  39. Petrie, M.D.; Collins, S.L.; Swann, A.M.; Ford, P.L.; Litvak, M.E. Grassland to shrubland state transitions enhance carbon sequestration in the northern Chihuahuan Desert. Glob. Change Biol. 2015, 21, 1226–1235. [Google Scholar] [CrossRef]
  40. Jia, X.X.; Wang, X.; Hou, L.C.; Wei, X.R.; Zhang, Y.; Shao, M.A.; Zhao, X.N. Variable response of inorganic carbon and consistent increase of organic carbon as a consequence of afforestation in areas with semiarid soils. Land Degrad. Dev. 2019, 30, 1345–1356. [Google Scholar] [CrossRef]
  41. Gao, Y.; Dang, P.; Zhao, Q.; Liu, J.; Liu, J. Effects of vegetation rehabilitation on soil organic and inorganic carbon stocks in the Mu Us Desert, northwest China. Land Degrad. Dev. 2017, 29, 1031–1040. [Google Scholar] [CrossRef]
  42. Huang, Y.Z.; Gao, G.Y.; Ran, L.S.; Wang, Y.; Fu, B.J. Afforestation Reduces Deep Soil Carbon Sequestration in Semiarid Regions: Lessons from Variations of Soil Water and Carbon Along Afforestation Stages in China’s Loess Plateau. J. Geophys. Res. Biogeosci. 2024, 129, e2024JG008287. [Google Scholar] [CrossRef]
  43. Glaser, P.H.; Hansen, B.C.S.; Donovan, J.J.; Givnish, T.J.; Stricker, C.A.; Volin, J.C. Holocene dynamics of the Florida Everglades with respect to climate, dustfall, and tropical storms. Proc. Natl. Acad. Sci. USA 2013, 110, 17211–17216. [Google Scholar] [CrossRef]
  44. Huber, D.P.; Lohse, K.A.; Commendador, A.; Joy, S.; Aho, K.; Finney, B.; Germino, M.J. Vegetation and precipitation shifts interact to alter organic and inorganic carbon storage in cold desert soils. Ecosphere 2019, 10, e02655. [Google Scholar] [CrossRef]
  45. McAbee, K.; Reinhardt, K.; Germino, M.J.; Bosworth, A. Response of aboveground carbon balance to long-term, experimental enhancements in precipitation seasonality is contingent on plant community type in cold-desert rangelands. Oecologia 2017, 183, 861–874. [Google Scholar] [CrossRef] [PubMed]
  46. Cable, J.M.; Ogle, K.; Barron-Gafford, G.A.; Bentley, L.P.; Cable, W.L.; Scott, R.L.; Williams, D.G.; Huxman, T.E. Antecedent Conditions Influence Soil Respiration Differences in Shrub and Grass Patches. Ecosystems 2013, 16, 1230–1247. [Google Scholar] [CrossRef]
  47. Schlesinger, W.H.; Raikes, J.A.; Hartley, A.E.; Cross, A.F. On the Spatial Pattern of Soil Nutrients in Desert Ecosystems. Ecology 1996, 77, 364–374. [Google Scholar] [CrossRef]
  48. Clark, R.B.; Zeto, S.K. Mineral acquisition by arbuscular mycorrhizal plants. J. Plant Nutr. 2000, 23, 867–902. [Google Scholar] [CrossRef]
  49. Zhao, G.; Zhang, Z.; Tariq, A.; Sabit, R.; Sardans, J.; Graciano, C.; Li, X.; Zhu, Y.; Peñuelas, J.; Al-Bakre, D.A.; et al. Grazing exclusion significantly reduced soil organic carbon stocks but enhanced soil inorganic carbon stocks in desert steppe of northwest China. Ecol. Indic. 2025, 172, 113341. [Google Scholar] [CrossRef]
  50. Guan, Q.Y.; Sun, X.Z.; Yang, J.; Pan, B.T.; Zhao, S.L.; Wang, L. Dust Storms in Northern China: Long-Term Spatiotemporal Characteristics and Climate Controls. J. Clim. 2017, 30, 6683–6700. [Google Scholar] [CrossRef]
  51. Dong, L.; Ran, J.; Luo, J.; Bai, L.; Sun, Y.; Aqeel, M.; Zhang, Y.; Wang, X.; Du, Q.; Xiong, J. Inorganic Carbon Pools and Their Drivers in Grassland and Desert Soils. Glob. Change Biol. 2024, 30, e17536. [Google Scholar] [CrossRef]
  52. Li, X.R.; Ma, F.Y.; Xiao, H.L.; Wang, X.P.; Kim, K.C. Long-term effects of revegetation on soil water content of sand dunes in arid region of Northern China. J. Arid Environ. 2004, 57, 1–16. [Google Scholar] [CrossRef]
  53. Qu, Y.; Tang, J.; Liu, B.; Lyu, H.; Duan, Y.; Yang, Y.; Wang, S.; Li, Z. Rhizosphere enzyme activities and microorganisms drive the transformation of organic and inorganic carbon in saline–alkali soil region. Sci. Rep. 2022, 12, 1314. [Google Scholar] [CrossRef]
  54. Liu, Z.; Sun, Y.; Zhang, Y.; Feng, W.; Lai, Z.; Qin, S. Soil Microbes Transform Inorganic Carbon Into Organic Carbon by Dark Fixation Pathways in Desert Soil. J. Geophys. Res. Biogeosci. 2021, 126, e2020JG006047. [Google Scholar] [CrossRef]
  55. Zhu, X.L.; Si, J.H.; He, X.H.; Jia, B.; Zhou, D.M.; Wang, C.L.; Qin, J.; Liu, Z.J.; Ndayambaza, B.; Bai, X.; et al. The distribution and driving mechanism of soil inorganic carbon in semi-arid and arid areas: A case study of Alxa region in China. Catena 2024, 247, 108475. [Google Scholar] [CrossRef]
  56. Zhang, F.; Wang, X.J.; Guo, T.W.; Zhang, P.L.; Wang, J.P. Soil organic and inorganic carbon in the loess profiles of Lanzhou area: Implications of deep soils. Catena 2015, 126, 68–74. [Google Scholar] [CrossRef]
  57. Tamir, G.; Shenker, M.; Heller, H.; Bloom, P.R.; Fine, P.; Bar-Tal, A. Dissolution and Re-crystallization Processes of Active Calcium Carbonate in Soil Developed on Tufa. Soil Sci. Soc. Am. J. 2012, 76, 1606–1613. [Google Scholar] [CrossRef]
  58. Bughio, M.A.; Wang, P.L.; Meng, F.Q.; Qing, C.; Kuzyakov, Y.; Wang, X.J.; Junejo, S.A. Neoformation of pedogenic carbonates by irrigation and fertilization and their contribution to carbon sequestration in soil. Geoderma 2016, 262, 12–19. [Google Scholar] [CrossRef]
  59. Han, J.; Pan, C.; Sun, Y.; Chen, Z.; Xiong, Y.; Huang, G. Impact of Land Use Conversion on Soil Structure and Hydropedological Functions in an Arid Region. Land Degrad. Dev. 2025, 36, 643–654. [Google Scholar] [CrossRef]
  60. Chadwick, O.A.; Sowers, J.M.; Amundson, R.G. Morphology of Calcite Crystals in Clast Coatings From Four Soils in the Mojave Desert Region. Soil Sci. Soc. Am. J. 1989, 53, 211. [Google Scholar] [CrossRef]
  61. Zamanian, K.; Pustovoytov, K.; Kuzyakov, Y. Pedogenic carbonates: Forms and formation processes. Earth-Sci. Rev. 2016, 157, 1–17. [Google Scholar] [CrossRef]
  62. Singh, H.; Mishra, D.; Nahar, N.M. Energy use pattern in production agriculture of a typical village in arid zone, India––Part I. Energy Convers. Manag. 2002, 43, 2275–2286. [Google Scholar] [CrossRef]
  63. Raheb, A.; Heidari, A.; Mahmoodi, S. Organic and inorganic carbon storage in soils along an arid to dry sub-humid climosequence in northwest of Iran. Catena 2017, 153, 66–74. [Google Scholar] [CrossRef]
  64. Liu, Y.; Dang, Z.Q.; Tian, F.P.; Wang, D.; Wu, G.L. Soil Organic Carbon and Inorganic Carbon Accumulation Along a 30-year Grassland Restoration Chronosequence in Semi-arid Regions (China). Land Degrad. Dev. 2016, 28, 189–198. [Google Scholar] [CrossRef]
  65. Ferdush, J.; Paul, V. A review on the possible factors influencing soil inorganic carbon under elevated CO2. Catena 2021, 204, 105434. [Google Scholar] [CrossRef]
  66. Liu, S.S.; Zhou, L.H.; Li, H.; Zhao, X.; Yang, Y.H.; Zhu, Y.K.; Hu, H.F.; Chen, L.Y.; Zhang, P.J.; Shen, H.H.; et al. Shrub encroachment decreases soil inorganic carbon stocks in Mongolian grasslands. J. Ecol. 2020, 108, 678–686. [Google Scholar] [CrossRef]
  67. He, X.X.; Sheng, M.Y.; Wang, L.J.; Zhang, S.L.; Luo, N.N. Effects on soil organic carbon accumulation and mineralization of long-term vegetation restoration in Southwest China karst. Ecol. Indic. 2022, 145, 109622. [Google Scholar] [CrossRef]
  68. Kleber, M.; Bourg, I.C.; Coward, E.K.; Hansel, C.M.; Myneni, S.C.B.; Nunan, N. Dynamic interactions at the mineral-organic matter interface. Nat. Rev. Earth Environ. 2021, 2, 402–421. [Google Scholar] [CrossRef]
  69. An, S.S.; Mentler, A.; Mayer, H.; Blum, W.E.H. Soil aggregation, aggregate stability, organic carbon and nitrogen in different soil aggregate fractions under forest and shrub vegetation on the Loess Plateau, China. Catena 2010, 81, 226–233. [Google Scholar] [CrossRef]
  70. Benbi, D.K.; Brar, K.; Toor, A.S.; Sharma, S. Sensitivity of Labile Soil Organic Carbon Pools to Long-Term Fertilizer, Straw and Manure Management in Rice-Wheat System. Pedosphere 2015, 25, 534–545. [Google Scholar] [CrossRef]
  71. Zhou, Z.H.; Ren, C.J.; Wang, C.K.; Delgado-Baquerizo, M.; Luo, Y.Q.; Luo, Z.K.; Du, Z.G.; Zhu, B.; Yang, Y.H.; Jiao, S.; et al. Global turnover of soil mineral-associated and particulate organic carbon. Nat. Commun. 2024, 15, 5329. [Google Scholar] [CrossRef] [PubMed]
  72. Qi, P.; Chen, J.; Wang, X.J.; Zhang, R.Z.; Cai, L.Q.; Jiao, Y.P.; Li, Z.Q.; Han, G.J. Changes in soil particulate and mineral-associated organic carbon concentrations under nitrogen addition in China-a meta-analysis. Plant Soil 2023, 489, 439–452. [Google Scholar] [CrossRef]
  73. Chen, J.G.; Ji, C.J.; Fang, J.Y.; He, H.B.; Zhu, B. Dynamics of microbial residues control the responses of mineral-associated soil organic carbon to N addition in two temperate forests. Sci. Total Environ. 2020, 748, 141318. [Google Scholar] [CrossRef]
  74. Wang, B.R.; An, S.S.; Liang, C.; Liu, Y.; Kuzyakov, Y. Microbial necromass as the source of soil organic carbon in global ecosystems. Soil Biol. Biochem. 2021, 162, 108422. [Google Scholar] [CrossRef]
  75. Liang, C.; Schimel, J.P.; Jastrow, J.D. The importance of anabolism in microbial control over soil carbon storage. Nat. Microbiol. 2017, 2, 17105. [Google Scholar] [CrossRef]
  76. Batool, M.; Cihacek, L.J.; Alghamdi, R.S. Soil Inorganic Carbon Formation and the Sequestration of Secondary Carbonates in Global Carbon Pools: A Review. Soil Syst. 2024, 8, 15. [Google Scholar] [CrossRef]
  77. Granse, D.; Wanner, A.; Stock, M.; Jensen, K.; Mueller, P. Plant-sediment interactions decouple inorganic from organic carbon stock development in salt marsh soils. Limnol. Oceanogr. Lett. 2024, 9, 469–477. [Google Scholar] [CrossRef]
  78. Zang, H.; Mehmood, I.; Kuzyakov, Y.; Jia, R.; Gui, H.; Blagodatskaya, E.; Xu, X.; Smith, P.; Chen, H.; Zeng, Z.; et al. Not all soil carbon is created equal: Labile and stable pools under nitrogen input. Glob. Change Biol. 2024, 30, e17405. [Google Scholar] [CrossRef]
  79. Mori, T.; Lu, X.K.; Aoyagi, R.; Mo, J.M. Reconsidering the phosphorus limitation of soil microbial activity in tropical forests. Funct. Ecol. 2018, 32, 1145–1154. [Google Scholar] [CrossRef]
  80. Tang, Y.Q.; Zhang, X.Y.; Wang, H.M.; Meng, S.W.; Yang, F.T.; Chen, F.S.; Wang, S.Q.; Dong, Q.X.; Wang, J. Warming causes variability in SOM decomposition in N- and P-fertiliser-treated soil in a subtropical coniferous forest. Eur. J. Soil Sci. 2022, 73, e13320. [Google Scholar] [CrossRef]
  81. Wu, B.; Bai, T.S.; Yu, W.J.; Zhu, T.B.; Li, D.M.; Ye, C.L.; Liu, M.Q.; Hu, S.J. Soil pH and precipitation controls on organic carbon retention from organic amendments across soil orders: A meta-analysis. Soil Biol. Biochem. 2025, 207, 109819. [Google Scholar] [CrossRef]
  82. Peng, F.; Xue, X.; You, Q.G.; Huang, C.H.; Dong, S.Y.; Liao, J.; Duan, H.C.; Tsunekawa, A.; Wang, T. Changes of soil properties regulate the soil organic carbon loss with grassland degradation on the Qinghai-Tibet Plateau. Ecol. Indic. 2018, 93, 572–580. [Google Scholar] [CrossRef]
  83. Hao, Y.; Mao, J.; Bachmann, C.M.; Hoffman, F.M.; Koren, G.; Chen, H.; Tian, H.; Liu, J.; Tao, J.; Tang, J.; et al. Soil moisture controls over carbon sequestration and greenhouse gas emissions: A review. NPJ Clim. Atmos. Sci. 2025, 8, 16. [Google Scholar] [CrossRef]
  84. Setia, R.; Gottschalk, P.; Smith, P.; Marschner, P.; Baldock, J.; Setia, D.; Smith, J. Soil salinity decreases global soil organic carbon stocks. Sci. Total Environ. 2013, 465, 267–272. [Google Scholar] [CrossRef]
  85. Li, Y.; Li, W.J.; Jiang, L.M.; Li, E.; Yang, X.D.; Yang, J.J. Salinity affects microbial function genes related to nutrient cycling in arid regions. Front. Microbiol. 2024, 15, 1407760. [Google Scholar] [CrossRef] [PubMed]
  86. Guo, Y.; Wang, X.J.; Li, X.L.; Wang, J.P.; Xu, M.G.; Li, D.W. Dynamics of soil organic and inorganic carbon in the cropland of upper Yellow River Delta, China. Sci. Rep. 2016, 6, 36105. [Google Scholar] [CrossRef] [PubMed]
  87. Yang, X.; Zhang, Z.; Guan, Q.; Zhang, E.; Sun, Y.; Yan, Y.; Du, Q. Coupling mechanism between vegetation and multi-depth soil moisture in arid–semiarid area: Shift of dominant role from vegetation to soil moisture. For. Ecol. Manag. 2023, 546, 121323. [Google Scholar] [CrossRef]
  88. Wang, Z.Y.; Xie, J.B.; Wang, Y.G.; Li, Y. Biotic and Abiotic Contribution to Diurnal Soil CO2 Fluxes from Saline/Alkaline Soils. Sci. Rep. 2020, 10, 5396. [Google Scholar] [CrossRef]
Figure 1. Study region and sampling plots.
Forests 16 01499 g001
Figure 2. Changes in TC, SOC, and SIC contents (0–100 cm) across Corethrodendron scoparium (Fisch. & C. A. Mey.) Fisch. & Basiner. plantations of different restoration ages. Note: Figure (a) represents TC content, Figure (b) represents SOC content, Figure (c) represents SIC content. Colors represent soil layers, with the same color indicating the same layer. From left to right, the samples are shown in sequence: the CK, C. scoparium plantations of different ages, and the average values across six soil depths (0–100 cm). Different uppercase letters denote significant differences among soil depths within the same plantation type (p < 0.05), and different lowercase letters denote significant differences among plantation types within the same soil depth (p < 0.05). The same annotation rules apply to subsequent figures.
Forests 16 01499 g002
Figure 3. Vertical and temporal variation in SOC component contents. Note: Figure (a) represents DOC content, Figure (b) represents EOC content, Figure (c) represents POC content, Figure (d) represents LFOC content, Figure (e) represents IOC content, Figure (f) represents MAOC content, and Figure (g) represents HFOC content.
Forests 16 01499 g003aForests 16 01499 g003bForests 16 01499 g003c
Figure 4. Shifts in the proportional contribution of organic carbon fractions to total SOC. Note: Figure (a) shows the proportion of DOC in SOC, Figure (b) shows the proportion of EOC in SOC, Figure (c) shows the proportion of IOC in SOC, Figure (d) shows the proportion of POC and MAOC in SOC, and Figure (e) shows the proportion of HFOC and LFOC in SOC.
Forests 16 01499 g004aForests 16 01499 g004b
Figure 5. Analysis of factors influencing soil carbon fractions. Notes: SIC; SOC; DOC; EOC; POC; IOC; MAOC; LFOC; HFOC; CPMI; NH4+-N; NO3-N; AP; AK; SK. The same abbreviations apply hereafter. (a) Correlation matrix showing relationships among soil carbon fractions, vegetation restoration characteristics, and soil physicochemical properties. Red and blue denote positive and negative correlations, respectively; darker shades indicate stronger relationships. Asterisks denote significance: ** p < 0.01. (b) RDA biplot illustrating associations among soil carbon fractions (black vectors), vegetation restoration characteristics, and soil physicochemical properties (red vectors) in the 0–100 cm soil profile. (c) PLS-SEM depicting the regulation of soil carbon fractions by vegetation characteristics and soil physicochemical properties. GoF, model goodness-of-fit. Red and blue arrows indicate positive and negative effects, respectively; arrow values are standardized path coefficients. Solid lines represent statistically significant paths, while dashed lines denote nonsignificant paths. CCVR, community vegetation restoration characteristics (VC, VB, DI, J); SPC, soil physicochemical properties (TN, TP, TK, AN, NH4+-N, NO3-N, AP, AK, SK, EC, pH, BD, SWV, C/N); ROC-C, reactive organic carbon fractions (DOC, EOC, POC, LFOC); SOC-F, stabilized organic carbon fractions (IOC, MAOC, HFOC).
Forests 16 01499 g005aForests 16 01499 g005b
Table 1. Basic characteristics of sample plots of artificial Corethrodendron scoparium (Fisch. & C. A. Mey.) Fisch. & Basiner. sand-fixing vegetation.
TypeCK5 Year10 Year30 Year40 Year
Number of species36141111
Dominant speciesC. squarrosumC. scoparium
A. ordosica
C. scoparium
A. ordosica
A. ordosicaA. ordosica
C. alaschanica
Community companion plantsP. villosaC. squarrosum
P. villosa etc.
S. glareosa
C. alaschanica
E. gmelinii etc.
A. scoparia
E. gmelinii
Suaeda glauca Bunge. etc.
S. glareosa
A. melilotoides
A. hispidus etc.
Table 2. Restoration characteristics of C. scoparium sand-fixing vegetation and variations in average physicochemical properties of the 0–100 cm soil depth.
IndicatorsCKYears
5 Year10 Year30 Year40 Year
TN (g·kg−1)0.08 ± 0.01 c0.09 ± 0.01 c0.13 ± 0.01 b0.17 ± 0.02 ab0.19 ± 0.02 a
TP (g·kg−1)0.24 ± 0.01 c0.24 ± 0.01 c0.25 ± 0.01 c0.50 ± 0.05 a0.34 ± 0.02 b
TK (g·kg−1)15.48 ± 0.09 b14.77 ± 0.07 c15.73 ± 0.11 b15.71 ± 0.15 b16.64 ± 0.12 a
NH4+-N (mg·kg−1)0.63 ± 0.09 c0.75 ± 0.05 c0.97 ± 0.1 bc1.37 ± 0.27 ab1.61 ± 0.34 a
NO3-N (mg·kg−1)1.66 ± 0.24 c1.71 ± 0.06 bc2.18 ± 0.15 bc2.4 ± 0.34 b3.73 ± 0.3 a
AN (mg·kg−1)7.89 ± 0.44 d7.79 ± 0.37 d10 ± 0.52 c12.35 ± 0.86 b14.59 ± 0.68 a
AP (mg·kg−1)0.75 ± 0.13 b0.68 ± 0.07 b1.22 ± 0.16 ab1.3 ± 0.28 ab1.67 ± 0.31 a
AK (mg·kg−1)77.17 ± 3.85 ab72.94 ± 1.37 b72.44 ± 2.9 b72.06 ± 4.61 b85.44 ± 3.63 a
SK (mg·kg−1)142.46 ± 3.36 b209.28 ± 8.22 a212.97 ± 5.71 a215.86 ± 5.65 a218.86 ± 9.25 a
SWV (%)3.01 ± 0.28 a1.10 ± 0.06 c2.55 ± 0.31 ab0.81 ± 0.10 c2.12 ± 0.23 b
pH8.89 ± 0.01 a8.72 ± 0.03 b8.67 ± 0.01 c8.36 ± 0.01 e8.42 ± 0.02 d
BD (g·cm−3)1.62 ± 0.02 a1.55 ± 0.01 b1.49 ± 0.01 c1.4 ± 0.01 d1.38 ± 0.01 d
EC (μS/cm)61.07 ± 1.70 b64.88 ± 0.72 b75.59 ± 1.39 b166.22 ± 20.5 a148.99 ± 11.61 a
C/N32.57 ± 1.45 a35.53 ± 3.76 a33.36 ± 3.49 a28.89 ± 2.40 a28.55 ± 2.17 a
Shrub cover (%)0.00 ± 0.00 c24.09 ± 0.88 a19.74 ± 1.49 b17.72 ± 1.15 b11.19 ± 0.65 c
Herb cover (%)2.44 ± 0.69 d3.03 ± 0.44 d9.65 ± 1.08 c12.92 ± 1.59 b45.61 ± 0.44 a
VC (%)2.44 ± 0.69 c27.13 ± 0.80 b29.39 ± 2.03 b30.64 ± 0.84 b56.8 ± 0.47 a
H0.29 ± 0.15 c1.09 ± 0.04 b1.59 ± 0.13 a1.04 ± 0.26 b0.24 ± 0.06 c
D0.21 ± 0.12 b0.54 ± 0.03 a0.75 ± 0.03 a0.5 ± 0.13 a0.09 ± 0.03 b
J0.40 ± 0.20 b0.61 ± 0.02 ab0.78 ± 0.03 a0.55 ± 0.14 ab0.14 ± 0.04 c
DI0.48 ± 0.02 b0.46 ± 0.03 b0.25 ± 0.03 c0.5 ± 0.13 b0.91 ± 0.03 a
herbaceous biomass/(g·m−2)10.95 ± 1.31 d166.03 ± 22.69 c214.99 ± 19.37 bc271.04 ± 11.42 ab304.25 ± 37.77 a
shrub biomass/(g·m−2)0.00 ± 0.00 c460.21 ± 4.25 a548.6 ± 41.74 a571.43 ± 102.92 a228.97 ± 53.89 b
VB/(g/·m−2)10.95 ± 1.31 c626.23 ± 18.57 b763.58 ± 60.21 a842.47 ± 42.93 a533.22 ± 59.92 b
Notes: TN, TP, TK, SWV (soil water content), pH (acidity/alkalinity), BD, EC, C/N (soil organic carbon/total nitrogen), VC, VB, H (Shannon–Wiener diversity index), D (Simpson diversity index), J (Pielou’s evenness index), DI (Community ecological dominance index) The same applies below. (Different lowercase letters indicate statistically significant differences between groups (p < 0.05)).
Table 3. Variation in average CPMI in the 0–100 cm soil depth across C. scoparium restoration chronosequences.
IndicatorsCKYears
5 Year10 Year30 Year40 Year
SC0.52 ± 0.02 c0.61 ± 0.04 c0.84 ± 0.06 b1.08 ± 0.06 a1.18 ± 0.09 a
A0.03 ± 0 a0.03 ± 0 a0.03 ± 0 a0.03 ± 0 a0.03 ± 0 a
AL1 ± 0 a1.03 ± 0.07 a1.01 ± 0.05 a1 ± 0.04 a1.02 ± 0.04 a
CPI1 ± 0 d1.18 ± 0.08 cd1.64 ± 0.14 bc2.11 ± 0.16 ab2.33 ± 0.22 a
CPMI100 ± 0 d119.44 ± 9.59 cd165.01 ± 16.67 bc207.89 ± 14.98 ab239.86 ± 26.43 a
Note: Values represent the mean of six soil depths from 0 to 100 cm. Different lowercase letters indicate significant differences among different forest age (p < 0.05).
Table 4. Ranking of the explanatory power of vegetation characteristics and soil physicochemical properties on soil carbon fractions based on variance partitioning analysis.
Impact FactorsExplains (%)Contribution (%)Pseudo-Fp
TN57.770.40120.000.01
BD9.6011.7025.600.01
VC1.902.305.200.01
EC2.302.806.800.01
C/N2.302.807.300.01
AP1.702.105.800.01
AN0.801.002.700.03
NH4+-N0.600.802.20.07
pH0.400.501.400.18
TP0.400.501.400.22
TK0.400.501.600.14
SWV0.300.401.200.26
VB0.400.401.300.21
SK0.500.601.900.13
AK0.400.501.600.16
NO3-N0.300.301.000.35
H0.300.401.200.28
D0.800.902.800.04
DI0.300.401.300.21
J0.400.501.700.14
Disclaimer/Publisher’s Note: The statements, opinions and data contained in all publications are solely those of the individual author(s) and contributor(s) and not of MDPI and/or the editor(s). MDPI and/or the editor(s) disclaim responsibility for any injury to people or property resulting from any ideas, methods, instructions or products referred to in the content.