Article

Nutrient Variables Associated with Tapping Panel Dryness and Necrosis Syndromes in Rubber Tree Clones RRIM600 and RRIT251

by
Sujittra Sriubon
1,
Anan Wongcharoen
2,
Somyot Meetha
1 and
Supat Isarangkool Na Ayutthaya
1,*
1
Department of Horticulture, Faculty of Agriculture, Khon Kaen University, Khon Kaen 40002, Thailand
2
Department of Entomology and Plant Pathology, Faculty of Agriculture, Khon Kaen University, Khon Kaen 40002, Thailand
*
Author to whom correspondence should be addressed.
Forests 2025, 16(9), 1477; https://doi.org/10.3390/f16091477
Submission received: 7 August 2025 / Revised: 8 September 2025 / Accepted: 15 September 2025 / Published: 17 September 2025
(This article belongs to the Section Forest Health)

Abstract

Tapping panel dryness (TPD) and tapping panel necrosis (TPN) are syndromes that reduce the yield of rubber trees. Their causes are associated with factors such as clone type, tapping system, and environmental stress and are potentially linked to nutrient deficiencies. This study aimed to investigate the causes of these disorders, with particular focus on their relationship with nutrient fluctuations in plant tissues. The experiment was conducted at rubber plantations owned by local farmers in Pakkhat District, Bueng Kan Province, Thailand, where soil fertility is generally poor. The plantations were 14–16 years old and had been tapped for 7–9 years. Two rubber tree clones (RRIM600 and RRIT251) were used to evaluate three different tree types: healthy, TPD-affected, and TPN-affected. For each clone, five plantations were sampled. The measurements included the incidence of abnormalities; trunk girth; yield; and nutrient concentrations in the soil, top shoot, bark, and latex. The nutrient analysis focused on nitrogen (N), phosphorus (P), potassium (K), calcium (Ca), and boron (B). The results showed that the incidence of abnormalities (both TPD and TPN) was higher in clone RRIT251 than in RRIM600. Yield was reduced in trees affected by TPD and was dramatically reduced in those affected by TPN. In RRIT251 trees affected by TPD, the lowest concentrations of K, Ca, and B were found in the bark, along with the lowest Ca concentration in the top shoot. These findings indicate that RRIT251 is more susceptible to bark necrosis than RRIM600 and that reductions in K, Ca, and B may be associated with development of the syndromes.

Graphical Abstract

1. Introduction

The rubber tree (Hevea brasiliensis) is native to hot and humid climates and remains the sole economically viable source of natural rubber [1]. Worldwide, rubber plantations cover more than 13 million hectares [2]. Traditionally, rubber cultivation is concentrated in regions receiving more than 1500 mm of annual rainfall, with an optimal average temperature of 28 °C and a dry period of less than four months [3,4]. However, global demand for rubber continues to rise, prompting the expansion of plantations into non-traditional areas such as Cambodia, Laos, and Southern China. In Thailand, for instance, government policies have encouraged the establishment of rubber plantations in the northeastern region, where environmental conditions are often suboptimal [5]. This shift to non-traditional, less favorable climates can adversely impact rubber tree growth and yield, potentially inducing physiological disorders [6,7,8]. Two of the most common stress-related responses under these conditions are tapping panel dryness (TPD) and tapping panel necrosis (TPN), both of which significantly reduce latex productivity and tree health [9,10,11,12,13]. Bark necrosis symptoms are commonly characterized by the cessation of latex production. Although it was initially hypothesized that these disorders might be caused by pathogens, no conclusive evidence has been found to support this theory [14,15].
Tapping panel dryness (TPD), previously known as brown bast, is a major yield-limiting disorder in rubber. It is characterized by the cessation of latex flow from the tapping cut, accompanied by necrosis of the latex-producing tissues within the inner phloem [16,17]. Notably, TPD does not cause visible defoliation or mortality in affected trees [12,15,18]. The onset of TPD or brown bast typically occurs 3–5 years after tapping begins, with an incidence affecting 3–30% of trees in a plantation [12,19]. The occurrence of this disorder is influenced by factors such as tapping practices, clone type, water stress, environmental conditions, and nutrient deficiencies [6,12,20,21,22,23]. Despite significant progress in understanding the disorder since the early 20th century, the exact cause of TPD remains unknown. Consequently, no fully reliable remediation practices have yet been developed to address this condition [17].
Trunk phloem necrosis (TPN), previously referred to as “bark necrosis” [24], is a severe and irreversible disorder primarily characterized by necrosis of the inner phloem cells. The necrotic process typically begins near the collar of the tree and gradually spreads upward, leading to extensive bark dryness. Over time, this condition progresses to severe cracking and peeling of the affected bark, eventually compromising the entire tapping panel. Despite extensive etiological investigations using biomolecular tools, no definitive causal pathogen has been identified for TPN, similar to the unresolved etiology of TPD [12]. The potential causes of TPN are believed to be similar to those of TPD [6,25]. These factors can disrupt normal phloem function and compromise tree health, ultimately contributing to the development of TPN.
Mineral nutrition is a critical factor influencing the growth, yield, and overall health of rubber trees. Proper nutrient management aims to optimize crop yield by ensuring an adequate and balanced supply of essential plant nutrients [26,27]. Effective management is essential for maximizing both growth and latex production while minimizing the risk of TPD and TPN [23]. Nitrogen is critical for overall tree health and latex production [28]. Excessive nitrogen (N) application in rubber trees can lead to an increased risk of TPD and TPN. High nitrogen levels can disrupt the balance of essential nutrients, overstimulate metabolic processes, and weaken the tree’s natural defense mechanisms, ultimately reducing latex yield and long-term productivity [17,23,29]. Phosphorus (P) also plays a vital role in supporting growth and productivity, while potassium (K) is essential for enhancing the viscosity and fluidity of latex, directly influencing yield during tapping [30]. In exploring the relationship between nutrient levels and panel dryness, Ahmad et al. [23] reported that foliar application of 0.5% N and 0.8 mg/L K resulted in a complete (100%) recovery from brown bast syndrome within three weeks of treatment.
Other nutrients that can affect bark symptoms include calcium (Ca) and boron (B). Buakong et al. [13] also reported that the Ca concentration in TPD trees was approximately 1.76 times lower than in healthy trees. Hashyati et al. [31] applied a macro–micronutrient solution to the bark of brown bast-affected trees and found that the treatment increased the K and Ca levels in the bark and could alleviate the brown bast syndrome. Moreover, in the case of bark necrosis in other plants, Nartvaranant et al. [32] demonstrated that applying borax to the soil in mango plantations, to address low boron availability, increased leaf boron concentrations and was associated with a reduction in trunk symptoms. Ma et al. [33] found that elevated nitrogen levels were associated with a higher incidence of bark cracking accompanied by gummosis. In contrast, calcium and boron appeared to have a mitigating effect, as lower concentrations of these nutrients were correlated with a greater occurrence of symptoms. However, no studies have specifically examined nutrient factors in rubber trees exhibiting bark disorders.
In Thailand, the predominant rubber tree clones cultivated are RRIM600 and RRIT251, with RRIM600 accounting for approximately 75–80% of the total rubber plantation area and RRIT251 comprising about 20–25% [34]. Both clones are recognized for their high-yield potential. However, RRIT251, a newer Thai cultivar, has demonstrated latex yields approximately 1.5 times greater than RRIM600. In contrast, RRIM600 is valued for its moderate resistance to environmental stressors and common rubber diseases [35]. Also, bark necrosis is associated with clonal susceptibility [36]. Therefore, the present study aimed to investigate the influence of nutrient variation on the occurrence of TPD and TPN syndromes, in comparison with healthy trees of both RRIM600 and RRIT251 clones.

2. Materials and Methods

2.1. Experimental Site

The study was conducted at rubber plantations of local farmers, aged 14–16 years, located in Pakkhat District, Bueng Kan Province, Thailand, during the active tapping season from May to November 2020. The annual rainfall in this area is around 2500 mm, and the temperature ranges from 17 °C to 43 °C. These plantations had been under tapping for 7–9 years. The experiment was conducted using a randomized complete block design (RCBD). The investigation focused on two widely cultivated rubber tree clones: RRIM600 and RRIT251, with five independent plantations sampled for each clone. Trees were planted at a spacing of 7 × 3 m. Within each plantation, trees were categorized into three distinct health conditions based on visual and physiological symptoms: healthy trees, trees affected by tapping panel dryness (TPD), and trees exhibiting trunk phloem necrosis (TPN).

2.2. Evaluate the TPD and TPN Symptoms

For the evaluation of TPD and TPN, 100 trees per plot were randomly selected from each of the five plots, representing the RRIM600 and RRIT251 rubber clones. TPD was identified by the lack of latex flow from the tapping cut (Figure 1a), while TPN was characterized by both the lack of latex flow and the presence of bark cracking (Figure 1b). The percentage of trees exhibiting these symptoms was then calculated. Additionally, the girth of each sampled tree was measured at a height of 100 cm above ground level.

2.3. Soil Property Analysis

For each tree type, soil samples were collected from four locations positioned 1.5 m from the tree trunk. The samples were then combined into a single composite sample. All soil samples were dried in the laboratory. The samples were analyzed for pH using a 1:2.5 soil-to-distilled water ratio. Organic matter (OM) content was determined following the methods of Walkley and Black [37] and Roper et al. [38], which involve oxidation with a known amount of potassium dichromate (K2Cr2O7). Available phosphorus (P) was analyzed using the Bray II method and measured with a UV-1280 spectrophotometer (Shimadzu, Kyoto, Japan). Potassium (K) and calcium (Ca) were extracted using 1 M ammonium acetate (NH4OAc) at pH 7.0 and quantified with a PFP7 flame photometer (Jenway, Staffordshire, UK). Extractable boron (B) was determined using hot water extraction, followed by colorimetric analysis with the Azomethine-H method [39].
Figure 1. Bark necrosis symptoms in rubber trees: (a) tapping panel dryness (TPD), characterized by the cessation of latex flow, and (b) trunk phloem necrosis (TPN), marked by bark cracking, peeling, and severe latex flow cessation.
Forests 16 01477 g001

2.4. Plant Sampling and Analysis

Leaves, top shoots, and bark were analyzed for their nitrogen (N), phosphorus (P), potassium (K), calcium (Ca), and boron (B) content. Four top shoots were collected from each sampled tree and pooled to represent a single composite sample per tree for nutrient analysis. Leaf samples were taken from the 4–6th leaf positions of the top shoots. Four bark samples per tree were collected from the trunk at 3 m above the ground. Bark sampling was conducted on areas of normal, unwounded bark across all three types. All plant samples were collected in June 2020. Then, the samples were dried in a hot-air oven at 60–70 °C and then ground using a mechanical grinder. Wet digestion was employed to analyze N, P, K, and Ca following the method described by Mills and Jones [40]. Nitrogen and phosphorus concentrations were determined colorimetrically using a spectrophotometer according to Mills and Jones [40] and Kayaphad et al. [41]. Potassium and calcium were measured using a flame photometer. Boron in plant tissue was determined using the dry ashing method, with samples incinerated at 530 °C in a muffle furnace, followed by colorimetric detection using the Azomethine-H method [42].

2.5. Yield, Yield Property, and Nutrient Concentration

The latex yield was collected by tapping in November 2020 from five sampled trees of each tree type. Then, 20 mL of latex from each tree type were collected in Petri dishes, and 2 mL of formic acid were added to induce coagulation. The fresh weight of each sample was recorded. The coagulated latex samples were then dried in a hot-air oven at 65 °C, after which the dry weight was recorded. The total solid content (TSC) was calculated using Formula (1). All dried samples were analyzed for nutrient concentrations using the same methods as those applied in the plant nutrient analysis.
%TSC = (Dry weight)/(Fresh weight) × 100

2.6. Data Analysis

Data were analyzed using a one-way analysis of variance (ANOVA) and regression analysis by IBM SPSS statistical analysis software, version 29. Post hoc comparisons of means were performed using Duncan’s Multiple Range Test.

3. Results

3.1. Expression of TPD and TPN Symptoms

The survey of TPD and TPN symptoms in five plantations of the RRIM600 and RRIT251 clones showed that RRIT251 had a higher incidence of TPN than RRIM600 (Figure 2). Moreover, the combined incidence of TPD and TPN was significantly greater in RRIT251 (p < 0.05), indicating that this clone has lower resistance to these disorders than RRIM600. After 7–9 years of tapping, the incidence of abnormalities was 14.2% in RRIT251 compared to 8.0% in RRIM600.

3.2. Soil Properties

Soil samples collected from three tree types: healthy, TPD, and TPN at both the RRIM600 and RRIT251 plantations (Table 1) indicated that the soils were strongly acidic, with pH values ranging from 3.63 to 3.95. OM content was also low, at less than 1.4%. In both clones, the concentrations of P, K, Ca, and B were consistently higher in the topsoil than in the subsoil. However, soil pH, P, and K did not differ significantly among the different tree types.

3.3. Growth and Yields

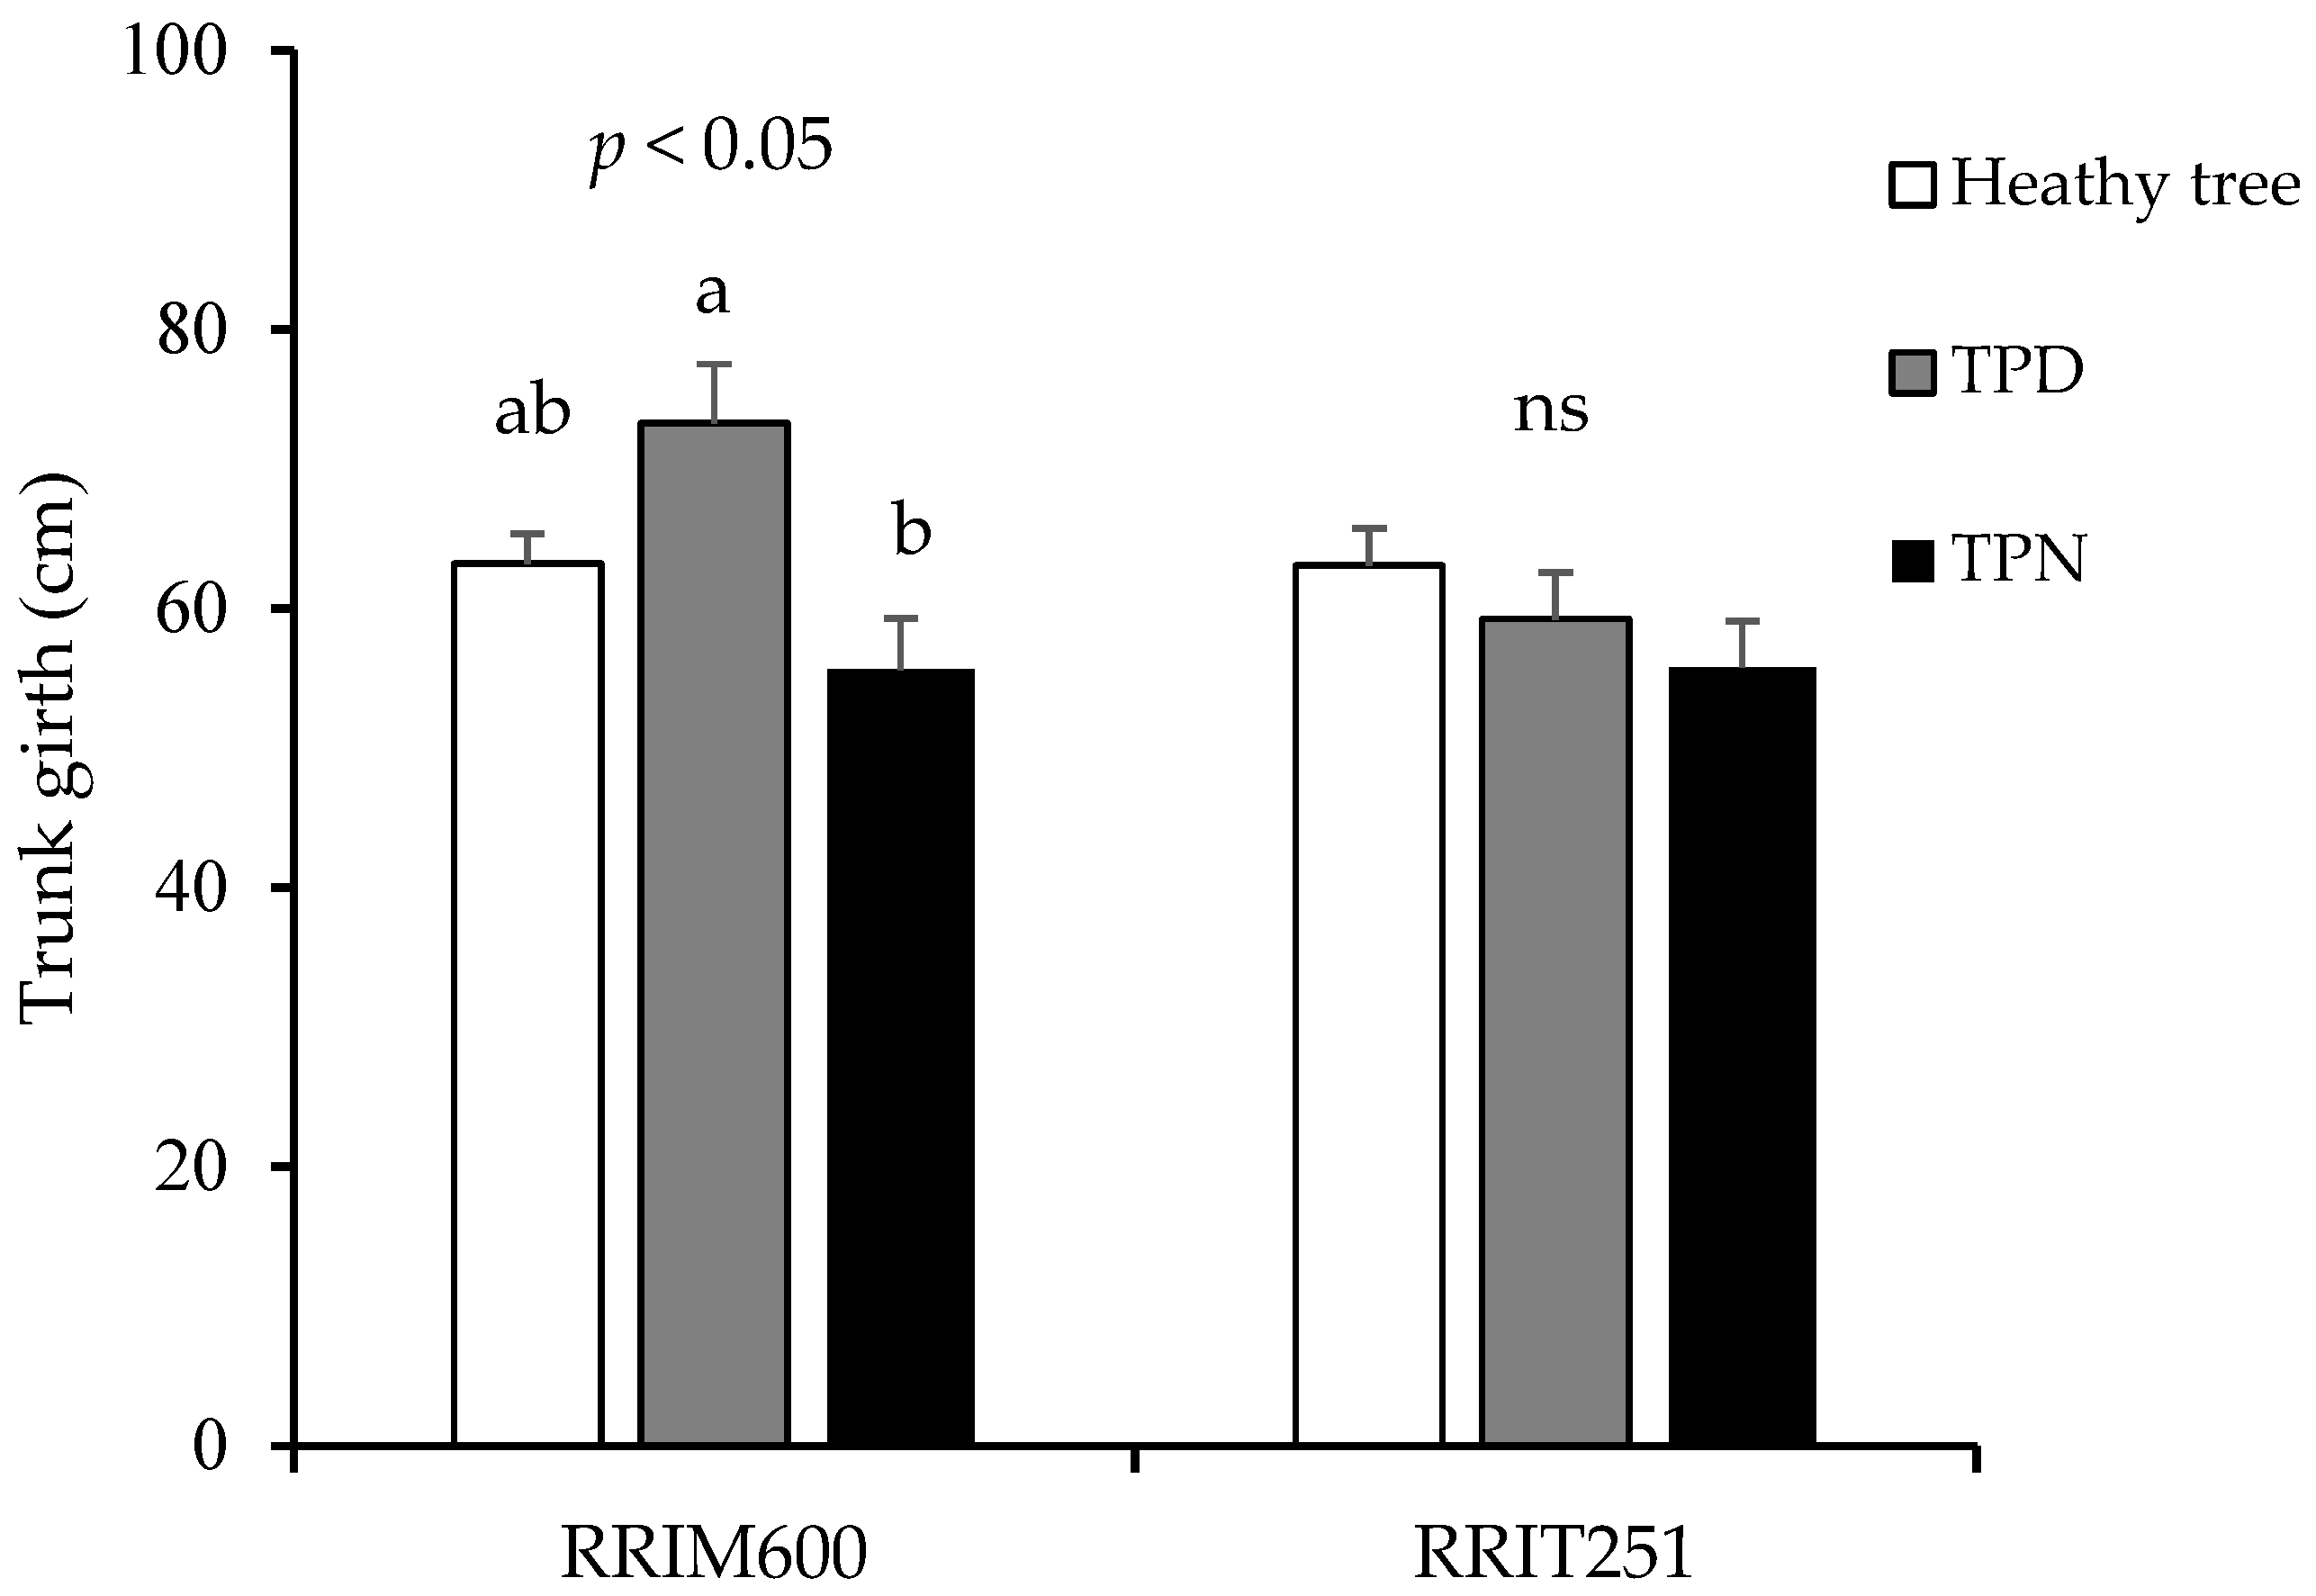
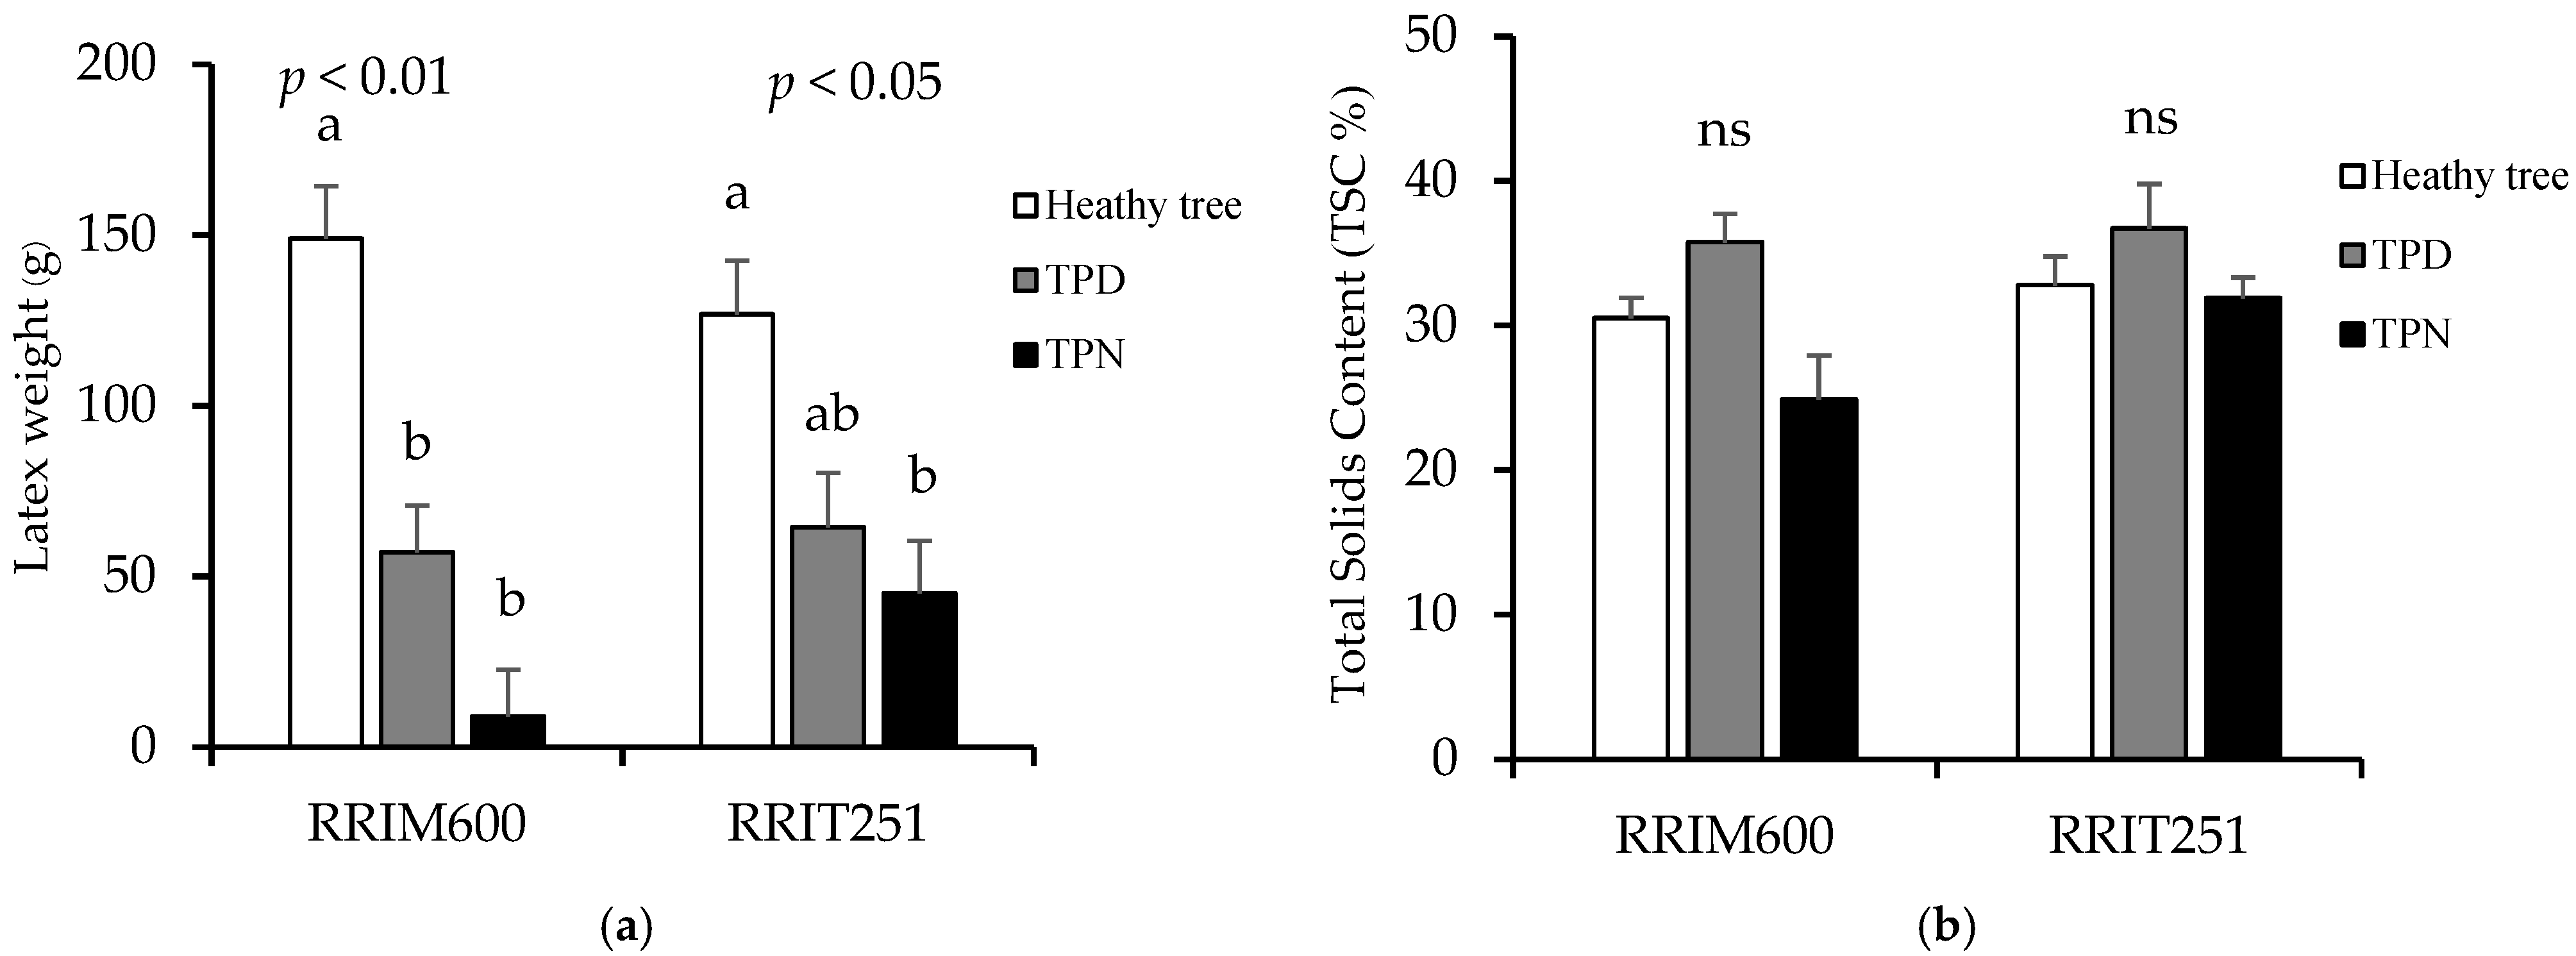
The trunk girth of the three tree types showed a significantly larger size in TPD trees of the RRIM600 clone (p < 0.05), but no significant differences were observed in the RRIT251 clone (Figure 3). However, yield data clearly showed that healthy trees produced the highest output in both clones (Figure 4a). Analysis of latex properties, based on total solid content (TSC), indicated no significant differences in TSC among the three tree types in either RRIM600 or RRIT251 (Figure 4b).
Table 1. Soil pH, organic matter (OM), phosphorus (P), potassium (K), calcium (Ca), and boron (B) at depths of 0–15 cm and 15–30 cm at the RRIM600 rubber plantation, comparing soil around healthy, tapping panel dryness (TPD), and tapping panel necrosis (TPN) trees.
Soil DepthSymptompHOM
(%)
P
(mg kg−1)
K
(mg kg−1)
Ca
(mg kg−1)
B
(mg kg−1)
RRIM600
0–15 cmHealthy tree3.79 ± 0.030.95 ± 0.0625.21 ± 2.6262.15± 3.7357.25 ± 3.42 a1.49 ± 0.15
TPD3.77 ± 0.030.88 ± 0.0721.94 ± 1.6259.87± 2.9849.40 ± 1.63 b1.91 ± 0.18
TPN3.87 ± 0.030.64 ± 0.1025.54 ± 6.9562.25 ± 12.0557.83 ± 1.51 a1.77 ± 0.33
F-testnsnsnsns**ns
15–30 cmHealthy tree3.74 ± 0.040.83 ± 0.07 b7.85 ± 0.8044.40± 2.7844.64 ± 4.221.67 ± 0.24
TPD3.72 ± 0.030.70 ± 0.04 b8.14 ± 0.6938.83± 2.4237.73 ± 2.201.75 ± 0.26
TPN3.81 ± 0.071.27 ± 0.27 a6.26 ± 0.4845.07 ± 10.7334.03 ± 3.212.00 ± 0.58
F-testns**nsnsnsns
RRIT251
0–15 cmHealthy tree3.95 ± 0.031.15 ± 0.06 b46.78 ± 5.7784.65 ± 4.7459.24 ± 2.812.37 ± 0.20 b
TPD3.93 ± 0.051.36 ± 0.06 a46.06 ± 3.5080.62 ± 4.1559.34 ± 1.942.90 ± 0.20 a
TPN3.90 ± 0.041.23 ± 0.11 b43.73 ± 7.3074.99 ± 7.8158.00 ± 3.951.94 ± 0.22 b
F-testns**nsnsns**
15–30 cmHealthy tree3.65 ± 0.020.67 ± 0.05 b20.55 ± 2.0054.09 ± 3.0234.84 ± 1.301.51 ± 0.23
TPD3.63 ± 0.041.31 ± 0.19 a18.25 ± 1.5057.07 ± 2.5543.42 ± 3.351.84 ± 0.21
TPN3.67 ± 0.050.61 ± 0.06 b18.41 ± 2.1860.25 ± 5.1743.25 ± 4.281.51 ± 0.27
F-testns**nsnsnsns
ns = not significantly different; ** = significantly different at the 99% confidence level. Vertical comparisons were performed using LSD at p < 0.05. Values are presented as mean ± standard error. Different letters following the mean indicate significant differences according to Duncan’s Multiple Range Test.
Figure 3. Trunk girth of healthy, tapping panel dryness (TPD), and trunk phloem necrosis (TPN) rubber trees in clones RRIM600 and RRIT251. Error bars represent the standard error of the mean. “ns” indicates non-significant differences, while p < 0.05 indicates statistically significant differences at the 95% confidence level. Different letters denote significant differences according to Duncan’s Multiple Range Test.
Forests 16 01477 g003
Figure 4. Latex weight and total soluble solids (TSCs) in healthy, tapping panel dryness (TPD), and trunk phloem necrosis (TPN) rubber trees of clones RRIM600 (a) and RRIT251 (b). Error bars represent the standard error of the mean. “ns” indicates non-significant differences; p < 0.05 and p < 0.01 indicate statistically significant differences at the 95% and 99% confidence levels, respectively. Different letters denote significant differences according to Duncan’s Multiple Range Test.
Forests 16 01477 g004

3.4. Nutrients in Plant Parts

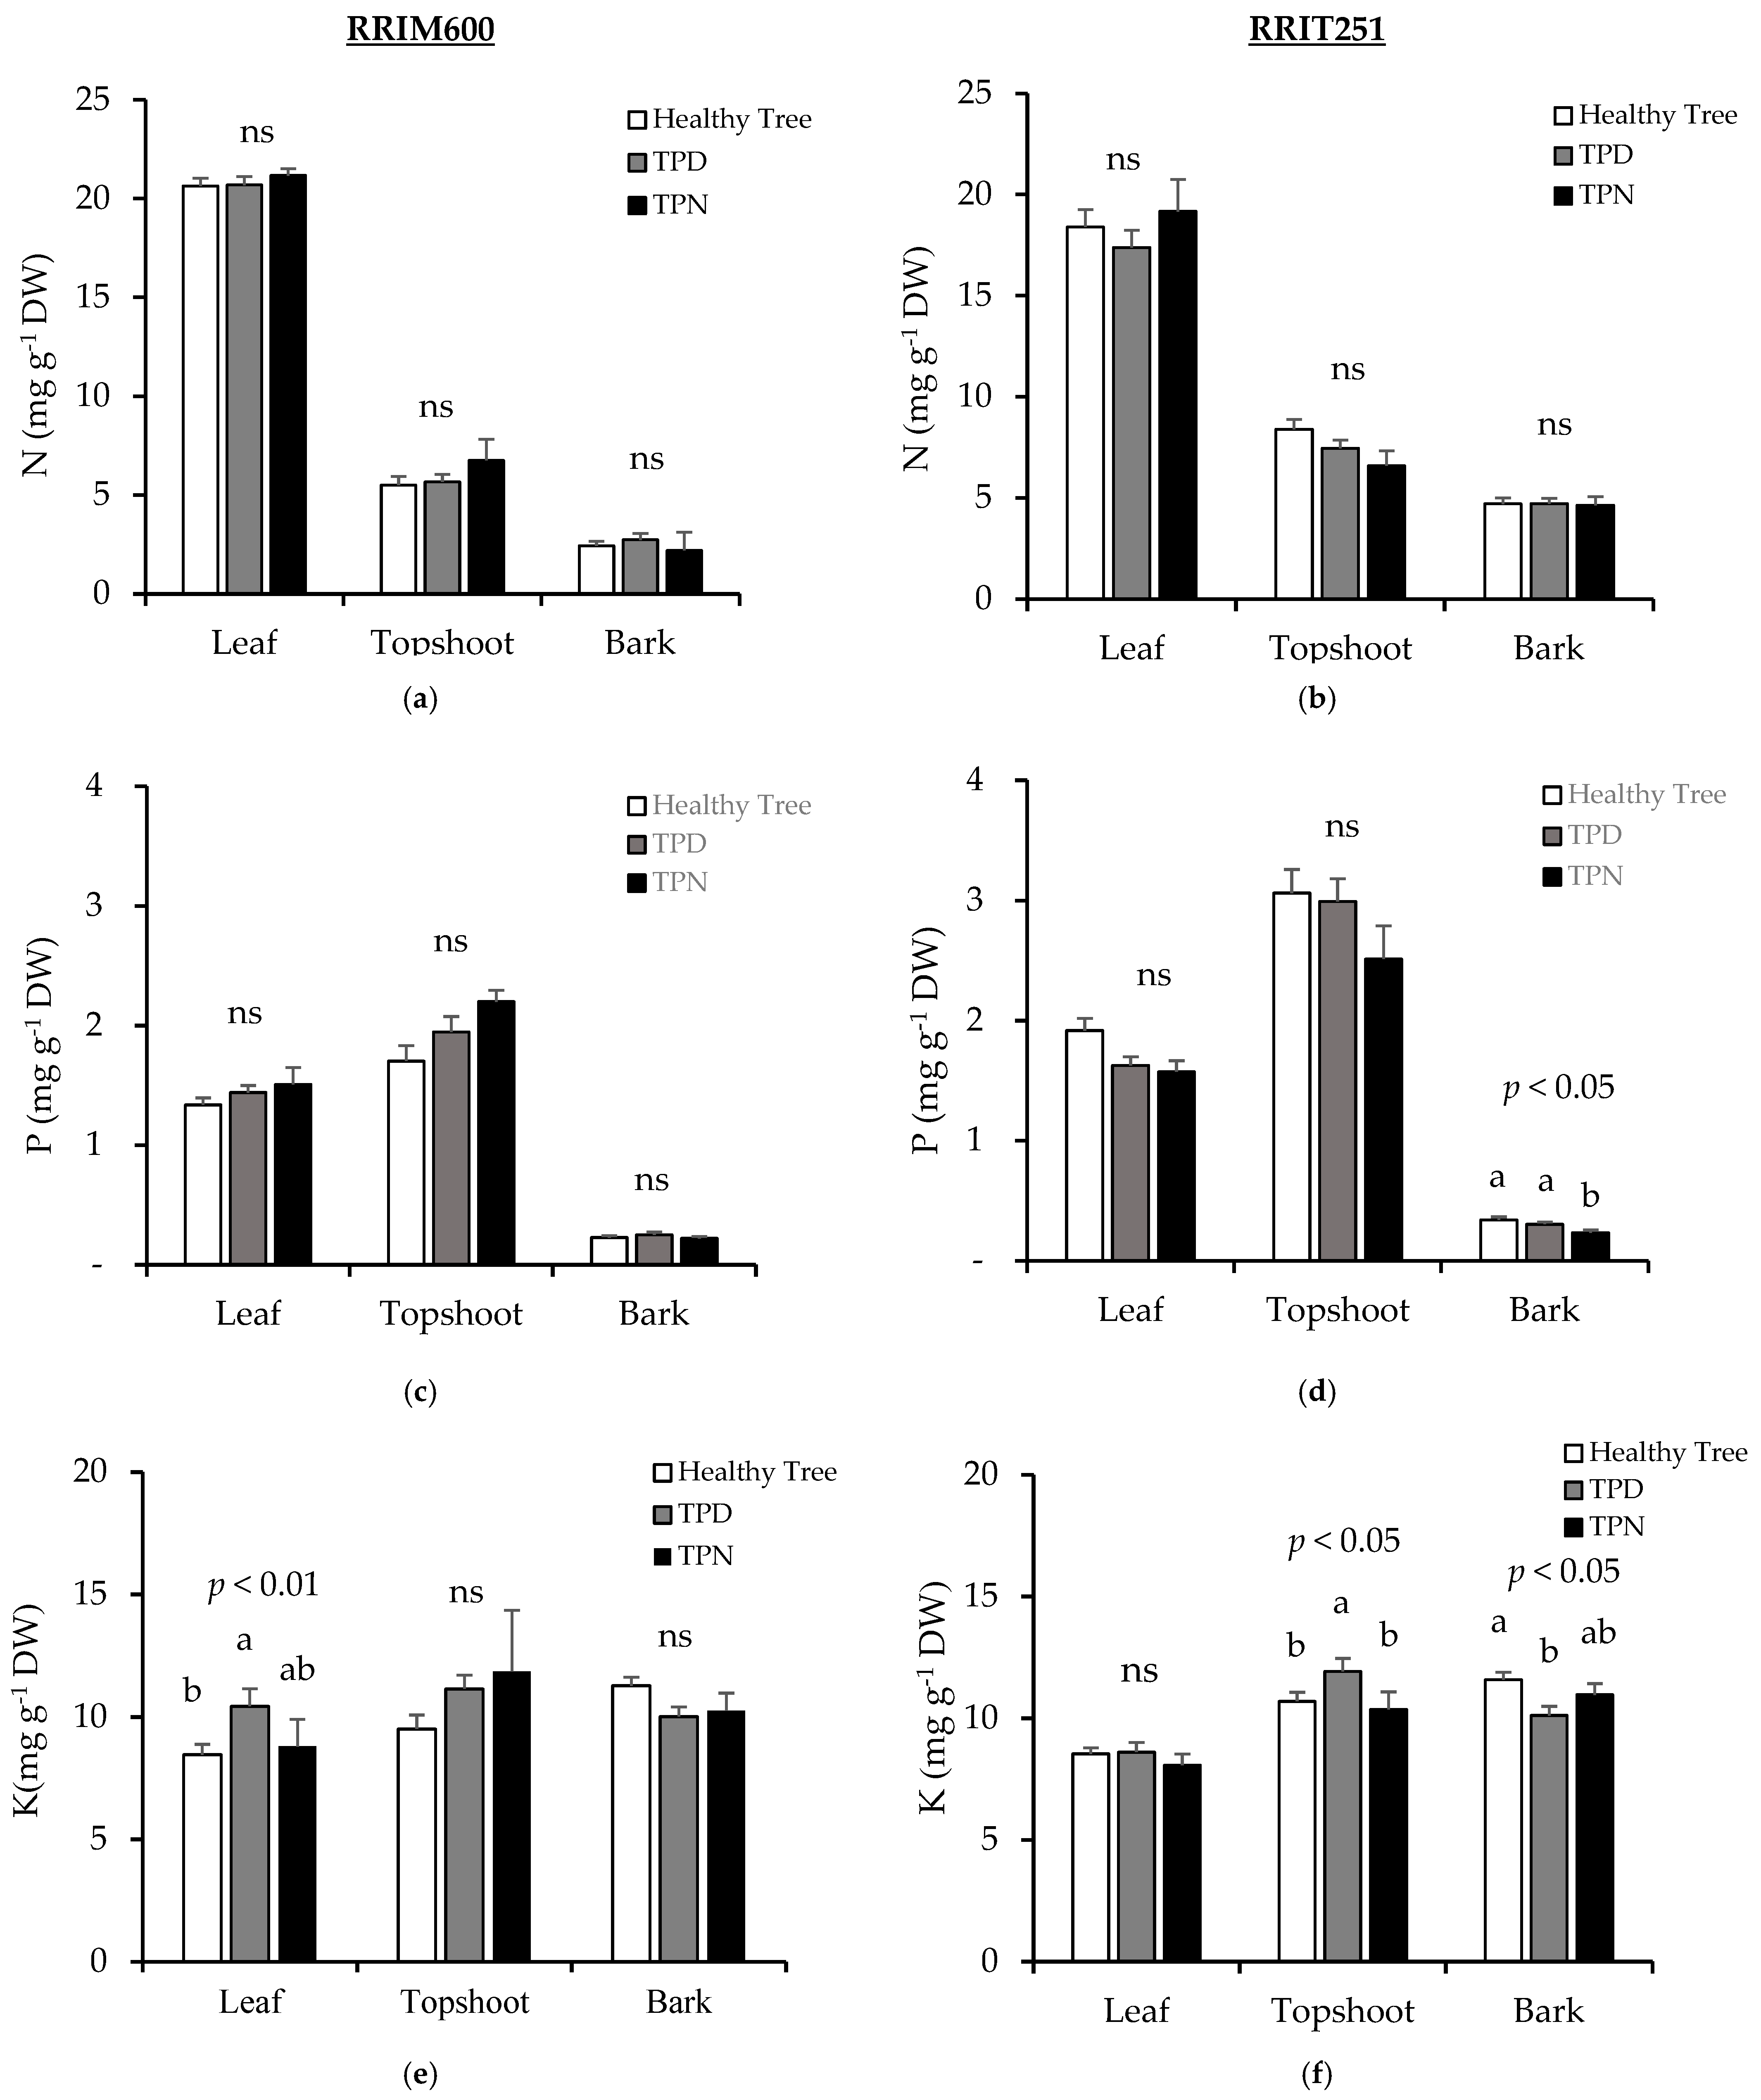
The concentrations of N, P, K, Ca, and B were analyzed in three plant parts: leaf, top shoot, and bark. The results showed that the nitrogen concentrations in the three plant parts did not differ significantly within either the RRIM600 (Figure 5a) or RRIT251 (Figure 5b) clones. However, leaves consistently had higher N concentrations than the top shoot and bark. A comparison between the two clones revealed that N concentrations in the top shoot and bark were higher in RRIT251 than in RRIM600.
In the P analysis, the comparison among the three tree types showed a pattern similar to that observed for N (Figure 5c,d). However, in the bark of RRIT251 (Figure 5d), the healthy and TPD trees exhibited higher P concentrations than the TPN trees (p < 0.05). Additionally, the top shoot had higher P concentrations than both the leaves and the bark. Furthermore, a comparison between the two clones revealed that the P concentrations in all parts were higher in RRIT251 than in RRIM600, consistent with the trend observed for N.
Another main nutrient, K, showed different patterns between the two clones (Figure 5e,f). In RRIM600, the highest K concentration was observed in the leaves of TPD trees (p < 0.01), whereas, in RRIT251, the highest K concentration was found in the top shoot of TPD trees (p < 0.05). However, in the bark of RRIT251 (Figure 5f), the TPD trees had the lowest K concentration (p < 0.05). For these three nutrients, a relationship with TPD and TPN symptoms was not established.
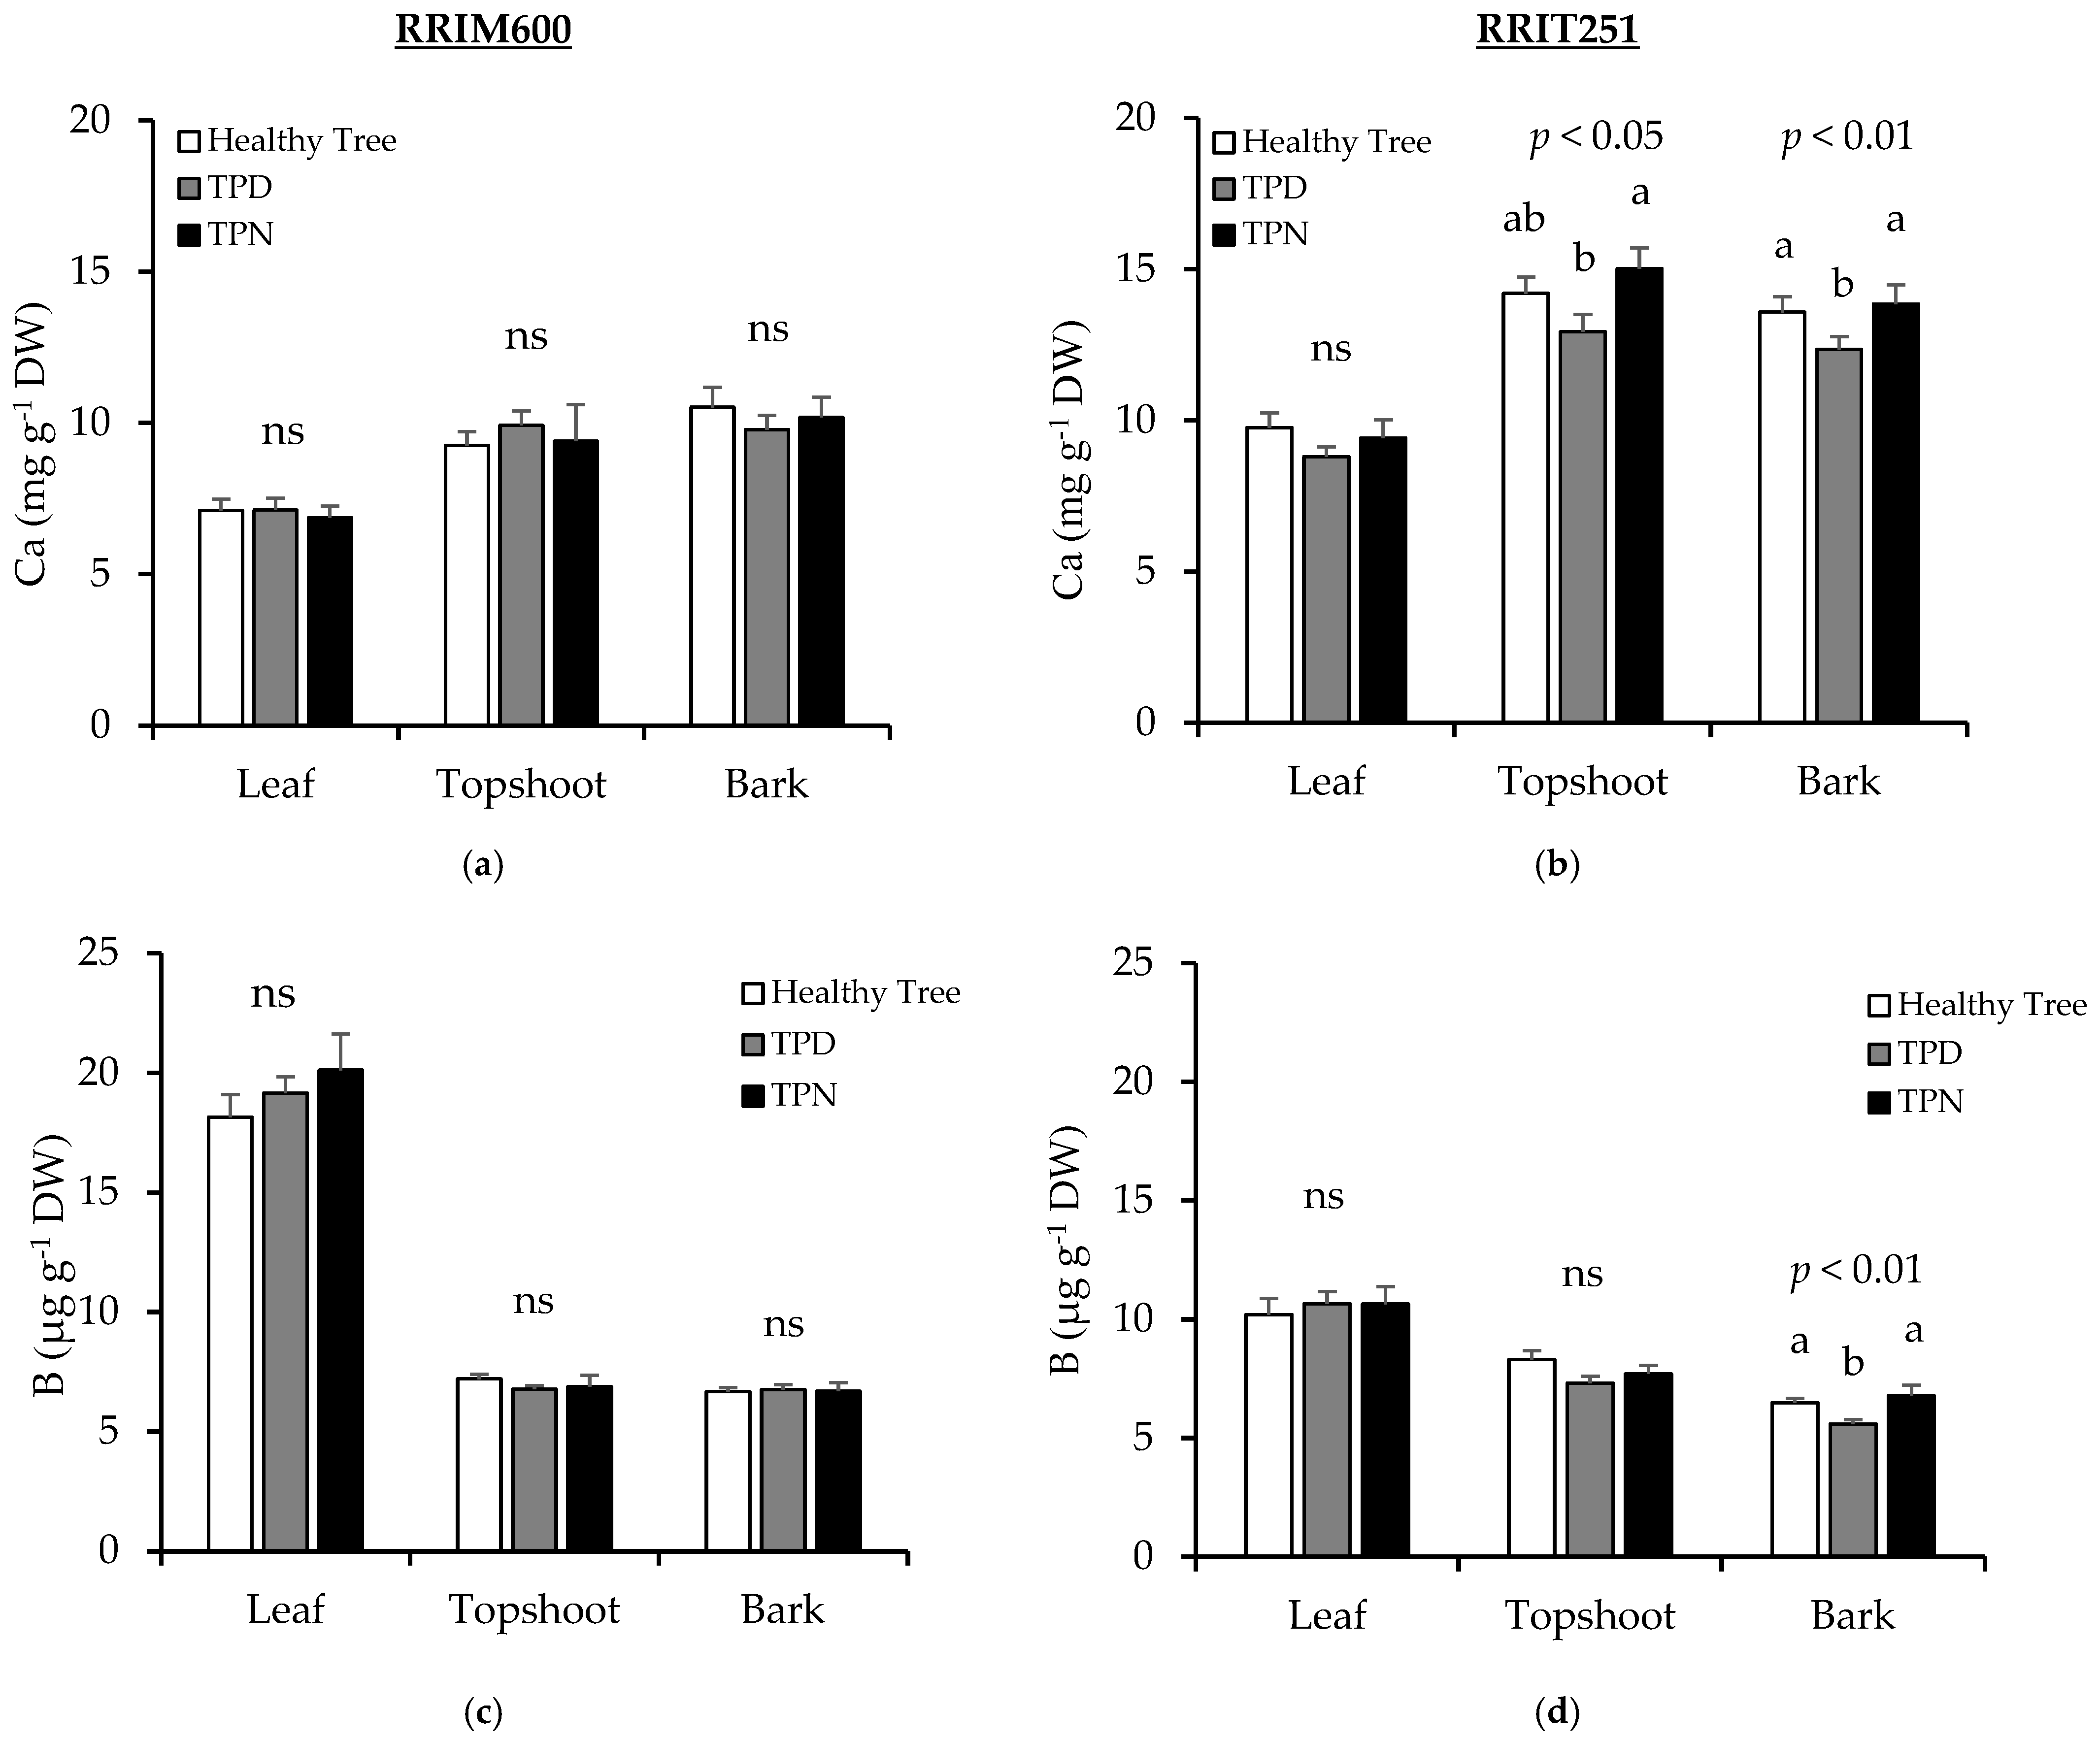
The immobile nutrients, Ca and B, in the RRIM600 clone showed no significant differences in Ca (Figure 6a) and B (Figure 6c) concentrations among the plant parts: leaves, top shoot, and bark. In contrast, the RRIT251 clone showed clear differences: the TPD trees had lower Ca concentrations (Figure 6b) in both the top shoot (p < 0.05) and bark (p < 0.01) and lower B concentrations in the bark (p < 0.01, Figure 6d). However, the TPN trees did not differ significantly in Ca and B concentrations compared to the healthy trees. Our results indicate that the reduction in Ca and B occurred only in the RRIT251 clone with TPD, whereas no such reduction was observed in RRIM600.
Figure 5. Concentrations of nitrogen (N), phosphorus (P), and potassium (K) in the leaf, top shoot, and bark of rubber tree clones RRIM600 (a,c,e) and RRIT251 (b,d,f), categorized by health status: healthy, tapping panel dryness (TPD), and trunk phloem necrosis (TPN). Error bars represent the standard error of the mean. “ns” indicates non-significant differences; p < 0.05 and p < 0.01 indicate statistically significant differences at the 95% and 99% confidence levels, respectively. Different letters denote significant differences according to Duncan’s Multiple Range Test.
Forests 16 01477 g005
Figure 6. Concentrations of calcium (Ca) and boron (B) in the leaf, top shoot, and bark of rubber tree clones RRIM600 (a,c) and RRIT251 (b,d), categorized by health status: healthy, tapping panel dryness (TPD), and trunk phloem necrosis (TPN). Error bars represent the standard error of the mean. “ns” indicates non-significant differences; p < 0.05 and p < 0.01 indicate statistically significant differences at the 95% and 99% confidence levels, respectively. Different letters denote significant differences according to Duncan’s Multiple Range Test.
Forests 16 01477 g006

3.5. Nutrients in Dry Rubber

The nutrient analysis of dry rubber (Table 2) showed that, in the RRIM600 clone, the TPN trees had the highest N and P concentrations, while the TPD trees had the lowest Ca concentration. In the case of RRIT251, the TPN trees had the lowest N concentration (p < 0.05), but no significant differences were observed in the other nutrients.

4. Discussion

4.1. Level of Abnormal Expression

The evaluation of TPD and TPN symptoms in two rubber tree clones, 7–9 years after the start of tapping, showed that RRIT251 exhibited a higher incidence of both TPD and TPN compared to RRIM600. The total incidence of panel dryness in RRIT251 was 14.2%, whereas RRIM600 showed 8.0%. This comparison indicates that RRIM600 is more resistant than RRIT251 to bark dryness, which reflects clonal variation [35,36,43]. Therefore, bark dryness could serve as a useful parameter for clonal selection in rubber trees. Nevertheless, the RRIT251 clone performs well under optimal conditions and demonstrates high growth and yield potential, particularly in Southern Thailand [34,44].

4.2. Soil Properties Associated with Bark Dryness

The analysis of soil properties revealed that the soils in all plantations were poor. For example, the optimal soil pH for most plants is generally in the range of 5.5–6.5 [27]. In the case of rubber trees in Thailand, several reports have indicated that the optimum pH is above 4.5 [13,26,28,45,46]. In comparison, our results showed that the soil pH was lower than this optimum range, which may have affected the availability of certain nutrients, such as P, K, and Ca. Strongly acidic soils are commonly treated with lime or dolomite to increase soil pH and improve nutrient availability. Other properties, such as OM, P, K, and Ca, were also below the optimum range. The optimum soil nutrient levels for rubber trees are 10–20 mg kg−1 for P, 40–80 mg kg−1 for K, and 50–600 mg kg−1 for Ca [26,43,45,46]. Therefore, these plantations can be considered to have infertile soil for rubber tree cultivation. Nutrient balance is also an important area of research for improving tree health [47,48,49]. The nutrient deficiency could contribute to the occurrence of TPD and TPN symptoms. Buakong et al. [13] reported that improving soil properties, such as increasing the levels of P, Ca, and magnesium (Mg), helped reduce the expression of TPD.

4.3. Bark Dryness on Growth and Yield

The evaluation of growth and yield in TPD and TPN rubber trees showed no significant differences in growth among the three tree types. A previous study reported that trees with bark dryness were slightly larger than healthy trees, but there was no significant difference in girth increment among the tree types [6]. This suggests that the larger size observed in trees with bark dryness may result from cumulative growth over several years. Regarding yield, both our results and previous studies consistently showed a clear reduction in yield in trees affected by tapping panel dryness [13,50], with the more severe symptom, TPN, associated with the lowest yield among the tree types. In terms of total solid content (TSC), TPD trees of the RRIM600 clone exhibited the highest TSC percentage, and a similar trend was observed in RRIT251. These findings indicate that TPN has a strongly negative effect on latex production and increases latex viscosity [43], which, in turn, reduces latex flow.

4.4. Bark Dryness on the Change in Nutrients in Plant Tissue

Generally, TPD and TPN significantly affect the distribution and concentration of nutrients in rubber trees. Conversely, nutrient deficiencies may also contribute to the occurrence of TPD and TPN [13]. This study focused on changes in N, P, K, Ca, and B in three plant parts: leaves, top shoot, and bark. Notably, bark samples were collected from areas without visible symptoms or wounds. For nitrogen (N) in all plant parts, the results clearly indicated that N may not have a direct effect on TPD and TPN. However, soil analysis revealed that the OM content in soils of RRIT251 trees with TPD symptoms was higher than that in other trees. Our results showed a lower range of N concentration in leaves compared to previous reports, 22.8–32.0 mg g−1 [26,45,46,49], while the N concentrations in the top shoot and bark fell within the previously reported ranges, 2.90–11.3 mg g−1 and 2.2–5.4 mg g−1, respectively [23,46].
Regarding the other two mobile nutrients in plants, P was lowest only in the bark of RRIT251 trees with TPN symptoms, while the pattern of K was more variable. The highest K concentration was observed in the leaves of RRIM600 and in the top shoot of RRIT251 with TPD symptoms, whereas the lowest K concentration occurred in the bark of RRIT251 with TPD symptoms. Previous studies on P may have focused on inorganic phosphorus (Pi), but no clear link to bark dryness symptoms was established [36]. That study also reported that sucrose content is significantly associated with TPD. For K, the addition of organic fertilizer and micronutrients did not improve the K level in the soil [13]. Furthermore, the high K concentration in the top shoot, coupled with low K levels in the bark of TPD-affected trees, may indicate impaired translocation within the plant, a common response to stress. Comparison of our results on P concentrations in plant tissues with previous reports showed that our measured concentrations were at the lower end of the previously reported ranges, whereas K was within the previously reported range. Reported ranges for P and K in leaves were 1.6–3.2 mg g−1 and 7.0–16.1 mg g−1, respectively [26,45,46,49], while, in bark, the ranges were 1.1–3.4 mg g−1 and 4.0–6.5 mg g−1, respectively [23,46].
In addition, the immobile nutrients calcium (Ca) and boron (B) often show altered concentrations in trees with bark dryness compared to healthy trees [13,31]. These changes may result from impaired translocation or reduced nutrient uptake due to physiological disruptions caused by bark dryness. In this study, a clear reduction in both Ca and B was observed in the RRIT251 clone with TPD symptoms, whereas no significant differences were found in RRIM600. This finding may reflect clonal variability [36,43], with RRIT251 being more susceptible to stress, potentially due to poor soil conditions or extreme environmental factors, such as high temperatures, in this area. The reduction in Ca in the bark of TPD trees observed in this study is consistent with previous research, which reported that increasing Ca in the bark could alleviate TPD symptoms [13]. The Ca concentrations measured in this study were within previously reported ranges, with leaves and bark containing 7.4–13.6 mg g−1 and 11.43–14.13 mg g−1, respectively [23,45,46,49]. Meanwhile, the optimum B concentration in leaves, reported by Suchartgul et al. [26], ranged from 40 to 80 µg g−1, which was higher than the B concentration found in our study. Notably, the B concentration in the leaves of the RRIM600 clone was approximately twice that of RRIT251, despite the soil under RRIT251 having higher B levels than under RRIM600. This finding may indicate that the higher B concentration in the RRIM600 leaves contributes to its resistance to bark necrosis symptoms.

4.5. Bark Dryness on the Change in Nutrients in the Yield

Our study found that TPD trees of the RRIM600 clone had the lowest concentrations of N, P, Ca, and B, whereas, in RRIT251, only N showed a significant difference. The variation in nutrient concentrations in the yield contrasted with those in plant tissues, with RRIT251 showing greater fluctuations than RRIM600. These findings suggest that bark dryness in RRIM600 is associated with low nutrient concentrations in the yield. The nutrient concentrations in dry rubber observed in this study were higher than those reported previously. Earlier studies documented ranges of 4.6–5.1 mg g−1 for N, 0.6–0.7 mg g−1 for P, and 0.4–0.7 mg g−1 for K [28]. This discrepancy may be due to differences in yield, as the earlier study was conducted in Southern Thailand, where rubber yield is approximately twice as high as in our study area in Northeastern Thailand. The higher yield may lead to a dilution effect, resulting in lower nutrient concentrations in the rubber.
In addition, our results showed that Ca and B concentrations in the yield of RRIM600 were low, while no significant differences were observed in the bark. In contrast, RRIT251 exhibited the opposite trend. This may indicate that the RRIM600 clone has a greater ability to regulate the loss of Ca and B through latex production. Consequently, RRIM600 exhibited less bark necrosis compared to RRIT251.

4.6. Key Findings and Future Research Directions

The expansion of rubber plantations should be accompanied by careful management of soil fertility, including factors such as soil pH and nutrient availability. Poor soil conditions have been identified as a contributing factor to bark necrosis. In acidic soils, appropriate soil preparation, such as the application of lime or dolomite, is necessary to increase soil pH. Clone selection for cultivation in poor soil conditions should also be carefully considered, as high-yielding clones are often less tolerant to environmental stress [34,44]. In our observations, reductions in potassium (K), calcium (Ca), and boron (B) concentrations may be associated with the development of bark necrosis syndromes. Therefore, optimum fertilizer management, including soil application, foliar spraying, and direct application to affected bark, should be given greater attention in future research.

5. Conclusions

This study investigated nutrient associations with TPD and TPN syndromes in two rubber tree clones. The soil fertility in this area was poor, with strong acidic conditions (pH < 4.0) in both the topsoil and subsoil. The RRIT251 clone exhibited a higher incidence of bark necrosis compared to RRIM600. In both clones, the yield was reduced in trees affected by TPD and was dramatically reduced in those affected by TPN. Nutrient analysis showed that RRIT251 trees affected by TPD had the lowest concentrations of K, Ca, and B in the bark, as well as the lowest Ca concentration in the top shoot. RRIM600 showed almost no significant differences in nutrient concentrations across plant parts. However, in dry rubber, RRIM600 trees affected by TPD had the lowest concentrations of N, P, Ca, and B. In both clones, the nutrient concentrations in TPN trees were nearly identical to those in healthy trees.

Author Contributions

Conceptualization, S.S., A.W., S.M. and S.I.N.A.; methodology, S.S., A.W. and S.I.N.A.; software, S.S. and S.I.N.A.; validation, S.I.N.A.; formal analysis, S.S. and S.I.N.A.; investigation, S.S., A.W., S.M. and S.I.N.A.; resources, S.S., S.M. and S.I.N.A.; data curation, S.S.; writing—original draft preparation, S.S., A.W., S.M. and S.I.N.A.; writing—review and editing, S.S. and S.I.N.A.; visualization, S.S. and S.I.N.A.; supervision, A.W. and S.I.N.A.; project administration, S.I.N.A.; funding acquisition, S.I.N.A. All authors have read and agreed to the published version of the manuscript.

Funding

This research was funded by (1) the Supporting Lecturer to Admit High Potential Student to Study and Research on His Expert Program in the Year 2020, (2) Department of Horticulture, Faculty of Agriculture, Khon Kaen University, Khon Kaen, and (3) the research program “Research Development on Rubber Tree and Potential Fruit Trees in Northeastern Thailand”, Khon Kaen University.

Institutional Review Board Statement

Not applicable.

Data Availability Statement

The datasets used in this study are available from the corresponding author upon reasonable request.

Acknowledgments

We would like to acknowledge the scholarship support from the program Supporting Lecturer to Admit High Potential Students to Study and Research on His Expert Program (2020). We also thank the Department of Horticulture, Faculty of Agriculture, Khon Kaen University, Khon Kaen, Thailand, for their support during the course of this research. Additionally, we express our gratitude to the research program Research Development on Rubber Tree and Potential Fruit Trees in Northeastern Thailand, Khon Kaen University.

Conflicts of Interest

The authors declare no conflicts of interest.

References

  1. Li, D.; Deng, Z.; Chen, C.; Xia, Z.; Wu, M.; He, P.; Chen, S. Identification and characterization of genes associated with tapping panel dryness from Hevea brasiliensis latex using suppression subtractive hybridization. BMC Plant Biol. 2010, 10, 140. [Google Scholar] [CrossRef]
  2. FAO. FAOSTAT Online Statistical Service; United Nations Food and Agriculture Organization: Rome, Italy. Available online: http://faostat.fao.org (accessed on 1 July 2025).
  3. Watson, G.A. Climate and Soil. In Rubber; Webster, C.C., Baulkwill, W.J., Eds.; Longman Singapore Publishers (Pte) Ltd.: Singapore, 1989; pp. 125–164. [Google Scholar]
  4. Kositsup, B.; Montpied, P.; Kasemsap, P.; Thanisawanyangkura, S.; Marquier, A.; Dreyer, E. Photosynthetic capacity and temperature responses of photosynthesis of rubber trees (Hevea brasiliensis Müll. Arg.) acclimate to changes in ambient temperatures. Trees 2009, 23, 357–365. [Google Scholar] [CrossRef]
  5. Mangmeechai, A. Effects of Rubber Plantation Policy on Water Resources and Land Use Change in the Northeastern Region of Thailand. Geogr. Environ. Sustain. 2020, 13, 73–83. [Google Scholar] [CrossRef]
  6. Do, F.C.; Pierret, A.; Couteron, P.; Lesturgez, G.; Boithias, L.; Isarangkool Na Ayutthaya, S.; Junjittakarn, J.; Gonkhamdee, S.; Maeght, J.L.; Hartmann, C.; et al. Spatial Distribution of Hevea brasiliensis Trunk Phloem Necrosis within a Plot: Aggregation but No Evidence of Constraint on Cumulated Growth. For. Pathol. 2011, 41, 90–100. [Google Scholar] [CrossRef]
  7. Sangchanda, N.; Isarangkool Na Ayutthaya, S.; Meetha, S.; Songsri, P. The Influence of Rainfall on Growth of Rubber Trees in Marginal Area of Northeast Thailand. Adv. Mater. Res. 2014, 844, 7–10. [Google Scholar] [CrossRef]
  8. Sugebo, B.; Yebeyen, D.; Adugna, A. Latex Yield Variation among Hevea brasiliensis Clones Grown under the Agro-Climate of South-West Ethiopia. Trees For. People 2022, 9, 100285. [Google Scholar] [CrossRef]
  9. Peries, O.S.; Brohier, Y.E.M. A Virus as Causal Agent of Bark Cracking in Hevea brasiliensis. Nature 1965, 205, 624–625. [Google Scholar] [CrossRef]
  10. Peries, O.S. The Etiology of “Bark Cracking” Disease of Hevea brasiliensis. Plant Dis. Rep. 1977, 61, 946–948. [Google Scholar]
  11. Pellegrin, F.; Nandris, D.; Chrestin, H.; Duran-Vila, N. Rubber Tree (Hevea brasiliensis) Bark Necrosis Syndrome I: Still No Evidence of a Biotic Causal Agent. Plant Dis. 2004, 88, 1046. [Google Scholar] [CrossRef]
  12. Pellegrin, F.; Duran-Vila, N.; Van Munster, N.; Nandris, D. Rubber Tree (Hevea brasiliensis) Trunk Phloem Necrosis: Aetiological Investigations Failed to Confirm Any Biotic Causal Agent. For. Pathol. 2007, 37, 9–21. [Google Scholar] [CrossRef]
  13. Buakong, W.; Suwanmanee, P.; Ruttajorn, K.; Assawatreerathakul, K.; Leak, J.E. Improving Rubber Production and Tapping Panel Dryness in Hevea Tree Using Organic Fertiliser and Micronutrients. J. Sustain. Sci. Manag. 2023, 20, 1275–1292. [Google Scholar] [CrossRef]
  14. Kumar, A.; Pandey, D.M.; Abraham, T.; Mathew, J.; Ramachandran, P.; Malathi, V.G. Determination of biotic aetiology of tapping panel dryness (TPD) syndrome of rubber tree (Hevea brasiliensis) by return-polyacrylamide gel electrophoresis (R-PAGE) technique. Arch. Phytopathol. Plant Prot. 2013, 46, 710–720. [Google Scholar] [CrossRef]
  15. Nandris, D.; Nicole, M.; Geiger, J.P.; Fernandez, D. Bark Necrosis and Other Abnormal Syndromes of Hevea brasiliensis in Relation to Clonal Susceptibility, Latex Harvesting, and Environment. In Natural Rubber: Biology, Cultivation and Technology; Sethuraj, M.R., Mathew, N.M., Eds.; Elsevier: Amsterdam, The Netherlands, 2004; pp. 326–349. [Google Scholar]
  16. de Fay, E.; Jacob, J.L. The Bark Dryness Disease (Brown-Bast) of Hevea: Symptomatology, Histological and Cytological Aspects. In Physiology of Rubber Tree Latex; Auzac, J., Jacob, J.L., Chrestin, H., Eds.; CRC Press: Boca Raton, FL, USA, 1989; pp. 407–430. [Google Scholar]
  17. Jacob, J.; Krishnakumar, R. Tapping Panel Dryness Syndrome: What We Know and What We Do Not Know. In Tapping Panel Dryness of Rubber Trees; James, J., Krishnakumar, R., Mathew, N.M., Eds.; Rubber Research Institute of India: Kottayam, India, 2006; pp. 1–27. [Google Scholar]
  18. Liyanage, A.S.; Peries, O.S.; Liyanage, N.I.S.; Irugalbandara, Z.E.; Wetta, S.J.L.P. Annual Review; Rubber Research Institute of Sri Lanka: Agalawatta, Sri Lanka, 1983; pp. 55–56. [Google Scholar]
  19. Qi, D.L.; Zhou, J.N.; Xie, G.S.; Wu, Z.X. Studies on Rubber (Hevea brasiliensis) Trees Exist Plant Type after Planting and Available Tapping Tree of Rubber Plantation in China. Am. J. Plant Sci. 2014, 5, 3017–3021. [Google Scholar] [CrossRef]
  20. Paranjothy, K.; Yeang, H.Y. A Consideration on the Nature and Control of Brown Bast. In Proceedings of the RRIM Planters Conference, Kuala Lumpur, Malaysia, 17–19 October 1977; pp. 74–90. [Google Scholar]
  21. Putranto, R.-A.; Herlinawati, E.; Rio, M.; Leclercq, J.; Piyatrakul, P.; Gohet, E.; Sanier, C.; Oktavia, F.; Pirrello, J.; Montoro, P. Involvement of Ethylene in the Latex Metabolism and Tapping Panel Dryness of Hevea brasiliensis. Int. J. Mol. Sci. 2015, 16, 17885–17908. [Google Scholar] [CrossRef]
  22. Zhang, Y.; Leclercq, J.; Montoro, P. Reactive Oxygen Species in Hevea brasiliensis Latex and Relevance to Tapping Panel Dryness. Tree Physiol. 2017, 37, 261–269. [Google Scholar] [CrossRef]
  23. Ahmad, N.A.; Sulaiman, Z.; Samad, M.Y.A.; Karim, S.M.R.; Salisu, M.A. Effect of Deficiency-Adjusted Macronutrients to Cure Brown Bast Syndrome in Rubber Tree (Hevea brasiliensis). Pertanika J. Trop. Agric. Sci. 2023, 46, 1309–1326. [Google Scholar] [CrossRef]
  24. Nandris, D.; Chrestin, H.; Geiger, J.P.; Nicole, M.; Thouvenel, J.C. Occurrence of a Phloem Necrosis on the Trunk of Rubber Tree. In Proceedings of the 75th Annual Conference of Rubber Research in Sri Lanka, Colombo, Sri Lanka, 17–19 September 1984; p. 59. [Google Scholar]
  25. Isarangkool Na Ayutthaya, S.; Do, F.C. Rubber Trees Affected by Necrotic Tapping Panel Dryness Exhibit Poor Transpiration Regulation under Atmospheric Drought. Adv. Mater. Res. 2014, 844, 3–6. [Google Scholar] [CrossRef]
  26. Suchartgul, S.; Maneepong, S.; Issarakrisila, M. Establishment of Standard Values for Nutritional Diagnosis in Soil and Leaves of Immature Rubber Tree. Rubber Thai J. 2012, 1, 19–31. [Google Scholar]
  27. Marschner, H. Mineral Nutrition of Higher Plants, 2nd ed.; Academic Press: London, UK, 1995. [Google Scholar]
  28. Chotiphan, R.; Vaysse, L.; Lacote, R.; Gohet, E.; Thaler, P.; Sajjaphan, K.; Bottier, C.; Char, C.; Liengprayoon, S.; Gay, F. Can Fertilization Be a Driver of Rubber Plantation Intensification? Ind. Crops Prod. 2019, 141, 111752. [Google Scholar] [CrossRef]
  29. Priyadarshan, P.M. Biology of Hevea Rubber; Springer: Cham, Switzerland, 2017. [Google Scholar] [CrossRef]
  30. Alle, J.Y.; Dick, E.A.; Soymahin, E.F.; Glaba, R.O.; Keli, J.Z.; Obouayeba, S. Effect of Mineral Fertilization on Agrophysiological Parameters and Economic Viability of Clone PB 235 of Hevea brasiliensis in the Region of GO in South Western Côte d’Ivoire. J. Anim. Plant Sci. 2015, 2, 3768–3780. [Google Scholar]
  31. Hashyati Nik, N.H.; Sulaiman, Z.; Salisu, M.A.; Samad, M.Y.A.; Mohamed, M.T.M.; Mokhtar, M.S.J.; Ghani, Z.A.B.; Adinan, A. Application of Different Rates and Frequencies of Rejuvenator for the Treatments of Brown Bast Syndrome on Hevea brasiliensis. Indian J. Agric. Res. 2022, 56, 469–473. [Google Scholar] [CrossRef]
  32. Nartvaranant, P.; Subhadrabandhu, S.; Whiley, A.W. Effect of Soil Boron Application on Gummosis and Leaf Boron Content of Mango (Mangifera indica L.) cvs. Khieo Sawoei and Nam Dok Mai. Acta Hortic. 2002, 575, 875–879. [Google Scholar] [CrossRef]
  33. Ma, X.; Liu, X.; Xiang, P.; Qiu, S.; Yuan, X.; Yang, M. Effects of the Contents of Mineral Elements on Gummosis in Prunus salicina Lindl. HortScience 2021, 56, 568–571. [Google Scholar] [CrossRef]
  34. Thitithanakul, S.; Ma, N.; Sukkawong, S.; Jaikrajang, B. Determination of Nitrogen and Phosphorus Requirement of the RRIM 600 and RRIT 251 Young Rubber Trees. Walailak J. Sci. Technol. 2016, 14, 571–580. [Google Scholar]
  35. Puwaphut, R.; Nakkaew, A.; Phongdara, A. Diversity among Three Cultivars (RRIM600, RRIT251, and PB350) of Hevea brasiliensis and Secondary Metabolite Production. Songklanakarin J. Sci. Technol. 2016, 38, 15–22. [Google Scholar] [CrossRef]
  36. Herlinawati, E.; Montoro, P.; Ismawanto, S.; Syafaah, A.; Aji, M.; Giner, M.; Flori, A.; Gohet, E.; Oktavia, F. Dynamic Analysis of Tapping Panel Dryness in Hevea brasiliensis Reveals New Insights on This Physiological Syndrome Affecting Latex Production. Heliyon 2022, 8, e10920. [Google Scholar] [CrossRef]
  37. Walkley, A.J.; Black, I.A. Estimation of Soil Organic Carbon by the Chromic Acid Titration Method. Soil Sci. 1934, 37, 29–38. [Google Scholar] [CrossRef]
  38. Roper, W.R.; Robarge, W.P.; Osmond, D.L.; Heitman, J.L. Comparing Four Methods of Measuring Soil Organic Matter in North Carolina Soils. Soil Sci. Soc. Am. J. 2019, 83, 466–474. [Google Scholar] [CrossRef]
  39. Gupta, U.C. Boron, Molybdenum, and Selenium. In Soil Sampling and Methods of Analysis; Carter, M.R., Ed.; CRC Press: Boca Raton, FL, USA, 1993; pp. 91–99. [Google Scholar]
  40. Mills, H.A.; Jones, J.B. Plant Analysis Handbook II: A Practical Sampling, Preparation, Analysis, and Interpretation Guide; Micro-Macro Publishing: Athens, GA, USA, 1996. [Google Scholar]
  41. Kayaphad, B.; Isarangkool Na Ayutthaya, S.; Hongpakdee, P.; Siriwong, C. Comparison of Two Methods for the Determination of Nitrogen in Leaf and Yield in Banana, Jujube and Rubber Tree. Acta Hortic. 2021, 1312, 417–422. [Google Scholar] [CrossRef]
  42. Gaines, T.P.; Mitchell, G.A. Boron Determination in Plant Tissue by the Azomethine H Method. Commun. Soil Sci. Plant Anal. 1979, 10, 1099–1108. [Google Scholar] [CrossRef]
  43. Junaidi, N.; Nuringtyas, T.R.; Clément-Vidal, A.; Flori, A.; Syafaah, A.; Oktavia, F.; Ismawanto, S.; Aji, M.; Subandiyah, S.; Montoro, P. Analysis of Reduced and Oxidized Antioxidants in Hevea brasiliensis Latex Reveals New Insights into the Regulation of Antioxidants in Response to Harvesting Stress and Tapping Panel Dryness. Heliyon 2022, 8, e09840. [Google Scholar] [CrossRef]
  44. Nhean, S.; Isarangkool Na Ayutthaya, S.; Rathanawong, R.; Do, F.C. Immature Growth Performance of Three Important Rubber Tree (Hevea brasiliensis) Clones in a Drought-Prone Area. Aust. J. Crop Sci. 2020, 14, 469–474. [Google Scholar] [CrossRef]
  45. Onthong, J.; Khawmee, K.; Keawmano, C. Growth of Immature Rubber Trees Planted in Abandoned Paddy Field and Upland Areas in Relation to Soil Properties and Leaf Nutrients. Songklanakarin J. Sci. Technol. 2017, 39, 675–683. [Google Scholar]
  46. Perron, T.; Mareschal, L.; Laclau, J.-P.; Deffontaines, L.; Deleporte, P.; Masson, A.; Cauchy, T.; Gay, F. Dynamics of Biomass and Nutrient Accumulation in Rubber (Hevea brasiliensis) Plantations Established on Two Soil Types: Implications for Nutrient Management over the Immature Phase. Ind. Crops Prod. 2021, 159, 113073. [Google Scholar] [CrossRef]
  47. Chen, B.; Cao, J.; Wang, J.; Wu, Z.; Xie, G. Development and Implementation of Site-Specific Fertilizer Recommendation Model Based on Nutrient Balance for Rubber Plantation. Agron. J. 2011, 103, 464–471. [Google Scholar] [CrossRef]
  48. Hytonen, J.; Nurmi, J.; Kaakkurivaara, N.; Kaakkurivaara, T. Rubber Tree (Hevea brasiliensis) Biomass, Nutrient Content, and Heating Values in Southern Thailand. Forests 2019, 10, 638. [Google Scholar] [CrossRef]
  49. Njukeng, J.N.; Ehabe, E.E.; Nkeng, G.E.; Schick, J.; Kratz, S.; Schnug, E. Investigations on the Nutritional Status of Hevea brasiliensis Plantations in the Humid Forest Zone of Cameroon. Part 2: Establishment of Macronutrient Norms. J. Kult. 2013, 65, 376–384. [Google Scholar]
  50. Chen, S.; Peng, S.; Huang, G.; Wu, K.; Fu, X.; Chen, Z. Association of Decreased Expression of a Myb Transcription Factor with the TPD (Tapping Panel Dryness) Syndrome in Hevea brasiliensis. Plant Mol. Biol. 2003, 51, 51–58. [Google Scholar] [CrossRef]
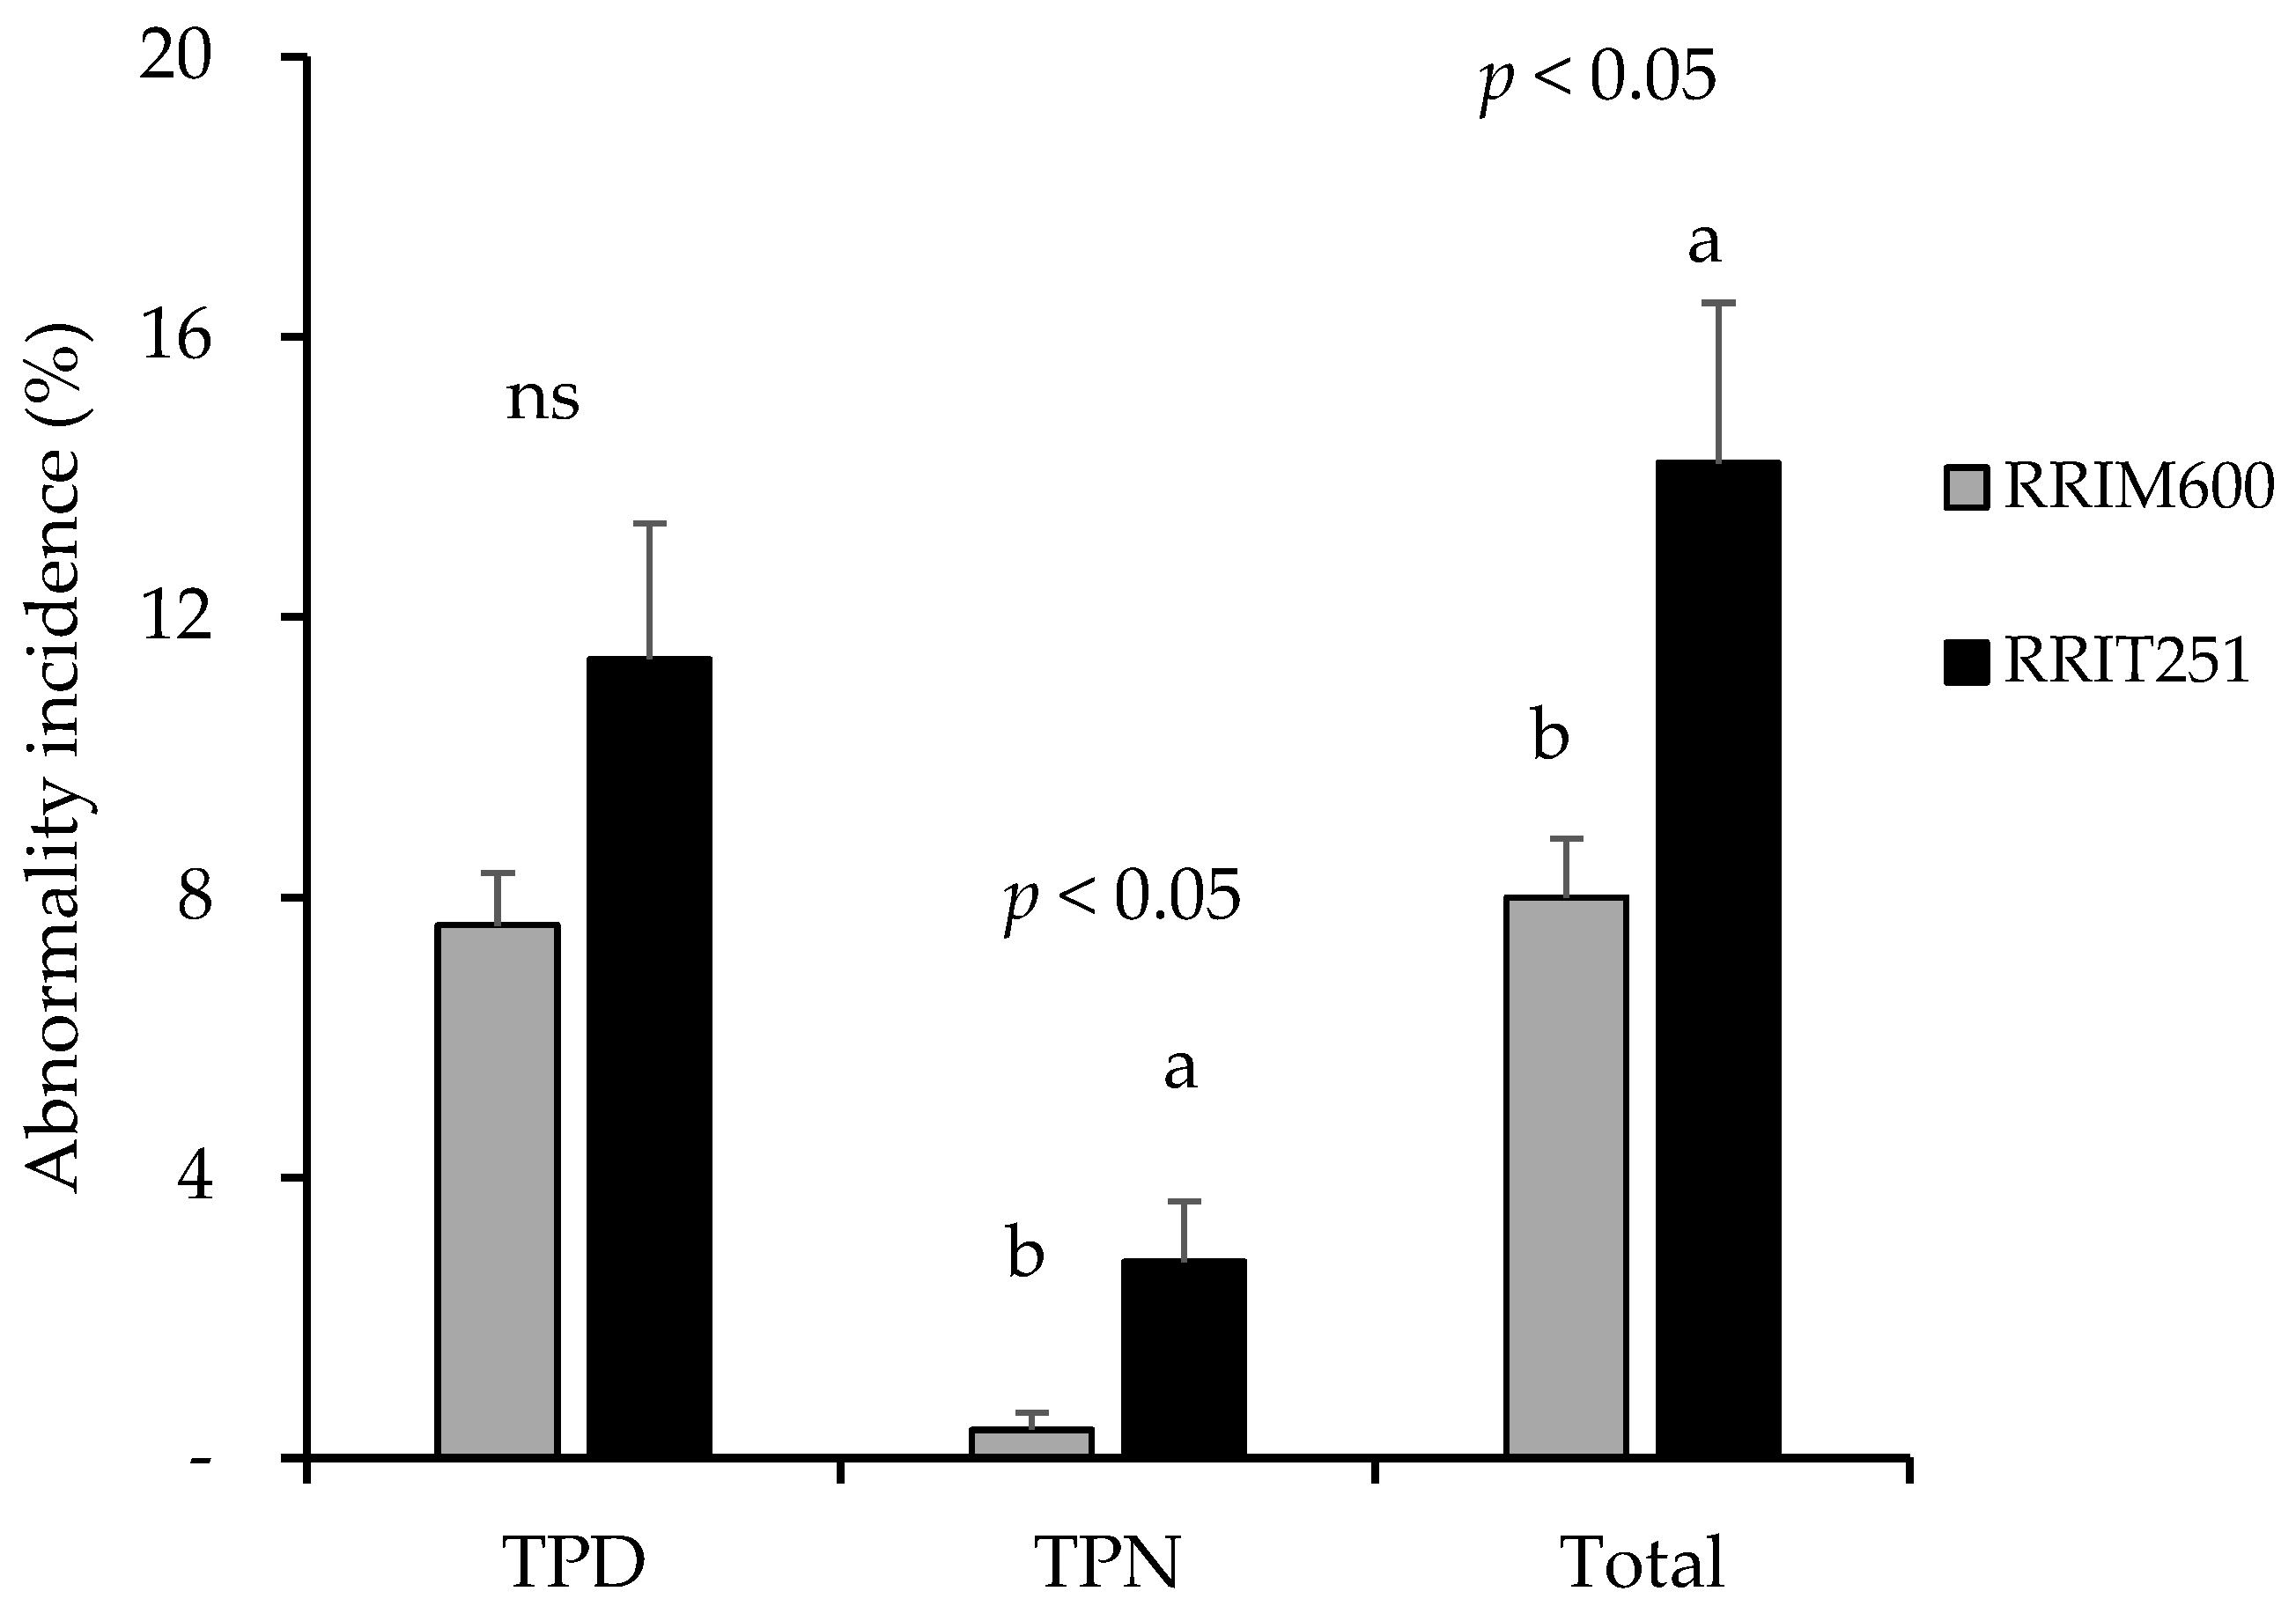
Figure 2. Percentage of tapping panel dryness (TPD), trunk phloem necrosis (TPN), and total syndromes in rubber tree clones RRIM600 and RRIT251. Error bars represent the standard error of the mean. “ns” indicates non-significant differences, while p < 0.05 indicates statistically significant differences at the 95% confidence level. Different letters denote significant differences according to Duncan’s Multiple Range Test.
Forests 16 01477 g002
Table 2. Nitrogen (N), phosphorus (P), potassium (K), calcium (Ca), and boron (B) in dry rubber of healthy, tapping panel dryness (TPD), and tapping panel necrosis (TPN) trees of rubber clones RRIM600 and RRIT251.
CloneSymptomN
(mg g−1 DW)
P
(mg g−1 DW)
K
(mg g−1 DW)
Ca
(mg g−1 DW)
B
(μg g−1 DW)
RRIM600Healthy tree7.34 ± 0.85 ab2.31 ± 0.28 b1.97 ± 0.180.34 ± 0.03 a1.44 ± 0.05 b
TPD5.60 ± 1.34 b1.88 ± 0.33 b1.26 ± 0.300.19 ± 0.07 b1.31 ± 0.11 b
TPN12.49 ± 3.22 a4.42 ± 1.06 a2.46 ± 0.480.40 ± 0.10 a1.74 ± 0.04 a
F-test**ns**
RRIT251Healthy tree9.66 ± 0.72 a4.15 ± 0.431.72 ± 0.170.30 ± 0.031.35 ± 0.05
TPD7.21 ± 0.70 ab3.42 ± 0.561.93 ± 0.290.29 ± 0.061.44 ± 0.13
TPN6.21 ± 1.47 b2.93 ± 0.661.19 ± 0.210.22 ± 0.041.30 ± 0.04
F-test*nsnsnsns
ns = not significantly different; * = significantly different at the 95% confidence level. Values in the same column were compared using the LSD test at p < 0.05. Values are presented as the mean ± standard error. Different letters following the mean indicate significant differences according to Duncan’s Multiple Range Test.
Disclaimer/Publisher’s Note: The statements, opinions and data contained in all publications are solely those of the individual author(s) and contributor(s) and not of MDPI and/or the editor(s). MDPI and/or the editor(s) disclaim responsibility for any injury to people or property resulting from any ideas, methods, instructions or products referred to in the content.